Seeing measurements with autonomous, short-baseline...
11
Seeing measurements with autonomous, short-baseline shadow band rangers Guus Sliepen a,b , Aswin P.L. J¨ agers a,b , Felix C.M. Bettonvil a,b and Robert H. Hammerschlag a , a Astronomical Institute, Utrecht University, Princetonplein 5, 3584 CC Utrecht, the Netherlands b Technology Foundation STW, Utrecht, the Netherlands ABSTRACT There is growing interest in measuring seeing at existing and prospective telescope sites. Several methods exist to quantify seeing, one among them is by measuring the scintillation of solar or lunar light using a photodiode. A shadow band ranger (SHABAR) analyses the covariance of the signals from an array of such photodiodes, which allows for the spatial resolution of the index of refraction above the SHABAR device. This allows one to estimate the index of refraction structure parameter as a function of height, C 2 n (h). Although a SHABAR has a limited range compared to a differential image motion monitor (DIMM) or the latest wavefront sensors, the advantage is that it does not need telescope optics to work. A SHABAR device can be made very compact and can operate independent of other instruments. We describe the design of such a SHABAR device with six photodiodes that can operate virtually indefinitely without requiring human intervention. An inversion algorithm is used to convert the raw scintillation signals of the photodiodes to the desired C 2 n (h) profile and a value for the Fried parameter r 0 at height zero. We show that it is possible to perform inversions of 10 s periods in real time on relatively low-end hardware, such as an Intel Atom based computer, which allows the results to be presented live to astronomers, who can use this information to help make decisions about their observation schedule. Keywords: Scintillation, seeing measurements, shadow-band ranger 1. INTRODUCTION As part of the design study for the European Solar Telescope (EST), several instruments have been created and installed recently 1 to measure seeing at existing telescopes and at prospective telescope sites. The Instituto de Astrof´ ısica de Canarias (IAC) has constructed two long-baseline SHABARs, to be placed on La Palma and Tenerife. which measure the seeing in the lower levels of the atmosphere. The University of Utrecht (UU) has been complementing this effort by constructing five short-baseline SHABAR units, which will be placed at existing telescopes on both sites. The advantage of placing SHABARs at existing telescopes is that the seeing measured by such a SHABAR can be compared to seeing as measured by the telescope with other techniques, such as by the descpeckling of science images or with a wide-field wavefront sensor. In the design of the short-baseline SHABAR, we have focused on creating a cost-effective unit that is simple to install, and which does not require a human operator. Furthermore, the design of the scintillometers and data reduction software is such that the results can easily be compared with those of the long-baseline SHABARs, and with the SHABAR units that have been used during site testing campaigns for the Advanced Technology Solar Telescope (ATST). 2 Two of the short-baseline SHABARs have already been installed permanently at the Dutch Open Telescope 5 (DOT) and Swedish Solar Telescope 6 (SST). A third is scheduled to be installed on the GREGOR telescope 7 on Tenerife. A fourth is currently used for testing purposes, and will likely be placed at another telescope on La Palma in the future. A fifth is a mobile unit which, using solar power, can operate completely autonomously in the field for a number of days. Send correspondence to G. Sliepen <[email protected]>, phone: +31 (0)30 253 1617, web: http://dot.astro.uu.nl/
Transcript of Seeing measurements with autonomous, short-baseline...

Seeing measurements with autonomous, short-baseline shadow bandrangers
Guus Sliepena,b, Aswin P.L. Jagersa,b, Felix C.M. Bettonvila,b and Robert H. Hammerschlaga,aAstronomical Institute, Utrecht University, Princetonplein 5, 3584 CC Utrecht, the Netherlands
bTechnology Foundation STW, Utrecht, the Netherlands
ABSTRACTThere is growing interest in measuring seeing at existing and prospective telescope sites. Several methods exist to quantifyseeing, one among them is by measuring the scintillation of solar or lunar light using a photodiode. A shadow bandranger (SHABAR) analyses the covariance of the signals from an array of such photodiodes, which allows for the spatialresolution of the index of refraction above the SHABAR device. This allows one to estimate the index of refractionstructure parameter as a function of height, C2
n(h).
Although a SHABAR has a limited range compared to a differential image motion monitor (DIMM) or the latestwavefront sensors, the advantage is that it does not need telescope optics to work. A SHABAR device can be made verycompact and can operate independent of other instruments. We describe the design of such a SHABAR device with sixphotodiodes that can operate virtually indefinitely without requiring human intervention.
An inversion algorithm is used to convert the raw scintillation signals of the photodiodes to the desired C2n(h) profile
and a value for the Fried parameter r0 at height zero. We show that it is possible to perform inversions of 10 s periods inreal time on relatively low-end hardware, such as an Intel Atom based computer, which allows the results to be presentedlive to astronomers, who can use this information to help make decisions about their observation schedule.
Keywords: Scintillation, seeing measurements, shadow-band ranger
1. INTRODUCTIONAs part of the design study for the European Solar Telescope (EST), several instruments have been created and installedrecently1 to measure seeing at existing telescopes and at prospective telescope sites. The Instituto de Astrofısica de Canarias(IAC) has constructed two long-baseline SHABARs, to be placed on La Palma and Tenerife. which measure the seeing inthe lower levels of the atmosphere. The University of Utrecht (UU) has been complementing this effort by constructingfive short-baseline SHABAR units, which will be placed at existing telescopes on both sites. The advantage of placingSHABARs at existing telescopes is that the seeing measured by such a SHABAR can be compared to seeing as measuredby the telescope with other techniques, such as by the descpeckling of science images or with a wide-field wavefront sensor.
In the design of the short-baseline SHABAR, we have focused on creating a cost-effective unit that is simple to install,and which does not require a human operator. Furthermore, the design of the scintillometers and data reduction software issuch that the results can easily be compared with those of the long-baseline SHABARs, and with the SHABAR units thathave been used during site testing campaigns for the Advanced Technology Solar Telescope (ATST).2
Two of the short-baseline SHABARs have already been installed permanently at the Dutch Open Telescope5 (DOT)and Swedish Solar Telescope6 (SST). A third is scheduled to be installed on the GREGOR telescope7 on Tenerife. A fourthis currently used for testing purposes, and will likely be placed at another telescope on La Palma in the future. A fifth is amobile unit which, using solar power, can operate completely autonomously in the field for a number of days.
Send correspondence to G. Sliepen <[email protected]>, phone: +31 (0)30 253 1617, web: http://dot.astro.uu.nl/
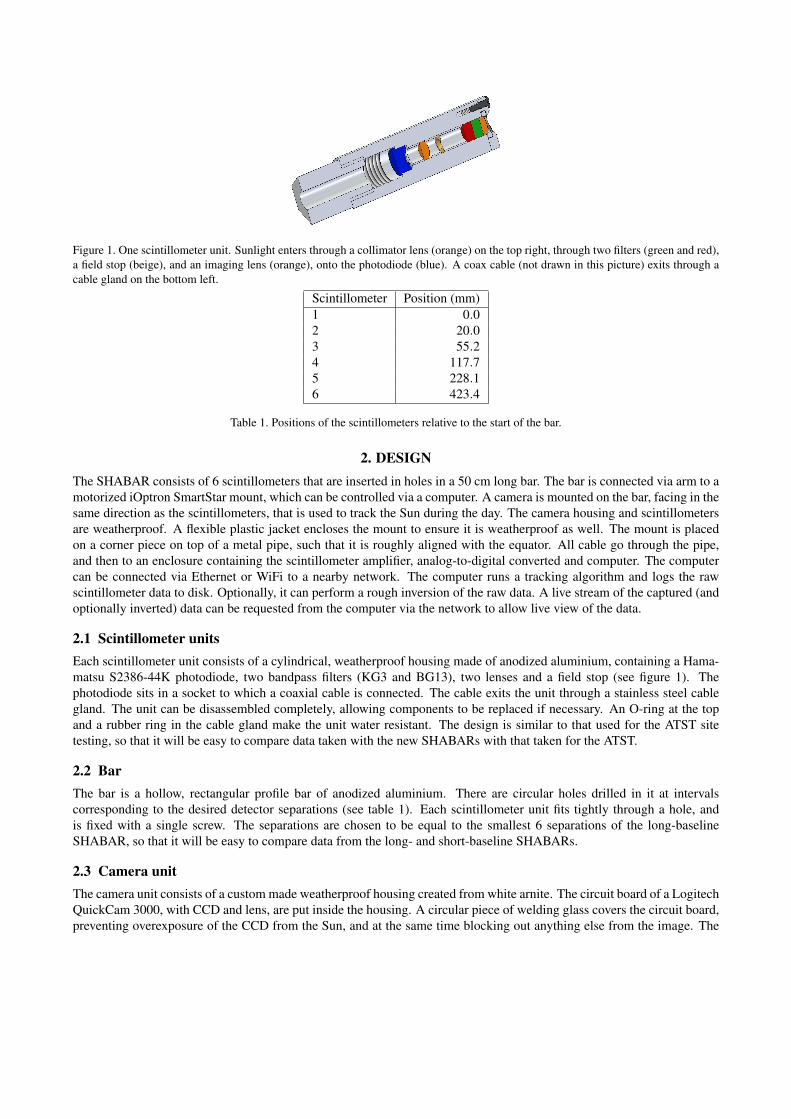
Figure 1. One scintillometer unit. Sunlight enters through a collimator lens (orange) on the top right, through two filters (green and red),a field stop (beige), and an imaging lens (orange), onto the photodiode (blue). A coax cable (not drawn in this picture) exits through acable gland on the bottom left.
Scintillometer Position (mm)1 0.02 20.03 55.24 117.75 228.16 423.4
Table 1. Positions of the scintillometers relative to the start of the bar.
2. DESIGNThe SHABAR consists of 6 scintillometers that are inserted in holes in a 50 cm long bar. The bar is connected via arm to amotorized iOptron SmartStar mount, which can be controlled via a computer. A camera is mounted on the bar, facing in thesame direction as the scintillometers, that is used to track the Sun during the day. The camera housing and scintillometersare weatherproof. A flexible plastic jacket encloses the mount to ensure it is weatherproof as well. The mount is placedon a corner piece on top of a metal pipe, such that it is roughly aligned with the equator. All cable go through the pipe,and then to an enclosure containing the scintillometer amplifier, analog-to-digital converted and computer. The computercan be connected via Ethernet or WiFi to a nearby network. The computer runs a tracking algorithm and logs the rawscintillometer data to disk. Optionally, it can perform a rough inversion of the raw data. A live stream of the captured (andoptionally inverted) data can be requested from the computer via the network to allow live view of the data.
2.1 Scintillometer unitsEach scintillometer unit consists of a cylindrical, weatherproof housing made of anodized aluminium, containing a Hama-matsu S2386-44K photodiode, two bandpass filters (KG3 and BG13), two lenses and a field stop (see figure 1). Thephotodiode sits in a socket to which a coaxial cable is connected. The cable exits the unit through a stainless steel cablegland. The unit can be disassembled completely, allowing components to be replaced if necessary. An O-ring at the topand a rubber ring in the cable gland make the unit water resistant. The design is similar to that used for the ATST sitetesting, so that it will be easy to compare data taken with the new SHABARs with that taken for the ATST.
2.2 BarThe bar is a hollow, rectangular profile bar of anodized aluminium. There are circular holes drilled in it at intervalscorresponding to the desired detector separations (see table 1). Each scintillometer unit fits tightly through a hole, andis fixed with a single screw. The separations are chosen to be equal to the smallest 6 separations of the long-baselineSHABAR, so that it will be easy to compare data from the long- and short-baseline SHABARs.
2.3 Camera unitThe camera unit consists of a custom made weatherproof housing created from white arnite. The circuit board of a LogitechQuickCam 3000, with CCD and lens, are put inside the housing. A circular piece of welding glass covers the circuit board,preventing overexposure of the CCD from the Sun, and at the same time blocking out anything else from the image. The

Figure 2. The camera unit, with the QuickCam board (orange) mounted behind welding glass (green). A USB cable (not drawn in thispicture) exits through the back of the unit.
Figure 3. The iOptron mount (blue) with the scintillometer units (orange) and camera unit mounted on it.
welding glass and circuit board are held in place by a neoprene ring (which keeps the unit water resistant) and a coverplate (see figure 2). The USB cable attached to the circuit board exits through a gland at the back of the unit. The wholecamera unit is rigidly fixed to the bar with two screws, such that the camera is looking in roughly the same direction as thescintillometer units. With the lens that comes with the camera, the field of view of the camera is 54 degrees. The use of aguider camera avoids the need to have to align the SHABAR unit precisely.
2.4 MountIn order to keep the scintillometers pointing at the Sun all the time, a iOptron GotoNova mount is used. This is a small,compact mount which can be controlled via a computer. To protect the mount from humidity and rain, it is covered by aflexible plastic sleeve. The sleeves will be replaced by rubber gaiters that will be fixed to the hour axis of the mount (theblue part in figure 3).
2.5 ElectronicsThe photodiodes are connected to a scintillometer amplifier box designed by the IAC. The photodiodes are driven inphotovoltaic mode. The output signal of each photodiode first goes through a pre-amplification stage with configurable

IAC
Scintillometer
amplifier boxAgilent
U2352A
DAQ
MSI WindBox
Computer
Guider camera
Scintillometers
Mount
CoaxUSB−>RS422USB
USB
Amplified signals
Figure 4. Overview of the electronics used for the SHABAR.
gain. A butterworth filter is then used to split the signal into a high frequency (> 0.1 Hz) AC component and a lowfrequency (< 0.1 Hz) DC component. The high frequency component is then amplified with a fixed gain of 100. The gainof the pre-amplification stage is set so that when the Sun is in zenith on a clear day, the DC output is approximately −7 V.
All the AC and DC outputs of the amplifier box are connected to the analog inputs an Agilent U2352A USB DAQbox. The grounds of the amplifier box outputs are all connected to the analog reference input of the DAQ. This device has16 analog inputs, and has a 16 bit ADC that can sample at more than 1 MHz. The maximum range of the input signal is−10 . . .10 V. All inputs are sampled in short bursts at a rate of 1 kHz, and the data is sent via USB to an attached computer(see figure 4).
The computer is an MSI Wind Box, chosen for its small size and completely fanless operation. It contains an IntelAtom N270 CPU, 1 GB RAM, has a 160 GB harddisk, and has three USB ports, Ethernet and WiFi. A Debian GNU/Linuxdistribution is installed on it.
2.6 TrackingIn order to keep the SHABAR pointing towards the Sun, regardless of any alignment errors, the relative position of the Sunis continuously tracked using the camera attached to the SHABAR. The processing of the camera images is very simple.First, a threshold is applied that rejects any pixels with a low intensity, to remove readout noise. Then, a simple centerof mass algorithm determines the center of the image of the Sun. Although the diameter of the Sun on the CCD is only6 pixels, the lens has been placed such that the image is slightly out of focus, removing aliasing effects, which results in avery good sub-pixel resolution. The effective resolution of the tracker is approximately 10 arcsec.
The tracking software implements a simple servo loop, which tries to keep the Sun in the center of the camera image asclosely as possible. To keep the motion as smooth as possible, only proportional feedback is used with a low gain. To allowfor slight differences in the orientation of the camera with respect to the scintillometers, a configurable offset is applied tothe calculated center of the image. The offset is chosen such that the DC component of the scintillometers is at its peak.
When the Sun is obscured by clouds, the tracking software will estimate the position of the Sun according to the currenttime, assuming a roughty equatorial mounting of the SHABAR.

2.7 Data acquisitionThe raw data from the DAQ is received by the computer. First, the AC components are divided by their respective DC com-ponents, to cancel any differences in the pre-amplifier gain of each scintillometer, and to make the AC signal independentof the mean intensity of the Sun.
Then, the average DC component of each of the 6 scintillometers, and 21 cross-covariance values from the AC signalseach of the possible pairs of scintillometers are calculated for 2 and 10 s periods. The resulting values are stored to disk,along with timestamps. Although the 10 s period has been used by the ATST site testing campaign, experience has shownthat seeing fluctuates at much smaller timescales, and a shorter period is necessary to better compare the results from theSHABAR to that of the results from the wide-field wavefront sensor at the SST.
2.8 InversionTo calculate C2
n profiles and r0 values from the covariances, the same procedure as described by F. Hill et al.3 for the ATSTsite testing is used. The IDL procedures that were included in that report were rewritten in C, to allow the inversion to runon small computers without the need to install an IDL environment.
It is assumed that seeing effects come from a number of thin, turbulent layers at different heights in the atmosphere.Further, it is assumed that the turbulence in each layer can be described with Kolmogorov statistics. A set of Nh = 20heights from 1 m to 20 km is chosen with equidistant steps on a logarithmic scale:
hi = 20000(i−1)/(Nh−1), i = 1 . . .Nh (1)
Then, for each time period, the kernels Ki, j are computed for each height and each of the Nr possible detector separationsr, taking into account the zenith angle ζ from that period:
Ki, j = 0.3832πh2
i sec3 ζ
(a+αhi secζ )2 Q(
r j
a+αhi secζ
), (2)
where a = 0.002 m is the diameter of the photodiode, α = 0.0093 is the width/height ratio of the cone extending from thescintillometer to the Sun, and
Q(s) =∫
∞
0[J1(π f )]2J0(2π f s) f−2/3d f . (3)
Since calculating Q(s) with enough accuracy takes a long time, it has been pre-computed. Unlike the IDL code from RPT-0014, the pre-computation is done with equidistant steps on a logarithmic scale, since the function Q(s) changes rapidlyin the beginning, but becomes increasingly smooth as s increases. When calculating the kernels, linear interpolated valuesfrom the pre-computed function are used.
The kernels describe how much the structure function at a particular height, C2n(h), contributes to the covariance for each
possible detector separation measured at the level of the SHABAR. As can be seen in figure 5, the kernels rapidly convergeat heights greater than 1 km, which limits the effective range of a SHABAR. Given C2
n(h) the modeled covariances BI(r)are given by the following formula:
BI(r) =Nh
∑i=1
C2n(hi) ·K(hi,r) (4)
The Nelder-Mead algorithm, also known as the amoeba algorithm, is then used to determine which values for C2n(h) would
best fit the observed covariances, by minimising the mean squared difference between the measured covariances B j(r) andthe modeled covariances BI(r), given by following function:
Em =1Nr
Nr
∑i=1
(B j(ri)−BI(ri))2 (5)
Since there are more heights than detector separations, a restriction is applied to the possible C2n values: the slope of the C2
ncurve should be smooth on a logarithmic scale. This is implemented by adding another term to the minimization functionused by the amoeba algorithm:
Es =1
2(Nh −1)
Nh
∑i=2
(logC2
n(hi)− logC2n(hi−1)
)2(6)

-50000
0
50000
100000
150000
200000
250000
300000
-1 0 1 2 3 4
K
log(height (m))
Figure 5. The kernels K j as a function of height for each of the detector separations of the UU short-baseline SHABARs.
Figure 6. A SHABAR installed on the DOT, without a protective jacket covering the mount.
The strength of the second term is controlled via the parameter λ , resulting in the following complete minimization func-tion:
E = Em +λEs (7)
In order to ensure that the resulting inversions are reasonably smooth, but that it does not constrict the results so much thatit doesn’t allow situations where most seeing contributions come from a single height, we have set λ = 10−15.
To allow for a live display of the seeing, the amoeba algorithm can be restricted in the number of steps it performs.When there is reasonably good seeing, the changes in seeing from one period to the next are also smaller. The result of theprevious inversion is used as one of the starting point for the next inversion, allowing the amoeba algorithm to approach asolution quicker. However, the size of the initial simplex is reset to that of the expected solution space for each run to avoidhaving to perform many expanding steps before being able to approach the new minimum, and to avoid the possibility thatthe simplex from the previous run is completely contained in a local minimum of the next run.

Figure 7. A SHABAR installed on the SST, on a 2 m high metal tube, with a plastic jacket covering the mount. On the fence to the left,an enclosure is mounted containing all the electronics. Only power and Ethernet cable go into the SST building.

Figure 8. Measured covariances (left) and the resulting inversion (right). The red lines are the values from a certain 10 second period,the grey lines are values from the immediately preceding periods, showing how things vary over time.
0
10
20
30
40
50
10:0010-22
10:1010-22
10:2010-22
10:3010-22
10:4010-22
10:5010-22
11:0010-22
r 0 (
cm)
time
DOTSST
Figure 9. One hour plot of r0 measured at the DOT and the SST.
3. INSTALLATION ON DOT AND SSTAt the moment of writing, two SHABARs are completely finished, and have been installed on top of the DOT and the SST.Since the wind comes mostly from the north, both units have been placed a few meters north of each telescope, so thatthere is a smaller chance that the low level seeing, as seen by the SHABAR, is disturbed by the telescope structure. Bothunits are in operation, and data is being captured and inverted in real time.
4. FUTURE INSTALLATIONSA third SHABAR will be installed on the GREGOR telescope in the summer of 2010. A fourth SHABAR will probablybe installed on one of the telescopes on La Palma by the end of 2010. A fifth, mobile SHABAR is equiped with a largebattery and two solar panels, allowing it to work completely autonomously for several days in the field. A portable mastwill be constructed to allow the mobile SHABAR to be set up in the field above the ground level seeing.
5. FIRST RESULTSThe SHABARs on the DOT and SST have been running since October 15, 2009. However, due to the sensitivity to ice,the SHABARs have been removed for the duration the winter period. An example of the measured covariance as function

0
10
20
30
40
50
10:0010-22
10:1010-22
10:2010-22
10:3010-22
10:4010-22
10:5010-22
11:0010-22
r 0 (
cm)
time
no averaging5 minute averaging
Figure 10. One hour plot of r0 measured at the DOT, with and without the application of a 5 minute sliding average.
-22
-20
-18
-16
-14
-12
08:0010-22
09:0010-22
10:0010-22
11:0010-22
12:0010-22
13:0010-22
14:0010-22
15:0010-22
16:0010-22
17:0010-22
18:0010-22
log 1
0(C
n2 )
time
1 m100 m20 km
Figure 11. One day of C2n(h) measured at the DOT. Each line corresponds to a specific height.

0
10
20
30
40
50
08:0010-22
09:0010-22
10:0010-22
11:0010-22
12:0010-22
13:0010-22
14:0010-22
15:0010-22
16:0010-22
17:0010-22
18:0010-22
r 0 (
cm)
time
DOTSST
Figure 12. One day of r0 measured at the DOT and the SST, showing the trend typical for La Palma.
of detector separation, and the corresponding inversion, has been plotted in 8. A plot of r0 from one hour of October 22has been plotted in 9. As can be seen, there are large variations in the measured seeing over time. Many peaks of r0 fromboth the DOT and SST coincide, suggesting that these large variations are not caused by noise. However, the peak valuesfor r0 are very large, which raised some questions. The r0 values calculated as a result from the DOT despeckle processfor instance, have never been larger than 16 cm. The DOT typically takes bursts of 100 images at 10 Hz, corresponding toa 10 s period, the same as is used for the inversion of the SHABAR data. However, a likely explaination is that there is alarge contribution to telescope seeing from higher layers in the atmosphere that the SHABAR is insensitive to. Comparisonwith results from the wide-field wavefront sensor (WFWFS) at the SST will be done to further investigate this effect, sincethe WFWFS measures differential image motion of 85 subapertures with a field-of-view of only 5.5×5.5 arcsec, allowingit to probe C2
n(h) accurately to much greater heights than a SHABAR.4
A 5 minute sliding average will be applied to the data to get a smoother and more realistic value for r0, as can be seenin figure 10. The averaged results for a whole day are plotted in figure 12. As can be seen, r0 ≈ 10 cm at the start of theday, decreasing to 5 cm around noon, as is typical for La Palma. At the end of the day, r0 increases again. Both SHABARsshow the same daily trend, but there are of course variations between the two telescopes.
6. ACKNOWLEDGEMENTSThe Technology Foundation STW in the Netherlands supports this work financially under grant 06640, in collaborationwith the Institute for Solar Physics of the Royal Swedish Academy of Sciences. This work is also carried out as a partof the Collaborative Project ”EST: The large-aperture European Solar Telescope”, Design Study, funded by the EuropeanCommissions 7th Framework Programme under grant agreement no. 212482.
Technical support comes from the SST, GREGOR and DOT groups. The SST is operated by the Institute for SolarPhysics of the Royal Swedish Academy of Sciences, associated with the Stockholm University. The GREGOR is operatedby the German consortium of the Kiepenheuer Institut fur Sonnenphysik, the Astrophysikalisches Institut Potsdam, theInstitut fur Astrophysik Gottingen and other national and international partners at the Observatorio del Teide (OT) onTenerife. The DOT is operated by Utrecht University at the Observatorio del Roque de los Muchachos (ORM) on LaPalma. All three observatories are operated by the Instituto de Astrofsica de Canarias in Spain. The DOT has been builtby instrumentation groups of Utrecht University, the Central Workshop of Delft University (now DEMO-TU-Delft) andseveral firms with specialized tasks with funding from the Technology Foundation STW. The DOT team enjoys hospitalityat the solar telescope building at ORM of the Royal Swedish Academy of Sciences.

REFERENCES1. Th. Berkefeld, F. Bettonvil, M. Collados, R. Lopez, Y. Martın, J. Penatec, A. Perez, G. Scharmer, G. Sliepen, D.
Soltaua, T. Waldmanna and T. van Werkhoven, ”Site-seeing measurements for the European Solar Telescope”, Astro-nomical Instrumentation, Proc. SPIE 7733-164, 2010.
2. F. Hill et al., ”Site testing for the Advanced Technology Solar Telescope”, Astronomical Instrumentation, Proc. SPIE6267, 2006.
3. F. Hill, R. Radick and M. Collados, ”Deriving C2n(h) from a Scintillometer Array”, ATST Site Survey Working Group
Final Report. ATST Proj. Doc., 14, http://atst.nso.edu/files/docs/RPT-0014.pdf4. G. B. Scharmer and T. van Werkhoven, ”S-DIMM+ height characterization of day-time seeing using solar granula-
tion”, Astronomy and Astrophysics, 513, 2010.5. Dutch Open Telescope, http://dot.astro.uu.nl/.6. Swedish Solar Telescope, http://www.solarphysics.kva.se/.7. GREGOR telescope, http://gregor.kis.uni-freiburg.de/.