Dietary DHA/EPA Ratio Changes Fatty Acid Composition and ...

Faculty of Forest Science
Species Composition and Age Ratio of Rock Ptarmigan (Lagopus muta) and Willow Grouse (Lagopus lagopus) Shot or Snared in The County of Västerbotten: Possible Implementations For Grouse Winter Management
Artsammansättning och åldersfördelning bland skjutna eller snarade fjällripor (Lagopus muta) och dalripor (Lagopus lagopus) i Västerbottens län: möjliga implementationer för vinterförvaltning av ripa
Alisa Brandt
Examensarbete i ämnet biologi Department of Wildlife, Fish, and Environmental studies
Umeå
2016
Species Composition and Age Ratio of Rock Ptarmigan (Lagopus muta) and Willow Grouse (Lagopus lagopus) Shot or Snared in The County of Västerbotten: Possible Implementations For Grouse Winter Management
Artsammansättning och åldersfördelning bland skjutna eller snarade fjällripor (Lagopus muta) och dalripor (Lagopus lagopus) i Västerbottens län: möjliga implementationer för vinterförvaltning av ripa
Alisa Brandt
Supervisor: Gert Olsson, Dept. of Wildlife, Fish, and Environmental Studies
Assistant supervisor: Torleif Eriksson, Länsstyrelsen Västerbotten
Examiner: Therese Johansson, Dept. of Wildlife, Fish, and Environmental
Studies
Credits: 30 HEC
Level: A2E
Course title: Master degree thesis in Biology at the Department of Wildlife, Fish, and
Environmental Studies
Course code: EX0764
Programme/education: Management of Fish and Wildlife Populations
Place of publication: Umeå
Year of publication: 2016
Cover picture: Alisa Brandt
Title of series: Examensarbete i ämnet biologi
Number of part of series: 2016:3
Online publication: http://stud.epsilon.slu.se
Keywords: willow grouse, rock ptarmigan, lagopus, hunt, winter, management, age, species
identification
Sveriges lantbruksuniversitet
Swedish University of Agricultural Sciences
Faculty of Forest Science
Department of Wildlife, Fish, and Environmental Studies

3
Abstract
Hunting has a long tradition in Sweden and is also nowadays well established in society,
provides considerable income through hunting tourism and functions as an important
wildlife management and conservation tool. The most popular game species in the Swedish
mountains are willow grouse (Lagopus lagopus) and rock ptarmigan (Lagopus muta).
Those two species are closely related and managed together as one unit in Sweden but
differ distinct in population size, with rock ptarmigan showing a smaller population size
than willow grouse. Their similar appearance makes it difficult to take preventive actions
like setting different quotas for the two bird species before the hunt. This shows the
importance of bag statistics and the accuracy of the species identification by hunters and
trappers. Identification is assumed to be most difficult during the last months of the hunting
season from January to March. During these last months both species have a white winter
plumage and show only little difference in species specific characteristics but also no direct
visible difference between ages. Therefore a second management issue is the eventuality of
a non deliberate age selective hunting mortality and the eventual divergent impact of
trapping and shooting on this. To investigate these issues shot or snared rock ptarmigan and
willow grouse were examined through the last month of the hunting season. Hunters and
trappers in the area of Saxnäs, Grönfjäll and Tärnaby were visited and more wing and foot
samples could be aquired through hunters sending them by mail. To be able to study the
consistency to the hunters reports, different species identification factors were tested for
their reliability. Additionally the species and age composition, meaning the juvenile (< 1
year) to adult (> 1year) ratio, in the bag of hunters and trappers was analyzed. Bodyweight
and wing length turned out to be a rather unreliable identification method while the
appearance of a black stripe across the eyes, claw colour and the location, in relation to tree
line, of the shot/snared bird seem to be reliable factors. The inconsistency between the
findings of the study and the hunters/trappers reports lays with 2 % at a very low
percentage which reveals that the post-hunting species identification might not be a major
issue during the winter hunt. The age ratio however differs significantly between the bag of
the hunters and the bag of the trappers indicating a difference in the possible impact that
those two hunting techniques may cause on the rock ptarmigan and willow grouse
populations respectively. Assuming the hunt during winter to be an additive mortality
factor, the rock ptarmigan population might be at higher risk to be negatively affected by
the winter hunt than the willow grouse population because of the lower population size and
higher harvest numbers during this time. The results point out the need of further studies
focusing on the effect of the hunt on the age structure of the swedish rock ptarmigan and
willow grouse population. Furthermore it underlines the value of incoorporating hunters
and trappers when designing scientific studies and making management decisions where
there is a gap between science and traditional knowledge.
4
Introduction
Hunting has a long tradition in Sweden and is still nowadays well established in society, it
provides considerable income through hunting tourism, and functions as an important
management and conservation tool (Ericsson & Heberlein 2003,Dahl & Sjöberg 2010). In
the counties of Jämtland, Norrbotten and Västerbotten, a large part of small game hunting
takes place in the state-owned mountain regions. In Västerbotten the hunting season
stretches from the 25th
of august to the 15th
of March. The most popular small game in the
Swedish mountains are willow grouse (Lagopus lagopus) and rock ptarmigan (Lagopus
muta) (Eriksson et al. 2006). These two species also played an important role for the
survival of many small farmers and settlers in Sweden’s northern mountain regions in the
19th
and even in the beginning of the 20th
century (Moritz 1990). Snaring was originally the
most commonly used hunting method but was mainly substituted by shooting with small
caliber rifles and shotguns in the last 60 years. Both methods are however still applied
(Länsstyrelsen 2015).
Rock ptarmigan and Willow grouse are closely related bird species and have comparable
physiology, dietary requirements, predators and also similar appearance (Gutiérrez et al.
2000). During spring, summer and autumn is it possible to see colour differences in the
plumage from rather short distances. However, in the winter, when both species have a
white plumage, the birds must be distinguished in the field by taking habitat preferences
and noise into account, or post-hunting by conducting a close examination of the bird or
performing DNA analysis. In Sweden the population of rock ptarmigan consists of about 40
000 - 80 000 breeding pairs in spring and therefore an estimated autumn population of 175
000 - 350 000 birds. The numbers of willow grouse are estimated to be around 100 000 -
400 000 breeding pairs and corresponding to that an autumn population of 450 000 - 1
750 000 birds (Svenska Jägareförbundet, 2014a, 2014b). These numbers are only rough
estimates but still show that the Swedish population of rock ptarmigan is much smaller than
the willow grouse population, potentially up to ten times lower. In Sweden these two bird
species are managed as one unit, which has of course the practical advantage of an easier
administration and implementation of a single management plan rather than two. On the
other hand this can create problems in respect of the large dissimilarity in population size of
the two species, and species specific ecology. Should the numbers of rock ptarmigan
decrease to a critical level, the management of these birds may need turn into a
conservation issue facing one big problem: The similar appearance of the two bird species,
in particular in winter plumage and to the inexperienced hunter, which will make it difficult
to take preventive actions like setting different quotas for the respectively two bird species
before the hunt.
Today the Swedish rock ptarmigan and willow grouse populations are monitored through
yearly inventories, which take place within the first two weeks of August. These are
conducted through distance sampling (Buckland et al. 1993) along certain line transects in
26 distinct areas in the mountain range. Experienced pointing dogs are used to help
determining the number of grouse observed along these transects. These numbers can then
be used as to obtain information on abundance and reproductive success (Jordbruksverket
2013). The inventory is based on the help of highly experienced voluntary hunters. Another
tool that is used are the bag statistics, the number of shot and snared birds over the season.
The difficulty to take management action before the hunt also underlines the importance of
a post hunting monitoring system. Bag statistics is the most commonly used tool here. This

5
again shows the importance of the accuracy of the species identification by hunters and
trappers. The accuracy of the bag statistics may pose an issue if the distinction between the
two species plays a larger role than assumed. If the true number of shot/snared birds of each
species differs significantly from the reported number it would result in biased bag statistics
and possibly wrong directed management or conservation actions. This can lead to
unknown long-term impacts on the game species and even result in a human-influenced
decrease in one of the populations. When it comes to population estimates the ratio of
juveniles to adults in the harvest is commonly used to obtain an index of production
(Hannon & Martin 2006, Flanders-Wanner & White 2004). So the bag statistics are also
interesting in terms of an eventual non deliberate age selective hunt. Selective management
is known to be very successful to control populations and retain them from declining by
targeting the less productive age classes of a species for the hunt (Solberg et al., 1999,
Hjeljord, 2008). In Scandinavia several cervid species are managed through age selective
hunting but for willow grouse and rock ptarmigan this is difficult to perform since they, in
the field, show less age specific dimorphic differences (Hjeljord, 2008, Sæther et al., 2001).
Especially towards the end of the hunting season, willow grouse, and presumably also rock
ptarmigan, show only little difference in size and plumage characteristic between ages
(Asmyhr et al. 2012). A difficulty arising here is, however, not an intentional age selective
hunt, but the eventuality of a non deliberate age selective hunting mortality. This kind of
selective hunting can occur because of differences in behaviour between age and sex
classes. This may not only have a direct effect on the population growth but might also
influence population dynamics in cyclic species and alter estimates of production and bias
population estimates (Bunnefeld et al. 2009).
The purpose of the present study is threefold.
1. Is there any inconsistency between species reports from hunters and trappers and my own findings?
2. Is there a significant difference between the numbers of rock ptarmigan and willow
grouse in the bag?
3. Is there a significant difference in juvenile to adult ratio in the bag of hunters and
trappers?
The results from this study will be used to create a “Post-Bagging Identification Key”
(PBIK) to facilitate the management of the two species by (more) reliable reports from
hunters/trappers, and to ease species and age identification for hunters inexperienced in the
field. The results would be strengthened by a genetic DNA analyses on species and gender.
However, that tool lies not within the scope or resources of the present study. Nonetheless,
where applicable, tissue samples were collected and stored in appropriate medium to
facilitate such genetic analyses in the future.
With the information acquired in this study, difficulties for the management and probable
solutions will be discussed.

6
Methods
Study area
Sampling was conducted in three different regions in the mountain area of Västerbotten – in
the surroundings of Saxnäs (64°58′ N, 15°20′ E), Grönfjäll (65°16′ N, 15°40′ E) and
Tärnaby (65°43′ N, 15°16′ E) (Fig 1). These areas were chosen beforehand based on high
hunting/snaring activity in the previous years.
Figure 1 Map of Västerbotten county showing the sampling sites. Original map from:
http://www.lycksele.se/ templates/Page.aspx?id=695, 18.03.2015.
The sampling was chosen to be conducted in winter, during the end of the hunting season,
for two different reasons. With progression of the hunting season it is getting more difficult
to distinguish between the two bird species in regard to their plumage. Therefore the
identification, if it turns out to be an issue at all, is expected to be a bigger problem during
the winter hunt than the autumn hunt. Secondly there are assumed to be two timeframes
throughout the year, which are more important than others for the development of the
population. The first one is within the first two weeks of the chicks´ lives where weather
conditions and predation are known to be the most important factors for their survival. The
second one is in the beginning of autumn where mortality, especially for dispersing young
birds, increases due to migrating raptors and the start of the hunting season (Kobayashi &
Nakamura, 2013; Smith, A., Willebrand, 1999).
During winter birds of the family Tetraonidae are expected to have a relatively high
survival rate compared to the autumn (Caudill & Resources, 2014; Keppie, 1979;
Sandercock, B.K., Martin, K., Hannon, 2005), juveniles are assumed to have similar natural
mortality rates as adults (Hannon & Martin, 2006) and food or disease does not seem to be
a limiting factor (Bergerud, 1988). In this study it is suggested that the end of the hunting
season can be a third important event. The hunt during that time is directed towards the
population which already survived the largest part of the winter and will most likely
represent the breeding population in the following summer. An eventual non deliberate age

7
selective hunting mortality could have a direct influence on the breeding population of the
respective year.
Classification in the two groups of trappers and hunters will be made since knowledge
about the different effects can be crucial to improve the management if a decrease,
particulary in rock ptarmigan population size, can be observed. Shooting is characterized
through searching actively for the animal in the landscape Snaring is a much more passive
way which involves strategic planning before setting up the snare. Since these methods
differ considerably in their accomplishment it is reasonable to assume that they might also
have a different impact on the different species or on different age classes.
To identify the species and on creating a PBIK, five probable determination factors will be
tested to try to evaluate whether they are a reliable identification method or not. Those
factors are either (1) known by the literature, or (2) suggested by very experienced hunters
and trappers, or (3) to be evaluated and tested in relation to the other variables.
Plumage (1) , claw colour (2), proximity to the tree line at position of bagging (1,2),
bodyweight (3) and wing length (3). A genetic DNA analyses on species would promptly
provide the answer to respectively variable’s reliability but as mentioned, such analyses lies
not within the scope or resources of the present study.
Sampling
Sampling was conducted in two different ways. For the first part all measurements were
taken directly from the shot/snared birds through personal contact with hunters/trappers.
The bagged birds from nine different hunters and five different trappers were examined
during this time. This resulted in a sample size of 105 shot and 219 snared birds. Trappers
were categorized as “hunter” in cases where they shot birds as well.
The presence or absence of black feathers forming a stripe across the eyes, which is
characteristic for male rock ptarmigan, has been noted (Fig. 2) (Hörnell-Willebrand & Dahl
2004, Steen 2004). Pictures of every bird were taken to later on be able to analyze the
factor claw colour.
Figure 2 Rock ptarmigan with characteristic black stripe across the eyes. Picture taken by
Alisa Brandt.

8
The approximate altitude and proximity to the tree line (below, at, or above) where the bird
was shot/snared was recorded. “Below” was defined as an area clearly surrounded by trees,
“at” as the transitional zone from where trees grow more sparsely until the area of no tree
growth and “above” was than defined as the area clearly beyond this area where there is no
tree growth anymore.
All trappers received prepared tags beforehand which were attached to each bird bagged
and had to be filled out with information regarding species, date of catch and location.
Hunters were asked about bagged birds´ species, altitude and proximity to the tree line and
date together with location when shot.
During the inspection of the birds, bodyweight was recorded and the amount of food in the
crop, a pouch in a bird’s gullet where food is stored and prepared for digestion, was
estimates (empty, half full, or full). Studies on feeding habits of willow grouse showed that
they can accumulate large quantities of food in their crops during winter days (Irving, West,
& Peyton, 1967). Therefore 50g of the total bodyweight were subtracted when the crop was
completely full, 25g when it was estimated to be half full and none if the crop was empty
(Hörnell-Willebrand pers. comm.).
Wing length was taken from the outside bend of the carpal joint in a straight line to the tip
of the longest primary (Bergerud et al. 1963). Measurements were to the nearest millimeter
(Fig. 3).
Figure 3 Obtaining grouse wing length from the outside bend of the carpal joint to the tip
of the longest primary. Picture taken by Alisa Brandt.
Furthermore “adults” (>1 year) and “juveniles” (<1 year) were to distinguished by their
pigmentation, quality and roundress of the tips of primaries 9 and 10. The primary 9 of a
juvenile bird shows black pigmentation (Fig. 4) and is less rounded than those of adult
birds. The overall quality of this feather is also more “worn” in juveniles (Bergerud et al.
1963, Hörnell-Willebrand, 2005). This aging method has been widely used in science and
management (e.g. Myrberget 1974, 1984, Pedersen 1984, Steen et al. 1988, Rørvik et al.
1998, Svenska Jägareförbundet 1996) and is based on the timing of molt of the juveniles,
meaning they haven´t shed primary 9 yet during the months the present study was
conducted.

9
Figure 4 Typical juvenile (<1 year ) primaries with pigmentation on the tip of the second
uppermost feather (left) and typical adult (>1 year ) primaries without pigmentation (right).
Pictures taken by Alisa Brandt.
Additionally from 174, out of the 324 inspected birds one toe was clipped and preserved in
95 % Ethanol to facilitate further DNA analysis on species and sex. Additionally to this
data collection, 35 more wings and 56 foot samples of shot birds could be acquired from
another five hunters by mail. For most of those birds, information on altitude, proximity to
the tree line when bagged, and presence or absence of a black stripe across the eyes could
be acquired. Furthermore wing length was measured and age determined. From each of the
56 feet one toe could also be preserved in 95 % Ethanol.
All samples came from birds shot/snared between the 15th
of February and the 15th
of
March 2015
Species identification
Black stripe across the eyes
The first and the most visible physical attribute for rock ptarmigan is the characteristic
stripe across the eyes. No known observations or published literature supports that willow
grouse shows this attribute; therefore this parameter alone can be used as a reliable
identification method for rock ptarmigan.
Claw colour
Based on personal observations and information from very experienced trappers and
hunters, difference in claw colour was also tested. Rock ptarmigan are assumed to have
predominantly black claws while willow grouse are assumed to have predominantly white
coloured claws. A blind test with 20 participants was conducted to evaluate how obvious
the color patterns are for inexperienced people and therefore to what degree this
identification factor can actually be applied for identification of the species. Before the test
every person got an information sheet with three different claw colour categories and
information which features to look for (Figure 5,6 and 7). All participants first had to group
the 56 feet that were sent in by mail into the three different categories to get comfortable
with these categories. After this they were asked to look at 315 pictures of willow grouse
and rock ptarmigan feet that were taken during the fieldwork and categorize them as well.
Pictures that were too blurred or where the claws could not be seen sufficient enough were
taken away. Pictures were given randomly generated numbers between 1 and 315 to avoid
any kind of visible pattern.
10
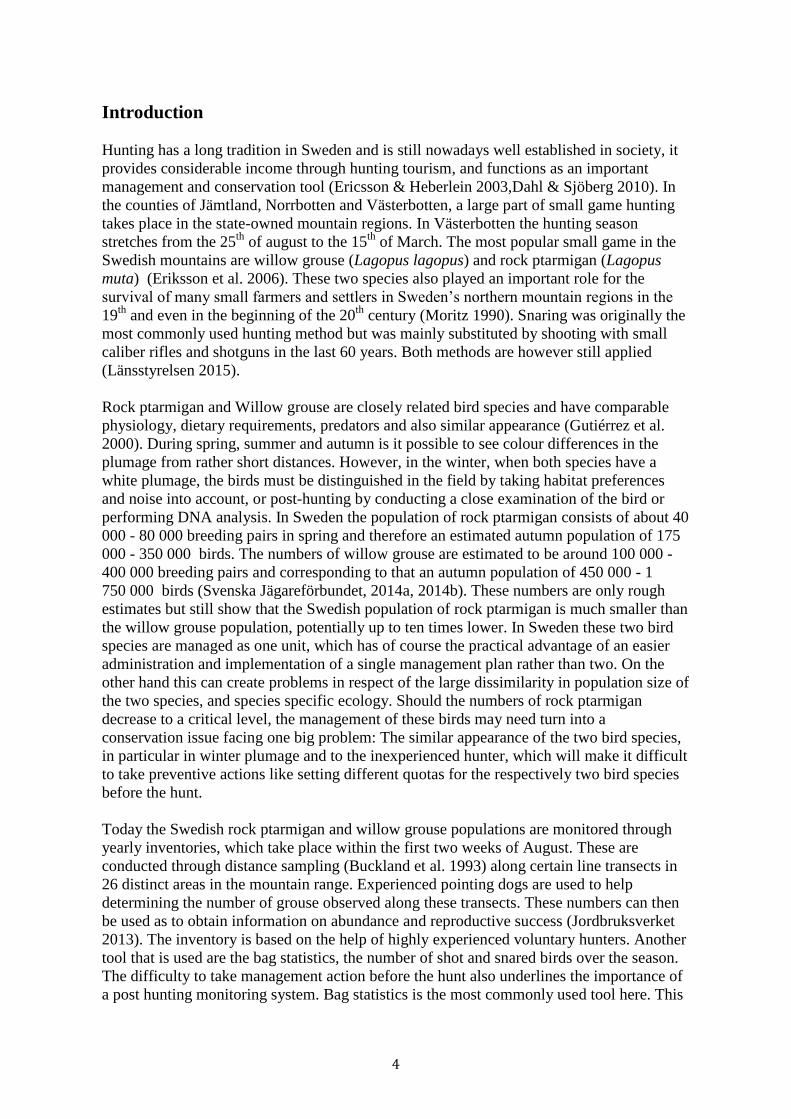
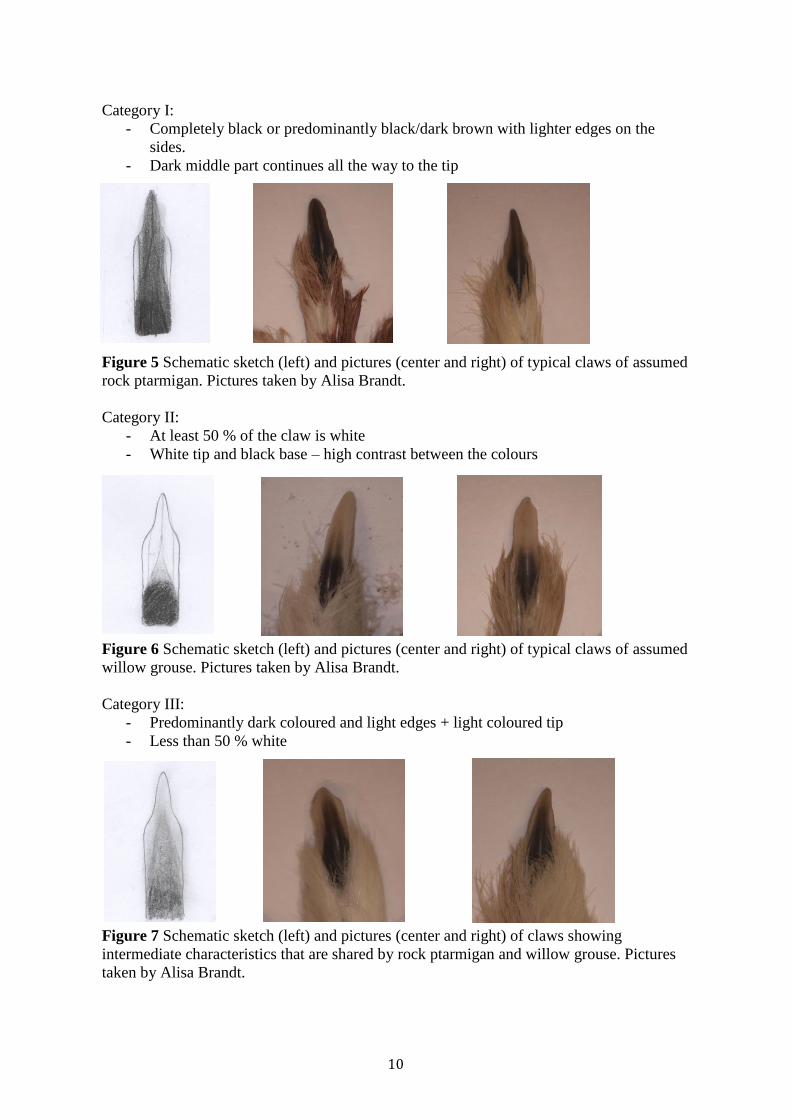
Category I:
- Completely black or predominantly black/dark brown with lighter edges on the
sides.
- Dark middle part continues all the way to the tip
Figure 5 Schematic sketch (left) and pictures (center and right) of typical claws of assumed
rock ptarmigan. Pictures taken by Alisa Brandt.
Category II:
- At least 50 % of the claw is white
- White tip and black base – high contrast between the colours
Figure 6 Schematic sketch (left) and pictures (center and right) of typical claws of assumed
willow grouse. Pictures taken by Alisa Brandt.
Category III:
- Predominantly dark coloured and light edges + light coloured tip
- Less than 50 % white
Figure 7 Schematic sketch (left) and pictures (center and right) of claws showing
intermediate characteristics that are shared by rock ptarmigan and willow grouse. Pictures
taken by Alisa Brandt.

11
Category I stands for assumed rock ptarmigan, Category II for assumed willow grouse and
Category III cannot be surely assigned to one of the two species. Birds that were put in
category I or II from at least 95 % of the participants were with high certainty considered
rock ptarmigan or willow grouse. For further analysis regarding species occurrence, all
birds that could be identified by a black stripe or claw colour were used. This builds up on
the assumptions that this part of the dataset is representative for the whole dataset.
Tree line
Several scientific publications, as well as hunters and trappers themselves, report that rock
ptarmigan occur on higher altitudes above the tree line while willow grouse often stay in
more forested areas at or below the tree line (e.g. Cramp & Simmons 1977, Svensson &
Grant 1999). For the factor tree line, the number of birds snared or shot below, at, or above
was calculated and compared. Tree line was chosen above altitude since the location of the
tree line depends on other, abiotic factors such as local climate or topography, e.g. north,
east, south or west facing slope, and differs therefore locally. This makes tree line be a
more reliable and useful factor than altitude.
The birds that could be identified through this parameter were added to the birds identified
through black stripe and claw colour and used for further analysis regarding bodyweight
and wing length. This again builds on the assumption of this part of the data being
representative for the whole dataset.
Bodyweight
Rock ptarmigan is known to be of slightly less weight than willow grouse (Johnsgard
1983), therefore the individual specimen´s weight should also differ according to assumed
species. To determine whether this parameter is a reliable identification method or not, the
mean values of the corrected body weights of rock ptarmigan and willow grouse were
tested for a significant difference through a Wilcoxon Rank Sum test. For this analysis
corrected bodyweight, adjusted in respect of crop content, was used.
The ecological importance of the results was measured by effect size, which was evaluated
through calculating the percentage of overlapping data, standard deviation and variance.
Effect size assesses the magnitude or strength of scientific findings. This important
information cannot be acquired by only focusing on a certain p-value (Durlak 2009,
Thompson 2006, Volker 2006). The variance gives a measure of how the data distributes
itself around the mean. Standard deviation is important in terms of uncertainty. The smaller
the standard deviation, the lesser the uncertainty and thus the higher the reliability of the
results.
Wing length
Differences in wing lengths were tested for significance through a t-test. Additionally the
percentages of overlapping data, standard deviation and variance were calculated.
Hunters/Trappers reports
All birds that could be identified with a high certainty were compared to the reports of the
hunters and trappers themselves and the percentage of mismatches was calculated. The
results were also split between hunters and trappers. Additionally, to visualize the hunters
and trappers bagging locations, the difference in location between the two methods of
hunting was analyzed by calculating the percentage of snared and shot birds at the different
locations, meaning, below, at, or above the tree line.

12
Age ratio
A proportion test was used to detect any age selection between the different methods of
hunting. The juvenile to adult ratio in the bag of the hunters was compared to the bag of the
trappers. All tests were conducted for rock ptarmigan and willow grouse separately and
combined.
Species composition
The number of rock ptarmigan and willow grouse in the bag of the hunters, the trappers as
well as combined was calculated and the difference statistically tested through a proportion
test.
Statistical Analyses
Analyses were performed using the statistic programs R and JMP (RStudio version
0.96.331, R Development Core Team, 2012; JMP version 11.0, SAS Institute Inc. 2013)
and Excel (2010 Microsoft Corporation). The more powerful parametric t-test was used for
analysis regarding wing length but had to be replaced with the non-parametric alternative,
the Wilcoxon Rank Sum test, for analyses regarding bodyweight since the assumptions of
normal distribution and equal variances were not met.
Results
Black stripe across the eyes
Out of 381 birds 100 could be identified as rock ptarmigan through the appearance of a
black stripe across the eyes.
Claw colour
Out of 315 birds 119 (38 %) could surely be placed in Cat. I or II by at least 95 %
accordance among the participants. Those birds could be determined as rock ptarmigan or
willow grouse.
To strengthen the results of the factor claw colour, the findings were compared to the
identification results of the black stripe factor. None of the birds put into category II
showed a black stripe across the eyes. All birds with black stripes were either surely
categorized as I or put into category III. A total of 191 birds could be identified through the
black stripe and/or the claw colour. These 191 birds were used for the following analysis
regarding altitude and tree line.
Tree line
The majority of willow grouse (55 %) occurred at the tree line, 45 % below, and none
above the tree line, while 50 % of all rock ptarmigan occurred above, 50 % at, and none
below the tree line. Due to this result, 63 additional specimens, that either occurred above
or below the tree line, could be identified as rock ptarmigan or willow grouse. A total of
254 birds were used in the subsequent analyses regarding bodyweight and wing length.
Bodyweight
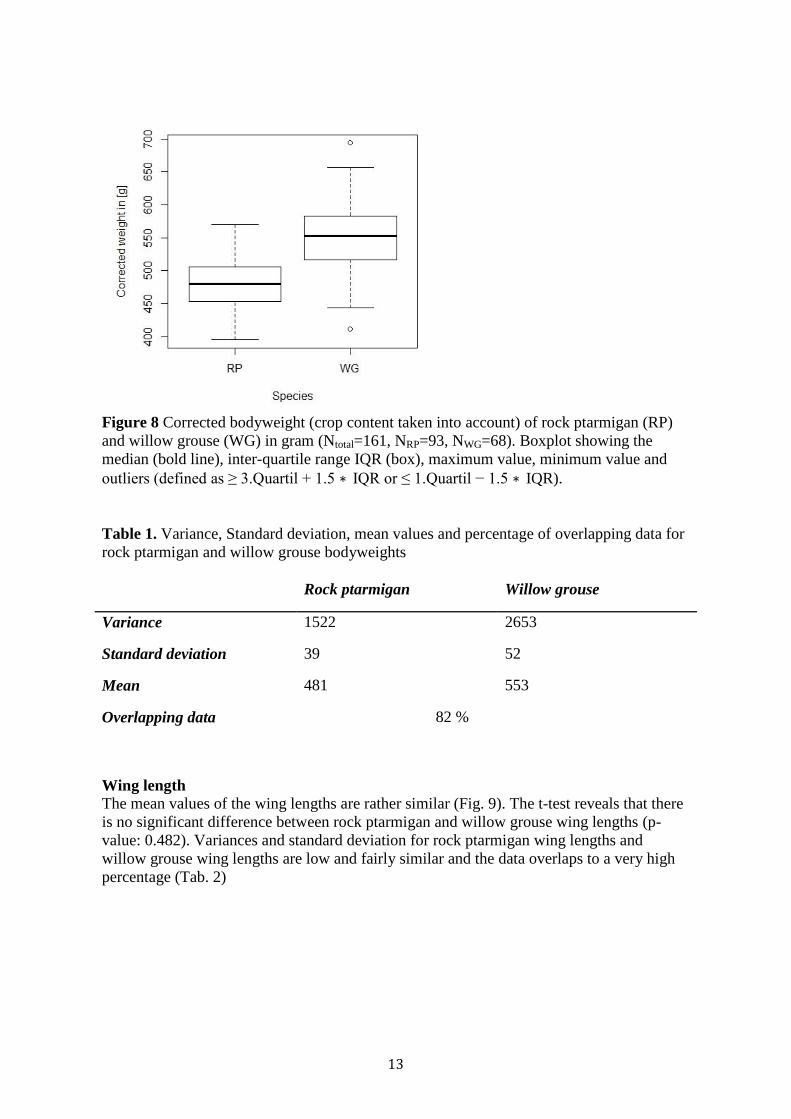
The Wilcoxon Rank Sum test showed that the difference in mean bodyweight is significant
with a p-value of <0,001 (Fig. 8). Variance and Standard deviation in rock ptarmigan and
willow grouse body weights are high and differ from each other. Furthermore is the
majority of the data overlapping (Tab. 1).
13
Figure 8 Corrected bodyweight (crop content taken into account) of rock ptarmigan (RP)
and willow grouse (WG) in gram (Ntotal=161, NRP=93, NWG=68). Boxplot showing the
median (bold line), inter-quartile range IQR (box), maximum value, minimum value and
outliers (defined as ≥ 3.Quartil + 1.5 ∗ IQR or ≤ 1.Quartil − 1.5 ∗ IQR).
Table 1. Variance, Standard deviation, mean values and percentage of overlapping data for
rock ptarmigan and willow grouse bodyweights
Rock ptarmigan Willow grouse
Variance 1522 2653
Standard deviation 39 52
Mean 481 553
Overlapping data 82 %
Wing length
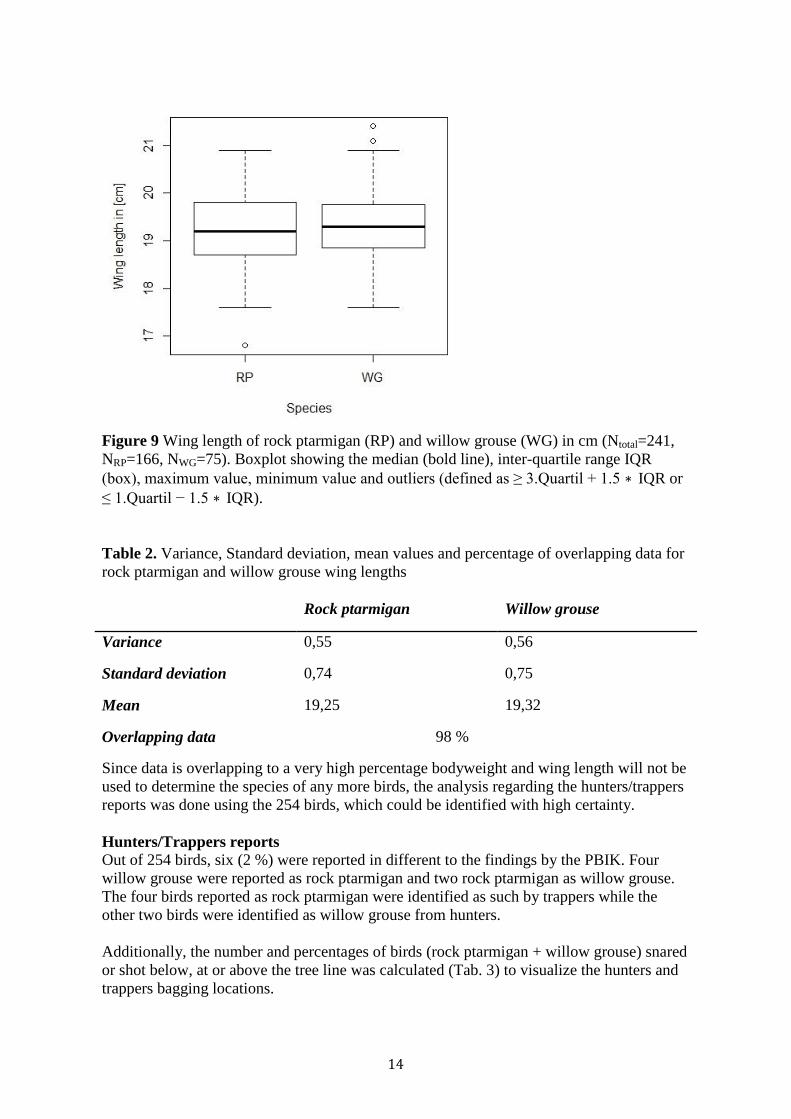
The mean values of the wing lengths are rather similar (Fig. 9). The t-test reveals that there
is no significant difference between rock ptarmigan and willow grouse wing lengths (p-
value: 0.482). Variances and standard deviation for rock ptarmigan wing lengths and
willow grouse wing lengths are low and fairly similar and the data overlaps to a very high
percentage (Tab. 2)
14
Figure 9 Wing length of rock ptarmigan (RP) and willow grouse (WG) in cm (Ntotal=241,
NRP=166, NWG=75). Boxplot showing the median (bold line), inter-quartile range IQR
(box), maximum value, minimum value and outliers (defined as ≥ 3.Quartil + 1.5 ∗ IQR or
≤ 1.Quartil − 1.5 ∗ IQR).
Table 2. Variance, Standard deviation, mean values and percentage of overlapping data for
rock ptarmigan and willow grouse wing lengths
Rock ptarmigan Willow grouse
Variance 0,55 0,56
Standard deviation 0,74 0,75
Mean 19,25 19,32
Overlapping data 98 %
Since data is overlapping to a very high percentage bodyweight and wing length will not be
used to determine the species of any more birds, the analysis regarding the hunters/trappers
reports was done using the 254 birds, which could be identified with high certainty.
Hunters/Trappers reports
Out of 254 birds, six (2 %) were reported in different to the findings by the PBIK. Four
willow grouse were reported as rock ptarmigan and two rock ptarmigan as willow grouse.
The four birds reported as rock ptarmigan were identified as such by trappers while the
other two birds were identified as willow grouse from hunters.
Additionally, the number and percentages of birds (rock ptarmigan + willow grouse) snared
or shot below, at or above the tree line was calculated (Tab. 3) to visualize the hunters and
trappers bagging locations.

15
Table 3. Number of shot or snared birds below, at, or above the tree line. The percentage in
brackets is the proportion of the total amount of either shot or snared birds.
below at above
Snared 35 (16 %) 184 (84 %) 0 (0 %)
Shot 10 (7 %) 24 (17 %) 107 (76 %)
Age ratio
The results from 2015 point out that the bag statistics of the trappers show a significant
higher juvenile to adult ratio than the bag statistics of the hunters for willow grouse and
rock ptarmigan combined (Table 4). Furthermore it can be seen that willow grouse show in
all cases a higher juvenile to adult ratio than rock ptarmigan. This difference is however
only statistical significant for shot and snared birds pooled and for snared birds, but not for
shot birds (Tab. 5).
Table 4. DATASET I - Different juvenile to adult ratios for rock ptarmigan (RP) and
willow grouse (WG) in the hunters and trappers bag as well as combined and respective p-
values from the proportion test. * is indicating a statistical significance (significance level α
= 0.05).
Snared Shot p-value (proportion
test)
RP 1,41 1,73 0.675
WG 5,30 3,00 0.726
RP+WG 3,13 1,87 0.042*
Table 5. DATASET I - Different juvenile to adult ratios for rock ptarmigan (RP) and
willow grouse (WG) in the hunters and trappers bag as well as combined and respective p-
values from the proportion test. * is indicating a statistical significance (significance level α
= 0.05).
WG RP p-value (proportion
test)
Snared 5,30 1,41 0.004*
Shot 3,00 1,73 0.627
Shot+snared 4,77 1,61 0.002*

16
Species composition
The proportion test reveals a significant difference in species composition for shot birds as
well as for shot and snared birds pooled but not for snared birds (Table 6).
Table 6. Percentage of shot/ snared rock ptarmigan (RP) and willow grouse (WG) in the
bag and p-values from the proportion test, * is indicating a statistical significance
(significance level α = 0.05).
RP WG p-value (proportion
test)
Snared 46 54 0,403
Shot 90 10 < 0,001*
Shot+snared 68 31 < 0,001*
Discussion
The rock ptarmigan and willow grouse hunt in the Swedish mountain regions is an
important tradition for many Swedes and also a considerable source of income through
hunting tourism. On the other hand hunt also poses one of the most important mortality
factors for these birds (Bergerud, 1988). To keep a balance between these two factors a
well-functioning management system is necessary. The most important components are the
hunters and trappers themselves, which are reporting in the species shot or snared and
therefore make it possible to have an overview over the amount of harvested animals. This
study is suggesting some variables, which can be useful regarding species identification
when DNA analysis is not an option. In the following text these factors will be discussed in
detail to evaluate their reliability leading to the discussion of the age ratio and species
composition results.
Black stripe and claw colour
The black stripe was used as a definite factor to determine the species rock ptarmigan.
Since rock ptarmigans showing the black feather pattern across the eyes are assumed to be
males, the dataset including the birds identified through this and claw colour, which was
used as a basis for further analyses, consists to a higher proportion of male birds than
female birds. An influence on the outcome of the results regarding the factor tree line
would however be possible if males and females are separated during the end of the hunting
season, meaning that they place themselves at significantly different altitudes, respectively
above and below the tree line. Gruys (1993) showed for example that his studied population
of willow grouse partially segregated by sex during the beginning of winter. Since the
timeframe of the present study is at the end of winter and close to the onset of the mating
season (Mortensen et al. 1985) it is assumed that there is no significant separation between
sexes. Previous studies also show that wing length differs less than 1% between females
and males of the three bird species rock ptarmigan, white-tailed ptarmigan, willow grouse
of the genus Lagopus (Bergerud et al. 1963, West & Meng 1968, Wilson & Martin 2011,
Nielsen et al. 2014). Bodyweight in willow grouse can differ between sexes from 5-15%,
depending on age (Moss 1983). This difference is comparatively low and in his study Moss

17
(1983) states that it is common to pool the weights of female and male birds for further
analyses of those species that differ less than 20% in bodyweight between sexes. Due to the
similarities of rock ptarmigan and willow grouse this was assumed to also be the case for
rock ptarmigan. Therefore in the present study it was assumed that a normal distributed sex
ratio in the data set would reveal comparable results.
The claw colour blind test showed that 38 % of the birds could be classified by this method.
This may appear low but several factors need to be taken into account. Firstly the
participants, most if not all with low or no experience of this, had to categorize the claws by
only looking at pictures. This can alter the outcome of the test as compared to if they could
have looked at the actual claws. Nuances that would be visible if directly looking at the
claws might not be visible anymore on a picture. Secondly, the natural variation of the
manifestation of the different claw colours differs between individual specimens. The
appearances of the characteristic pigmentation pattern might vary with environment but
also age and sex of the birds. And lastly, another aspect is the hybridization of the two bird
species. Quintela et al. (2010) showed in their study that hybrids between rock ptarmigan
and willow grouse do occur and that an increase in hybridization is likely due to an increase
in habitat overlap caused by warmer climate. Those individuals could show differences in
the peculiarity of certain features, like claw colour. Also here future studies using DNA
analyses could help to explain claw colour variations.
The evaluation of the test showed that none of the birds with black stripes were identified
as willow grouse and it was a very low percentage of the claws (4 %) that were categorized
as I (assumed rock ptarmigan) as well as II (assumed willow grouse) from different test
persons. Meaning that in 96% of the time participants were either sure about category I
(assumed rock ptarmigan) or had doubts whether it is category I or III but did not consider
II. The same applies to assumed willow grouse. This shows that the chance to mistake a
rock ptarmigan for a willow grouse and the other way around is little, which is the strength
of this method.
Tree line
In the present study tree line could be used as a reliable identification factor. However these
results should not be generalized. The data used is limited in time of sampling since it was
obtained from birds bagged during the months February and March. Hunters and trappers
themselves also reported that weather conditions might alter the accuracy of this variable.
On days with very harsh conditions and strong wind rock ptarmigan, as was reported by
experienced hunters/trappers, were observed to go down in more forested areas while
willow grouse might go a little above tree line if the weather is very favorable. Several
hunters and trappers suggested that it might also depend on the time of the day – rock
ptarmigan might seek shelter at or below the tree line during nighttime.
Body weight and wing length
Rock ptarmigan is known to be slightly smaller than willow grouse (Johnsgard 1983), but it
varies between specimens. Specimen´s weight development may also be influenced by
habitat and food availability (Erikstad 1979). The data shows that there is a significant
difference between the average bodyweights of rock ptarmigan and willow grouse. The

18
strong statistical significance in the present study finds however little ecological relevance.
It shows that rock ptarmigan weighs in average less than willow grouse but it cannot be
used to determine as to species individual specimens. The variance of bodyweights for rock
ptarmigan as well as for willow grouse is rather large where 82 % of the data are
overlapping.
The wing length measurements revealed no significant difference between the two species
and showed an overlap to even higher extent than bodyweight did. This result was rather
unexpected since it reveals that although willow grouse are in general heavier it does not
mean that their wings are also larger as compared to rock ptarmigan. This implies that
comparatively to their bodyweight, willow grouse seems to have proportionally shorter
wings than rock ptarmigan. Since the variation and overlap of the data is, as bodyweight,
very large it should not be used as a reliable identification method. Jakubas et al. (2014)
point out that environmental factors in general seem to play an important role regarding
body size measurements (bodyweight, wing length). A possible explanation why these
body size measurements differ between rock ptarmigan and willow grouse might be the
necessity of different flight maneuvers. Since willow grouse’s main habitat is found at or
below the tree line, there would in many instances be rather little space when trying to
escape from a predator. Therefore they need to be able to get into a flying position very
quick and maneuver around obstacles on escape routes. Rock ptarmigan on the contrary
lives in much more open habitat. In case of danger they have much more space but may
also have to fly a longer distance, and/or faster to find shelter from a predator. Larger
wings, in relation to bodyweight, might benefit rock ptarmigan since they could reach
higher speed on a longer flight (Norberg 1995). Willow grouse on the other hand might
have more advantage of shorter wings since quick, short and precise flight maneuver are
necessary. More and detailed information on this topic would be required to test this
hypothesis.
The weakness of the species identification factors is clearly the missing DNA analysis. The
factors tree line, bodyweight and wing length are based on the assumption of reliability
regarding the two factors black stripe and claw colour. The black stripe has already in the
past proven to be a reliable identification factor for rock ptarmigan (Weeden 1964). The
claw colour is on the other hand a new attribute, which, until now, did not gain much
attention in science. Therefore comparison with the results of a DNA analysis can be of
great value for the future management and conservation of rock ptarmigan and willow
grouse. The claw colour is on the contrary to bodyweight or wing length an observational
factor which makes it much more applicable in the field. Claw color observations might be
a great help to inexperienced hunters and could therefore help to improve the accuracy of
the bag statistics, which are assumed to be biased during the autumn hunt. Even though the
high variation in the peculiarity of the claw colors makes it impossible to identify every
individual, could it nevertheless be possible to identify a fair amount of the birds. Therefore
it can also be interesting for future studies on rock ptarmigan and willow grouse since it
could to a certain extent, if it turns out to be reliable enough, be an alternative to the much
more expensive DNA analyses.
Hunters/Trappers reports
Previous unpublished studies showed that species misidentification of rock ptarmigan and
willow grouse during the autumn hunt may pose a bigger problem in management than

19
previously assumed (Hörnell-Willebrand pers. comm.). Therefore it was expected to be
even less accordance regarding the species identification during the winter hunt since it is
more difficult to distinguish between the two bird species in winter plumage, with
progression of the hunting season. The results showed that the percentage of differently
reported birds is low (2 %). Of these six birds reported in differently four birds were from
trappers and two birds from hunters. This low number may not make it meaningful to
investigate further on the difference between the two groups, hunters respectively trappers,
as determining these two game birds to species.
Before 1993 it was less than 1000 people per year hunting rock ptarmigan and willow
grouse in the Swedish mountain areas. In 1993 changes in the law made it possible for the
public to access hunt on the state owned land in the mountain areas. After this the hunting
pressure on the two game species increased drastically due to much more hunters and
discussions on the vulnerability of the birds towards a higher hunting pressure started to
appear. Nevertheless the law experienced another change in 2007, which finally also made
it possible for EU citizens to hunt small game on the state owned land. The Swedish Board
of Agriculture (Jordbruksverket) conducted a study on the effects of the new system
regarding the small game hunt on the state owned land in the mountain regions
(Jordbruksverket 2013). It was shown that especially during the first two weeks of the
hunting season the proportion of non-Swedish hunters was very high. Furthermore is the
current management system based on the selling of three different kinds of hunting permits.
Every hunter, also non-Swedish EU citizens, can purchase day permits. Day hunting
permits can be bought no more than five days in advance and for no more than five
consecutive days. Hunters that are permanently resident in upland municipalities/counties
can purchase municipal annual permits or county annual permits for small game hunting.
The Swedish Board of Agriculture also calculated the percentage of the type of hunting
permits activated during the first week of hunt. It showed that throughout the last years the
majority of hunters hunting within the first week did so on day permits. Given the
difference between seasons, e.g. the physically challenging hunting practice on snow, one
can assume there is less hunting tourism during the winter than during early autumn.
Analyses from the hunting season 2014/2015 revealed indeed that the percentage of foreign
hunters is considerably lower during the last month of the hunting season compared to the
first month (County board of Västerbotten).
This leads to the impression that the high accordance between the results of this study and
the hunters’ reports from the winter/spring hunt 2015 might be based on the fact that it is
predominantly experienced local hunters and trappers during this time. To many of the
trappers visited in the present study, the snaring was part of an old tradition and had been
carried out for several years. Therefore they are assumed to be very skilled hunters that
have a lot of knowledge regarding the two species rock ptarmigan and willow grouse.
During early autumn, when hunting tourism constitutes a substantial part of the ongoing
hunt, there might be more inexperienced hunters that are not familiar with the local fauna
and are only in the mountain regions for few days a year. This lack of experience may lead
to a higher discordance regarding species identification. The results point out that the
species identification may pose a bigger problem for inexperienced hunters during autumn
than to experienced ditto during winter.

20
Age ratio
The analysis showed a higher juvenile to adult ratio in the bag for willow grouse than for
rock ptarmigan for snared and for shot and snared birds pooled. This result might suggest
different behavior of juvenile willow grouse than juvenile rock ptarmigan making them
more vulnerable towards especially snaring. It could on the other hand also simply be
grounded on a higher reproduction success for willow grouse in the summer 2014. To
clarify this, further information on the reproductive success of the two species in 2014
would be needed.
The statistics also showed a significantly lower juvenile to adult ratio for the shot birds than
for the snared birds. This can be an indicator for a more towards juveniles directed hunt by
the snaring technique. There are several possible explanations for these findings. Juvenile
birds are less experienced and thus perhaps less cautious than adult birds and could
therefore be more likely to be trapped. Another explanation could be a higher dispersal of
juvenile individuals, meaning a higher rate of movement. Most dispersal in vertebrate
species occurs prior the first breeding attempt meaning that adult individuals show less
extensive dispersal (Greenwood and Harvey 1982, Cockburn 1992). The movement over
larger areas and variation in habitat use by juvenile grouse during their first fall and winter
has also been described by Hines (1987), Gardarsson (1988) and Gratson (1988). Higher
dispersal rate is connected to more movement in the landscape, which might just result in a
higher statistical probability to encounter a snare.
The higher juvenile to adult ratio in the bag of the trappers can on the contrary also indicate
a more towards adults directed hunt when shooting them. Whether or not shooting is more
directed towards adults or juveniles is a well-discussed and important issue in management
and conservation of grouse. Small, Holzwart & Rusch (1991) found higher hunting
mortality on adults than on juveniles in area where hunting pressure was high. Sandercock
et al. (2011) on the contrary found higher juvenile hunting mortality while Smith &
Willebrand (1999) and Frilund (2000) could not detect any selection towards a certain age
class. If juveniles and adults use the landscape differently, they might also be more
separated by age during wintertime. This could result in a different vulnerability towards
hunters. More information on age segregation of those two species during wintertime
would be required to clarify if such segregation appears.
Bunnefeld et al. (2009) present other interesting findings in their arcticle on red grouse,
another species of the genus Lagopus, that might be relevant for the rock ptarmigan and
willow grouse population. They found age selective hunting to be dependent on the density
of the hunted game population. At high density it turned out to be a more towards adults
directed harvest while juveniles were overrepresented in the bag when population densities
were low. This puts emphasis on the necessity of a larger dataset including populations
from different regions in the Swedish mountain areas. Density might vary a lot in different
regions and can therefore affect the hunt contrasting at different places.
A more towards adults directed harvesting of the two bird species might pose a bigger
problem than a more towards juveniles directed harvesting would. Today the general idea is
to direct the shooting more towards juveniles because of the higher mortality rate in
juvenile grouse compared to adults. This would again result in a higher possibility to have
hunt as a compensatory mortality factor (Pedersen et al., 2004). If the hunt should be seen
as an additive or a compensatory mortality factor on willow grouse and rock ptarmigan is
controversial. For greater sage-grouse (Centrocercus urophasianus) Sedinger et al. (2010)
did not find any support for the mortality by hunt to be additive. For ruffed grouse in

21
central Wisconsin, Small et al. (1991) concluded on the other hand that hunting mortality
was at least partially, if not completely additive. The concept of compensatory mortality is
based on the assumption that natural mortality occurs to be density-dependent. Low harvest
mortality rates should have no effect on annual survival up to a threshold set by the natural
mortality rates. The additive mortality hypothesis on the contrary assumes that a decline in
annual survival is directly related to increases in harvest mortality (Sandercock et al. 2011).
Smith and Willebrand (1999) state that natural winter mortality in willow grouse does not
appear to be density dependent and Bergerud (1988) points out that there is little evidence
supporting that food or disease is a limiting factor for members of the family Tetraoninae
during winter. Therefore, in this study it is suggested that the winter hunt acts as a partly
additive mortality factor on the two bird species willow grouse and rock ptarmigan. This
hypothesis is reinforced by the article of Sandercock et al. (2011) on effects of
experimental harvest on survival mortality of willow grouse, in which they state that low
natural mortality during winter suggests that most late season harvest would be additive
mortality. Mortality is known to be very high for grouse at the end of summer and in the
beginning of autumn due to different factors like high dispersal rate and enhanced predation
through migrating raptors, mainly falcons (Nyström et al. 2005, Sandercock et al. 2011).
During this time the mortality rate is also reported to be considerably larger for juveniles
than for adults (Hannon & Martin 2006, Kobayashi & Nakamura 2013, Pedersen et al.
1999). Assuming that the natural mortality is density dependent during this time, the
harvest could turn out to be compensatory. This depends however also on the extent of the
hunting pressure, meaning if the hunting pressure gets to high it cannot be compensatory
anymore.
Another important aspect that still applies to the winter population is, that there is evidence
for adult birds, especially females, to be more valuable in terms of successful reproduction.
Hannon and Smith (1984) found that adult females defended their broods to a higher extent
and more were observed with broods than yearling, suggesting a more successful rearing.
Breeding pairs that consisted of two adults were also shown to produce more fledged young
than pairs of two yearlings. A considerably higher outtake of adult can therefore alter that
years breeding success.
To get a better understanding of the results regarding the divergent juvenile to adult ratios
in the bag of the hunters and trappers a comparison to the inventory results from 2014
would be necessary. Even if the results of the study are not sufficient enough to point out if
the hunt might be more directed towards juveniles or adults, the results suggest after all that
an age selective harvest during winter time might be the case for the rock ptarmigan and
willow grouse population in the mountain region of Västerbotten. Selective harvesting can
alter the cyclicity of a species. This was shown in modelling studies on moose (Solberg et
al. 1999), freshwater fish (Huusko & Hyvarinen 2005) as well as willow grouse (Jonzén et
al. 2003). An altered cyclicity can lead to a less stable population and diminished hunting
opportunities. This might pose a difficulty for the management and should be looked into
more closely.
Furthermore can different harvest vulnerability of adult and juvenile birds lead to a biased
extrapolation of age ratios in the population when using bag statistics as base (Asmyr et al.
2012). This again can lead to wrong directed management decisions and threaten the
stability of the willow grouse and rock ptarmigan populations in a long term view.
Furthermore selective hunting can lead to a decrease in population yield and might increase
extinction risk for local populations at high harvest rates (Bunnefeld et al. 2011). Bunnefeld

22
et al. (2011) also suggests in their paper on consequences of unintentional selective
harvesting in red grouse, that monitoring the number of potential breeding pairs after
selective harvesting can increase the predictability of post breeding population estimates
and thus promote more sustainable and consistent management. This underlines the
importance of the yearly inventories on rock ptarmigan and willow grouse taking place in
the first weeks of August.
Species composition
During the winter hunt it seems that the proportion of shot rock ptarmigan exceeds the
proportion of shot willow grouse while the bag statistics of the trappers seems to be rather
balanced regarding species. This finding can be explained by the hunting techniques
themselves and the previous results from the factor tree line. Snaring takes, according to the
previous results to 85 % of the time place at the tree line, while the majority, 76 %, of the
hunt with small caliber rifles takes place mainly above the tree line. Since the probability to
encounter a willow grouse above the tree line is very small, the majority of shot birds are
rock ptarmigan. At the tree line the chances to snare willow grouse or rock ptarmigan are
rather similar. The decision of the hunters to locate themselves at higher altitudes is
probably just based on the fact that the hunt can be assumed to be more successful in areas
where the birds can be spotted from a longer distance.
During the whole hunting season (25th
of August 2014 – 15th
of March 2015) a total of
2 996 rock ptarmigan and 15 161 willow grouse were reported shot in the county of
Västerbotten. Of these were 1558 rock ptarmigan and 14689 willow grouse shot during the
autumn hunt (25th
of August – 31st of December 2014) while1460 rock ptarmigan and 658
willow grouse were shot during the winter hunt 2015 (1st of January – 15
th of March). The
numbers of snared birds during the winter hunting season is 432 rock ptarmigan and 309
willow grouse (data from the County board of Västerbotten). These numbers include
however the uncertainty about species identification during the autumn hunt. It can
nonetheless be seen that, in total, a larger amount of willow grouse has been harvested than
rock ptarmigan. But 48 % of the shot rock ptarmigan were harvested during the winter
hunt.
Due to the skewed species composition in the winter hunt bag statistics and the large
difference in population size of rock ptarmigan and willow grouse eventual additive
mortality might pose a higher risk for rock ptarmigan than for willow grouse.
Conclusion and Reflections on the current management
Claw colour: 38% of the birds could be classified through the claw colour blind test.
It is an observational factor, which makes it applicable in the field.
Tree line: This parameter turned out to be a reliable identification factor in this
study. The results should however not be generalized.
Bodyweight: This factor showed strong statistical significance in the present study,
finds however little ecological relevance and can not be used a reliable
identification factor
Wing length: No significant difference could be seen between the species. Wing
length is no reliable identification factor.

23
DNA analyses can be of great value for the future management and conservation
and is needed to test the reliability of these results.
Hunters/Trappers reports: The percentage of differently reported birds is low (2 %)
for the winter hunting season. Species report may pose a bigger problem during
autumn hunting season.
Age ratio: The lower juvenile to adult ratio for shot birds than for snared birds
suggests a possible age selective harvest during winter time for the rock ptarmigan
and willow grouse population in the mountain region of Västerbotten.
Species composition: Due to different hunting techniques is the proportion of shot
rock ptarmigan exceeding the proportion of shot willow grouse while the bag
statistics of the trappers seems to be rather balanced regarding species during winter
hunt.
The adaptive local management (ALM) concept is an important tool in today’s wildlife
management (Aldridge et al. 2004, Lindqvist et al. 2004) and will likely play an even more
important role on the management of rock ptarmigan and willow grouse in the future if the
rock ptarmigan numbers continue to decrease. In this case ALM describes the process of
improving management policies and reducing uncertainty over time by learning from the
outcomes of the different monitoring systems and use for feedback to the management. The
current management for rock ptarmigan and willow grouse in the county of Västerbotten
seems to be a well working system. The importance of the yearly inventories was already
pointed out earlier. Monitoring the post-breeding population of rock ptarmigan and willow
grouse is an important aspect in regard of an eventual non deliberate age selective hunting
but is also important to adjust the hunting pressure to that year’s population development.
This monitoring system might be even more crucial for rock ptarmigan since the total
population size is much lower than that of willow grouse and fluctuations can affect the
rock ptarmigan population to a higher extent.
A desirable goal would be to have the harvest of the birds through humans as a
compensatory mortality factor. For the winter hunt, as shown before, this might not be
possible to conduct. For the autumn hunt however compensation might be possible. An
important factor, determining whether the hunt can be compensatory or not, is the hunting
pressure. The county board’s management system is based on the higher relevance of
hunting pressure rather than bag limits. If a certain population in one of the hunting areas
faces too high hunting pressure, the area will be closed and hunt is not permitted for the rest
of the hunting season. The allowed total hunting pressure for the coming season is set based
on the inventory data in the beginning of august collected before the hunting starts. The real
time adjustment of the hunting pressure is a unique part of the management and a good
example how cooperation with scientists can contribute to improve the management.
There are some aspects that might be worth to look into closer to ensure a functioning
management also in the future. Earlier the difficulties of taking management actions before
the hunt were explained. The results of this study bring up a new possibility when it comes
to pre hunting actions - the tree line. If the different species cannot be distinguished through
24
appearance from distance in the field, other factors like habitat preferences can be taken
into account. For example, areal hunting restrictions, meaning to restrain hunting at higher
elevations above the tree line where it is more likely to encounter rock ptarmigan than
willow grouse during the winter season, might be one possibility of species directed
harvesting. Further studies on the areal distribution, also during autumn, would, as
mentioned before, be necessary.
On the other hand studies on the compensatory or additive mortality through the harvest
should also be conducted with emphasis on the autumn hunt. The amount of willow grouse
mistaken for rock ptarmigan, and reverse, is also important to be estimated for the autumn
hunt. The possibility of a potential age selective hunt should also be studied more in detail
with a larger dataset and comparison to the previous year’s inventory results. Furthermore,
a DNA analysis of the collected toes would be beneficial to get more information on the
strength of the claw method but also to get more information on sex and extent of
hybridization.
In the present study it is however suggested that the most important factor, to improve the
management, is education. Many experienced hunters and trappers might not have
problems to identify the species but might lack the knowledge of the importance to divide
between the two species willow grouse and rock ptarmigan. Therefore the hunters´ and
trappers´ awareness and interest should be raised by giving them more information about
the current population status of the two bird species, the problems the management system
has to face, and the importance of their cooperation. Hunters and trappers have direct
contact with the game species and are one of the most valuable source of knowledge.
Science can only try to explain nature to a limited extent, and there is a gap between
science and traditional knowledge where quite often science has to rediscover what has
already been known in generations of hunters, trappers or naturalists. Therefore I encourage
incorporating those people more when designing scientific studies or making management
decisions.
Acknowledgements
First, I would like to thank my two supervisors Gert E. Olsson at SLU, Umeå and Torleif
Eriksson at the county board of Västerbotten for making this project possible. I am thankful
for their guidance and advice during the fieldwork as well as during the writing part. The
county board of Västerbotten also financed part of the fieldwork for which I am grateful. I
also appreciate John P. Ball´s help with designing the whole study and advice with the
statistical aspect. I also want to thank Maria Hörnell-Willebrand for her advice and help
regarding the fieldwork and Anja Kjellsson from the Swedish Association for Hunting and
Wildlife Management in Umeå for her effort regarding the collection of bird wings and
feet. Furthermore I would like to thank Magnus Enbom for his help in the laboratory, with
preparations for the blind test as well as for his support and helpful ideas during the writing
part. I of course also want to thank all other participants for offering their time to perform
the blind test – Adrian Straker, Alexis Jamet, Casper Kuipers, Clydecia Spitzer, Enooyaq
Sudlovenick, Eirini Daouti, Felix Reimann, Frederick Wollborn, Jerk Sjöberg, Johanna
Wärnsberg, Julie Falampin, Kristina Nilsson, Kristina Vallance, Linnea Aronsson, Moa
Walldén, Petra Walander, Robert Spitzer, Ruben Bloemsma, Viktor Boström.
I am also very grateful for the help and support I got from my family and my friends.
25
Finally and most importantly I would like to thank all the hunters and trappers that were
offering so many hours and were willing to share their knowledge with me.
Bibliography
Aldridge, C.L., Boyce, M.S. & Baydack, R.K. (2004). Adaptive management of prairie
grouse: how do we get there? Wildlife Society 32 (1): 92–103.
Asmyhr, L., Willebrand, T., & Hörnell-Willebrand, M. (2012). Human dimensions of
wildlife : An general experience rather than of local knowledge is important for grouse
hunters bag size. Human Dimensions of Wildlife 17: 437–445.
Bergerud, A. T. & Gratson, M. W. (1988). Survival and breeding strategies of grouse.
p.473–575 in A. T. Bergerud & M. W. Gratson, editors. Adaptive strategies and
population ecology of northern grouse. University of Minneapolis Press, Minneapolis.
Bergerud, A. T., Peters, S. S. & McGrath, R. (1963). Determining sex and age of willow
ptarmigan in Newfoundland. Journal of Wildlife Management 27: 700–711.
Buckland, S.T., Anderson, D.R., Burnham, K.P. & Laake, J.L. (1993). Distance sampling:
Estimating abundance of biological populations. Chapman & Hall, London.
Bunnefeld, N., Baines, D., & Newborn, D. (2009). Factors affecting unintentional
harvesting selectivity in a monomorphic species. Journal of Animal Ecology 78: 485–
492.
Bunnefeld, N., Reuman, D. C., Baines, D., & Milner-Gulland, E. J. (2011). Impact of
unintentional selective harvesting on the population dynamics of red grouse. Journal of
Animal Ecology 80(6): 1258–1268.
Caudill, D., & Resources, W. (2014). Greater sage-grouse juvenile survival in Utah. Journal
of Wildlife Management 78(5): 808–817.
Cockburn, A. (1992). Habitat heterogeneity and dispersal: environmental and genetic
patchiness. P.65–95 in N. C. Stenseth and W. Z. Lidicker, editors. Animal dispersal.
Chapman and Hall, London.
Cramp, S. & Simmons, K.E.L. (1977). The Birds of the Western Palearctic, Vol. 1. :
Oxford University Press, Oxford.
Dahl, F. & Sjöberg, G. (2010). Social sustainability of hunting tourism in Sweden. In:
Matilainen A, Kes- kinarkaus S (Eds.) The Social sustainability of hunting tourism in
Northern Europe. Reports 59. University of Helsinki, Ruralia Institute.
Durlak, J.A. (2009). How to select, calculate, and interpret effect sizes. Journal of Pediatric
Psychology 34(9): 917–928.
Ericsson, G. & Heberlein, T. A. (2003). Attitudes of hunters , locals , and the general public
in Sweden now that the wolves are back. Biological Conservation 111: 149–159.
Eriksson, T., Andersson, J., Byström, P., Hörnell-Willebrand, M. & Laitila, T. (2006). Fish
and wildlife in the Swedish mountain region: resources, use and management.
International Journal of Biodiversity Science, Ecosystems Services & Management
2(4): 334–342.
Erikstad, K.E. (1979). Effects of radio packages on reproductive success of willow grouse.
Journal of Wildlife Management 43(1): 170-175.
Flanders-Wanner, B.L., White, G.C. & McDaniel, L.L. (2004). Validity of prairie grouse
harvest-age ratios as production indices. Journal of Wildlife Management 68: 1088–
1094.
26
Frilund, G.E. (2000). The effect of hunting on survival in willow ptarmigan, Lagopus l.
lagopus. Candidata scientiarum thesis, Norwegian University of Science and
Technology, Trondheim.
Gardarsson, A. (1988). Cyclic population changes and some related events in rock
ptarmigan in Iceland. In Adaptive strategies and population ecology of northern grouse.
P. 300–329 in Bergerud, A.T. & Gratson, M.W. (Eds). University of Minnesota Press,
Minneapolis.
Gratson, M.W. (1988). Spatial patterns, movements, and cover selection by sharp-tailed
grouse. In Adaptive strategies and population ecology of northern grouse. P.158–192 in
Bergerud, A.T. & Gratson, M.W. (Eds). University of Minnesota Press, Minneapolis.
Greenwood, P.J. & Harvey, P.H. (1982). The natal and breeding dispersal of birds. Annual
Review of Ecology and Systematics 1-21.
Gruys, R. C. (1993). Autumn and winter movements and sexual segregation of willow
ptarmigan. Arctic 46(3): 228–239.
Gutiérrez, R. J., Barrowclough, G. F. & Groth, J. G. (2000). A classification of the grouse
(Aves: Tetraoninae) based on mitochondrial DNA sequences. Wildlife Biology 6: 205–
211.
Hannon, S. J., & Martin, K. (2006). Ecology of juvenile grouse during the transition to
adulthood. Journal of Zoology 269: 422–433.
Hannon, S.J. & Smith J.N.M. (1984). Factors influencing age-related reproductive success
in the willow ptarmigan. The Auk 101: 848-854.
Hines, J.E. (1987).Winter habitat relationships of blue grouse on Hardwicke Island, British
Columbia, Canada. Journal of Wildlife Management 51: 426–435.
Hjeljord, O. (2008). Viltet. Biologi og forvaltning. Tun Forlag, Oslo.
Huusko, A. & Hyvaärinen, P. (2005). A high harvest rate induces a tendency to generation
cycling in a freshwater fish population. Journal of Animal Ecology 74: 525–531.
Hörnell-Willebrand, M. & Dahl, F. (2004). Inventera dalripa och fjällripa.
SLU, Vindelns Försöksparker, Skog & Trä 2004:5.
Hörnell-Willebrand, M. (2005). Temporal and spatial dynamics of willow grouse Lagopus
lagopus, Doktoral thesis at the Swedish University of Agricultural Siences (SLU),
Umeå.
Irving, L., West, G. C., & Peyton, L. J. (1967). Winter feeding program of Alaska willow
ptarmigan shown by crop contents. The Condor 69(1): 69–77.
Jakubas, D., Wojczulanis-Jakubas, K., Jensen, J., Akubas, D. J., Akubas, K. W. O., &
Ensen, J. J. (2014). Body size variation of European storm petrels Hydrobates pelagicus
in relation to environmental variables. Acta Ornithologica 49(1): 71–82.
Johnsgard, P.A. (1983). The grouse of the world. University of Nebraska Press, Lincoln.
Jonzén, N., Ranta, E., Lundberg, P., Kaitala, V. & Lindén, H. (2003). Harvesting induced
population fluctuations. Wildlife Biology 9: 59–65.
Jordbruksverket (2013). Uppdrag att övervaka effekterna av upplåtelsesystemet för
småviltjakt på statens mark ovan odlingsgränsen och på renbetesfjällen. Regeringsbeslut
5 2007-04-19. Jo2007/473, 1350, 1353.
Keppie, D. M. (1979). Dispersal, overwinter mortality, and recruitment of spruce grouse.
Journal of Wildlife Management 43(3): 717–727.
Kobayashi, A., & Nakamura, H. (2013). Chick and juvenile survival of Japanese rock
ptarmigan Lagopus muta japonica. Wildlife Biology 19(4): 358–367.
Lindqvist, S., Sandström, C., Bjarstig, T. & Kvastegard, E. (2014). The changing role of
hunting in Sweden - from subsistence to ecosystem stewardship? Alces 50: 53-66.

27
Länsstyrelsen (2015). Ripjakt – Föreskrifter/allmänna råd: http://www.lansstyrelsen.se
/vasterbotten/Sv/djur-och-natur/jakt-och-vilt/Smaviltsjakt-pa-statens-mark/Foreskrifter-
allmanna%20rad/Pages/default.aspx – 12.02.2015.
Myrberget, S. (1974). Variation in the production of willow grouse Lagopus lagopus (L.) in
Norway, 1963-1972. Ornis Scandinavica 5: 163-172.
Myrberget, S. (1984). Population dynamics of willow grouse Lagopus lagopus on an island
in North Norway. Fauna norvegica Ser. C, Cinclus 7: 95-105.
Mortensen, A., Nordoy, E.S. & Blix, A.S. (1985). Seasonal changes in the body
composition of the Norwegian rock ptarmigan Lagopus mutus. Ornis Scandinavica
16:25-2
Moritz, P. (1990). Fjällfolk – Livsformer och kulturprocesser i Tärna socken under 1800-
och 1900-talen. Doktoral thesis at the department of Ethnology, Umeå University,
Umeå.
Moss, R. (1983). Gut size, body weight, and digestion of winter foods by grouse and
ptarmigan. The Condor 85(2): 185-193.
Nielsen, O.K., Weiss, A. & Guðmundsson, G.A. (2014). Rock ptarmigan (Lagopus muta)
health studies in Northeast Iceland 2013: morphology and body reserves.
Natturufræðistofnun islands (Icelandic Institute of Natural History), Garðabær.
Nyström, J., Ekenstedt, J., Engström, J. & Angerbjörn, A. (2005). Gyr falcons, ptarmigan
and microtine rodents in northern Sweden. Ibis 147: 587–597.
Norberg, U.M. (1995). How a long tail and changes in mass and wing shape affect the cost
for flight in animals. Functional Ecology 9(1): 48-54.
Pedersen, H.C. (1984). Territory size, mating status, and individual survival of males in a
fluctuating population of willow ptarmigan. Ornis Scandinavica 15: 197-203.
Pedersen, H. C., Steen, H., Kastdalen, L., Brøseth, H., Ims, R. A., Svendsen, W., &
Yoccoz, N. G. (2004). Weak compensation of harvest despite strong density-dependent
growth in willow ptarmigan. The Royal Society London 271: 381–385.
Quintela, M., Thulin, C.G. & Höglund, J. (2010). Detecting hybridization between willow
grouse (Lagopus lagopus) and rock ptarmigan (L. muta) in Central Sweden through
Bayesian admixture analyses and mtDNA screening. Conservation Genetics 11: 557–
569.
Rørvik, K.-A., Pedersen, H.C. & Steen, J.B. (1998). Dispersal in willow ptarmigan
Lagopus lagopus – who is dispersing and why? Journal of Wildlife Biology 4: 91-96.
Sæther, B.E., Heim, M., Solberg, E.J., Jakobsen, K., Stacy, J., Sviland, M. & Olstad, R.
(2001). Effekter av rettet avskyting på elgbestanden på Vega. NINA Fagrapport 49: 1-
39.
Sandercock, B. K., Nilsen, E. B., Brøseth, H., & Pedersen, H. C. (2011). Is hunting
mortality additive or compensatory to natural mortality ? Effects of experimental
harvest on the survival and cause-specific mortality of willow ptarmigan. Journal of
Animal Ecology 80: 244–258.
Sandercock, B.K., Martin, K. & Hannon, S. J. (2005). Life history strategies in extreme
environments : Comparative demography of arctic and alpine ptarmigan. Ecology 86(8):
2176–2186.
Sedinger, J.S., White, G.C., Espinosa, S., Partee, E.T. & Braun, C. E. (2010). Assessing
compensatory versus additive harvest mortality : An example using greater Sage-
grouse. Journal of Wildlife Management 74(2): 326–332.
Small, R. J., Holzwart, J. C., & Rusch, D. H. (1991). Predation and hunting motrtality of
ruffed grouse in Central Wisconsin. The Journal of Wildlife Management 55(3): 512–
520.

28
Smith, A. & Willebrand, T. (1999). Mortality causes and survival rates of hunted and
unhunted willow grouse. Journal of Wildlife Management 63(2): 722–730.
Solberg, E.J., Sæther, B-E., Strand, O. & Loison, A. (1999). Dynamics of a harvested
moose population in a variable environment. Journal of Animal Ecology 68: 186-204.
Steen, J. B. (2004). Ryper og rypejegere. Gyldendal fakta.
Svenska Jägareförbundet (1996). Ung eller gammal – Konsten att bestämma åldern på vilda
djur och fåglar. Uppsala.
Steen, J.B., Steen, H., Stenseth, N.C., Myrberget, S. & Marcström, V. (1988). Microtine
density and weather as predictors of chick production in willow ptarmigan, Lagopus l.
lagopus. Oikos 51: 367-373.
Svenska Jägareförbundet (2014a). Artpresentation – Fjällripa. http://jagareforbundet.se
/vilt/vilt-vetande/artpresentation/faglar/fjällripa/ - 14.10.2014
Svenska Jägareförbundet (2014b). Artpresentation – Dalripa. http://jagareforbundet.se
/vilt/vilt-vetande/artpresentation/faglar/dalripa/ - 14.10.2014
Svensson, L. & Grant, P.J. (1999). Fåglarna −Alla Europas och Medlehavets fåglar i fält.
Albert Bonniers Förlag, Stockholm.
Thompson, B. (2006). Research synthesis: Effect sizes. In J. L. Green, G. Camilli, &
Patricia B. Elmore (Eds.), Handbook of complementary methods in educational research
(pp. 583–603). Mahwah, NJ: Erlbaum.
Volker, M. A. (2006). Reporting effect sizes in school psychology research. Psychology in
the Schools 43: 653–672.
Weeden, R.B. (1964). Spatial separation of sexes in rock and willow ptarmigan in winter.
The Auk 81(4): 534-541.
West, G.C. & Meng, M.S. (1968). Seasonal changes in body weight and fat and the relation
of fatty acid composition to diet in the willow ptarmigan. The Wilson Bulletin 80(4):
426-441.
Wilson, S. & Martin, K. (2011). Life-history and demographic variation in an alpine
specialist at the latitudinal extremes of the range. Population Ecology 53: 459–471.

SENASTE UTGIVNA NUMMER
2015:8 Restoration of white-backed woodpecker Dendrocopos leucotos habitats in central
Sweden – Modelling future habitat suitability and biodiversity indicators Författare: Niklas Trogen 2015:9 BEYOND GENOTYPE Using SNPs for pedigree reconstruction-based population
estimates and genetic characterization of two Swedish brown bear (Ursus arctos) populations
Författare: Robert Spitzer 2015:10 Hot, hungry, or dead: how herbivores select microhabitats based on the trade-off
between temperature and predation risk Författare: Kristina Vallance 2015:11 Habitat diversity and composition among growing wild boar (Sus scrofa L.)
populations in Sweden Författare: Sebastian Olofsson 2015:12 Evaluating lake charr (Salvelinus namaycush) temperature use in a mountain lake
using acoustic telemetry Författare: Johan Leander 2015:13 Hormonbehandlade mårdhundstikar – En framtida förvaltningsmetod för att
förhindra en storskalig etablering av mårdhund i Sverige? Författare: Erika Bergmark 2015:14 Hunting dogs in Sweden: Are the abundances of hunting dog breeds influenced by
the population sizes of game species? Författare: Linnea Aronsson 2015:15 The effect of migratory fish on freshwater ecosystem nutrient dynamics Författare: Magnus Enbom 2015:16 Restoration of natural disturbances: impact on distribution and performance of
dominant ants (Formica spp.) by fire and gap dynamics Författare: Rebecca Larsson 2015:17 Life History Trade-offs in Anadromous Burbot Lota Lota (Linnaeus 1758) from
Rickleån and Sävarån, Northern Sweden Författare: Mikael Sandberg 2015:18 Laxens uppströmsvandring i den restaurerade och flödesreglerande Umeälvens
nedre del Författare: Joakim Johansson 2016:1 Moose (Alces alces) browsing patterns in recently planted clear-cut areas in
relation to predation risk of the gray wolf (Canis lupus) in Sweden Författare: Suzanne van Beeck Calkoen 2016:2 Ecological requirements of the three-toed woodpecker (Picoides tridactylus L.) in
boreal forests of northern Sweden Författare: Michelle Balasso Hela förteckningen på utgivna nummer hittar du på www.slu.se/viltfiskmiljo