SPECIALIST DISABILITY ACCOMMODATION: MARKET INSIGHTS · 2018-03-20 · 2 Specialist Disability...
62
SPECIALIST DISABILITY ACCOMMODATION: MARKET INSIGHTS
Transcript of SPECIALIST DISABILITY ACCOMMODATION: MARKET INSIGHTS · 2018-03-20 · 2 Specialist Disability...
SPECIALIST DISABILITY ACCOMMODATION: MARKET INSIGHTS

© SGS Economics and Planning Pty Ltd 2018
This report has been prepared for Summer Foundation. SGS Economics and Planning has taken all due care in the preparation of this report. However, SGS and its associated consultants are not liable to any person or entity for any damage or loss that has occurred, or may occur, in relation to that person or entity taking or not taking action in respect of any representation, statement, opinion or advice referred to herein.
SGS Economics and Planning Pty Ltd ACN 007 437 729 www.sgsep.com.au Offices in Canberra, Hobart, Melbourne, Sydney
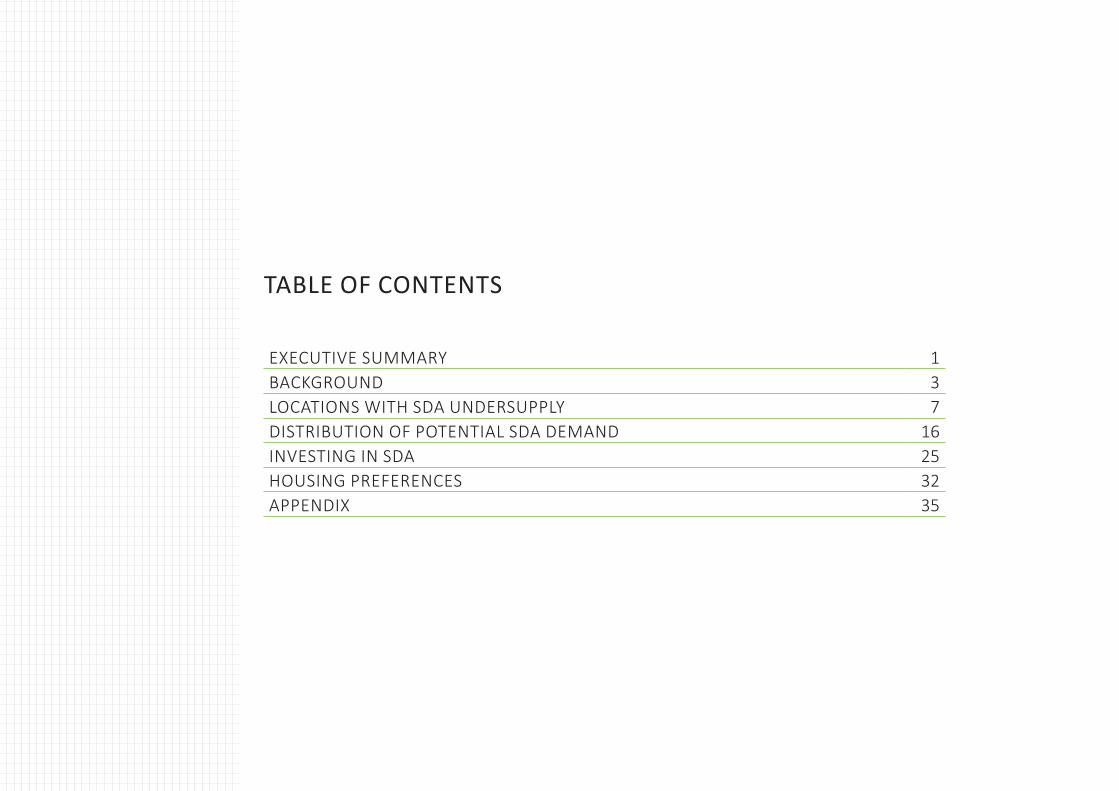
TABLE OF CONTENTS
EXECUTIVE SUMMARY 1BACKGROUND 3LOCATIONS WITH SDA UNDERSUPPLY 7DISTRIBUTION OF POTENTIAL SDA DEMAND 16INVESTING IN SDA 25HOUSING PREFERENCES 32APPENDIX 35
1Specialist Disability Accommodation: Market insights
01EXECUTIVE SUMMARY
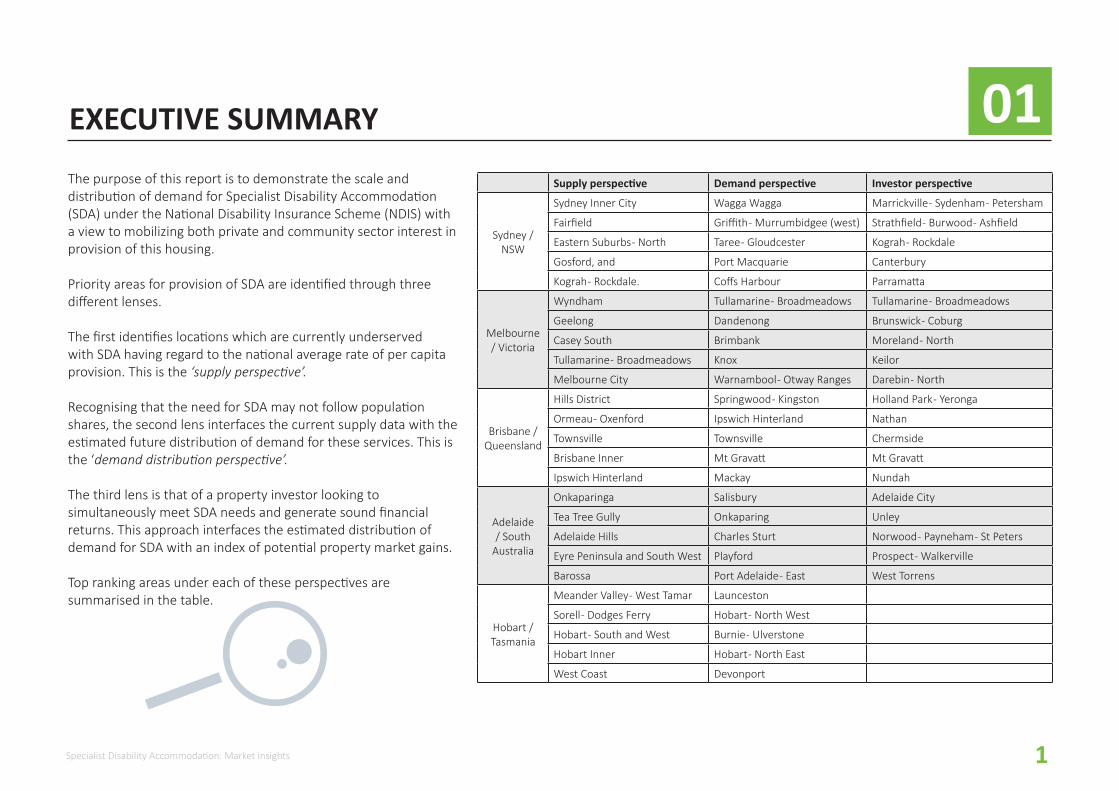
The purpose of this report is to demonstrate the scale and distribution of demand for Specialist Disability Accommodation (SDA) under the National Disability Insurance Scheme (NDIS) with a view to mobilizing both private and community sector interest in provision of this housing.
Priority areas for provision of SDA are identified through three different lenses.
The first identifies locations which are currently underserved with SDA having regard to the national average rate of per capita provision. This is the ‘supply perspective’.
Recognising that the need for SDA may not follow population shares, the second lens interfaces the current supply data with the estimated future distribution of demand for these services. This is the ‘demand distribution perspective’.
The third lens is that of a property investor looking to simultaneously meet SDA needs and generate sound financial returns. This approach interfaces the estimated distribution of demand for SDA with an index of potential property market gains.
Top ranking areas under each of these perspectives are summarised in the table.
Supply perspective Demand perspective Investor perspective
Sydney / NSW
Sydney Inner City Wagga Wagga Marrickville - Sydenham - Petersham
Fairfield Griffith - Murrumbidgee (west) Strathfield - Burwood - Ashfield
Eastern Suburbs - North Taree - Gloudcester Kograh - Rockdale
Gosford, and Port Macquarie Canterbury
Kograh - Rockdale. Coffs Harbour Parramatta
Melbourne / Victoria
Wyndham Tullamarine - Broadmeadows Tullamarine - Broadmeadows
Geelong Dandenong Brunswick - Coburg
Casey South Brimbank Moreland - North
Tullamarine - Broadmeadows Knox Keilor
Melbourne City Warnambool - Otway Ranges Darebin - North
Brisbane / Queensland
Hills District Springwood - Kingston Holland Park - Yeronga
Ormeau - Oxenford Ipswich Hinterland Nathan
Townsville Townsville Chermside
Brisbane Inner Mt Gravatt Mt Gravatt
Ipswich Hinterland Mackay Nundah
Adelaide / South
Australia
Onkaparinga Salisbury Adelaide City
Tea Tree Gully Onkaparing Unley
Adelaide Hills Charles Sturt Norwood - Payneham - St Peters
Eyre Peninsula and South West Playford Prospect - Walkerville
Barossa Port Adelaide - East West Torrens
Hobart / Tasmania
Meander Valley - West Tamar Launceston
Sorell - Dodges Ferry Hobart - North West
Hobart - South and West Burnie - Ulverstone
Hobart Inner Hobart - North East
West Coast Devonport

2 Specialist Disability Accommodation: Market insights
1.1EXECUTIVE SUMMARYThe current supply and distribution of SDA cannot accommodate projected future demand.
Across Australia, 17,500 people currently live in supported accommodation. The SDA funding under the NDIS is estimated to support 28,000 people.
A gap of 10,500 places across Australia exists on the basis of currently supply. The table below shows how this gap is distributed across Australia, by reference to a per capita share.
State Existing SDA residents
Per capita distribution of
SDA
Difference
ACT 210 470 260
NSW 5,730 9,020 3,290
NT 160 280 120
QLD 3,340 5,650 2,310
SA 1,720 1,990 270
TAS 500 600 100
VIC 4,260 7,200 2,940
WA 1,590 2,980 1,390
Total 17,510 28,190 10,680
27%7%
40%
26%18-24
25-44
45-49
60-64
The majority of current SDA residents live in group homes. Accessibility, mobility and co-location choices are some of the key features that need to be considered in future SDA places.
This report estimates that an additional 33,200 people may require SDA on top of the 17,500 already in this form of housing. Of these 33,200 people, 6,200 people are under 64 residing in aged care
Most of the current and potential SDA residents are under the age of 45.
Analysis comparing current SDA supply and potential demand shows there are key hot-spots across Australia.
The analysis indicates there are hotspots of potential demand for new SDA in metropolitan and regional areas.

3Specialist Disability Accommodation: Market insights
02 BACKGROUND

4 Specialist Disability Accommodation: Market insights
ABOUT SPECIALIST DISABILITY ACCOMMODATION 2.1THE POLICY
SDA is available to those participants of the National Disability Insurance Scheme (NDIS) requiring specialist housing options that cater for their very high support needs and/or their extreme functional impairment.
Funding made available through the SDA policy under the NDIS is designed to give participants choice and control of where, and with whom, they will live with. SDA funding is attached to individuals but paid to the housing provider.
At full Scheme, total funding for SDA is expected to be around $700 million per year
The NDIA estimates that around 6 per cent of total NDIS participants, currently around 28,000 people, will require SDA. Of these, 12,000 people will have access to affordable housing for the first time. This will be a transformational benefit for these recipients given their current living situation is primarily with parents, in hospitals or in residential aged care.
It is estimated an additional 4,000 people will require their existing SDA to be replaced with new stock.
SDA payments
Base price The base price for each dwelling can be affected by four components: � Type of SDA � Building Type � Design Category � On-site overnight assistance
Types of SDA SDA dwellings can be categorised as New Builds, Existing Stock or Legacy Stock. The type of SDA will affect the payment made to the provider.
Building TypeThis refers to the physical form of the dwelling build. This can range from apartments, villa/duplex/townhouse, house and group homes. Prices for these dwelling types are further disaggregated to capture the number of residents the building type will house.
Design Category There are five SDA design categories. These rand from a Basic design standard to a High Physical Support standard. The SDA payment differs for each of these design categories.
On-site overnight assistance (OOA)
An additional premium is paid to dwellings that have facilities to provide On-site overnight assistance.
Location factors The base price of each dwelling is also indexed against a set of predetermined location factors. This primarily offsets any addition build costs that are likely to occur in areas outside of the metropolitan areas.
Fire Sprinklers Additional allowances are made if the dwelling has fire sprinklers installed. This varies for apartments and all other building types from 1.2%-1.9% respectively.
Source: https://www.ndis.gov.au/medias/documents/hf8/hdf/8802881994782/SDA-Price-Guide-17-18.pdf
BRIDGING THE YIELD GAP
The policy is designed to deliver annual payments to the housing provider for each occupied SDA dwelling.
The provider receives payment from the NDIS for the provision of the dwelling to the person with approved SDA payments plus reasonable rent contribution from the resident.
HOW ARE THE PAYMENTS MADE?
The SDA payment vary depending on the type of accommodation, its location and particular specifications, as shown in the table below. Per person subsidies currently range from $12,419 to $107,236 p.a.
The reasonable rent contribution by the resident is based on 25% of Disability Support Pension in addition to any Commonwealth Rent Assistance.
5Specialist Disability Accommodation: Market insights
DATA AND APPROACH TO ANALYSIS 2.2DATA SOURCES
This report relies on information from the Australian Institute of Health and Welfare as analysed by the Australian Housing and Urban Research Institute (AHURI) and the Summer Foundation.
Raw data on demand for SDA has been derived from comprehensive administrative records held by state and territory governments regarding users of disability services.
Of particular interest in this report is information regarding service users living in supported accommodation (residential institutions and group homes) and service users who have very high support needs but do not live in supported accommodation.
The data on service users with very high support needs but not living in supported accommodation/SDA provides insights into the location of people who are likely to seek SDA type housing in the future.
Also of note are service users living in residential aged care aged less than 65. Aged care is not an appropriate housing option for younger people, but over 6,000 younger people with high and complex disability support needs live in residential aged care due to lack of alternative suitable accommodation.
MEASURING SUPPLY AND DEMAND
For the purposes of this report, the count of people living in existing supported accommodation is taken as a measure of current SDA supply in any given location.
The report compares the current distribution of these places with a national benchmark for provision (based on places per capita) to identify areas where there are likely SDA supply shortfalls.
The report also explores the quantum and geography of demand for SDA places by analysing the location of people with very high support needs not living in SDA and people living in residential aged care. These people represent strong potential demand for new SDA places, assuming their current housing situation does not reflect their preferred living arrangement. For example, many people with high support needs are living with ageing parents who cannot continue to care for their adult children.
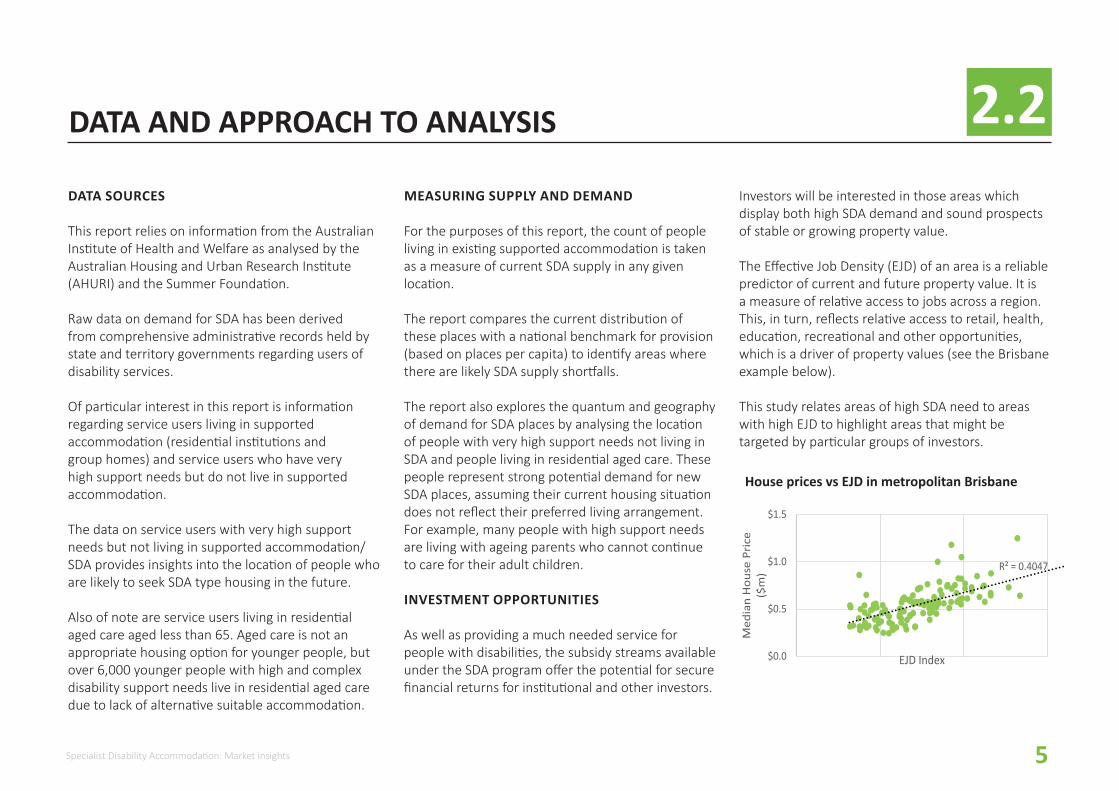
INVESTMENT OPPORTUNITIES
As well as providing a much needed service for people with disabilities, the subsidy streams available under the SDA program offer the potential for secure financial returns for institutional and other investors.
R² = 0.4047
$0.0
$0.5
$1.0
$1.5
Med
ian
Hou
se P
rice
($
m)
EJD Index
House prices vs EJD in metropolitan Brisbane
Investors will be interested in those areas which display both high SDA demand and sound prospects of stable or growing property value.
The Effective Job Density (EJD) of an area is a reliable predictor of current and future property value. It is a measure of relative access to jobs across a region. This, in turn, reflects relative access to retail, health, education, recreational and other opportunities, which is a driver of property values (see the Brisbane example below).
This study relates areas of high SDA need to areas with high EJD to highlight areas that might be targeted by particular groups of investors.

6 Specialist Disability Accommodation: Market insights
2.3NATIONAL OVERVIEW
Across Australia, 17,500 people are currently living in Supported Disability Accommodation.
An additional 33,200 people have been identified with high support needs, with the potential to qualify for SDA payments. This group consists of:
� 6,200 people aged under 64 and with very high support needs living in aged care, and
� 27,000 people with very high support needs not currently living in SDA or aged care.
The majority of the people not currently in SDA or aged care (75%) is living at home, two-thirds with family (many with ageing parents or other family carers). Two thirds are under 45 years of age. It is expected that these people will continue to receive disability support services through the NDIS and many will seek more appropriate accommodation, given more flexible support provided under the NDIS.
Similarly, many of the group currently living in aged care would be expected to seek more appropriate accommodation under the NDIS.
Current residents
0%
60-64
45-59
25-44
18-24
10% 20% 30% 40% 50%
Prospec�ve residents
9% in large institutions
5% in small residential institution
87% in group homes
The following shows where current and potential users of specialist disability accommodation were residing in 2017.
The graph below shows most people currently living in SDA are aged between 25-59, with a median age of 46 .
There is a much younger age profile of people potentially seeking SDA in the future (median age of 34).
7Specialist Disability Accommodation: Market insights
03 LOCATIONS WITH SDA UNDERSUPPLY

8 Specialist Disability Accommodation: Market insights
3.1LOCATIONS WITH SDA UNDERSUPPLY
When the NDIS is fullyrolled out and there are 28,000 SDA places funded, this would equate to one SDA place per 857 people (general population).
The 1:857 ratio can be used to highlight locations of clear undersupply of SDA places across Australia (noting that “current supply” reflects historic decisions about provision of supported accommdation by governments).
The map shows there are varying degrees of current supply (by total number) across the country. Areas with deeper shading indicate likely shortfalls in future supply based on the current distribution of SDA.
On this index, metropolitan areas within NSW, VIC and QLD have the greatest shortage of SDA. The table provides data by jurisdiction highlighting those with large shortfalls in SDA supply.
State Existing SDA residents Per capita distribution of SDA Difference
ACT 210 470 260
NSW 5,730 9,020 3,290
NT 160 280 120
QLD 3,340 5,650 2,310
SA 1,720 1,990 270
TAS 500 600 100
VIC 4,260 7,200 2,940
WA 1,590 2,980 1,390
Total 17,510 28,190 10,680
9Specialist Disability Accommodation: Market insights
3.2SYDNEY AND NEW SOUTH WALES
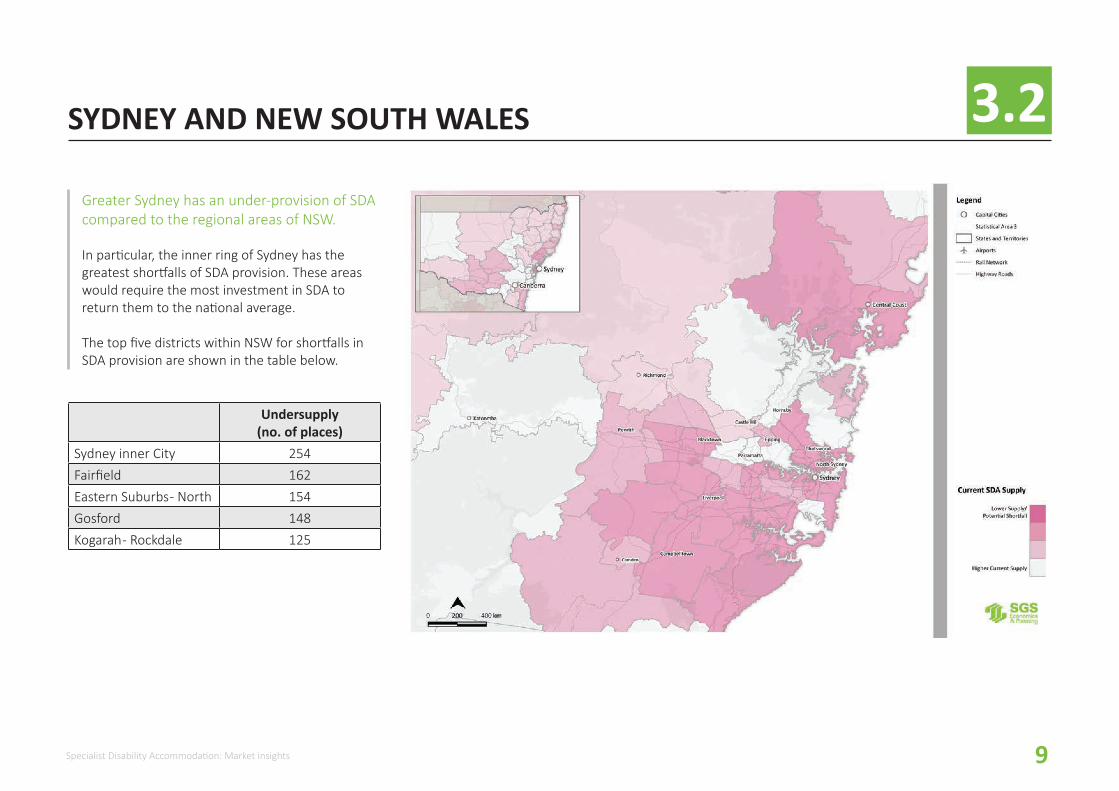
Greater Sydney has an under-provision of SDA compared to the regional areas of NSW.
In particular, the inner ring of Sydney has the greatest shortfalls of SDA provision. These areas would require the most investment in SDA to return them to the national average.
The top five districts within NSW for shortfalls in SDA provision are shown in the table below.
Undersupply (no. of places)
Sydney inner City 254Fairfield 162Eastern Suburbs - North 154Gosford 148Kogarah - Rockdale 125
10 Specialist Disability Accommodation: Market insights
3.3MELBOURNE AND VICTORIA
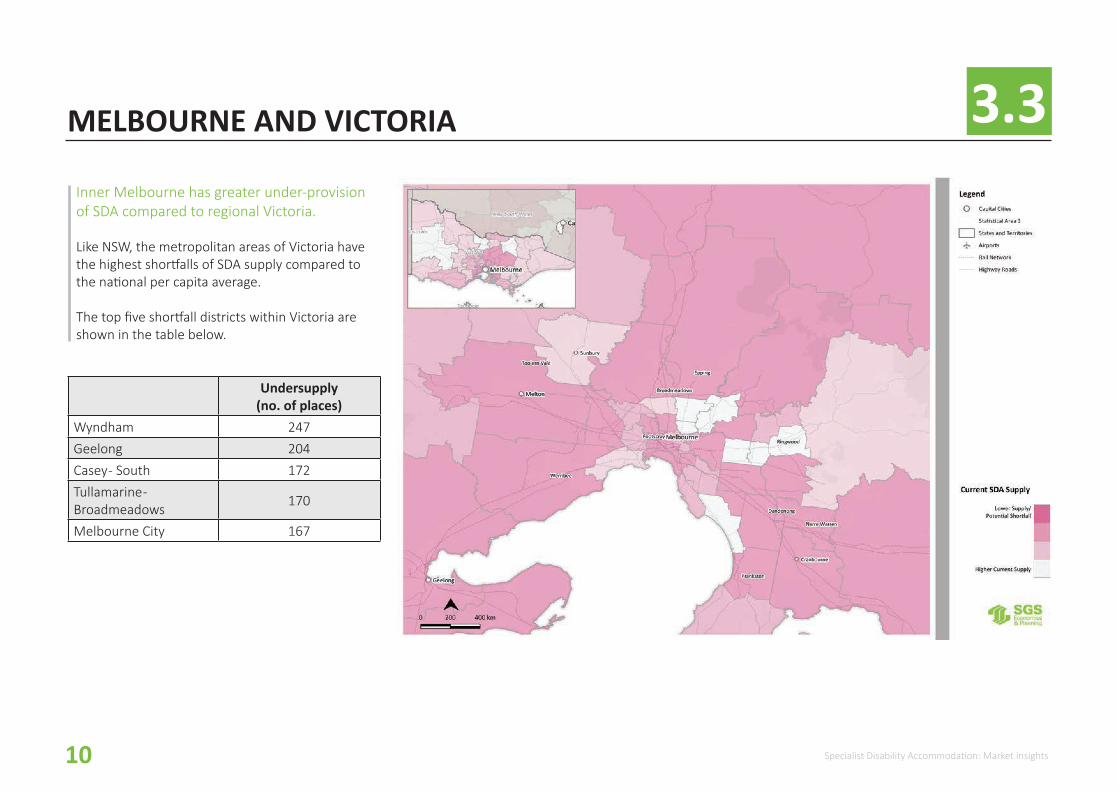
Inner Melbourne has greater under-provision of SDA compared to regional Victoria.
Like NSW, the metropolitan areas of Victoria have the highest shortfalls of SDA supply compared to the national per capita average.
The top five shortfall districts within Victoria are shown in the table below.
Undersupply (no. of places)
Wyndham 247Geelong 204Casey - South 172Tullamarine - Broadmeadows 170
Melbourne City 167
11Specialist Disability Accommodation: Market insights
3.4BRISBANE AND QUEENSLAND
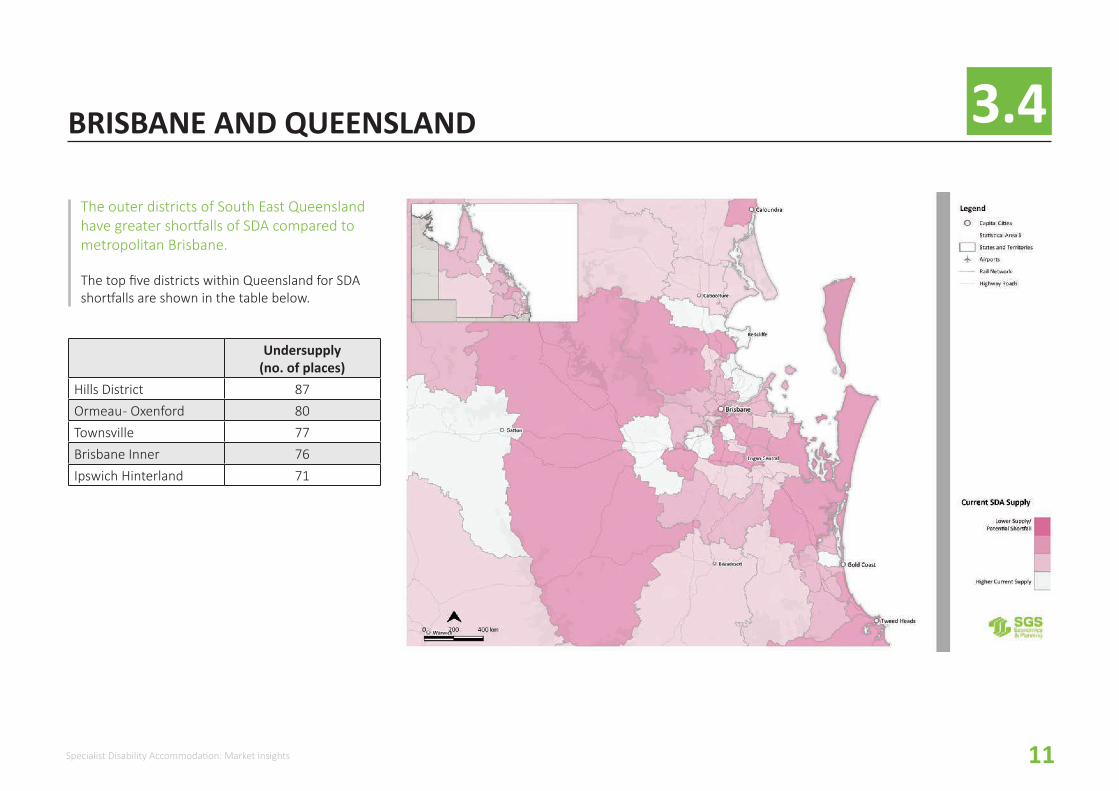
The outer districts of South East Queensland have greater shortfalls of SDA compared to metropolitan Brisbane.
The top five districts within Queensland for SDA shortfalls are shown in the table below.
Undersupply (no. of places)
Hills District 87Ormeau - Oxenford 80Townsville 77Brisbane Inner 76Ipswich Hinterland 71

12 Specialist Disability Accommodation: Market insights
3.5ADELAIDE AND SOUTH AUSTRALIA
Undersupply (no. of places)
Onkaparinga 113Tea Tree Gully 76Adelaide Hills 51Eyre Peninsula and South West 45
Barossa 37
The inner metropolitan areas of Adelaide have a relatively even distribution of SDA in line with the national provision ratio.
Outer metro areas and regional South Australia have the lowest provision of SDA.
The top five districts for SDA shortfalls are shown in the table below.
13Specialist Disability Accommodation: Market insights
3.6HOBART AND TASMANIA
Undersupply (no. of places)
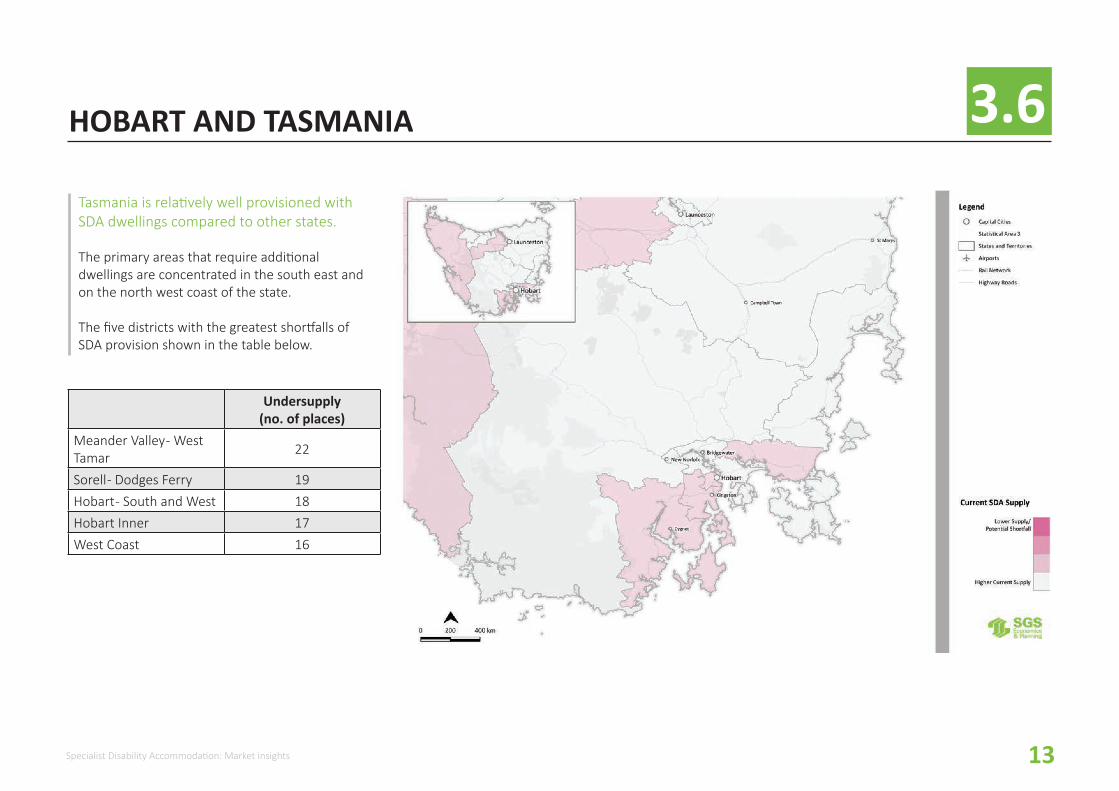
Meander Valley - West Tamar 22
Sorell - Dodges Ferry 19Hobart - South and West 18Hobart Inner 17West Coast 16
Tasmania is relatively well provisioned with SDA dwellings compared to other states.
The primary areas that require additional dwellings are concentrated in the south east and on the north west coast of the state.
The five districts with the greatest shortfalls of SDA provision shown in the table below.
14 Specialist Disability Accommodation: Market insights
3.7CANBERRA AND THE AUSTRALIA CAPITAL TERRITORY
Undersupply (no. of places)
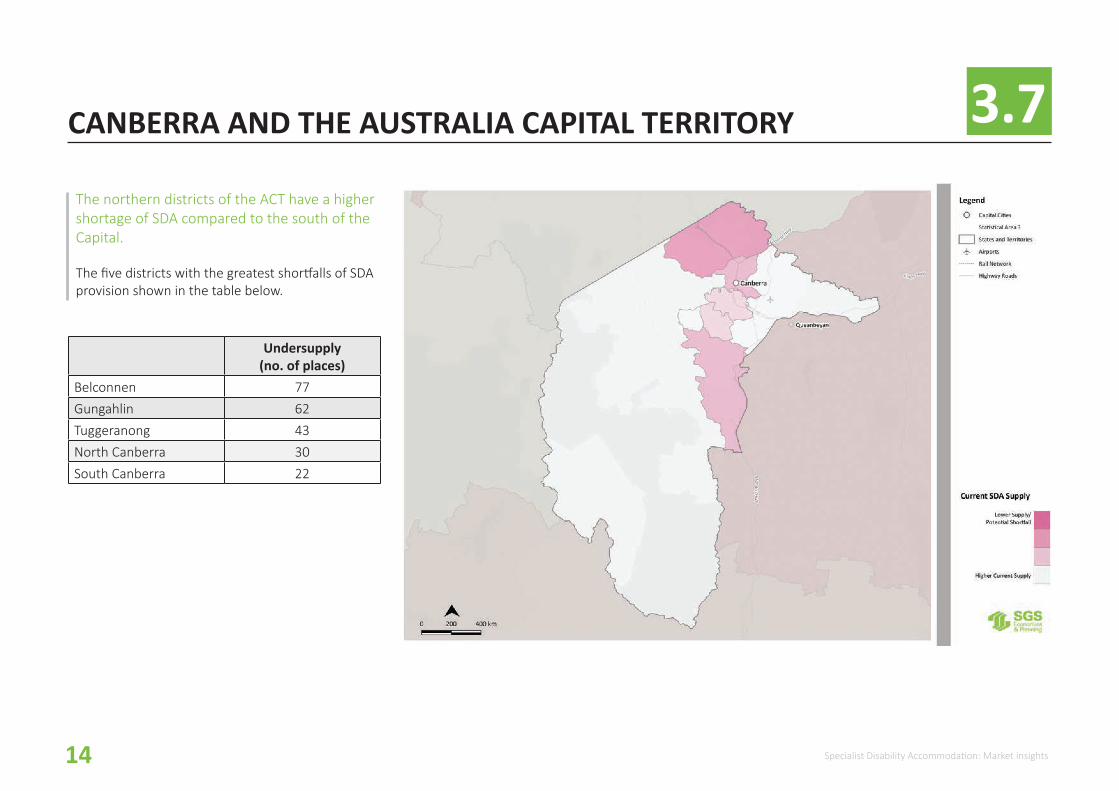
Belconnen 77Gungahlin 62Tuggeranong 43North Canberra 30South Canberra 22
The northern districts of the ACT have a higher shortage of SDA compared to the south of the Capital.
The five districts with the greatest shortfalls of SDA provision shown in the table below.

15Specialist Disability Accommodation: Market insights
3.8DARWIN AND THE NORTHERN TERRITORY
Undersupply (no. of places)
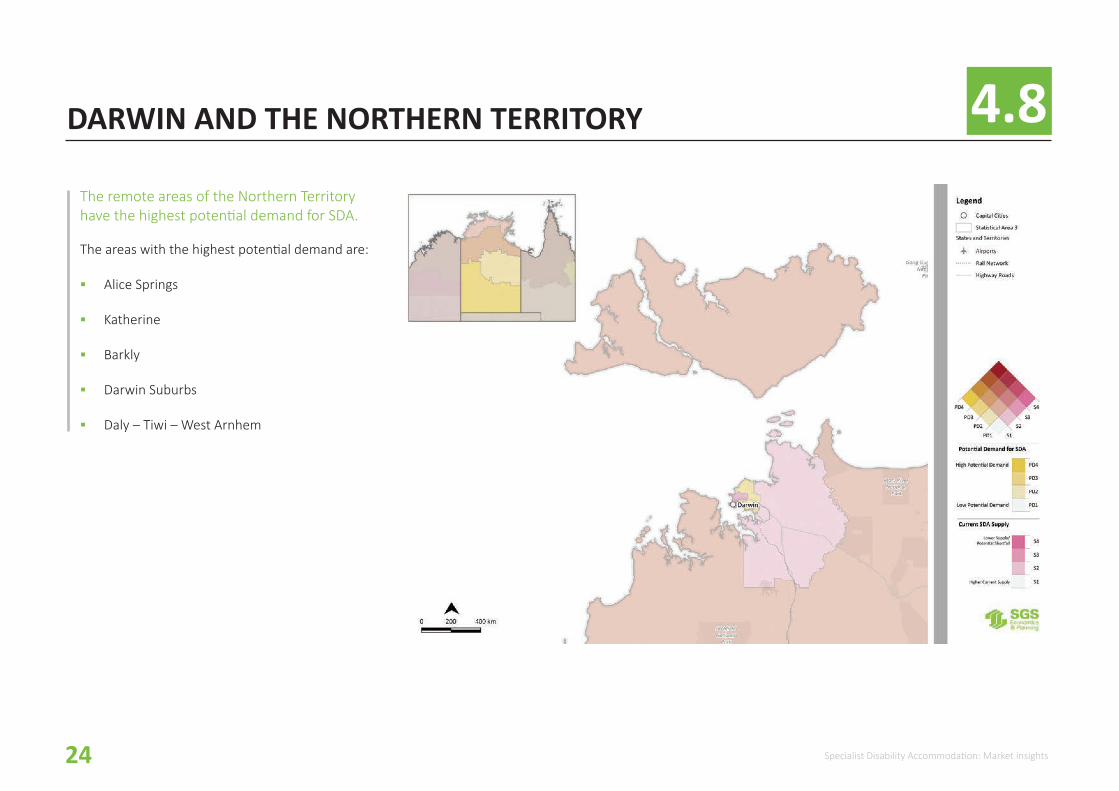
Darwin City 33Palmerston 27Litchfield 24Daly - Tiwi - West Arnhem 21East Arnhem 17
The Northern Territory is relatively well provisioned with SDA dwellings compared to the national average.
The five districts with the greatest shortfalls of SDA provision shown in the table below.

16 Specialist Disability Accommodation: Market insights
04 DISTRIBUTION OF POTENTIAL SDA DEMAND

17Specialist Disability Accommodation: Market insights
4.1DISTRIBUTION OF POTENTIAL SDA DEMAND
Comparing current provision of SDA in each area with the national average provides one insight to those parts of Australia in need of investment in this form of housing.
However, data analysis shows that the need for SDA is not proportionally distributed across the country. Rather there are areas of concentrated demand.
Analysing the spatial distribution of people who might seek SDA in the future provides further insight as to where investment in this form of housing might be best deployed.
This section focusses on the distribution of estimated demand for SDA as indicated by the number of potential NDIS participants aged between 18-64 years currently living in residential aged care plus people who have very high disability support needs and not living in supported accommodation.
CURRENT SUPPLY VERSUS POTENTIAL DEMAND
The following maps overlay the index of relative under-provision of SDA , as identified by reference to national benchmarks (Section 3) with the measured distribution of potential demand for SDA housing.
The dark yellow areas show areas of high potential SDA demand.
The dark pink areas have low SDA supply compared to the national benchmark.
Amongst other things, combining these indices highlights areas of both very low relative supply and very high demand (shown in dark red). These could be key target areas for SDA investment.
In interpreting these maps, it should be noted that people with high needs who are currently not in supported accommodation are not guaranteed access to SDA payments. For a more accurate picture of actual demand, data on the success rate of receiving an SDA payment is required from the NDIA.
18 Specialist Disability Accommodation: Market insights
4.2SYDNEY AND NEW SOUTH WALES
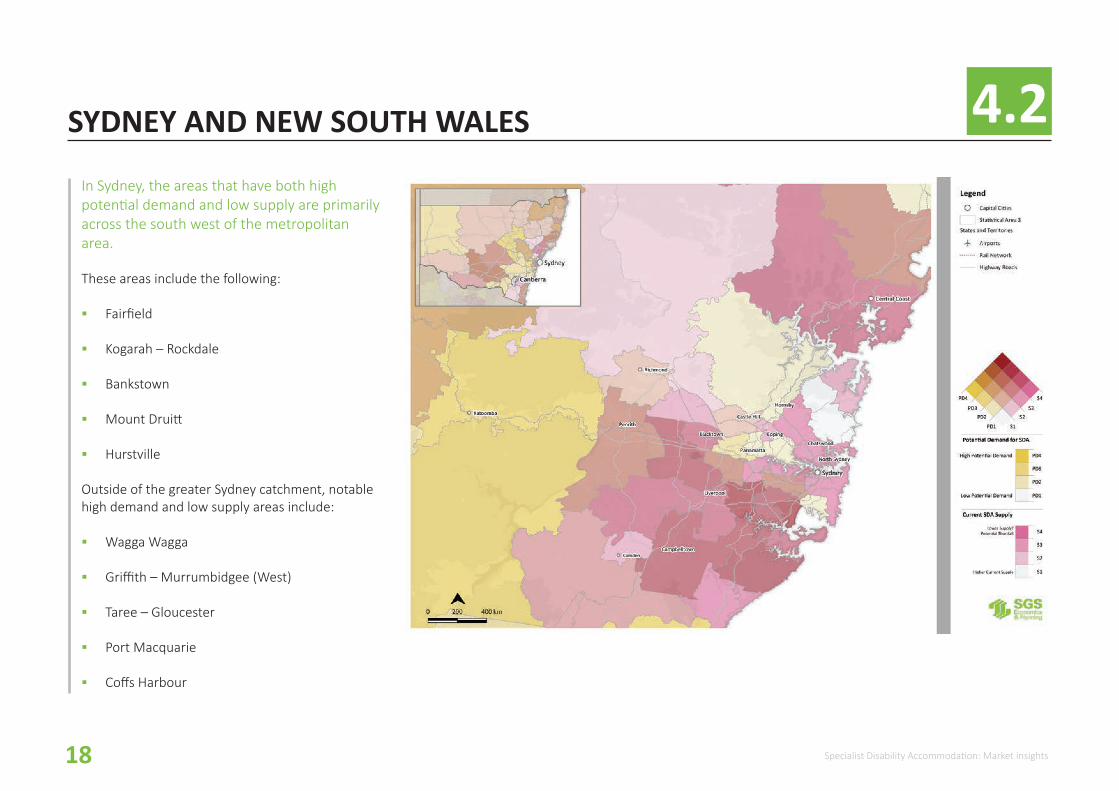
In Sydney, the areas that have both high potential demand and low supply are primarily across the south west of the metropolitan area.
These areas include the following:
� Fairfield
� Kogarah – Rockdale
� Bankstown
� Mount Druitt
� Hurstville
Outside of the greater Sydney catchment, notable high demand and low supply areas include:
� Wagga Wagga
� Griffith – Murrumbidgee (West)
� Taree – Gloucester
� Port Macquarie
� Coffs Harbour
19Specialist Disability Accommodation: Market insights
4.3MELBOURNE AND VICTORIA
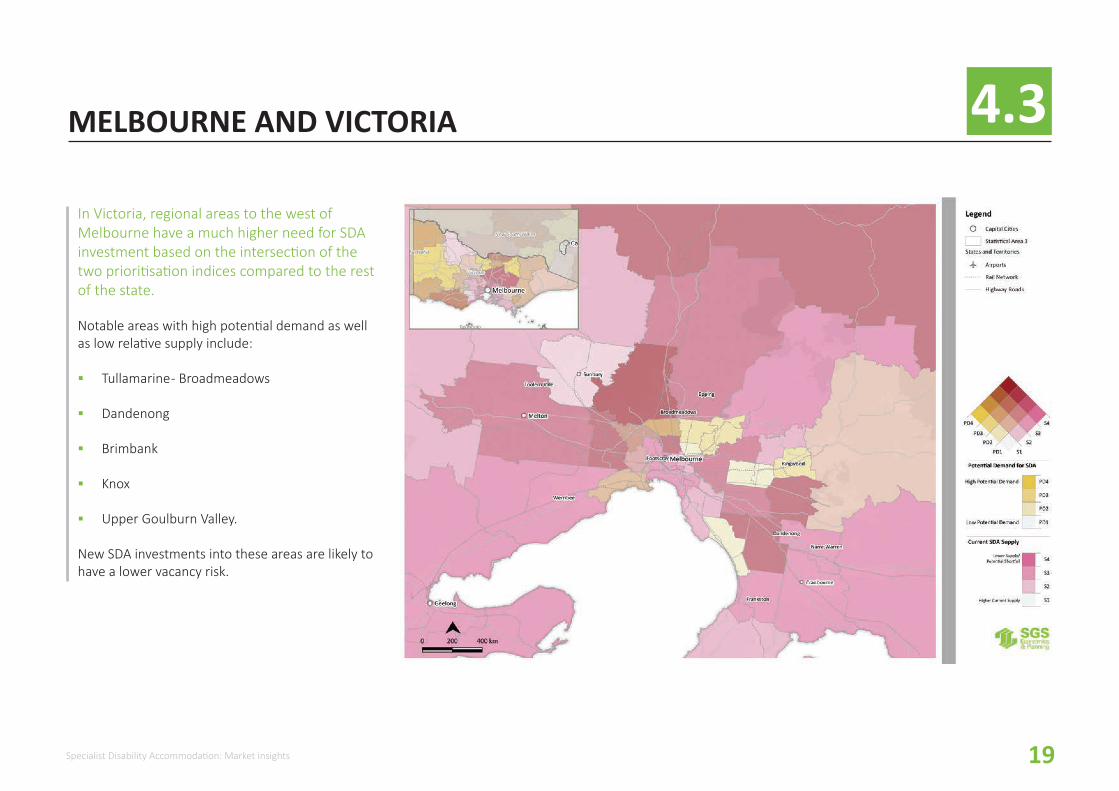
In Victoria, regional areas to the west of Melbourne have a much higher need for SDA investment based on the intersection of the two prioritisation indices compared to the rest of the state.
Notable areas with high potential demand as well as low relative supply include:
� Tullamarine - Broadmeadows
� Dandenong
� Brimbank
� Knox
� Upper Goulburn Valley.
New SDA investments into these areas are likely to have a lower vacancy risk.

20 Specialist Disability Accommodation: Market insights
4.4BRISBANE AND QUEENSLAND
Within Brisbane, the crossover of the two indices highlight key pockets in the city to be prioritised. The inner metropolitan areas of Brisbane have relatively low potential demand compared to these peri-urban and regional districts.
Priority areas based on the combination of estimated demand and current supply include:
� Springwood - Kingston
� Ipswich Hinterland
� Townsville
� Mt Gravatt
� Mackay
21Specialist Disability Accommodation: Market insights
4.5ADELAIDE AND SOUTH AUSTRALIA
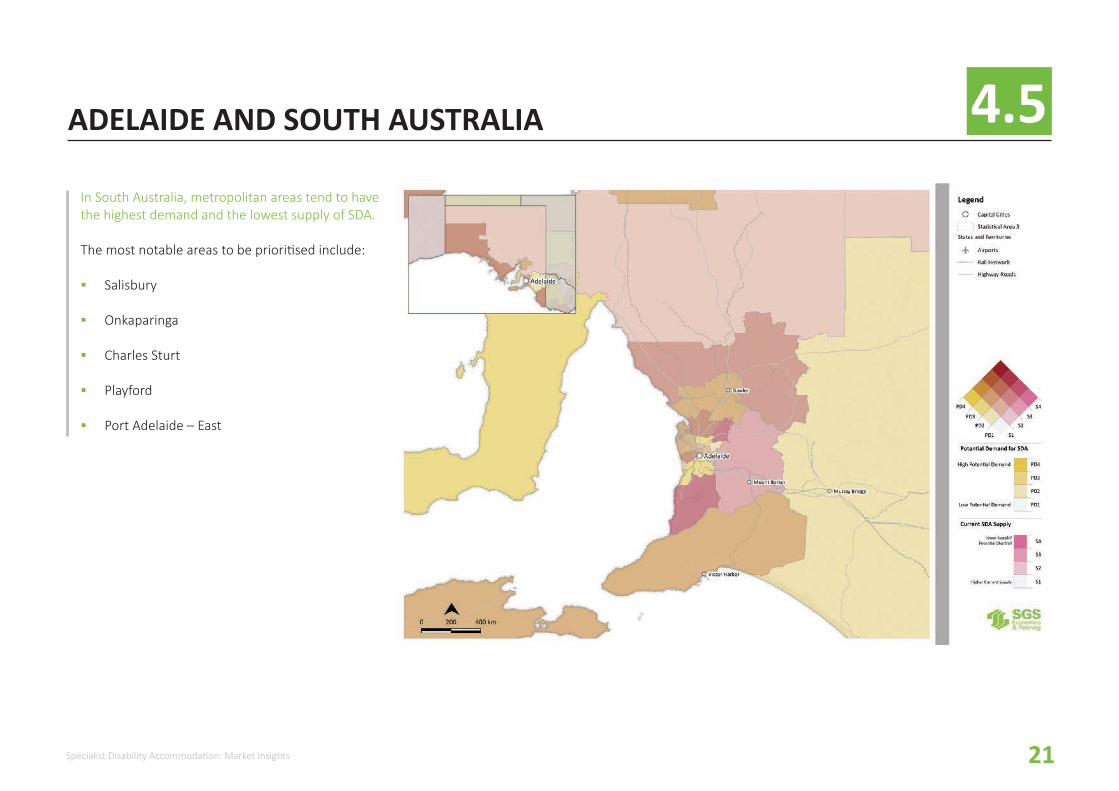
In South Australia, metropolitan areas tend to have the highest demand and the lowest supply of SDA.
The most notable areas to be prioritised include:
� Salisbury
� Onkaparinga
� Charles Sturt
� Playford
� Port Adelaide – East
22 Specialist Disability Accommodation: Market insights
4.6HOBART AND TASMANIA
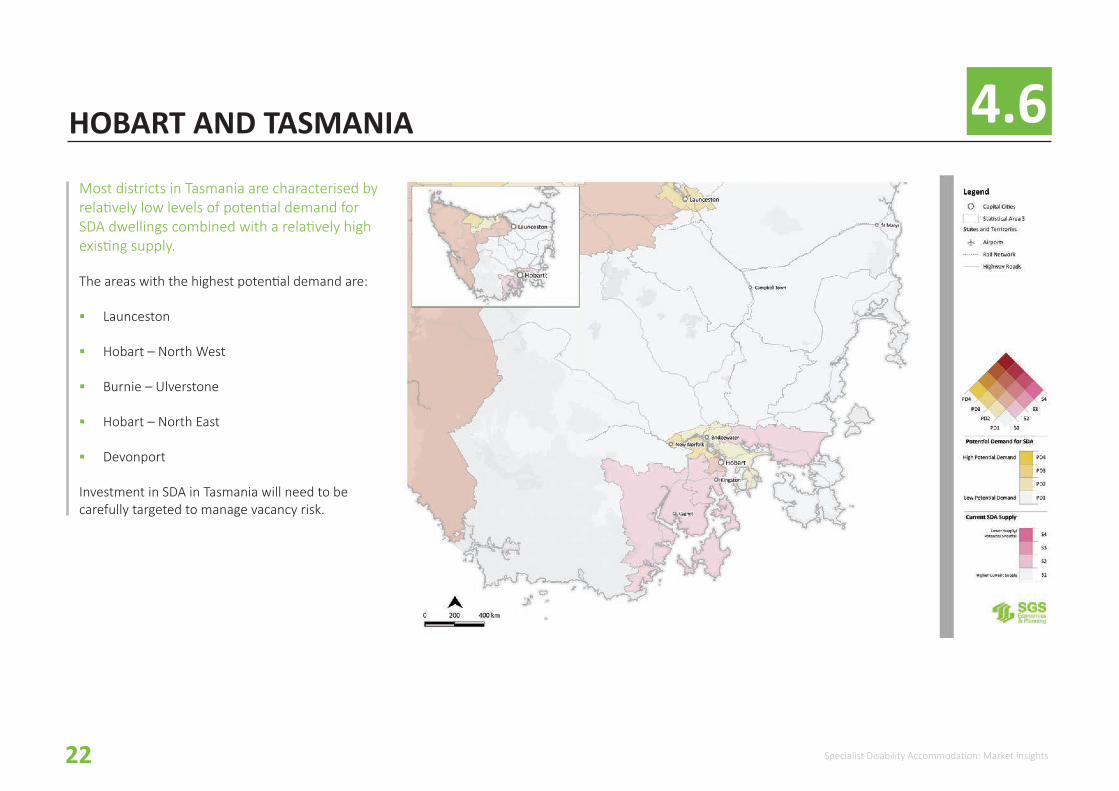
Most districts in Tasmania are characterised by relatively low levels of potential demand for SDA dwellings combined with a relatively high existing supply.
The areas with the highest potential demand are:
� Launceston
� Hobart – North West
� Burnie – Ulverstone
� Hobart – North East
� Devonport
Investment in SDA in Tasmania will need to be carefully targeted to manage vacancy risk.
23Specialist Disability Accommodation: Market insights
4.7CANBERRA AND THE AUSTRALIAN CAPITAL TERRITORY
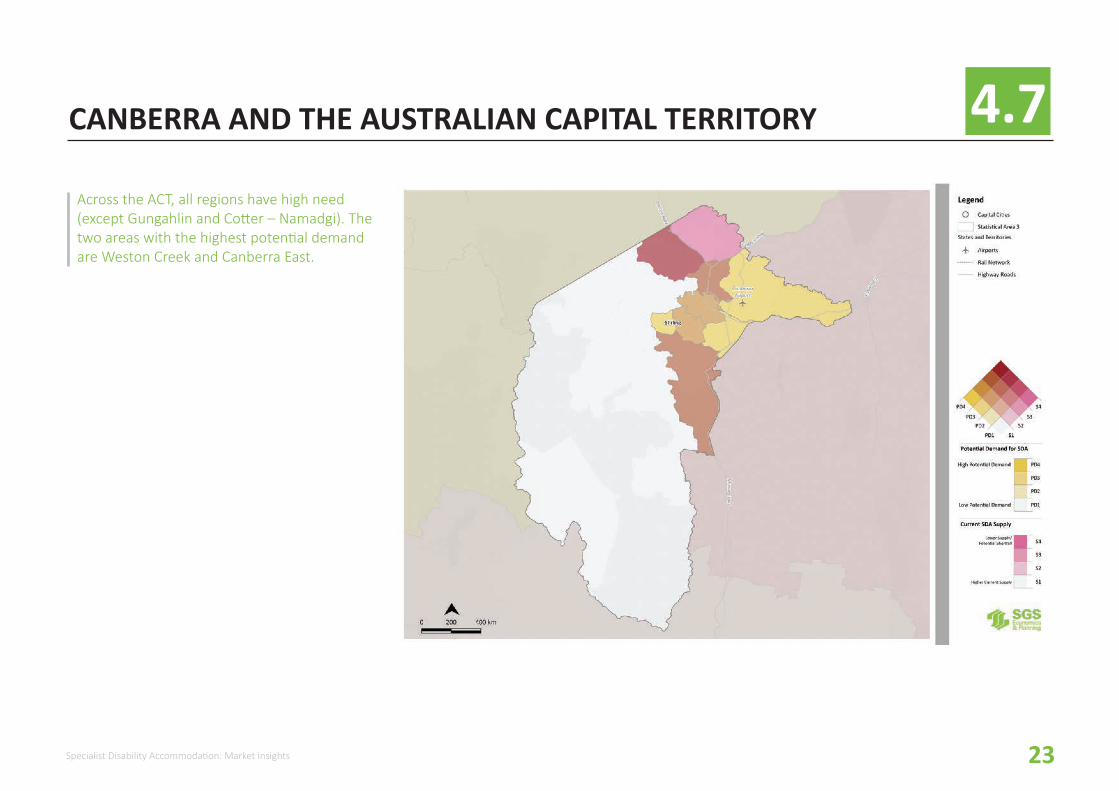
Across the ACT, all regions have high need (except Gungahlin and Cotter – Namadgi). The two areas with the highest potential demand are Weston Creek and Canberra East.
24 Specialist Disability Accommodation: Market insights
4.8DARWIN AND THE NORTHERN TERRITORY
The remote areas of the Northern Territory have the highest potential demand for SDA.
The areas with the highest potential demand are:
� Alice Springs
� Katherine
� Barkly
� Darwin Suburbs
� Daly – Tiwi – West Arnhem

25Specialist Disability Accommodation: Market insights
05 INVESTING IN SDA

26 Specialist Disability Accommodation: Market insights
5.1INVESTING IN SDA
Investors mobilised by the NDIS subsidies for SDA will come from both the not-for-profit and commercial sectors. To varying degrees, both these groups will have an eye to the financial performance of these investments, including the prospects of sound capital growth.
This section brings together the index of SDA need derived from the AHURI analysis with an index of underlying strength in the property market – Effective Job Density (EJD). EJD captures the centrality of a location which is often the determining factor in property values.
EJD captures the centrality of a location which is often the determining factor in property values.
It is a measure of relative access to jobs across a region. This, in turn, reflects relative access to retail, health, education, recreational and other opportunities, which is a driver of property values.
Areas showing high potential demand for SDA as well as strong market growth, as indicated by high EJD, will be of interest to commercially focussed SDA investors.

27Specialist Disability Accommodation: Market insights
5.2SYDNEY AND NEW SOUTH WALES
Greater Sydney’s south west districts have relatively high EJD as well high potential demand. These are areas that would have the strongest investment potential whilst also addressing potential SDA needs.
Key areas of high EJD and strong potential demand are:
� Marrickville – Sydenham – Petersham
� Strathfield – Burwood – Ashfield
� Kogarah – Rockdale
� Canterbury
� Parramatta

28 Specialist Disability Accommodation: Market insights
5.3MELBOURNE AND VICTORIA
The outer districts within metropolitan Melbourne have strong potential demand and high potential commercial returns.
Notable areas with high EJD and strong potential demand include:
� Tullamarine - Broadmeadows
� Brunswick - Coburg
� Moreland – North
� Keilor
� Darebin – North

29Specialist Disability Accommodation: Market insights
5.4BRISBANE AND QUEENSLAND
The intersection of both strong potential demand for SDA and strong commercial returns highlights the outer districts of metropolitan Brisbane and districts in and around the Gold Coast.
Noteworthy areas showing high scores on both EJD and demand are:
� Holland Park – Yeronga
� Nathan
� Chermside
� Mt Gravatt
� Nundah

30 Specialist Disability Accommodation: Market insights
5.5ADELAIDE AND SOUTH AUSTRALIA
Inner city Adelaide shows highest potential demand for SDA coupled with the strongest commercial potential.
The most notable areas with the highest EJD and strong potential demand are:
� Adelaide City
� Unley
� Norwood – Payneham – St Peters
� Prospect – Walkerville
� West Torrens

31Specialist Disability Accommodation: Market insights
5.6TASMANIA, THE NORTHERN TERRITORY AND ACTTasmania, the Northern Territory and the Australian Capital Territory generally have lower levels of EJD reflecting relatively small cities in each of these jurisdictions.
Accordingly, the measure of potential demand for SDA is likely to be the more reliable indicator for preferred SDA investment areas in these states and territories.
32 Specialist Disability Accommodation: Market insights
06 HOUSING PREFERENCES
33Specialist Disability Accommodation: Market insights
6.1HOUSING PREFERENCESCO-LOCATION CHOICES
More than two thirds of the participants preferred to be living with different people to their current situation. This resonates strongly with those currently living with parents and/or siblings wanting more independence and to live with friends. Those living with other people reported a strong preference to live by themselves with support.
These preferences are important to consider for future investments into SDA dwellings. Accessible houses, units and apartments are more likely to be the preference for most SDA seekers. This is a very different future SDA supply profile to what currently exists – mainly group homes.
“ I would live somewhere with younger people, people my own age”
ACCESSIBILITY AND MOBILITY
For most of the survey participants, accessibility and mobility within their dwelling was reported to be satisfactory. However, suggested improvements included increasing the number of automated doorways.
“It’s on a hill so I can’t walk anywhere”
“House was not designed to be accessible. Step at the front and rear doors,
double storey with all bedrooms upstairs.”
The SDA policy is designed to ensure individuals have greater choice in where they live, with whom they live and the type of house they live in. Currently, many potential SDA participants have no choice but to live in accommodation that is poorly aligned to their preferences. Providers of, and investors in, SDA will need to understand the housing preference profile of participants.
In 2017, the Summer Foundation held workshops and conducted in-depth interviews with a sample of people with high support needs living in a variety of situations around Australia.
Sixty-nine people provided information about where they live now and their preferences for future housing.
Younger people with high support needs and living with family, or living in group homes or aged care, indicated a strong desire to change their living arrangements. They wanted to move to their own place and find greater independence and privacy while maintaining proximity to family, friends and services.
34 Specialist Disability Accommodation: Market insights
6.2HOUSING PREFERENCESPRIVACY
For those participants expressing dissatisfaction with the level of privacy in their supported accommodation, the key concerns related to unwanted intrusions from staff and other residents. Many expressed their preference for their own bathroom closer to their room.
“My (accommodation) feels busy and crowded, lack of privacy and space, overwhelming especially when visitors are over.”
“Privacy in both of the nursing homes I’ve lived in has been terrible. Staff would be present during doctor visits and nursing procedures.”
“Not enough privacy. People are always in and out of the house.”
SAFETY
Responses in respect of safety and security were varied. Those reporting satisfaction with their current situation on these matters tended to reside with their families and/or had good accessibility in and around their homes.
Participants expressing dissatisfaction over the safety provided by their current living situation resided in both supported accommodation and private homes.
“I feel 10/10 safe where I am: I live with my family.”
“Do not feel safe due to accessibility issues.”
35Specialist Disability Accommodation: Market insights
07 APPENDIX
36 Specialist Disability Accommodation: Market insights
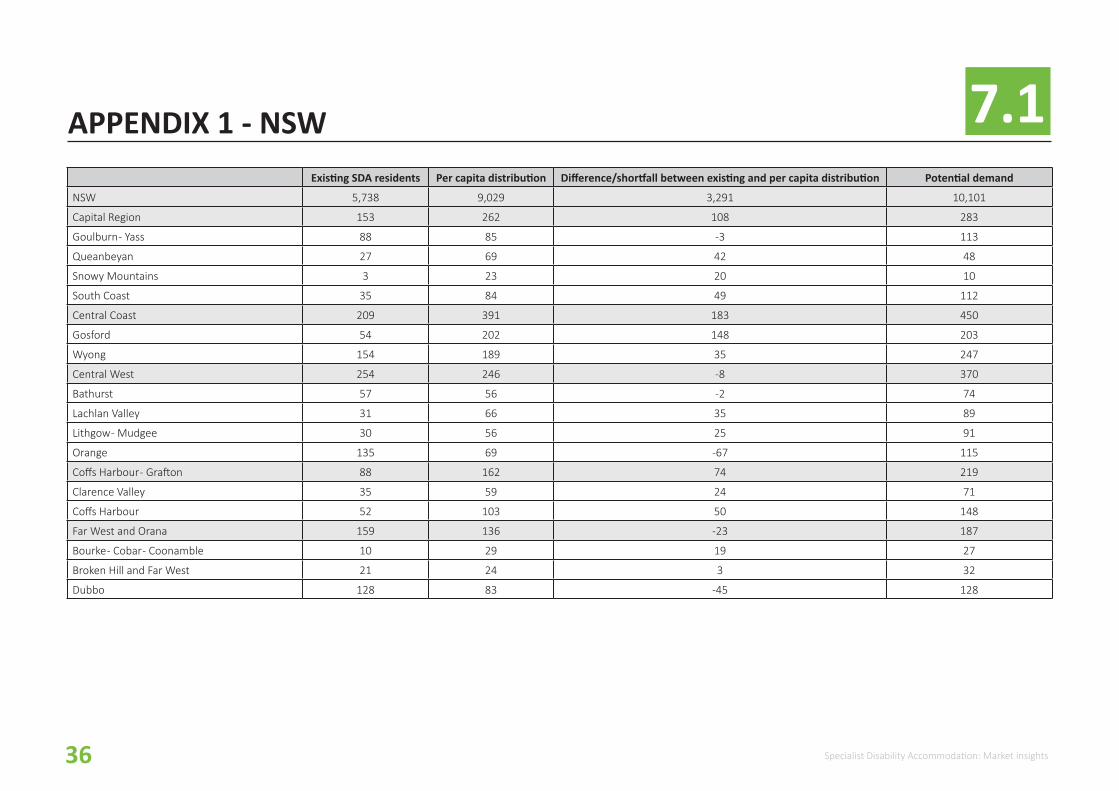
APPENDIX 1 - NSW 7.1 Existing SDA residents Per capita distribution Difference/shortfall between existing and per capita distribution Potential demand
NSW 5,738 9,029 3,291 10,101
Capital Region 153 262 108 283
Goulburn - Yass 88 85 -3 113
Queanbeyan 27 69 42 48
Snowy Mountains 3 23 20 10
South Coast 35 84 49 112
Central Coast 209 391 183 450
Gosford 54 202 148 203
Wyong 154 189 35 247
Central West 254 246 -8 370
Bathurst 57 56 -2 74
Lachlan Valley 31 66 35 89
Lithgow - Mudgee 30 56 25 91
Orange 135 69 -67 115
Coffs Harbour - Grafton 88 162 74 219
Clarence Valley 35 59 24 71
Coffs Harbour 52 103 50 148
Far West and Orana 159 136 -23 187
Bourke - Cobar - Coonamble 10 29 19 27
Broken Hill and Far West 21 24 3 32
Dubbo 128 83 -45 128
37Specialist Disability Accommodation: Market insights
Existing SDA residents Per capita distribution Difference/shortfall between existing and per capita distribution Potential demand
NSW 5,738 9,029 3,291 10,101
Capital Region 153 262 108 283
Goulburn - Yass 88 85 -3 113
Queanbeyan 27 69 42 48
Snowy Mountains 3 23 20 10
South Coast 35 84 49 112
Central Coast 209 391 183 450
Gosford 54 202 148 203
Wyong 154 189 35 247
Central West 254 246 -8 370
Bathurst 57 56 -2 74
Lachlan Valley 31 66 35 89
Lithgow - Mudgee 30 56 25 91
Orange 135 69 -67 115
Coffs Harbour - Grafton 88 162 74 219
Clarence Valley 35 59 24 71
Coffs Harbour 52 103 50 148
Far West and Orana 159 136 -23 187
Bourke - Cobar - Coonamble 10 29 19 27
Broken Hill and Far West 21 24 3 32
Dubbo 128 83 -45 128
Existing SDA residents Per capita distribution Difference/shortfall between existing and per capita distribution Potential demand
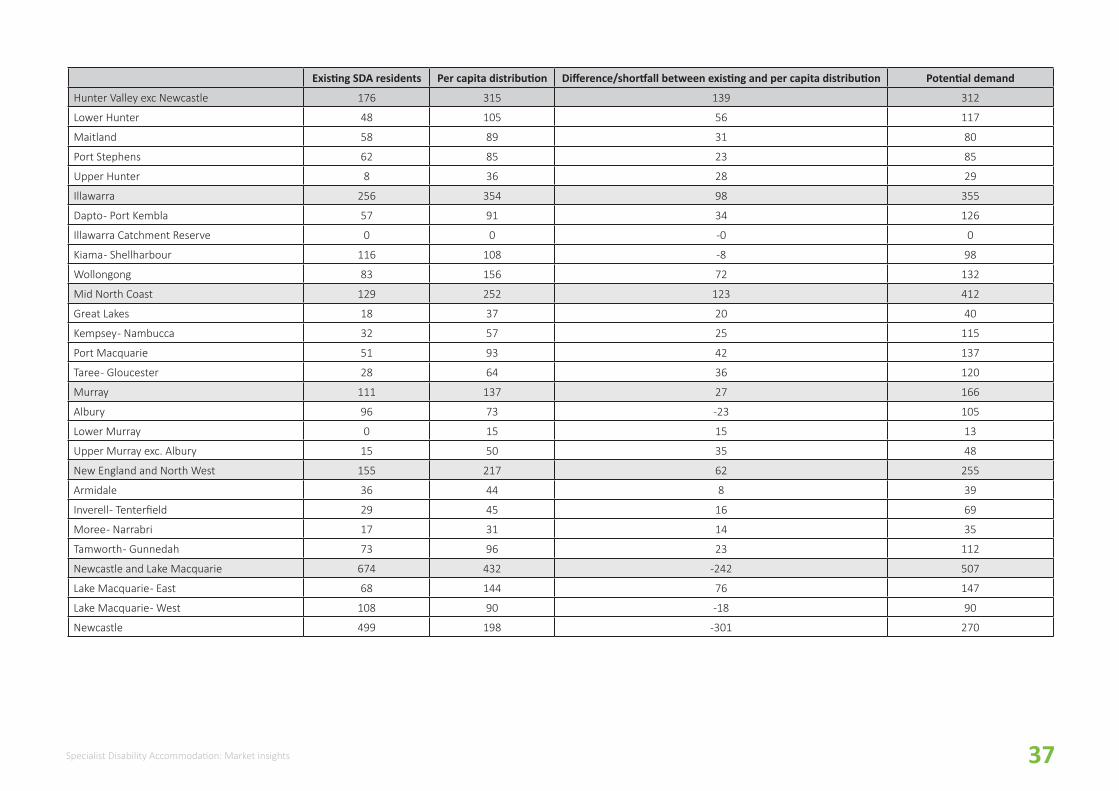
Hunter Valley exc Newcastle 176 315 139 312
Lower Hunter 48 105 56 117
Maitland 58 89 31 80
Port Stephens 62 85 23 85
Upper Hunter 8 36 28 29
Illawarra 256 354 98 355
Dapto - Port Kembla 57 91 34 126
Illawarra Catchment Reserve 0 0 -0 0
Kiama - Shellharbour 116 108 -8 98
Wollongong 83 156 72 132
Mid North Coast 129 252 123 412
Great Lakes 18 37 20 40
Kempsey - Nambucca 32 57 25 115
Port Macquarie 51 93 42 137
Taree - Gloucester 28 64 36 120
Murray 111 137 27 166
Albury 96 73 -23 105
Lower Murray 0 15 15 13
Upper Murray exc. Albury 15 50 35 48
New England and North West 155 217 62 255
Armidale 36 44 8 39
Inverell - Tenterfield 29 45 16 69
Moree - Narrabri 17 31 14 35
Tamworth - Gunnedah 73 96 23 112
Newcastle and Lake Macquarie 674 432 -242 507
Lake Macquarie - East 68 144 76 147
Lake Macquarie - West 108 90 -18 90
Newcastle 499 198 -301 270
38 Specialist Disability Accommodation: Market insights
Existing SDA residents Per capita distribution Difference/shortfall between existing and per capita distribution Potential demand
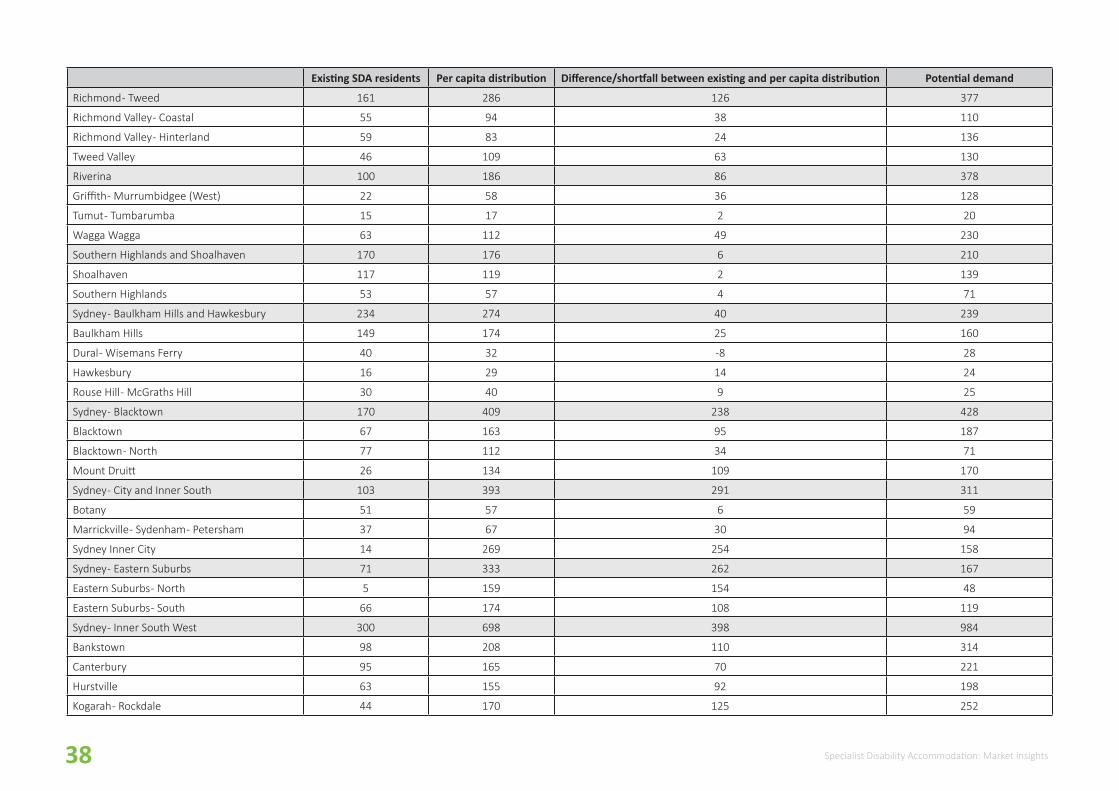
Richmond - Tweed 161 286 126 377
Richmond Valley - Coastal 55 94 38 110
Richmond Valley - Hinterland 59 83 24 136
Tweed Valley 46 109 63 130
Riverina 100 186 86 378
Griffith - Murrumbidgee (West) 22 58 36 128
Tumut - Tumbarumba 15 17 2 20
Wagga Wagga 63 112 49 230
Southern Highlands and Shoalhaven 170 176 6 210
Shoalhaven 117 119 2 139
Southern Highlands 53 57 4 71
Sydney - Baulkham Hills and Hawkesbury 234 274 40 239
Baulkham Hills 149 174 25 160
Dural - Wisemans Ferry 40 32 -8 28
Hawkesbury 16 29 14 24
Rouse Hill - McGraths Hill 30 40 9 25
Sydney - Blacktown 170 409 238 428
Blacktown 67 163 95 187
Blacktown - North 77 112 34 71
Mount Druitt 26 134 109 170
Sydney - City and Inner South 103 393 291 311
Botany 51 57 6 59
Marrickville - Sydenham - Petersham 37 67 30 94
Sydney Inner City 14 269 254 158
Sydney - Eastern Suburbs 71 333 262 167
Eastern Suburbs - North 5 159 154 48
Eastern Suburbs - South 66 174 108 119
Sydney - Inner South West 300 698 398 984
Bankstown 98 208 110 314
Canterbury 95 165 70 221
Hurstville 63 155 92 198
Kogarah - Rockdale 44 170 125 252
39Specialist Disability Accommodation: Market insights
Existing SDA residents Per capita distribution Difference/shortfall between existing and per capita distribution Potential demand
Richmond - Tweed 161 286 126 377
Richmond Valley - Coastal 55 94 38 110
Richmond Valley - Hinterland 59 83 24 136
Tweed Valley 46 109 63 130
Riverina 100 186 86 378
Griffith - Murrumbidgee (West) 22 58 36 128
Tumut - Tumbarumba 15 17 2 20
Wagga Wagga 63 112 49 230
Southern Highlands and Shoalhaven 170 176 6 210
Shoalhaven 117 119 2 139
Southern Highlands 53 57 4 71
Sydney - Baulkham Hills and Hawkesbury 234 274 40 239
Baulkham Hills 149 174 25 160
Dural - Wisemans Ferry 40 32 -8 28
Hawkesbury 16 29 14 24
Rouse Hill - McGraths Hill 30 40 9 25
Sydney - Blacktown 170 409 238 428
Blacktown 67 163 95 187
Blacktown - North 77 112 34 71
Mount Druitt 26 134 109 170
Sydney - City and Inner South 103 393 291 311
Botany 51 57 6 59
Marrickville - Sydenham - Petersham 37 67 30 94
Sydney Inner City 14 269 254 158
Sydney - Eastern Suburbs 71 333 262 167
Eastern Suburbs - North 5 159 154 48
Eastern Suburbs - South 66 174 108 119
Sydney - Inner South West 300 698 398 984
Bankstown 98 208 110 314
Canterbury 95 165 70 221
Hurstville 63 155 92 198
Kogarah - Rockdale 44 170 125 252
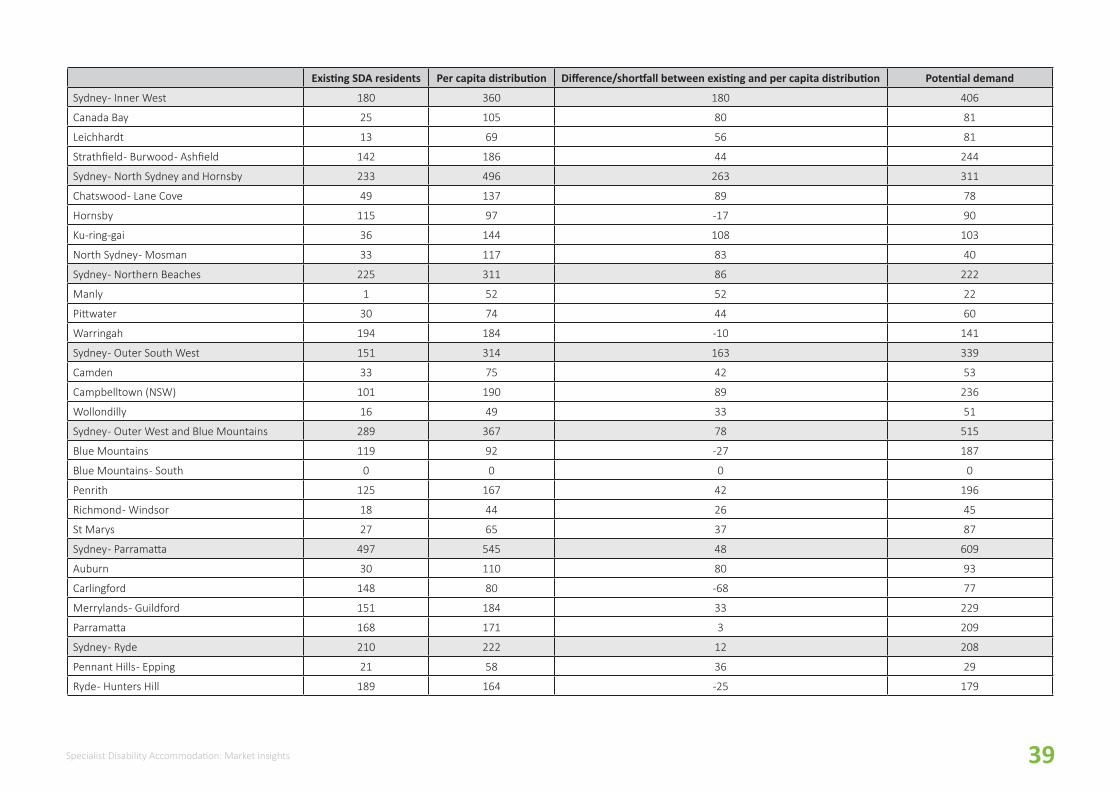
Existing SDA residents Per capita distribution Difference/shortfall between existing and per capita distribution Potential demand
Sydney - Inner West 180 360 180 406
Canada Bay 25 105 80 81
Leichhardt 13 69 56 81
Strathfield - Burwood - Ashfield 142 186 44 244
Sydney - North Sydney and Hornsby 233 496 263 311
Chatswood - Lane Cove 49 137 89 78
Hornsby 115 97 -17 90
Ku-ring-gai 36 144 108 103
North Sydney - Mosman 33 117 83 40
Sydney - Northern Beaches 225 311 86 222
Manly 1 52 52 22
Pittwater 30 74 44 60
Warringah 194 184 -10 141
Sydney - Outer South West 151 314 163 339
Camden 33 75 42 53
Campbelltown (NSW) 101 190 89 236
Wollondilly 16 49 33 51
Sydney - Outer West and Blue Mountains 289 367 78 515
Blue Mountains 119 92 -27 187
Blue Mountains - South 0 0 0 0
Penrith 125 167 42 196
Richmond - Windsor 18 44 26 45
St Marys 27 65 37 87
Sydney - Parramatta 497 545 48 609
Auburn 30 110 80 93
Carlingford 148 80 -68 77
Merrylands - Guildford 151 184 33 229
Parramatta 168 171 3 209
Sydney - Ryde 210 222 12 208
Pennant Hills - Epping 21 58 36 29
Ryde - Hunters Hill 189 164 -25 179
40 Specialist Disability Accommodation: Market insights
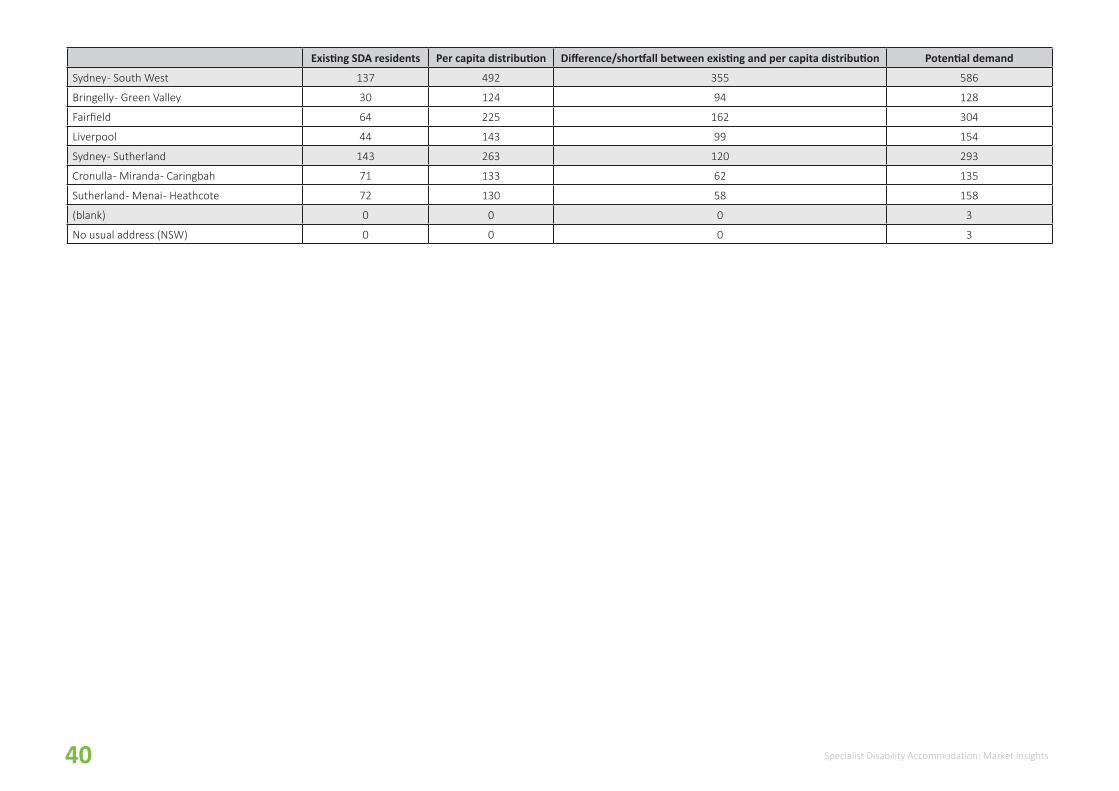
Existing SDA residents Per capita distribution Difference/shortfall between existing and per capita distribution Potential demand
Sydney - South West 137 492 355 586
Bringelly - Green Valley 30 124 94 128
Fairfield 64 225 162 304
Liverpool 44 143 99 154
Sydney - Sutherland 143 263 120 293
Cronulla - Miranda - Caringbah 71 133 62 135
Sutherland - Menai - Heathcote 72 130 58 158
(blank) 0 0 0 3
No usual address (NSW) 0 0 0 3

41Specialist Disability Accommodation: Market insights
7.2APPENDIX 2 - VICTORIA Existing SDA residents Per capita distribution Difference/shortfall between existing and per capita distribution Potential demand
VIC 4,264 7,209 2,945 7,390
Ballarat 144 186 42 225
Ballarat 123 123 0 162
Creswick - Daylesford - Ballan 3 34 30 24
Maryborough - Pyrenees 18 30 12 39
Bendigo 141 181 39 203
Bendigo 114 112 -2 136
Heathcote - Castlemaine - Kyneton 25 56 30 55
Loddon - Elmore 2 13 11 12
Geelong 21 333 312 196
Barwon - West 0 22 22 15
Geelong 20 224 204 155
Surf Coast - Bellarine Peninsula 0 86 86 26
Hume 127 200 73 267
Upper Goulburn Valley 10 63 53 88
Wangaratta - Benalla 53 54 1 82
Wodonga - Alpine 64 83 19 97
Latrobe - Gippsland 195 320 125 381
Baw Baw 43 57 14 60
Gippsland - East 38 53 15 51
Gippsland - South West 24 73 49 57
Latrobe Valley 62 87 25 142
Wellington 28 51 22 72
Melbourne - Inner 237 742 505 541
Brunswick - Coburg 36 107 71 125
Darebin - South 73 64 -8 68
Essendon 22 82 60 54

42 Specialist Disability Accommodation: Market insights
Existing SDA residents Per capita distribution Difference/shortfall between existing and per capita distribution Potential demand
Melbourne City 6 173 167 82
Port Phillip 21 127 106 88
Stonnington - West 4 79 75 44
Yarra 76 110 34 80
Melbourne - Inner East 436 444 7 492
Boroondara 137 207 70 241
Manningham - West 56 112 56 112
Whitehorse - West 244 125 -118 139
Melbourne - Inner South 409 497 88 387
Bayside 89 120 31 77
Glen Eira 144 183 39 149
Kingston 160 143 -17 124
Stonnington - East 15 51 36 37
Melbourne - North East 527 607 80 647
Banyule 177 149 -28 178
Darebin - North 179 116 -63 147
Nillumbik - Kinglake 17 80 63 64
Whittlesea - Wallan 154 262 108 259
Melbourne - North West 171 446 275 612
Keilor 35 72 36 98
Macedon Ranges 0 36 35 22
Moreland - North 79 93 14 154
Sunbury 29 48 19 30
Tullamarine - Broadmeadows 28 198 170 309
Melbourne - Outer East 530 608 77 696
Knox 92 187 95 223
Manningham - East 2 32 30 25
Maroondah 169 134 -36 185
Whitehorse - East 111 74 -37 75
Yarra Ranges 155 180 25 188
Melbourne - South East 314 926 612 812
Cardinia 10 114 104 68
43Specialist Disability Accommodation: Market insights
Existing SDA residents Per capita distribution Difference/shortfall between existing and per capita distribution Potential demand
Melbourne City 6 173 167 82
Port Phillip 21 127 106 88
Stonnington - West 4 79 75 44
Yarra 76 110 34 80
Melbourne - Inner East 436 444 7 492
Boroondara 137 207 70 241
Manningham - West 56 112 56 112
Whitehorse - West 244 125 -118 139
Melbourne - Inner South 409 497 88 387
Bayside 89 120 31 77
Glen Eira 144 183 39 149
Kingston 160 143 -17 124
Stonnington - East 15 51 36 37
Melbourne - North East 527 607 80 647
Banyule 177 149 -28 178
Darebin - North 179 116 -63 147
Nillumbik - Kinglake 17 80 63 64
Whittlesea - Wallan 154 262 108 259
Melbourne - North West 171 446 275 612
Keilor 35 72 36 98
Macedon Ranges 0 36 35 22
Moreland - North 79 93 14 154
Sunbury 29 48 19 30
Tullamarine - Broadmeadows 28 198 170 309
Melbourne - Outer East 530 608 77 696
Knox 92 187 95 223
Manningham - East 2 32 30 25
Maroondah 169 134 -36 185
Whitehorse - East 111 74 -37 75
Yarra Ranges 155 180 25 188
Melbourne - South East 314 926 612 812
Cardinia 10 114 104 68
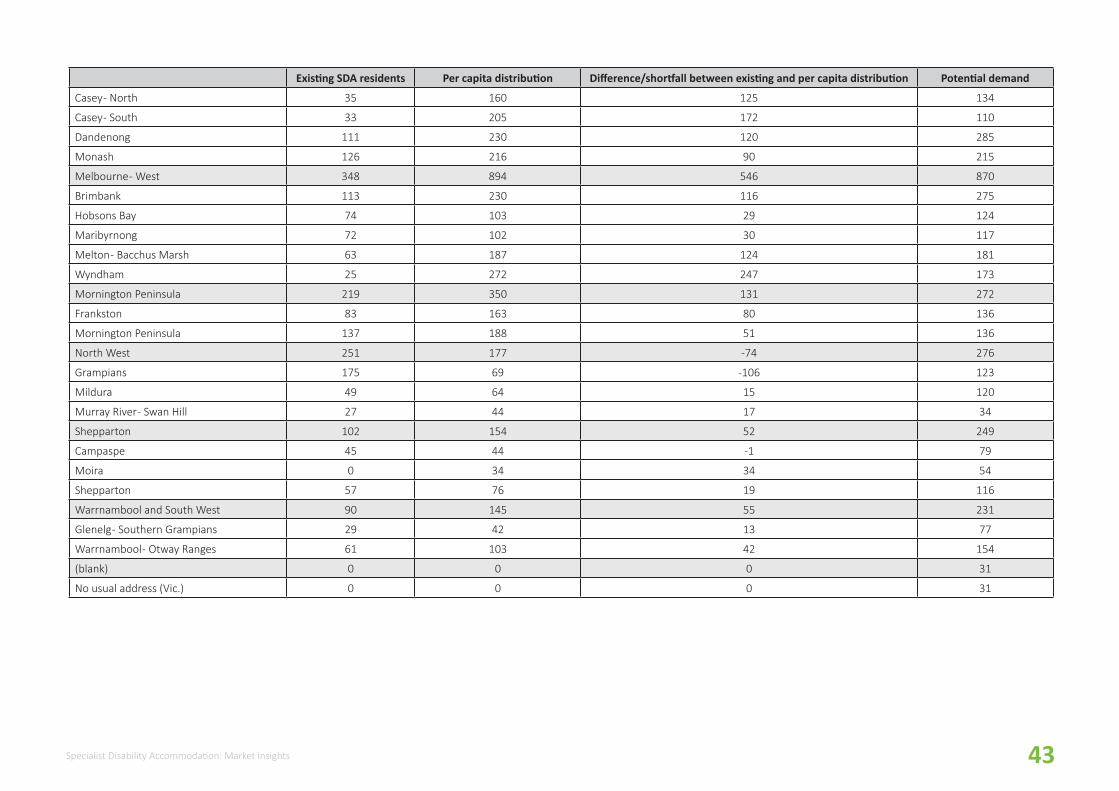
Existing SDA residents Per capita distribution Difference/shortfall between existing and per capita distribution Potential demand
Casey - North 35 160 125 134
Casey - South 33 205 172 110
Dandenong 111 230 120 285
Monash 126 216 90 215
Melbourne - West 348 894 546 870
Brimbank 113 230 116 275
Hobsons Bay 74 103 29 124
Maribyrnong 72 102 30 117
Melton - Bacchus Marsh 63 187 124 181
Wyndham 25 272 247 173
Mornington Peninsula 219 350 131 272
Frankston 83 163 80 136
Mornington Peninsula 137 188 51 136
North West 251 177 -74 276
Grampians 175 69 -106 123
Mildura 49 64 15 120
Murray River - Swan Hill 27 44 17 34
Shepparton 102 154 52 249
Campaspe 45 44 -1 79
Moira 0 34 34 54
Shepparton 57 76 19 116
Warrnambool and South West 90 145 55 231
Glenelg - Southern Grampians 29 42 13 77
Warrnambool - Otway Ranges 61 103 42 154
(blank) 0 0 0 31
No usual address (Vic.) 0 0 0 31

44 Specialist Disability Accommodation: Market insights
7.3APPENDIX 3 - QUEENSLAND Existing SDA residents Per capita distribution Difference/shortfall between existing and per capita distribution Potential demand
QLD 3,342 5,657 2,315 7,843
Brisbane - East 152 270 118 346
Capalaba 65 87 21 133
Cleveland - Stradbroke 44 100 56 119
Wynnum - Manly 43 83 40 93
Brisbane - North 211 250 39 393
Bald Hills - Everton Park 19 49 30 69
Chermside 49 84 34 131
Nundah 49 47 -2 68
Sandgate 95 70 -24 125
Brisbane - South 173 416 243 561
Carindale 10 61 51 62
Holland Park - Yeronga 31 87 56 118
Mt Gravatt 25 87 62 127
Nathan 40 47 8 78
Rocklea - Acacia Ridge 17 72 56 88
Sunnybank 49 61 12 87
Brisbane - West 106 218 112 268
Centenary 33 39 7 60
Kenmore - Brookfield - Moggill 18 55 37 70
Sherwood - Indooroopilly 41 63 21 59
The Gap - Enoggera 14 61 46 79
Brisbane Inner City 111 309 198 339
Brisbane Inner 8 84 76 97
Brisbane Inner - East 11 50 39 46
Brisbane Inner - North 65 106 40 119
Brisbane Inner - West 26 69 43 76
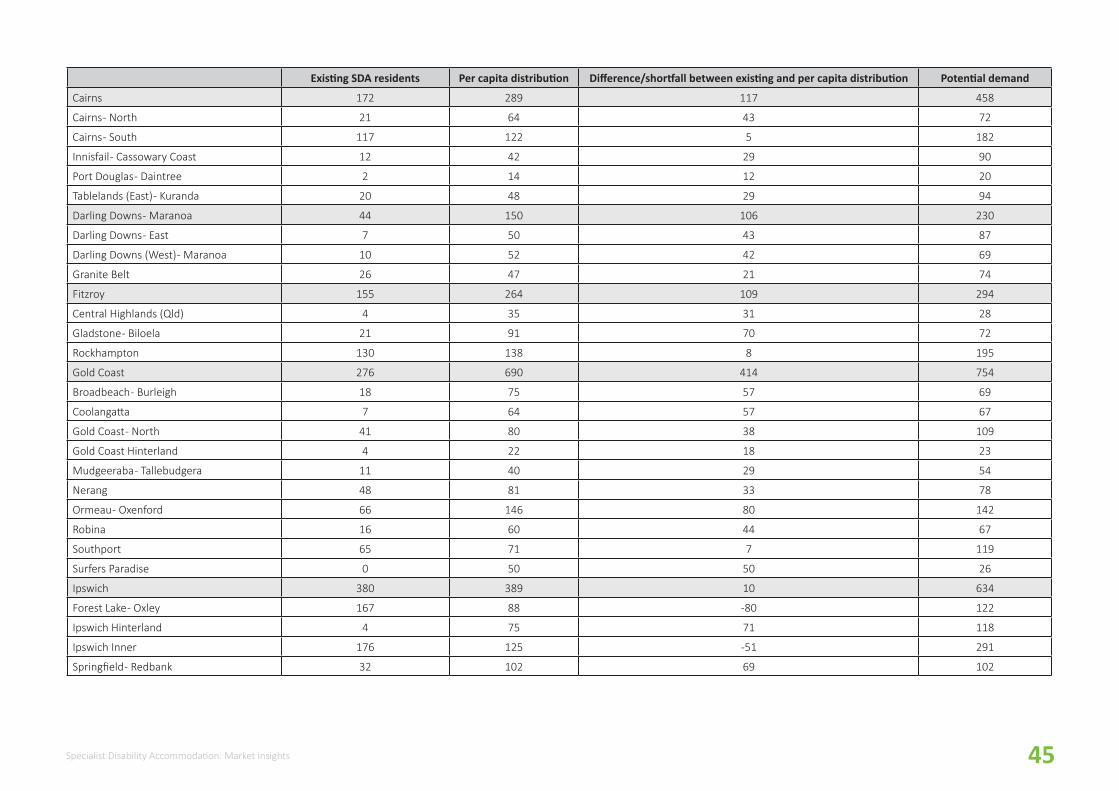
45Specialist Disability Accommodation: Market insights
Existing SDA residents Per capita distribution Difference/shortfall between existing and per capita distribution Potential demand
Cairns 172 289 117 458
Cairns - North 21 64 43 72
Cairns - South 117 122 5 182
Innisfail - Cassowary Coast 12 42 29 90
Port Douglas - Daintree 2 14 12 20
Tablelands (East) - Kuranda 20 48 29 94
Darling Downs - Maranoa 44 150 106 230
Darling Downs - East 7 50 43 87
Darling Downs (West) - Maranoa 10 52 42 69
Granite Belt 26 47 21 74
Fitzroy 155 264 109 294
Central Highlands (Qld) 4 35 31 28
Gladstone - Biloela 21 91 70 72
Rockhampton 130 138 8 195
Gold Coast 276 690 414 754
Broadbeach - Burleigh 18 75 57 69
Coolangatta 7 64 57 67
Gold Coast - North 41 80 38 109
Gold Coast Hinterland 4 22 18 23
Mudgeeraba - Tallebudgera 11 40 29 54
Nerang 48 81 33 78
Ormeau - Oxenford 66 146 80 142
Robina 16 60 44 67
Southport 65 71 7 119
Surfers Paradise 0 50 50 26
Ipswich 380 389 10 634
Forest Lake - Oxley 167 88 -80 122
Ipswich Hinterland 4 75 71 118
Ipswich Inner 176 125 -51 291
Springfield - Redbank 32 102 69 102
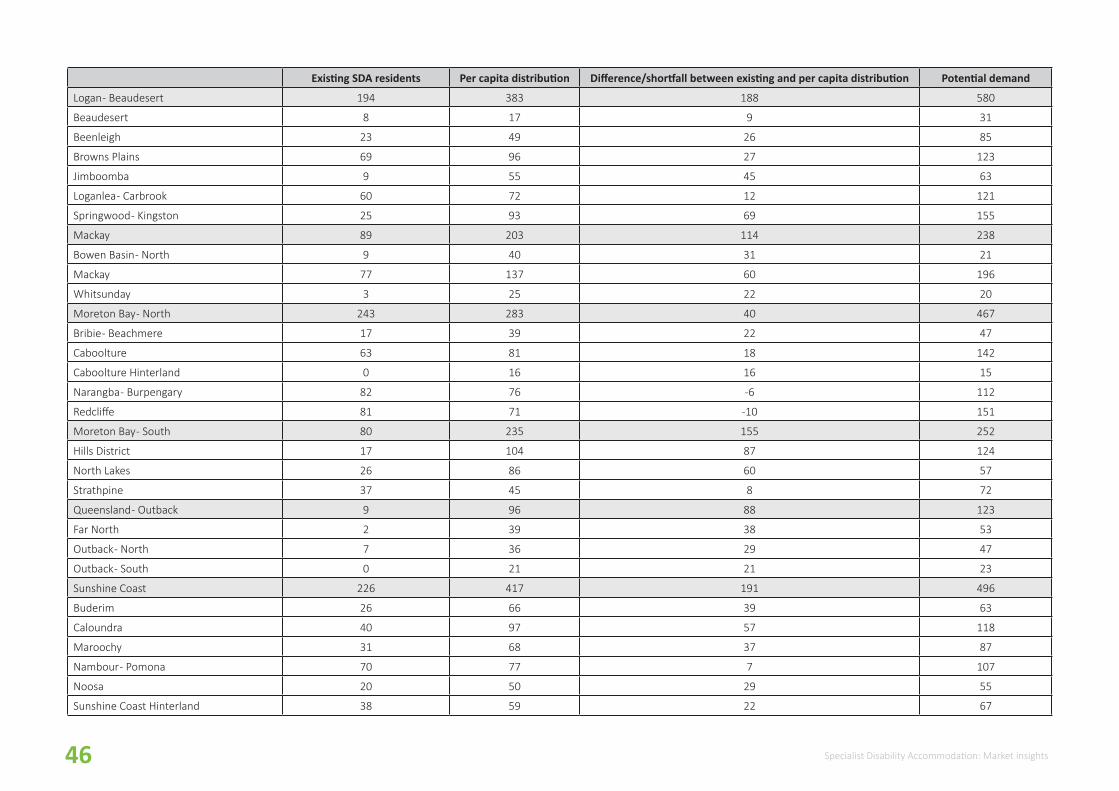
46 Specialist Disability Accommodation: Market insights
Existing SDA residents Per capita distribution Difference/shortfall between existing and per capita distribution Potential demand
Logan - Beaudesert 194 383 188 580
Beaudesert 8 17 9 31
Beenleigh 23 49 26 85
Browns Plains 69 96 27 123
Jimboomba 9 55 45 63
Loganlea - Carbrook 60 72 12 121
Springwood - Kingston 25 93 69 155
Mackay 89 203 114 238
Bowen Basin - North 9 40 31 21
Mackay 77 137 60 196
Whitsunday 3 25 22 20
Moreton Bay - North 243 283 40 467
Bribie - Beachmere 17 39 22 47
Caboolture 63 81 18 142
Caboolture Hinterland 0 16 16 15
Narangba - Burpengary 82 76 -6 112
Redcliffe 81 71 -10 151
Moreton Bay - South 80 235 155 252
Hills District 17 104 87 124
North Lakes 26 86 60 57
Strathpine 37 45 8 72
Queensland - Outback 9 96 88 123
Far North 2 39 38 53
Outback - North 7 36 29 47
Outback - South 0 21 21 23
Sunshine Coast 226 417 191 496
Buderim 26 66 39 63
Caloundra 40 97 57 118
Maroochy 31 68 37 87
Nambour - Pomona 70 77 7 107
Noosa 20 50 29 55
Sunshine Coast Hinterland 38 59 22 67
47Specialist Disability Accommodation: Market insights
Existing SDA residents Per capita distribution Difference/shortfall between existing and per capita distribution Potential demand
Logan - Beaudesert 194 383 188 580
Beaudesert 8 17 9 31
Beenleigh 23 49 26 85
Browns Plains 69 96 27 123
Jimboomba 9 55 45 63
Loganlea - Carbrook 60 72 12 121
Springwood - Kingston 25 93 69 155
Mackay 89 203 114 238
Bowen Basin - North 9 40 31 21
Mackay 77 137 60 196
Whitsunday 3 25 22 20
Moreton Bay - North 243 283 40 467
Bribie - Beachmere 17 39 22 47
Caboolture 63 81 18 142
Caboolture Hinterland 0 16 16 15
Narangba - Burpengary 82 76 -6 112
Redcliffe 81 71 -10 151
Moreton Bay - South 80 235 155 252
Hills District 17 104 87 124
North Lakes 26 86 60 57
Strathpine 37 45 8 72
Queensland - Outback 9 96 88 123
Far North 2 39 38 53
Outback - North 7 36 29 47
Outback - South 0 21 21 23
Sunshine Coast 226 417 191 496
Buderim 26 66 39 63
Caloundra 40 97 57 118
Maroochy 31 68 37 87
Nambour - Pomona 70 77 7 107
Noosa 20 50 29 55
Sunshine Coast Hinterland 38 59 22 67
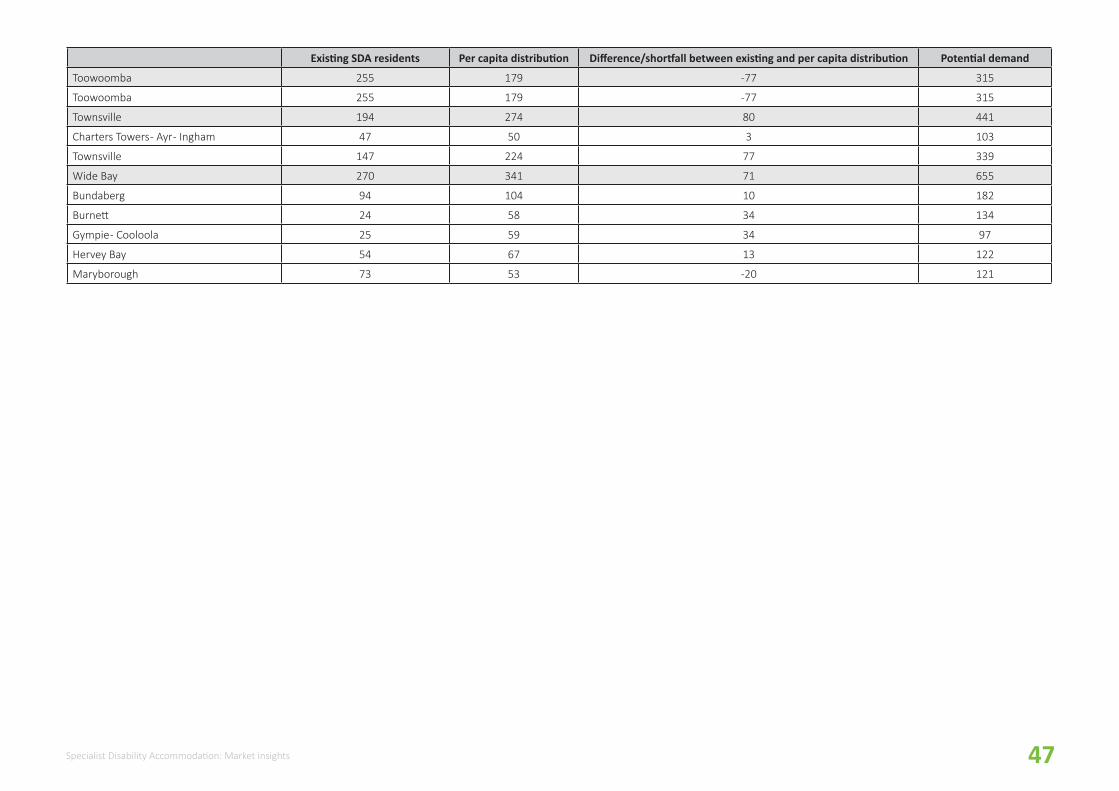
Existing SDA residents Per capita distribution Difference/shortfall between existing and per capita distribution Potential demand
Toowoomba 255 179 -77 315
Toowoomba 255 179 -77 315
Townsville 194 274 80 441
Charters Towers - Ayr - Ingham 47 50 3 103
Townsville 147 224 77 339
Wide Bay 270 341 71 655
Bundaberg 94 104 10 182
Burnett 24 58 34 134
Gympie - Cooloola 25 59 34 97
Hervey Bay 54 67 13 122
Maryborough 73 53 -20 121
48 Specialist Disability Accommodation: Market insights
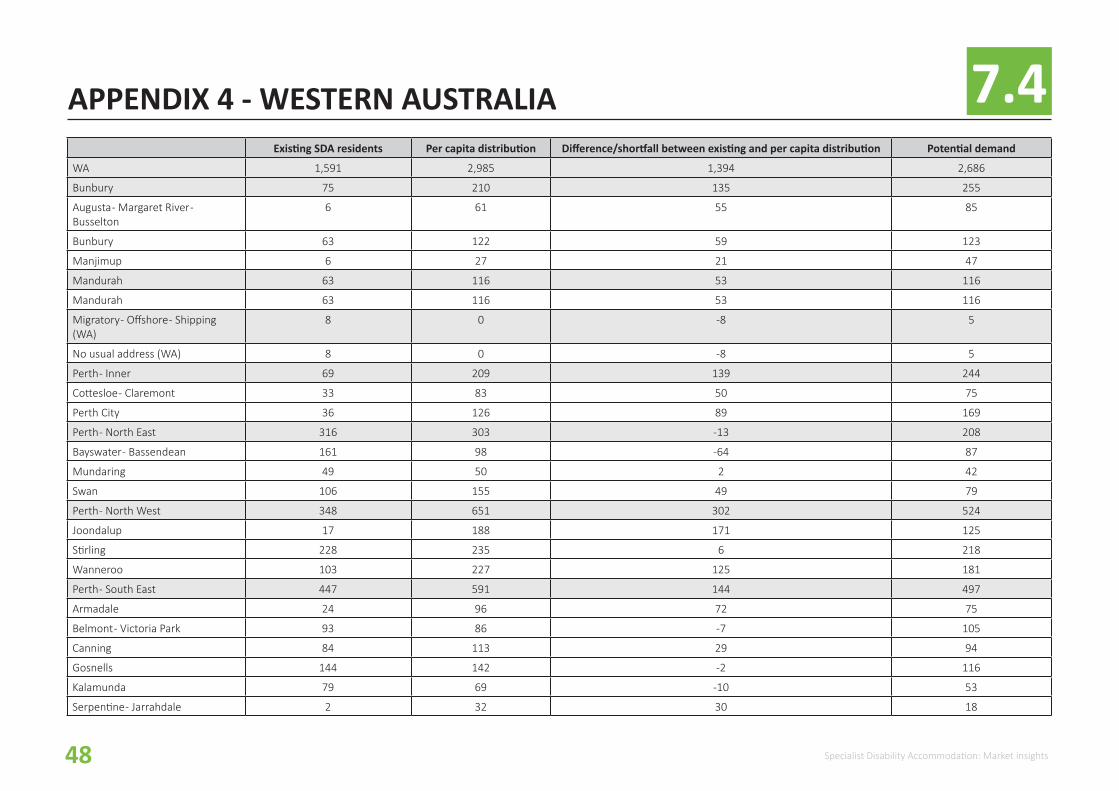
7.4APPENDIX 4 - WESTERN AUSTRALIA Existing SDA residents Per capita distribution Difference/shortfall between existing and per capita distribution Potential demand
WA 1,591 2,985 1,394 2,686
Bunbury 75 210 135 255
Augusta - Margaret River - Busselton
6 61 55 85
Bunbury 63 122 59 123
Manjimup 6 27 21 47
Mandurah 63 116 53 116
Mandurah 63 116 53 116
Migratory - Offshore - Shipping (WA)
8 0 -8 5
No usual address (WA) 8 0 -8 5
Perth - Inner 69 209 139 244
Cottesloe - Claremont 33 83 50 75
Perth City 36 126 89 169
Perth - North East 316 303 -13 208
Bayswater - Bassendean 161 98 -64 87
Mundaring 49 50 2 42
Swan 106 155 49 79
Perth - North West 348 651 302 524
Joondalup 17 188 171 125
Stirling 228 235 6 218
Wanneroo 103 227 125 181
Perth - South East 447 591 144 497
Armadale 24 96 72 75
Belmont - Victoria Park 93 86 -7 105
Canning 84 113 29 94
Gosnells 144 142 -2 116
Kalamunda 79 69 -10 53
Serpentine - Jarrahdale 2 32 30 18
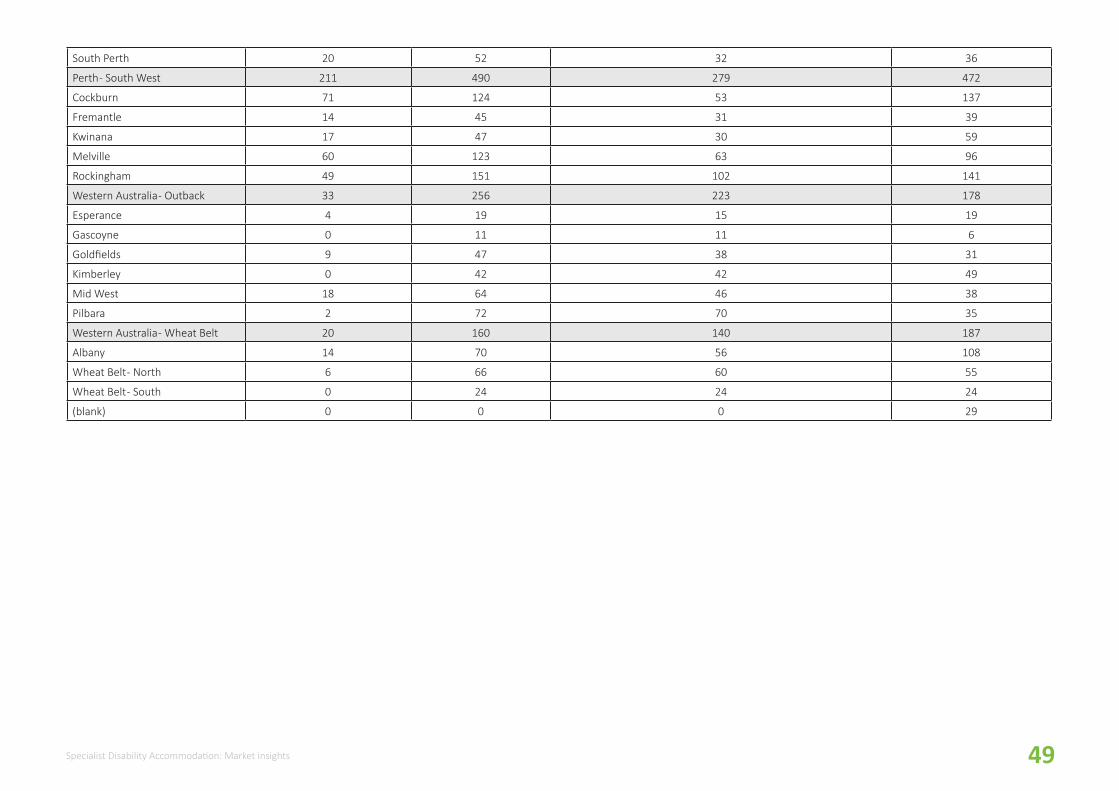
49Specialist Disability Accommodation: Market insights
South Perth 20 52 32 36
Perth - South West 211 490 279 472
Cockburn 71 124 53 137
Fremantle 14 45 31 39
Kwinana 17 47 30 59
Melville 60 123 63 96
Rockingham 49 151 102 141
Western Australia - Outback 33 256 223 178
Esperance 4 19 15 19
Gascoyne 0 11 11 6
Goldfields 9 47 38 31
Kimberley 0 42 42 49
Mid West 18 64 46 38
Pilbara 2 72 70 35
Western Australia - Wheat Belt 20 160 140 187
Albany 14 70 56 108
Wheat Belt - North 6 66 60 55
Wheat Belt - South 0 24 24 24
(blank) 0 0 0 29

50 Specialist Disability Accommodation: Market insights
7.5APPENDIX 5 - SOUTH AUSTRALIA Existing SDA residents Per capita distribution Difference/shortfall between existing and per capita distribution Potential demand
SA 1,721 1,999 278 3,470
Adelaide - Central and Hills 254 347 93 458
Adelaide City 1 27 26 49
Adelaide Hills 34 85 51 96
Burnside 27 53 26 63
Campbelltown (SA) 75 60 -15 79
Norwood - Payneham - St Peters 26 43 16 60
Prospect - Walkerville 14 34 19 45
Unley 77 45 -31 65
Adelaide - North 457 503 45 1,015
Gawler - Two Wells 14 41 26 68
Playford 86 107 20 242
Port Adelaide - East 192 81 -111 186
Salisbury 129 163 33 373
Tea Tree Gully 35 111 76 146
Adelaide - South 540 423 -117 689
Holdfast Bay 167 40 -126 75
Marion 208 107 -101 213
Mitcham 79 76 -3 114
Onkaparinga 86 199 113 287
Adelaide - West 220 272 52 573
Charles Sturt 118 130 12 275
Port Adelaide - West 58 69 11 183
West Torrens 44 73 29 116
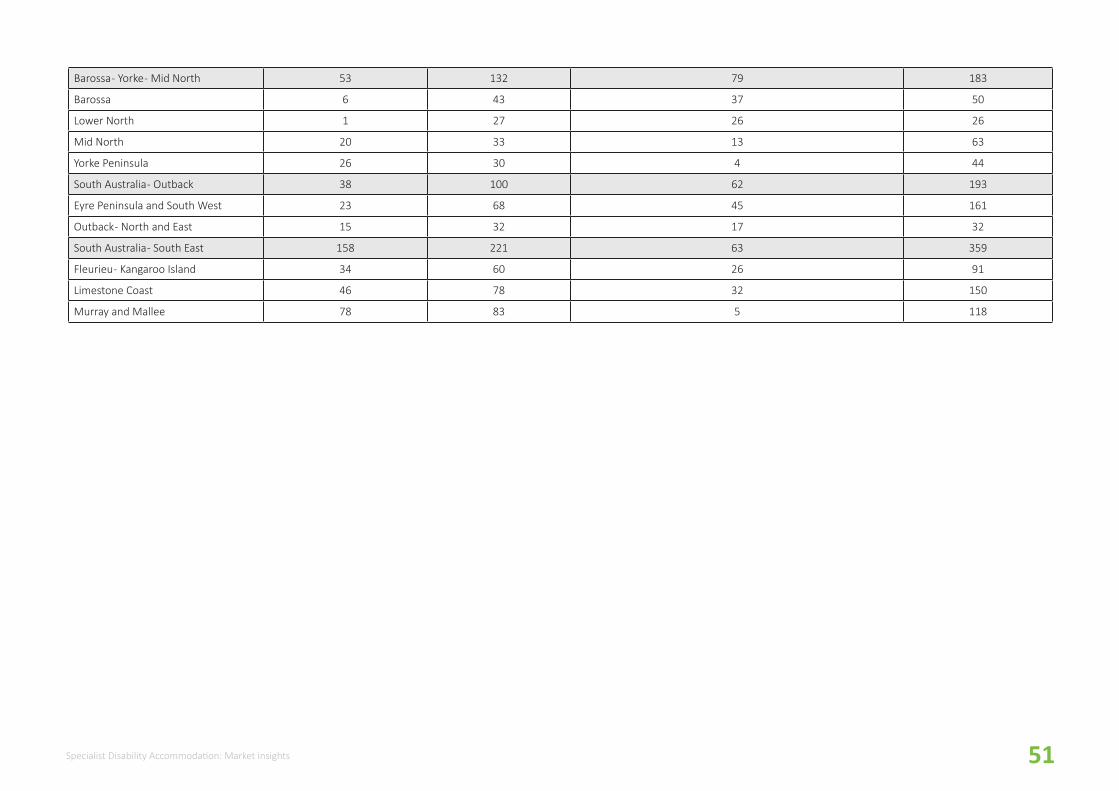
51Specialist Disability Accommodation: Market insights
Barossa - Yorke - Mid North 53 132 79 183
Barossa 6 43 37 50
Lower North 1 27 26 26
Mid North 20 33 13 63
Yorke Peninsula 26 30 4 44
South Australia - Outback 38 100 62 193
Eyre Peninsula and South West 23 68 45 161
Outback - North and East 15 32 17 32
South Australia - South East 158 221 63 359
Fleurieu - Kangaroo Island 34 60 26 91
Limestone Coast 46 78 32 150
Murray and Mallee 78 83 5 118
52 Specialist Disability Accommodation: Market insights
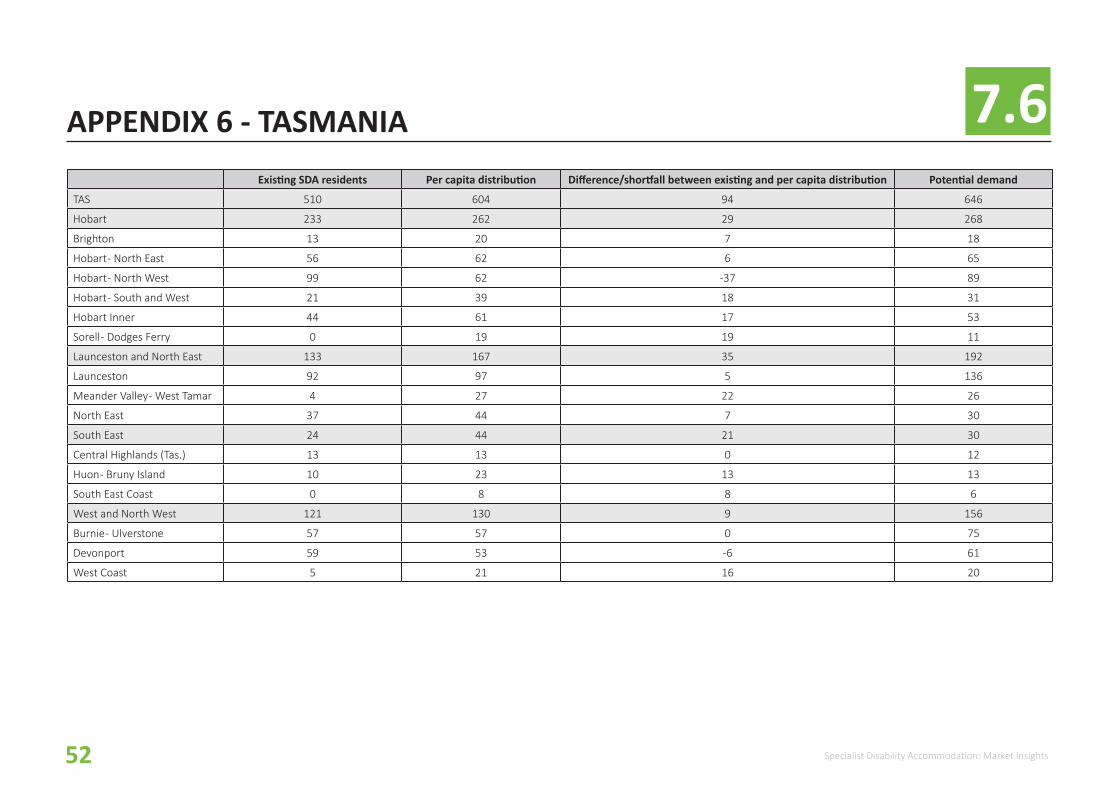
7.6APPENDIX 6 - TASMANIA Existing SDA residents Per capita distribution Difference/shortfall between existing and per capita distribution Potential demand
TAS 510 604 94 646
Hobart 233 262 29 268
Brighton 13 20 7 18
Hobart - North East 56 62 6 65
Hobart - North West 99 62 -37 89
Hobart - South and West 21 39 18 31
Hobart Inner 44 61 17 53
Sorell - Dodges Ferry 0 19 19 11
Launceston and North East 133 167 35 192
Launceston 92 97 5 136
Meander Valley - West Tamar 4 27 22 26
North East 37 44 7 30
South East 24 44 21 30
Central Highlands (Tas.) 13 13 0 12
Huon - Bruny Island 10 23 13 13
South East Coast 0 8 8 6
West and North West 121 130 9 156
Burnie - Ulverstone 57 57 0 75
Devonport 59 53 -6 61
West Coast 5 21 16 20
53Specialist Disability Accommodation: Market insights
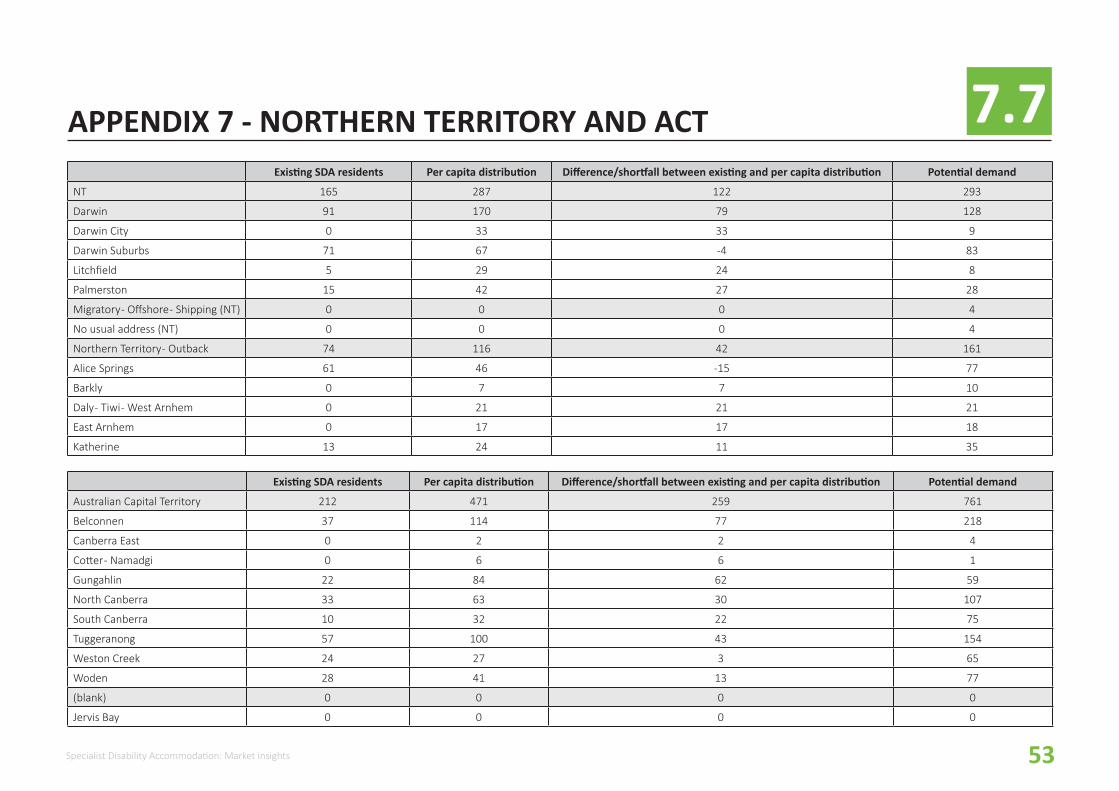
7.7APPENDIX 7 - NORTHERN TERRITORY AND ACT Existing SDA residents Per capita distribution Difference/shortfall between existing and per capita distribution Potential demand
NT 165 287 122 293
Darwin 91 170 79 128
Darwin City 0 33 33 9
Darwin Suburbs 71 67 -4 83
Litchfield 5 29 24 8
Palmerston 15 42 27 28
Migratory - Offshore - Shipping (NT) 0 0 0 4
No usual address (NT) 0 0 0 4
Northern Territory - Outback 74 116 42 161
Alice Springs 61 46 -15 77
Barkly 0 7 7 10
Daly - Tiwi - West Arnhem 0 21 21 21
East Arnhem 0 17 17 18
Katherine 13 24 11 35
Existing SDA residents Per capita distribution Difference/shortfall between existing and per capita distribution Potential demand
Australian Capital Territory 212 471 259 761
Belconnen 37 114 77 218
Canberra East 0 2 2 4
Cotter - Namadgi 0 6 6 1
Gungahlin 22 84 62 59
North Canberra 33 63 30 107
South Canberra 10 32 22 75
Tuggeranong 57 100 43 154
Weston Creek 24 27 3 65
Woden 28 41 13 77
(blank) 0 0 0 0
Jervis Bay 0 0 0 0
54 Specialist Disability Accommodation: Market insights
7.8APPENDIX 8 - TECHNICAL NOTES DATA AND THE APPROACH
� Administrative data is sourced from the annual Disability Services National Minimum Data Set compiled by AIHW and is for the period 2013-14 for NSW and ACT and for the period 2015-16 for all other jurisdictions.
� This dataset provide the most comprehensive picture of disability service users in state disability systems prior to transition to the NDIS.
� Administrative data on people under 65 years living in residential aged care is from the AIHW National Aged Care Data Clearinghouse, as at 30 June 2016.
� The analysis of the AIHW datat has been undertaken on the basis of statistical areas (SAs) used by the Australian Bureau of Statistics – data analysed at the SA4 and SA3 level. For maps of these statistical areas visit: http://stat.abs.gov.au/itt/r.jsp?ABSMaps
� Three data sets were analysed for this report: (1) disability service users living in existing supported accommodation (SDA) (2) disability service users with very high support needs living in settings other than an “accommodation service” (3) residential aged care users who are aged under 65 years
� For disability service users living in settings other than an “accommodation service”, “very high support needs” were defined as those service users requiring support all the time in two or more of five core life areas: -
� Self-care � Mobility � Communication � Interpersonal interactions and relationships � Domestic life
� This definition aimed to identify people with a very high level of in-home support required and a likely need for highly accessible housing. This was considered a reasonable proxy for identifying people who may be eligible for SDA payments under the NDIS.
� All data is based on adults aged 18-64 years.
55Specialist Disability Accommodation: Market insights
APPENDIX 9 - TECHNICAL NOTESSOURCES AND ASSUMPTIONS
� The disability service data is a snapshot in time of service users in the state-based disability systems prior to commencement of NDIS transition (2013-14 for NSW and ACT; 2015-16 for other jurisdictions)
� This data does not capture people in need of disability support services but who were not either using disability services or permanently residing in aged care for the relevant year. Missing cohorts could include those residing in hospital settings, justice settings, homeless or entirely supported by family and not accessing disability support.
� The analysis identifies existing supply of SDA (supported accommodation).
� 13% (2,341 places) are in settings with more than 7 residents and will require replacement. The remaining SDA stock comprises group homes; not all existing supply is expected to remain in the future SDA profile due to increasing user choice and alternatives developed in the SDA supply market more aligned with user preferences.
� A proportion of existing SDA supply will also require replacement due to age and condition.
� Existing SDA supply has been funded under state disability programs and the location and type of supply reflects historic funding and administrative decisions.
� Analysis of SDA demand in this report is based on current location of people with very high support needs and does not necessarily reflect preferred locations. This is particularly relevant for areas lacking SDA supply or with undersupply of other disability services, for example remote and very regional locations. People with disability from these locations may be residing in larger urban centres but wish to return to their communities when provided with this option.

56 Specialist Disability Accommodation: Market insights
EFFECTIVE JOB DENSITY
SGS has developed a spatial index measuring the relative access to jobs referred to as Effective Job Density or EJD. EJD is a measure of the relative concentration of employment, derived from the density and accessibility of all jobs across a region. This, in turn, reflects relative access to retail, health, education, recreational and other opportunities, which is a driver of property values.
The region might be a city or, in this report, the entire Australian continent. The ‘National EJD’ of a specific area provides a relative rank of how “agglomerated” or connected to opportunity one location is, compared to any other location in the country.
It is calculated using two variables:
� Car travel time from location a to location b - calculated using actual road networks
� Number of jobs at location b
The figure below shows the formula used to derive the index.
APPENDIX 10 - TECHNICAL NOTES


CANBERRALevel 2, 28-36 Ainslie AvenueCanberra ACT 2601+61 2 6257 [email protected]
HOBARTPO Box 123Franklin TAS 7113+61 421 372 [email protected]
MELBOURNELevel 14, 222 Exhibition StreetMelbourne VIC 3000+61 3 8616 [email protected]
SYDNEY209/50 Holt StreetSurry Hills NSW 2010+61 2 8307 [email protected]
Contact us