Spatial Variation in Water Supply and Demand Across the ... · i Draft Research Report Spatial...
41
i Draft Research Report Spatial Variation in Water Supply and Demand across the River Basins of India By Upali Amarasinghe Senior Regional Researcher International Water Management Institute Colombo Sri Lanka (Please send comments to Upali Amarasinghe at [email protected]) The boundaries shown in the maps of India included in this report are non-political
Transcript of Spatial Variation in Water Supply and Demand Across the ... · i Draft Research Report Spatial...

i
Draft Research Report
Spatial Variation in Water Supply and Demand across the River Basins of India
By
Upali Amarasinghe
Senior Regional Researcher
International Water Management Institute Colombo Sri Lanka
(Please send comments to Upali Amarasinghe at [email protected])
The boundaries shown in the maps of India included
in this report are non-political
ii
Table of Contents Summary ....................................................................................................................................... vi Introduction ................................................................................................................................... 1 River Basins of India..................................................................................................................... 2
Drainage Area .............................................................................................................................. 2 Population .................................................................................................................................... 3
Water Availability- Spatial Variation ......................................................................................... 5 Total Water Resources................................................................................................................. 5 Per Capita Water Resources ........................................................................................................ 6
Water Demand- Spatial Variation ............................................................................................... 6 Irrigation Withdrawals................................................................................................................. 6 Domestic and Industrial Withdrawals........................................................................................ 10
Water Scarcity - Spatial Dynamics ............................................................................................ 10 Water Accounting ...................................................................................................................... 10 Water Scarcity ........................................................................................................................... 13
Implications for future water management .............................................................................. 16 Growth in Population................................................................................................................. 16 Growth in Crop Production........................................................................................................ 19 Environmental Flow Requirements ........................................................................................... 25 Reallocation of Agriculture Withdrawals .................................................................................. 28
Policy Issues and Conclusion...................................................................................................... 30 How Much More Irrigation........................................................................................................ 30 Potential from Groundwater ...................................................................................................... 31 Environmental Water Needs...................................................................................................... 31 Water Transfers between Basins................................................................................................ 32 Trade .......................................................................................................................................... 32
Conclusion.................................................................................................................................... 33 Literature Citation ...................................................................................................................... 34 Annex............................................................................................................................................ 35

iii
Figures and Tables
Figures
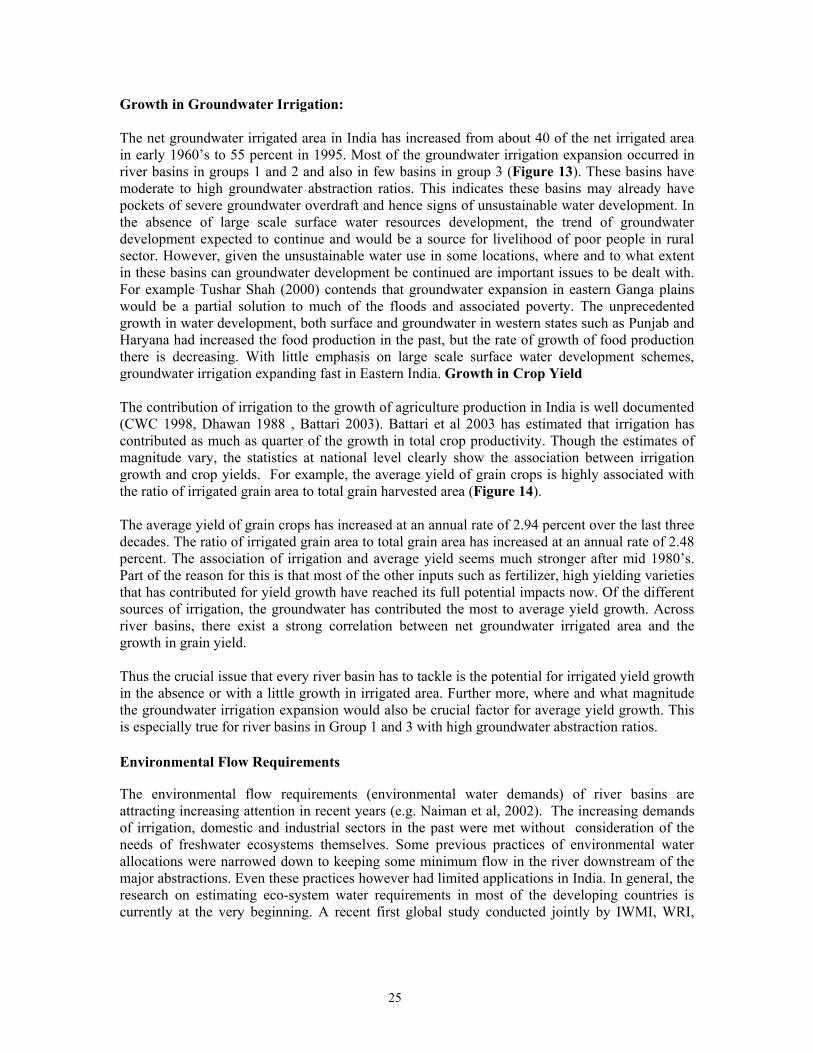
Figure 1. River Basins and State Boundaries of India 3 Figure 2. Total Renewable Water Resources and Potentially Utilizable Water Resources 5 Figure 3. Total Renewable Water Resources per Person in 1995 across River Basins 7 Figure 4. Water withdrawals to different sectors in 1995 7 Figure 5. Irrigation withdrawals per person, Irrigation Intensity, Groundwater Irrigated Area and Net Evapotranspiration across River Basin 8 Figure 6. Water Accounting of India’s Total Water Resources 11 Figure 7. Degree of Development, Depletion Fraction, Groundwater Abstraction Ratio, Total crop production Surplus or Deficit as a percent of demand and Scarcity groupings across river basins 15 Figure 8. Population growth scenarios of India 17 Figure 9. Annual growth of River Basin Population 18 Figure10. Area and Production of Grain crops 19 Figure 11. Net and Gross Sown under irrigated and rainfed conditions 20 Figure 12. Contributions from Cropping Intensity Increases to Gross Sown Area 21 Figure 13. Net irrigated area as a percent of net sown area 22 Figure 14. Net Groundwater Irrigated Area as a Percent of Net Irrigated Area 26 Figure 15. Indices of average grain yield and the grain irrigated area as a percent of total 27 Figure 16. Water productivities of grain and non-grain crops 29
Tables
Table 1. Population and Water Resources of Indian River Basins 4 Table 2. Crop sown area and details of irrigation details in 1995 across river basins 9 Table 3. Water Withdrawals and Water Accounting in basins 12 Table 4. Degree of Development, Depletion fraction, Groundwater abstraction and crop production surpluses or deficits of different clusters 13 Table 5. Change in overall cropping intensity and the contribution of change in net sown area, net irrigated area, irrigation intensity, rainfed intensity to the change in overall intensity change 23 Table 6. Environmental Flow Requirements 28 Annex Table 1. Percentage of Area of Indian States in Different River Basins 36
v
ABBREVIATIONS
CI Cropping Intensity CWC Central Water Commission DOD Degree of Development DF Depletion Fraction DWAF EFR Environmental Flow Requirements ET Evapotranspiration FAO Food and Agriculture Organization GCA Gross cropped area GOI Government of India GWAR Ground Water Abstraction Ratio GWP Global Water Partnership IRWR Internally Renewable Water Resources ( IRWR is the surface runoff and
the groundwater recharges from the rain falls inside the country). IUCN International Union of Conservation of Nature IWMI International Water Management Institute IWR Irrigation Water Requirement NIA Net Irrigated Area NSA Net Sawn Area WCD World Commission of Dams WRI Water Resources Institute TRWR Total Renewable Water Resources (TRWR is the sum of internally
renewable water resources and the water generated outside a basin). UN United Nations
vi
Spatial Variation in Water Supply and Demand across the River Basins of India
SUMMARY Agriculture development in the last few decades has helped India to become self sufficient in most of the present day food needs. Irrigation development was a major contributor for meeting goals of food self sufficiency. Meeting irrigation needs has dominated water development in the last few decades. However, the demand for water for non-agricultural uses is increasing and some basins have experienced excessive development and water stress. The primary objective of this paper is to investigate the spatial variation in water supply and demand across river basins of India and to assess the implications for future water resources development. The total area of India can be divided into 19 major drainage basins with varying per capita water supply. Water demand also varies substantially among basins. The Indus and the Ganga basins with 48 percent of the total population share 57 percent of the total primary withdrawals and with most of the water allocated to irrigation. Four Indicators are used to identify groups of basins with different magnitudes of water scarcity and different water management problems. These are: (i) the ratio of primary water supply to utilizable water resources (degree of development), (ii) the ratio of consumptive use to primary water supply (depletion fraction), (iii) the ratio of groundwater withdrawals as a proportion of total utilizable groundwater supply (the groundwater abstraction ratio) and (iv) the ratio of crop production to total crop demand. Using cluster analysis we identified five groups of river basins with different characteristics. We then analyzed the differences among groups for each of the four characteristics described above. Using the results of this analysis we identified the major issues that need to be tackled to meet future water and food needs.
1
Spatial Variation in Water Supply and Demand across the River Basins of India
INTRODUCTION India with 1 billion people at present is projected to become the most populace country before the middle of next century (UN 1998). About three quarters of the present population is rural. The majority in the future would still project to live in rural areas. There are conflicting views on the benefits to rural poor from the agriculture development in the past few decades. Whatever the case may be, the agriculture development in the past decades has contributed to India’s self sufficiency of most of today’s food needs. The growth of food grain production in the past few decades has outpaced the growth of effective demand. India has transformed from its substantial food grain deficits in the 1960’s to food grain surpluses after 1980’s. Since 1980 India has managed to maintain food grain self sufficiency at a national level even under adverse climatic conditions, though poverty persists and in many regions of the country a major portion of the population is underfed and the environmental degradation is so serious that some regions experience un-recoverable damages to eco-systems. Continued irrigation expansion combined with better inputs have played a vital role in meeting India’ national food security (CWC 1998, Dhawan 1988, Battari 2003). The irrigated agriculture is contributing to about two-thirds of the food grain production at present. Meeting irrigation needs had a central place in most water resources development in the past. Estimates of irrigation withdrawals vary, but all indicates that it is more than 80 percent of the total water withdrawals (Seckler et al 1996, IWMI 2000, Glieck 2000, WRI 2000, FAO 2000, Rosegrant, Cai and Cline 2003). The water withdrawals for domestic and industrial sector compared to other developing countries are small at present. The environmental needs have received less attention. Will future trends be same as in the past? Already, there are signs of contrast in trends reflecting contributions from different sectors to gross domestic product. While the contribution from agriculture sector to the gross domestic product has a decreasing trend (from 38 percent in 1980 to 24 percent in 1995), the contribution from the domestic sector and industrial sectors to the gross domestic product has shown an increasing trend (CWC 1998). The growths of services from domestic and industrial sectors mean, in general, an increasing demand for water. Even with these changes India still ranked one of the lowest domestic and industrial water users in per capita terms. For example, the combined domestic and industrial withdrawals annually in India (59 m3/person) is less than half the withdrawals of China (132 m3/person) and is well below the (only xx percent of) the developing countries (Glieck 2000). However, with the expected rate of urbanization and with increasing demand per person, the water demands of the domestic and industrial sectors are expected to increase rapidly in the future (Seckler et al. 1998, IWMI 2000). Similarly the environment sector also is receiving greater attention. Meeting the water needs of freshwater eco-systems was a much discussed subject recently (WCD 2000). Excessive groundwater use and its effects on some parts of the country are already major concerns. (Shah et al. 2001). Meeting minimum environmental water requirements of rivers and aquifers is no longer the subject for academic discussion only. Progressively more countries are including environmental water needs in their water management policies and development plans. These issues are becoming even more important in water stressed basins (Smakhtin et al, 2003). Due to substantial temporal river flow variability in India, environmental water demands during low-
2
flow months may have to be met from the developed water resources. The impacts of such environmental water allocations on other water sectors need to be addressed in some river basins. Most of the rains in India fall within 3 to 4 months in the monsoon period. The average rainfall in the four months- June to September of the south-west monsoon is about 935 mm’s. The rest of the eight months receive on average only about 280 mm of rainfall (CWC 1998). Some even claim that almost all the annual rain falls within 100 hours (Agrawal 1999). Capturing the abundant south-west monsoon for beneficial utilization in the other period is an enormous task. This is especially true with the wide variation of spatial distribution of rain fall. The spatial variation of water availability is crucial in proper demand management. Most of the recent water supply and demand projections of India have used aggregated data at national level (Rijisberman 2000, GWP 2000, IWMI 2000) and results vary substantially from one study to other. The spatial variability of water supply and demand is not adequately captured and is also a significant limitation in future water needs projections. The spatial variation of water supply and demand within a country and its effects in meeting food demand were discussed for few countries. (Amarasinghe, Muthuwatta, Sakthivadivel 1999, Scott et al. 1999) The primary objective of this paper is to analyze the spatial variation of water supply and demand across river basins in India. We identify basins, which are water scarce due to inadequate water supply or due to mismatches between demand and supply. We also identify issues, which are important for meeting the food needs and their implications for future water resources development and management. A river basin is an ideal analytical unit for water supply and demand studies. The water availability of the Indian River basins are already comprehensively studied (CWC 1998). However, most of the data required for water demand estimation is collected and policy decisions taken at the administrative boundary level. Thus demand projection studies, even at sub national level use administrative boundaries as analytical units (GOI 1999). Therefore, the effort in this paper to analyze supply and demand at river basin level is an important step forward. This is even more important in today’s increasing focus on Integrated Water Resources Management in river basins. The outline of the paper is described below. We start the next section with a description of Indian river-basins and their demography. The second and third chapter shows the dynamics of spatial variation among river basins of water supply demand. In the fourth chapter, the basins with different magnitudes of water scarcity and management problems are classified. In the next chapter the differences among groups with respect to the different characteristics of classifications are described. The paper is concluded with a discussion of the implication of the issues that need to be tackled to meet future water and food needs. RIVER BASINS OF INDIA
Drainage Area
The water resources of India drain from 19 major drainage areas (Figure 1). Seven drainage areas consist of west or south-west flowing rivers. The others are east flowing river basins. Twelve individual river basins, with more than 20 thousand square kilometers of area in each can be considered as major rivers basins (CWC 1998). Five other basins have drainage area more than 50 thousand square kilometers.

3
Figure 1. River Basins and State Boundaries of India The largest drainage area, Ganga-Brahmaputra-Meghna covers 34 percent of total area (Table 1). This basin has three rivers, Ganga, Brahmaputra, and Meghna that confluence before draining to Bay of Bengal. These three rivers are considered as three separate basins in this paper. The Ganga basin is the largest of all river basins. It covers substantial area of the states spreading from east to west including arid Haryana, Rajasthan to monsoon climate Utthra Predesh, Madya Predesh, Bihar and West Bengal (Figure 1, Annex Table 1). Four other large basins, Indus (flowing south-west direction to Pakistan) and Godavari, Krishna and Mahanadi (draining to sea from the east) cover 32 percent of the drainage area. Eight other medium basins cover 15 per cent of the area. The rest of the small river basins are divided into four major drainage areas. These are the rivers flowing west including Kutch & Saurashtra and Luni, the rivers south of Tapi basin which are flowing west, the small or medium rivers flowing east between Mahanadi and Pennar basins and small or medium rivers flowing east between Pennar and Kanyakumari.
Population
The 19 basins include all the population in peninsular India (Table 1). The distribution of population is uneven across basins. The Ganga basin alone with only about one-quarter of the total drainage area has about 40 percent the total population. On the other hand, the five other largest single basins: Mahanadi, Brahmaputra, Krishna, Godhawari cover 46 percent of the drainage area but have only 30 percent of the total population. The population density of India- 280 people per square kilometer- is high compared to most other developing countries. Six basins have population density of more than 350 persons per square kilometer.
4
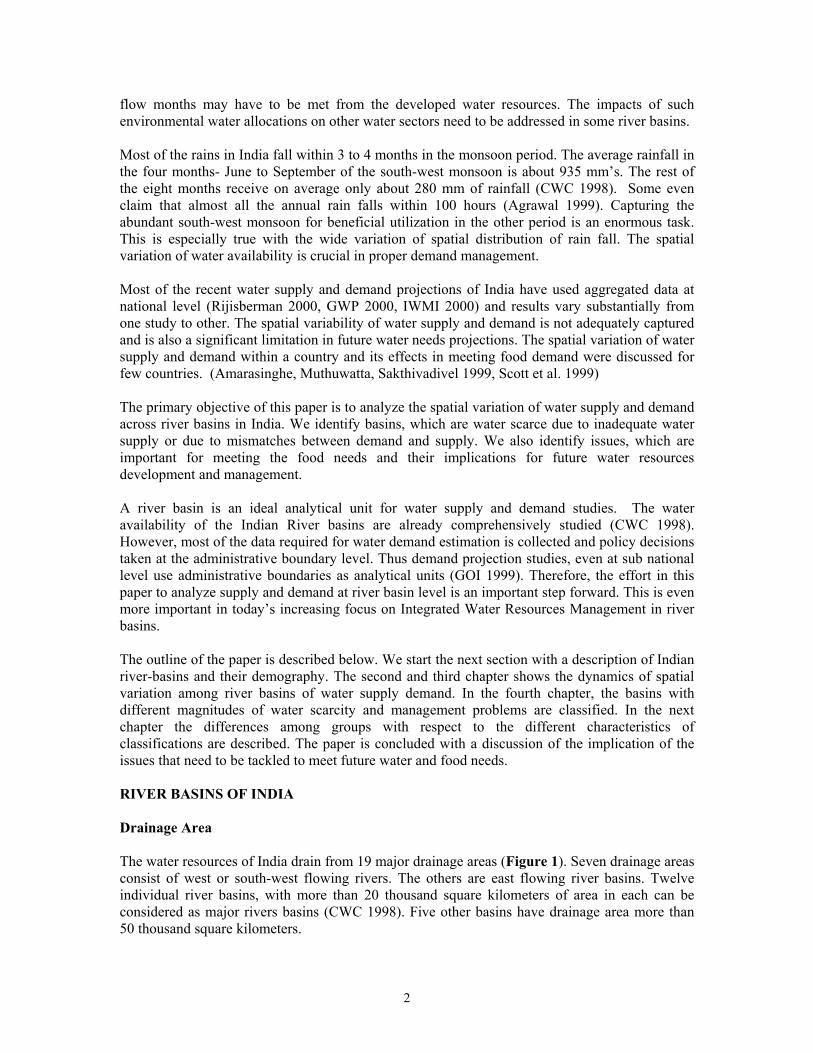
Table 1. Population and Water Resources of Indian River Basins Population Potentially Utilizable Water
Resources Per capita Water Resources
River Basin
Catchment Areai
Length of the river
Totalii Density Rural - % of totaliii
Total Renewable Water Resources
(TRWR) Surface Ground waterv
Total RWR/pc PUWR/pc
Km2 Km Million No. people/ km2
% Km3 Km3 Km3 Km3 m3 m3
All basins 3,190,819 932 282 73 1887 690 343 1033 2011
1130
Sabarmati 21,674 371 6.0 521 54 3.8 1.90 2.90 4.8 239 302 Subernarekha 29,196 395 15.0 347 76 12.4 6.80 1.70 8.5 1216 833 Mahi 34,842 583 6.7 324 77 11.0 3.10 3.50 6.6 973 584 Meghna 41,723 - 10.0 160 82 48.4 1.70 8.50 10.2 7224 1522 Brahmani&Baitarani 51,822 1164v 16.7 204 87 28.5 18.30 3.40 21.7 2689 2047 Pennar 55,213 597 14.3 189 78 6.3 6.30 4.04 10.9 601 1040 West flowing rivers 1vi 55,940 - 58.9 425 72 15.1 15.00 9.10 24.1 478 763 Tapi 65,145 724 17.9 245 63 14.9 14.50 6.70 21.2 931 1325 Cauvery 81,155 800 32.6 389 70 21.4 19.00 8.80 27.8 676 878 East Flowing Rivers 1vi 86,643 - 19.2 293 74 22.5 13.10 12.80 25.9 946 1089 Narmada 98,796 1,312 17.9 160 79 45.6 34.50 9.40 43.9 2868 2761 East Flowing rivers 2 vi 100,139 - 39.0 484 60 16.5 16.70 12.70 29.4 340 605 Mahanadi 141,589 851 27.2 202 80 66.9 50.00 13.60 63.6 2331 2216 Brahmaputra 194,413 916 33.2 161 86 585.6 24.30 25.70 48 17108 1529 Krishna 258,948 1,401 68.9 253 68 78.1 58.00 19.90 77.9 1186 1183 Godavari 312,812 1,465 76.7 186 85 110.5 76.30 33.50 109.8 1877 1865 Indus 321,289 1,114 48.8 140 71 73.3 46.00 14.30 60.3 1611 1325 West flowing rivers 2 vi 378,028 51.9 166 57 200.9 36.20 15.60 51.8 3184 821 Ganga 861,452 2,525 370.2 449 75 525.0 250.00 136.50 386.5 1353 996 i - Source: CWC 1993. (Reassessment of Water Resources Potential of River basin ii - Source for total population (UN 1998) iii - Source for Renewable and potentially utilizable water resources is CWC 2000 iv - Potentially utilizable ground water resources is the ground water replenished from normal natural recharge v - The length of Brahmani river itself is 799 km vi – West Flowing rivers 1 includes rivers Kutch & Saurastra Including Luni; West flowing rivers 2 includes rivers south of Tapi, East flowing rivers 1 includes rivers between Mahanadi and Pennar and East flowing rivers 2 includes rivers between Pennar and Kanayakumari.
5
Majority of the people in all river basins still lives in rural areas. More than 70 percent of the 1995 Indian population is rural. This is substantially higher in some basins. For example more than 80 percent of population is rural in Brahmaputra, Meghna, Mahanadi, Godavari and Brahmani-Baitarni basins. The livelihood of most rural population depends on agriculture. Thus the development and management of the available water resources is a crucial factor in the strategy of rural development and poverty alleviation in India. WATER AVAILABILITY- SPATIAL VARIATION
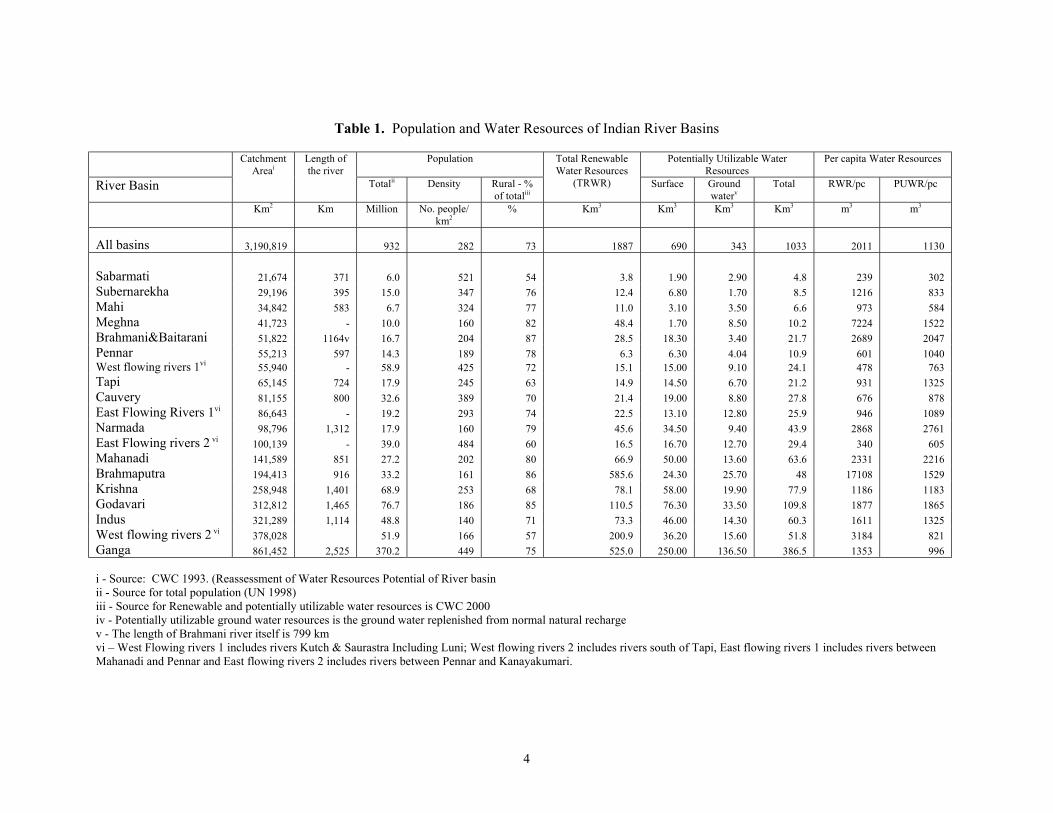
Total Water Resources The internally generated surface runoff is 1200 km3 and the groundwater resource is 418 km3. The seepage from the river bed replenishes groundwater and the groundwater aquifers discharge to rivers and contribute to base flow. The part which is common to both rivers and aquifers is called the over lap (FAO 2003). About 380 km3 is the overlap of surface and groundwater resources. The total internal renewable water resource of India (IRWR) is estimated as 1238 km3 (Table 1). Of this 820 km3 is surface runoff generated internally, 418 km3 is groundwater with about 300 km3 is the overlap of surface and ground water (Figure 2). About 600 km3 of water resources is generated externally (FAO 2002). The estimated total renewable water resource (TRWR) is 1838 km3. The potentially utilizable surface water resources (PUSWR) is that part of the water resources which can be captured for the first time use and subsequent reuse in the down stream with all possible physical and economic means. The estimates of PUSWR for India are 690 km3 of surface water and 342 km3 of groundwater (CWC 1998).
Figure 2. Total Renewable Water Resources and Potentially Utilizable Water Resources Due to uneven distribution of rainfall, both spatial and temporal, only 38 percent of the surface renewable water resources are estimated to be potentially utilizable (PUSWR) (CWC 1998). The Ganga-Brahmaputra-Megna basins cover 34 percent of the drainage area and have 46 percent of the population but accounts for 47 percent of the TRWR of India. The Brahmaputra river basin covers only 6 percent of total area, but accounts for 32 percent of the total TRWR. The Brahmaputra is a very narrow river and has very limited potential storage locations within the basin (CWC 2000). Therefore, only 4 percent of the RWR is estimated to be actually utilizable surface water resources. Similarly, only 4 percent of the Meghna basin is potentially utilizable surface water resources.
Total Renewable Water Resources in India
38km3
380km3
820km3
600km3
Surface w ater
Overlap ofSurfacew ater &Grow undw ater
Ground w ater
Inflow
Source: FAO AQUASTAT 2003 & CWC 1998
Potentially Utilizable Water
Resources
342km3
690km3
1
6
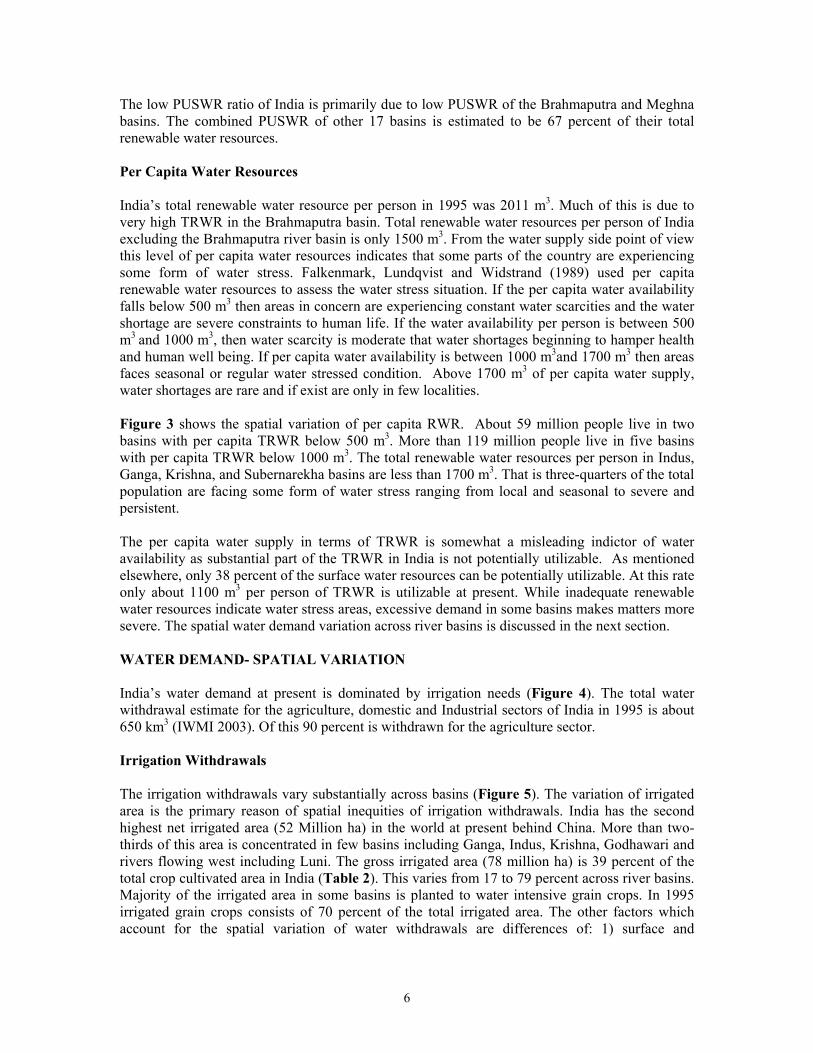
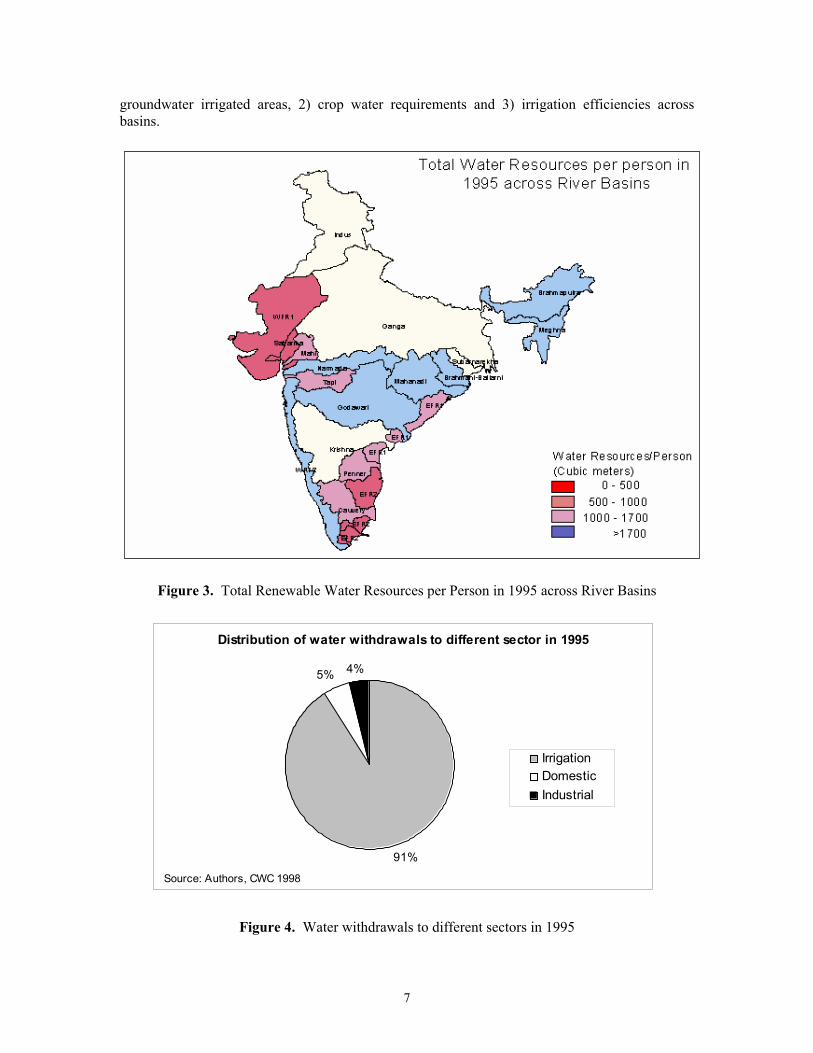
The low PUSWR ratio of India is primarily due to low PUSWR of the Brahmaputra and Meghna basins. The combined PUSWR of other 17 basins is estimated to be 67 percent of their total renewable water resources. Per Capita Water Resources India’s total renewable water resource per person in 1995 was 2011 m3. Much of this is due to very high TRWR in the Brahmaputra basin. Total renewable water resources per person of India excluding the Brahmaputra river basin is only 1500 m3. From the water supply side point of view this level of per capita water resources indicates that some parts of the country are experiencing some form of water stress. Falkenmark, Lundqvist and Widstrand (1989) used per capita renewable water resources to assess the water stress situation. If the per capita water availability falls below 500 m3 then areas in concern are experiencing constant water scarcities and the water shortage are severe constraints to human life. If the water availability per person is between 500 m3 and 1000 m3, then water scarcity is moderate that water shortages beginning to hamper health and human well being. If per capita water availability is between 1000 m3and 1700 m3 then areas faces seasonal or regular water stressed condition. Above 1700 m3 of per capita water supply, water shortages are rare and if exist are only in few localities. Figure 3 shows the spatial variation of per capita RWR. About 59 million people live in two basins with per capita TRWR below 500 m3. More than 119 million people live in five basins with per capita TRWR below 1000 m3. The total renewable water resources per person in Indus, Ganga, Krishna, and Subernarekha basins are less than 1700 m3. That is three-quarters of the total population are facing some form of water stress ranging from local and seasonal to severe and persistent. The per capita water supply in terms of TRWR is somewhat a misleading indictor of water availability as substantial part of the TRWR in India is not potentially utilizable. As mentioned elsewhere, only 38 percent of the surface water resources can be potentially utilizable. At this rate only about 1100 m3 per person of TRWR is utilizable at present. While inadequate renewable water resources indicate water stress areas, excessive demand in some basins makes matters more severe. The spatial water demand variation across river basins is discussed in the next section. WATER DEMAND- SPATIAL VARIATION India’s water demand at present is dominated by irrigation needs (Figure 4). The total water withdrawal estimate for the agriculture, domestic and Industrial sectors of India in 1995 is about 650 km3 (IWMI 2003). Of this 90 percent is withdrawn for the agriculture sector.
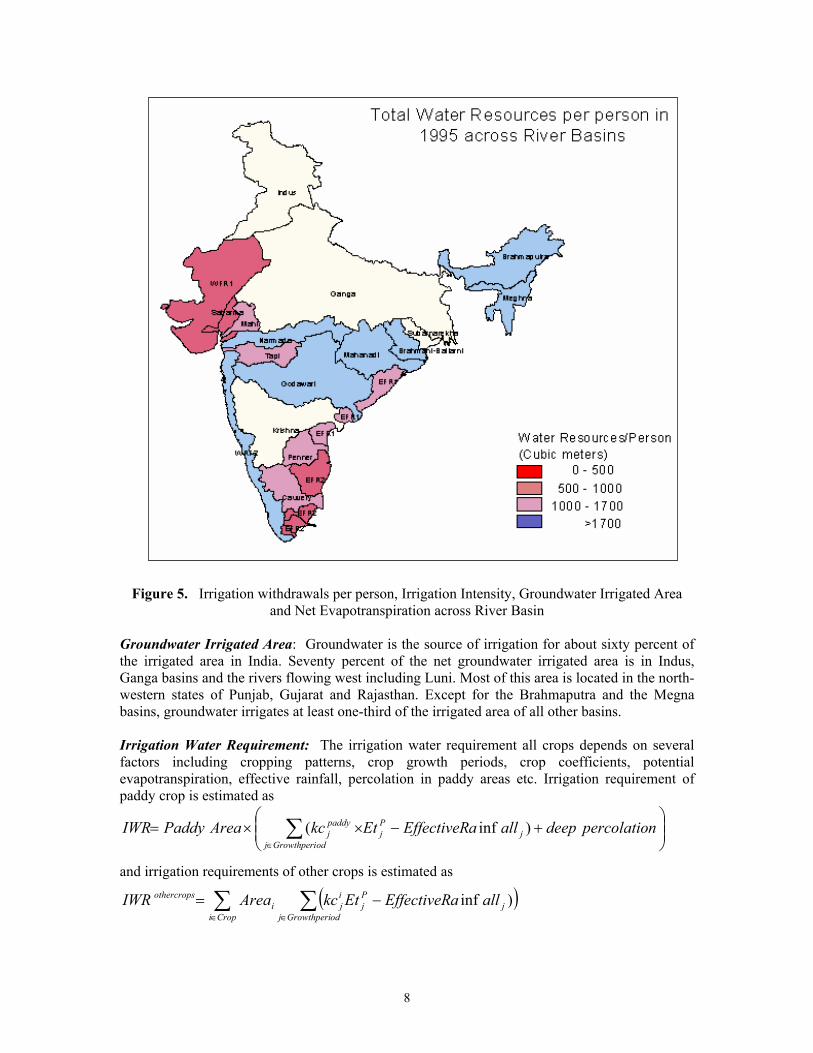
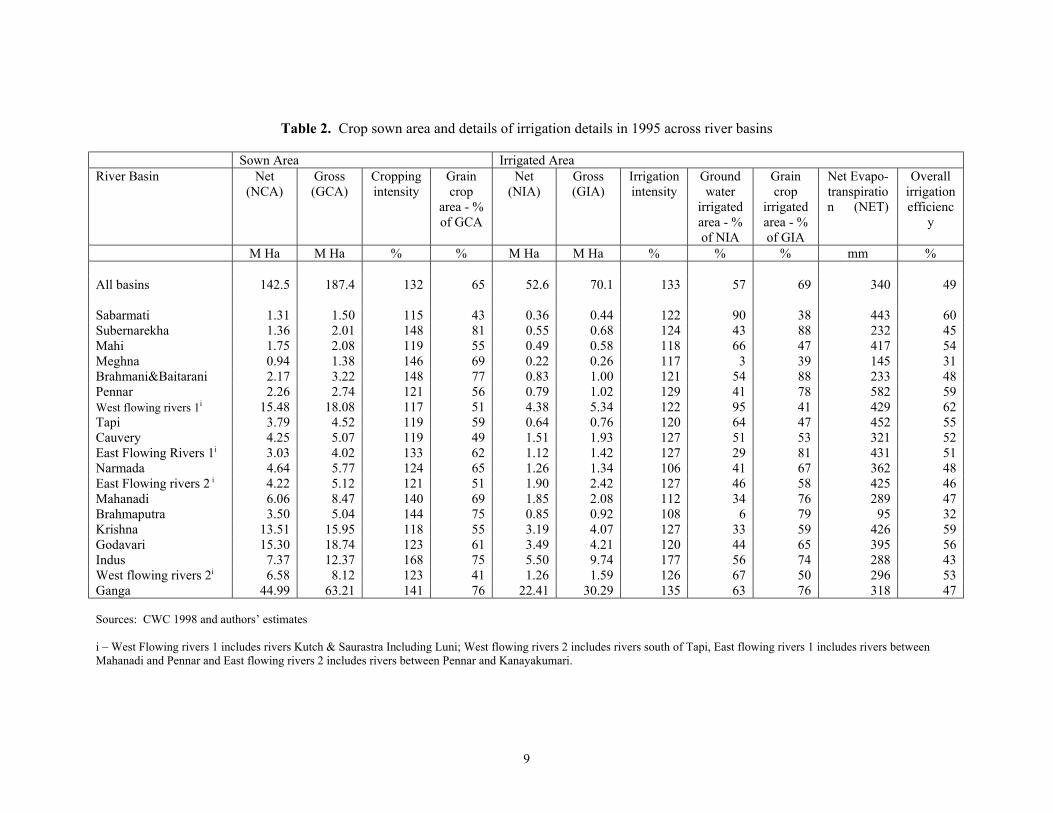
Irrigation Withdrawals The irrigation withdrawals vary substantially across basins (Figure 5). The variation of irrigated area is the primary reason of spatial inequities of irrigation withdrawals. India has the second highest net irrigated area (52 Million ha) in the world at present behind China. More than two-thirds of this area is concentrated in few basins including Ganga, Indus, Krishna, Godhawari and rivers flowing west including Luni. The gross irrigated area (78 million ha) is 39 percent of the total crop cultivated area in India (Table 2). This varies from 17 to 79 percent across river basins. Majority of the irrigated area in some basins is planted to water intensive grain crops. In 1995 irrigated grain crops consists of 70 percent of the total irrigated area. The other factors which account for the spatial variation of water withdrawals are differences of: 1) surface and
7
groundwater irrigated areas, 2) crop water requirements and 3) irrigation efficiencies across basins.
Figure 3. Total Renewable Water Resources per Person in 1995 across River Basins
Figure 4. Water withdrawals to different sectors in 1995
Distribution of water withdrawals to different sector in 1995
91%
5% 4%
IrrigationDomesticIndustrial
Source: Authors, CWC 1998
8
Figure 5. Irrigation withdrawals per person, Irrigation Intensity, Groundwater Irrigated Area and Net Evapotranspiration across River Basin
Groundwater Irrigated Area: Groundwater is the source of irrigation for about sixty percent of the irrigated area in India. Seventy percent of the net groundwater irrigated area is in Indus, Ganga basins and the rivers flowing west including Luni. Most of this area is located in the north-western states of Punjab, Gujarat and Rajasthan. Except for the Brahmaputra and the Megna basins, groundwater irrigates at least one-third of the irrigated area of all other basins. Irrigation Water Requirement: The irrigation water requirement all crops depends on several factors including cropping patterns, crop growth periods, crop coefficients, potential evapotranspiration, effective rainfall, percolation in paddy areas etc. Irrigation requirement of paddy crop is estimated as
+−××= ∑
∈
npercolatiodeepallaEffectiveREtkcAreaPaddyIWR jPj
odGrowthperij
paddyj )inf(
and irrigation requirements of other crops is estimated as
( )∑ ∑∈ ∈
−=Cropi odGrowthperij
jPj
iji
othercrops allaEffectiveREtkcAreaIWR )inf
9
Table 2. Crop sown area and details of irrigation details in 1995 across river basins Sown Area Irrigated Area River Basin Net
(NCA) Gross (GCA)
Cropping intensity
Grain crop
area - % of GCA
Net (NIA)
Gross (GIA)
Irrigation intensity
Ground water
irrigated area - % of NIA
Grain crop
irrigated area - % of GIA
Net Evapo-transpiration (NET)
Overall irrigation efficienc
y
M Ha M Ha % % M Ha M Ha % % % mm % All basins 142.5 187.4 132 65 52.6 70.1 133 57 69 340 49 Sabarmati 1.31 1.50 115 43 0.36 0.44 122 90 38 443 60 Subernarekha 1.36 2.01 148 81 0.55 0.68 124 43 88 232 45 Mahi 1.75 2.08 119 55 0.49 0.58 118 66 47 417 54 Meghna 0.94 1.38 146 69 0.22 0.26 117 3 39 145 31 Brahmani&Baitarani 2.17 3.22 148 77 0.83 1.00 121 54 88 233 48 Pennar 2.26 2.74 121 56 0.79 1.02 129 41 78 582 59 West flowing rivers 1i 15.48 18.08 117 51 4.38 5.34 122 95 41 429 62 Tapi 3.79 4.52 119 59 0.64 0.76 120 64 47 452 55 Cauvery 4.25 5.07 119 49 1.51 1.93 127 51 53 321 52 East Flowing Rivers 1i 3.03 4.02 133 62 1.12 1.42 127 29 81 431 51 Narmada 4.64 5.77 124 65 1.26 1.34 106 41 67 362 48 East Flowing rivers 2 i 4.22 5.12 121 51 1.90 2.42 127 46 58 425 46 Mahanadi 6.06 8.47 140 69 1.85 2.08 112 34 76 289 47 Brahmaputra 3.50 5.04 144 75 0.85 0.92 108 6 79 95 32 Krishna 13.51 15.95 118 55 3.19 4.07 127 33 59 426 59 Godavari 15.30 18.74 123 61 3.49 4.21 120 44 65 395 56 Indus 7.37 12.37 168 75 5.50 9.74 177 56 74 288 43 West flowing rivers 2i 6.58 8.12 123 41 1.26 1.59 126 67 50 296 53 Ganga 44.99 63.21 141 76 22.41 30.29 135 63 76 318 47 Sources: CWC 1998 and authors’ estimates i – West Flowing rivers 1 includes rivers Kutch & Saurastra Including Luni; West flowing rivers 2 includes rivers south of Tapi, East flowing rivers 1 includes rivers between Mahanadi and Pennar and East flowing rivers 2 includes rivers between Pennar and Kanayakumari.
10
The net evapotranspiration requirement of different basins ranges from a high of 580 mm in Pennar basin to a low of 95mm in Brahmaputra basin (Table 2). Irrigation efficiency: The irrigation efficiency mentioned here is defined as the percentage of total water withdrawals required for meeting the irrigation crop water requirement, i.e., the irrigation efficiency is the ratio of irrigation crop water requirement to total irrigation withdrawals. In general the irrigation efficiencies vary spatially for surface and groundwater irrigations. However, the spatial variation of surface and groundwater irrigation efficiencies across basin is not available. We have used the all India average estimates provided by the reports of the Indian Planning Commission (GOI 1999). While the filed scale surface irrigation efficiency is assumed to be 30 to 35 percents and field scale groundwater irrigation efficiency is assumed to be 65 to 70 percents. The overall field scale efficiency in the basins depends on the surface and groundwater efficiencies and percentage of groundwater water irrigated area. The concepts of efficiency here is valid only at field scale. At the basin scale the reuse is also estimated. Domestic and Industrial Withdrawals Domestic withdrawals consist of two components 1) water withdrawals for human consumption plus domestic services and 2) water withdrawals for livestock. The human demand for drinking, cooking, bathing, recreation etc. accounts for 79 percent of the domestic withdrawals. The total livestock demand was estimated as 6.7 km3 (CWC 1998). The spatial variation of domestic demand is primarily accounted by the differences in urban and rural population distribution and the withdrawals per person. The water withdrawal per person in urban area (135 liters/day) is assumed to be 3 times more than the withdrawals per person in rural areas (40 liters/day). The livestock demand also depends on number of animals and per head consumptive use. In this paper, we have used the estimates of the Central Planning Commission (GOI 1999). As in the domestic sector withdrawals, we have also used Planning Commission estimates for Industrial withdrawals. WATER SCARCITY - SPATIAL DYNAMICS
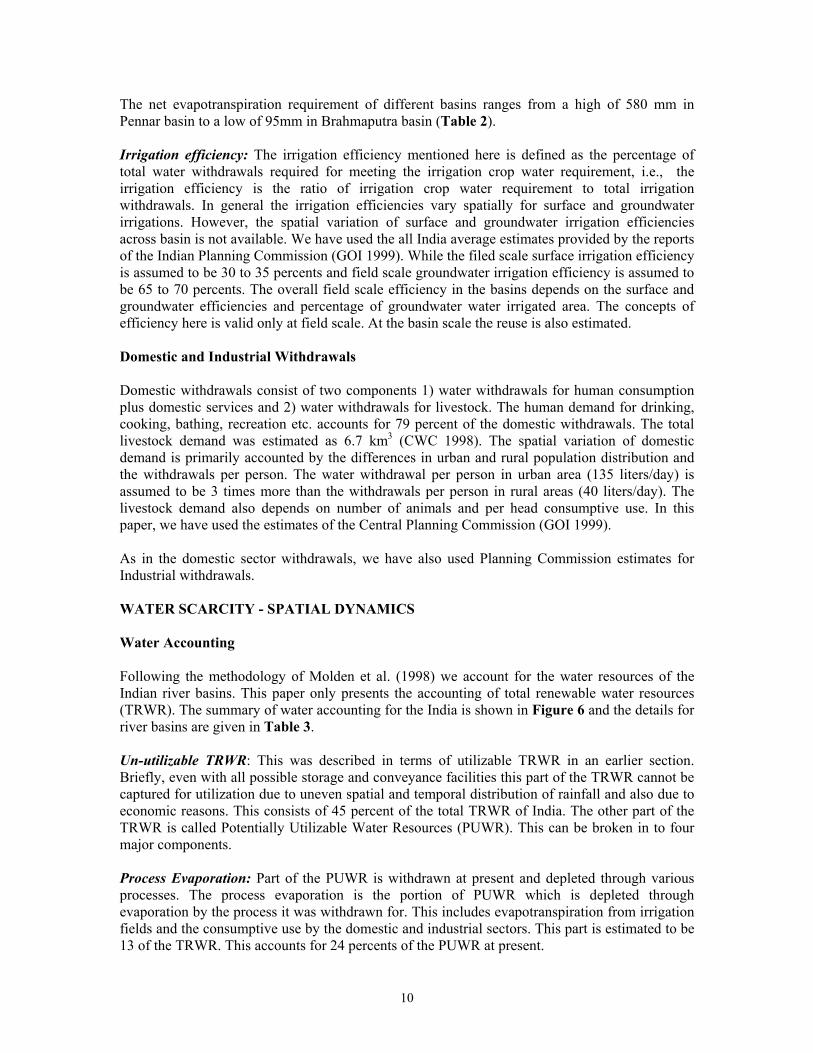
Water Accounting Following the methodology of Molden et al. (1998) we account for the water resources of the Indian river basins. This paper only presents the accounting of total renewable water resources (TRWR). The summary of water accounting for the India is shown in Figure 6 and the details for river basins are given in Table 3. Un-utilizable TRWR: This was described in terms of utilizable TRWR in an earlier section. Briefly, even with all possible storage and conveyance facilities this part of the TRWR cannot be captured for utilization due to uneven spatial and temporal distribution of rainfall and also due to economic reasons. This consists of 45 percent of the total TRWR of India. The other part of the TRWR is called Potentially Utilizable Water Resources (PUWR). This can be broken in to four major components. Process Evaporation: Part of the PUWR is withdrawn at present and depleted through various processes. The process evaporation is the portion of PUWR which is depleted through evaporation by the process it was withdrawn for. This includes evapotranspiration from irrigation fields and the consumptive use by the domestic and industrial sectors. This part is estimated to be 13 of the TRWR. This accounts for 24 percents of the PUWR at present.
11
Figure 6. Water Accounting of India’s Total Water Resources Non-Process Evaporation: This part of PUWR is depleted by the other processes for which the withdrawals are not intended for. This includes the evaporation through homesteads, bare soil, and swamps, reservoir surface, canals, rivers etc. and equal to 6 percents of the TRWR. The non-process evaporation accounts for11 percent of the percents of the PUWR at present. Un-utilizable outflow of PUWR: Once water is withdrawn, a part of that is return to surface water supply and the other part recharge the groundwater. Part of this return flow is reuse again. The other part- called here as un-utilizable outflow of PUWR- is lost as outflows to sea and/or downstream countries or to an internal sink. This part cannot be captured for further use in the basin. This consists of 3 and 2 percents of the PUWR and TRWR respectively. Utilizable outflow from PUWR: This consists of two parts: 1) the part of the return flow which can be captured with adequate infrastructure for reuse and 2) the part of PUWR that is not developed at present. Estimates of the two components respectively are 2 and 32 percents of TRWR and accounts for 3 and 58 percents of TRWR. The water resources developed at present is only 32 percent of the TRWR and is only 42 percent of the potentially utilizable water resource of India. However, the ratio of developed water resources to PUWR varies substantially across river basins. It varies from 11 percent in the Brahmaputra basin to 136 percent in the West Flowing Rivers of Kutch, Saurastra and Luni drainage area, where all renewable water resources are depleted. Primary Water Supply: The total volume of all water withdrawals directly from all water sources in a basin is referred to as the primary water supply. The primary water supply and the portion that is recycled downstream form the total water withdrawal. In most basins, the total water withdrawal is almost one and a half times the primary water withdrawal. The primary water supply and the total water withdrawal of India are estimated as 458 km3 and 654 km3 respectively.
Water Accounting of India
13%
6%
2%
2%
32%
45% 55%
Unutilizable TRWR
Proces ET
Non-process ET
Un-utilizable outflow ofPUWR
Utilizable outflow ofreturnflow
Undeveloped PUWRSource: Authors estimates, and CWC 1998

12
Table 3. Water Withdrawals and Water Accounting in basins
Water Withdrawals Water Accounting Total Sector withdrawals - % of total % of PUWR
River Basin
Irrigation
Domestic
Industrial
Total renewable water resources
Potentially utilizable water resources (PUWR)
Process evaporation
Non-process evaporation
Un-utilizable outflow of PUWR
Utilizable outflow of return flow
PUWR not developed at present
km3 % % % km3 km3 % % % % % All basins 645 91 5 4 1887 1034 24.4 11.0 2.9 3.1 59 Sabarmati 4.4 78 15 7 3.8 4.8 46 12 5.9 3.2 33 Subernarekha 6.4 88 8 4 12.4 8.5 21 13 4.4 3.8 58 Mahi 5.3 89 5 6 11.0 6.6 39 19 3.7 2.9 35 Meghna 2.4 79 13 8 48.4 10.2 5 5 1.9 2.7 85 Brahmani&Baitarani 8.8 91 6 3 28.5 21.7 12 10 2.1 2.0 74 Pennar 14.0 94 4 2 6.3 10.3 60 18 5.2 7.9 9 West flowing rivers 1i 40.7 94 5 2 15.1 24.1 98 19 5.4 9.9 0 Tapi 7.8 87 7 6 14.9 21.2 17 10 1.9 1.4 69 Cauvery 17.9 89 6 5 21.4 27.8 24 13 3.3 2.8 57 East Flowing Rivers 1i 18.5 93 4 4 22.5 25.9 25 11 3.3 6.5 55 Narmada 12.4 92 5 4 45.6 43.9 12 6 1.3 1.2 80 East Flowing rivers 2i 31.5 91 4 4 16.5 29.4 37 17 5.2 4.9 36 Mahanadi 19.9 91 5 4 66.9 63.6 10 7 1.6 2.2 79 Brahmaputra 9.9 81 10 9 585.6 50.0 3 4 1.5 2.4 90 Krishna 41.0 90 6 4 78.1 77.9 24 13 2.4 2.0 59 Godavari 41.1 91 6 4 110.5 109.8 16 7 1.7 2.3 73 Indus 81.6 97 2 2 73.3 60.3 48 25 5.2 6.1 16 West flowing rivers 2i 14.8 77 11 12 200.9 51.8 11 8 2.1 1.2 78 Ganga 266.8 91 5 4 525.0 386.5 26 11 3.2 3.0 56 Source: Authors estimates i – West Flowing rivers 1 includes rivers Kutch & Saurastra Including Luni; West flowing rivers 2 includes rivers south of Tapi, East flowing rivers 1 includes rivers between Mahanadi and Pennar and East flowing rivers 2 includes rivers between Pennar and Kanayakumari.

13
Water Scarcity
Four indicators are used in analyzing the severity of water scarcity. The first three indicators respectively show the degree of water development, extent of the depletion of developed water resources and the sustainability of the developed water supply. The other indicator shows the surplus or deficit river basin food production. We describe them here briefly. Degree of Development (DoD): The degree of development is defined as the ratio of primary water supply to the potentially utilizable water resources. This indicates the degree of water development at present. The DoD varies from 7 % to 136% (Table 4). The DoD is thus the basis for IWMI indicator of physical water scarcity (Seckler 1999, IWMI 2000). A spatial unit with more than 60 percent DoD is considered to be physically water scarce. Also note here that as DoD increases the cost of water development increases very rapidly (Wiberg and Strzepek 2000).
Table 4. Degree of Development, Depletion fraction, Groundwater abstraction and crop production surpluses or deficits of different clusters
Crop production surplus/deficit as a percent of consumption
All basins
Degree of develop-ment
Depletion Fraction
Ground-water Abstraction Ratio Total Grains Non-
grains
Cluster membership
% % % % % % number 41 86 51 0.5 0.1 0.6 West Flowing Rivers 1i 132 92 194 -30 -32 -29 1 Pennar 91 91 64 1 19 -8 2 Indus 84 93 70 66 226 -15 2 Sabarmati 67 95 91 -25 -45 -15 3 Mahi 65 96 60 -27 -14 -33 3 East Flowing Rivers 2 i 64 92 46 -9 -10 -9 3 Ganga 44 93 55 -9 -17 -5 3 Cauvery 43 93 52 -8 -19 -3 3 Subernarekha 42 91 50 23 5 33 3 Krishna 41 95 42 -11 -14 -9 3 Tapi 31 96 49 -29 -37 -26 3 Godavari 27 92 36 -9 -6 -11 3 West Flowing Rivers 2 I 22 94 40 5 -56 37 3 Narmada 20 94 30 -16 36 -42 3 Meghna 15 82 3 9 -41 34 5 Brahmaputra 11 77 4 15 14 15 5 Brahmani-Baitarani 26 92 55 61 15 85 4 East Flowing Rivers 1i 45 86 24 46 35 52 4 Mahanadi 21 89 26 90 57 106 4 i – West Flowing rivers 1 includes rivers Kutch & Saurastra Including Luni; West flowing rivers 2 includes rivers south of Tapi, East flowing rivers 1 includes rivers between Mahanadi and Pennar and East flowing rivers 2 includes rivers between Pennar and Kanayakumari. Depleted Fraction (DF): The depletion fraction of a basin here is defined as the ratio of total depletion to primary water supply. The total depletion includes the process and non-process evaporation and un-utilizable outflow of the return flows. This shows the extent of the depletion
14
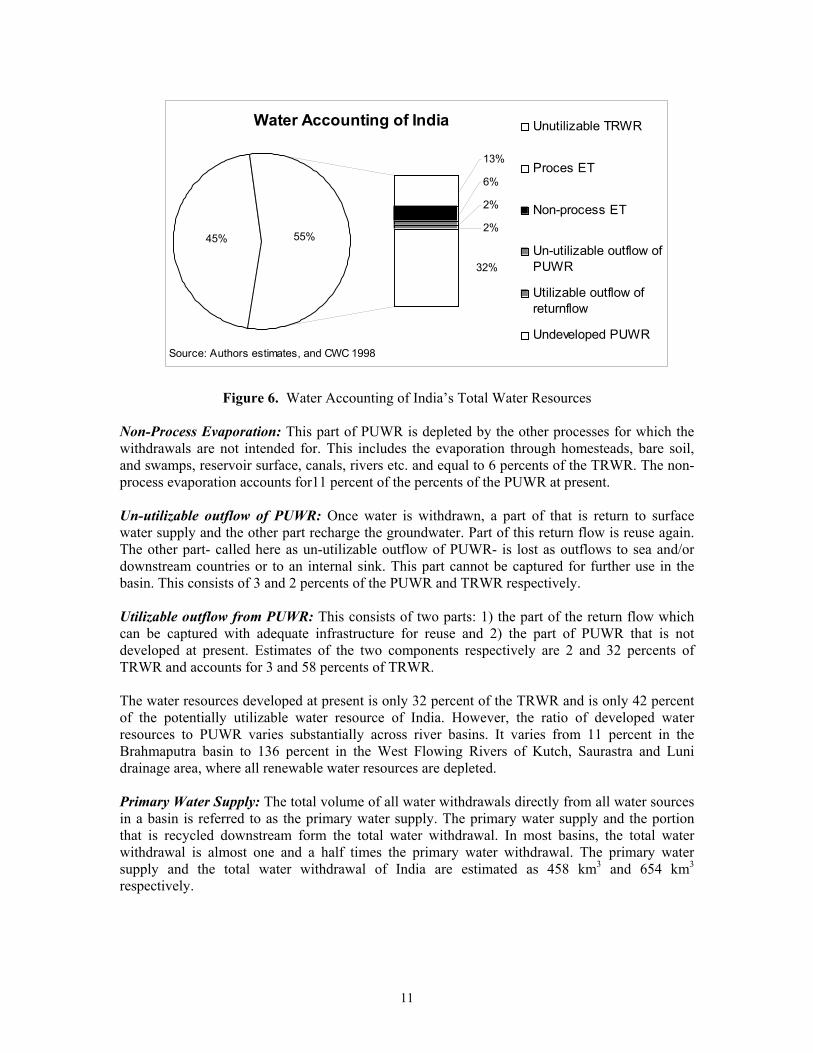
of the water resources which are developed at present. Overall, India is estimated to have depleted 81 percent of its primary water supply. The majority of the depletion is through the evaporation of irrigation water diversions. It is interesting to note that though the overall irrigation efficiencies of all basins are lower than 50 percent, the depletion fraction of all basins are more than 75 percent. This indicates substantial recycling of primary water supply. Groundwater Abstraction Ratio (GWAR): The groundwater abstraction ratio indicates the degree of development of groundwater resources. The groundwater resources here include recharges from both natural rainfall and the return flows. Groundwater resources are also not generally uniformly distributed so that it can be uniformly extracted at a given location (not clear). Therefore high GWAR indicates existence of pockets of high groundwater use and perhaps groundwater mining. The overall GWAR of India is 48 percent of the total utilizable groundwater resources and varies from 3 to 128 percents across basins. The GWAR is more than 60 percent in the Indus, Sabarmati basins and in the drainage areas of west flowing rivers Kutch & Saurastra. These basins include most of the area of states of Punjab, Haryana, Gujarat and Rajasthan where sustainable groundwater use is an emerging critical issue (Shah et al 20002). In some parts of these states depth to groundwater is falling at xxx meters per year (Seckler et al 2000). The GWR of Ganga, Pennar and Mahi basins is more than 50%. Very little of the groundwater resources are being used at present in the Brahmaputra and Meghna basins. Ratio of Total Crop Production to total crop demand (RTC): This indicator shows the extent to which a basin is meeting its total crop demand. The total production includes the production of crops cultivated under both irrigated and rainfed conditions. The crops include Rice, Wheat, Maize and other cereals, Pulses, Oil crops, Roots and tubers, Vegetables, Sugar crops, Fruits and Cotton. We have used export prices of crops aggregate the crop production (IWMI 2003). This is an important indicator for India as irrigation contributes to more than 60 percent of the food production in India at present and is expected to contribute to more in the future. These four indicators are used to assess the severity of water scarcity situation of river basins. The cluster analysis technique of k-mean clustering (SPSS 1998) is used in separating the basins into five clusters. The cluster information of the four indicators is given in Table 4. The disaggregated crop production surplus or deficits for grain and non-grain crops are also given. The river basins within clusters are ranked in terms of the degree of development (Figure 7). Here we present only the spatial variation of degree of development, groundwater abstraction ratio, the ratio of total crop production to demand and the five clusters. The estimates of depletion fraction except for the Brahmaputra and Meghna basins show no significant variation, thus are not presented spatially. Cluster 1- Water Scarce-Food Deficits- One basin stands out from other basins and is in cluster 1. The degree of development and ground water abstraction ratio of the WEST FLOWING RIVERS KUTCH & SAURASTRA INCLUDING LUNI basin area (west flowing rivers of Kutch, Saurashtra including Luni) are over 100 percent. High degree of development indicates absolutely physically water scarce conditions (IWMI 2000) meaning that this basin does not have enough water resources to develop to meet additional future demand of all sectors including the environment. Over 100 percent GWAR indicators some form of groundwater mining and hence unsustainable water development and use. The water scarcity and associated problems are exacerbated by the fact this basin has substantially high crop production deficits. The west flowing rivers Kutch & Saurastra Including Luni has three-fourths of the area of Gujarat and 60 percent of the area of Rajastan, where ground water depletion is a serious problem. This drainage area also has 6 percent of the Indian population (about 60 million people) and contributes to about 4 percent of the grain production and 4 percent of the non-grain production.
15
Figu
re 7
.
Deg
ree
of D
evel
opm
ent,
Dep
letio
n Fr
actio
n, G
roun
dwat
er A
bstra
ctio
n R
atio
, Tot
al c
rop
prod
uctio
n Su
rplu
s or
Def
icit
as a
per
cent
of d
eman
d an
d Sc
arci
ty g
roup
ings
acr
oss r
iver
bas
ins
16
Cluster 2-Water Scarce-Food Surplus: The basins in cluster 2, the Indus and Pennar have high degree of development, high depletion ratios and high groundwater abstraction. However, basins in this cluster have significant crop production surpluses. In both basins there is some deficit of non-grain crop production but the grain production surpluses are more than enough to offset the production deficits of non-grain crops. The two basins have 7 percent of the total Indian population (about 56 million) and produce 22 percent of the total grain production and 5 percent of the non-grain crop production. The water scarcities in these basins are due to over development of their water resources, specially for irrigation water use. Increasing demand of domestic and industrial and environmental sectors in the future will have to be met from transferring water from the agriculture sector. Without such approach water development of these basins will reach unsustainable proportions as in cluster 1 basin. Cluster 3- Food Deficit: Eleven basins are included in this cluster. The basins in this group have mixed bag of water related problems than in the basins in the previous two clusters. All basins except Subernarkha and East flowing rivers between Pennar and Kanayakumari have substantial crop production deficits. Three basins Mahi, Sabarmati and East Flowing Rivers between Pennar and Kanyakumari can be considered as physically water scarce but the degree of scarcity is as not severe as in groups 1 and 2 (IWMI 2000). The water scarcities in these three basins are exacerbated by their high production deficits. The groundwater ratios in all river basins in this group except West Flowing Rivers of Kutch and Saurastra and Luni are more than 40 percent. The groundwater accounts for substantial part of irrigation in most basins. Because of the non-uniformity of distribution, unsustainable groundwater use at least in parts of the basin is an issue to be addressed. The basins in cluster 3 have three-quarters of the Indian population and produces 62 percent of the grain production and 72 percent of the non-grain crop production. Cluster 4-NoWater Scarcity: Two basins, Brahmaputra and Meghna fall into this category. They have low degree of development, low depletion fractions, low groundwater use. The Brahmaputra has significant crop production surpluses and Meghna has production deficits. These basins have only 5 percent of the total Indian population and contribute to only 4 and 6 percent of the total grain and non-grain production respectively. Cluster 5-No Water Scarcity-High Food Surplus: Three basins East Flowing Rivers between Mahanadi and Pennar, Brahmani-Braitarni and Mahanadi fall in cluster 4. These basins though have high depletion fractions, but have relatively lower degree of development and low groundwater abstraction ratios. Also these basins have significant production surpluses. The water scarcity issues in these basins are relatively less serious and food insecurity is not an issue here. They have 7 percent of the Indian population and contribute to 8 and 13 percents of the total grain and non-grain crop production respectively. IMPLICATIONS FOR FUTURE WATER MANAGEMENT The spatial dynamics of water scarcities give rise to different issues which are important in meeting future water needs of India. In this section we discuss the implications of several such issues for future water development and management.
Growth in Population Because of the huge base population, the population growth pattern will be an important factor for future water resources development and management. The total population of India has
17
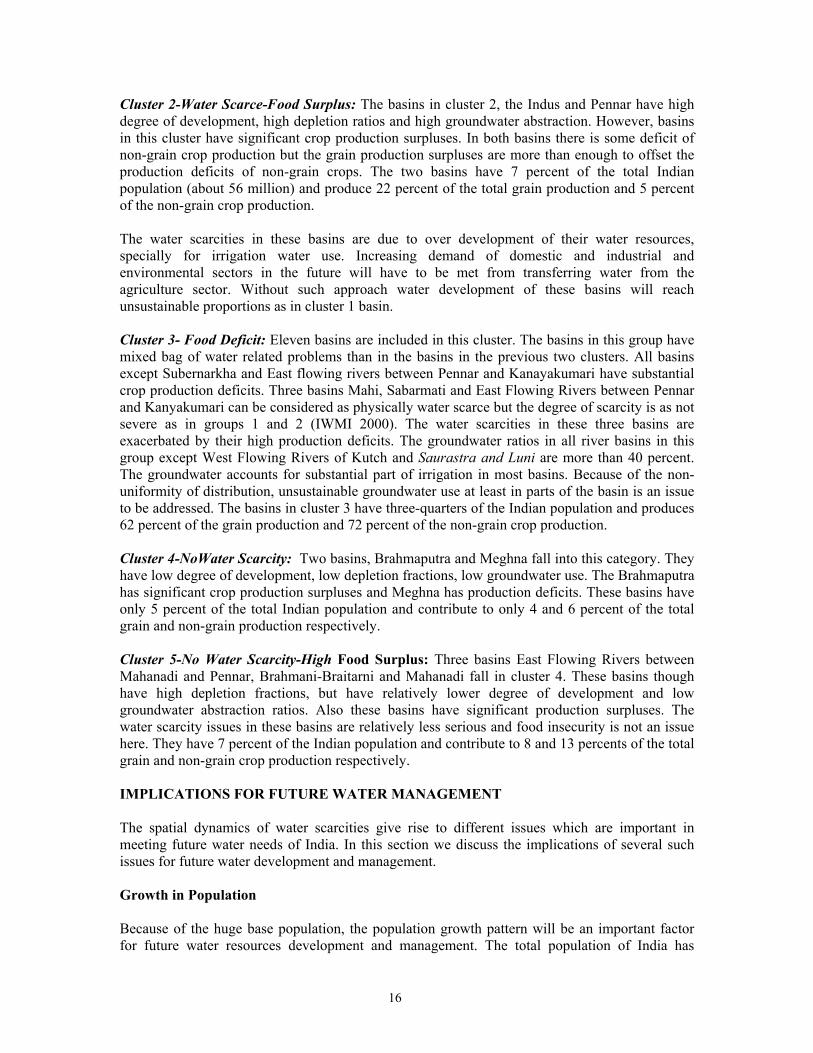
increased at an annual rate of about 2 percent over the last decade. This is projected to increase at an annual rate of 1.19% over the next 25 years under the United Nations Medium population projection scenario (UN 1998). While the increasing trend will continue under UN Medium scenario, total population is projected to stabilize by mid 2030’s under UN Low scenario (Figure 8)
Figure 8. Population growth scenarios of India
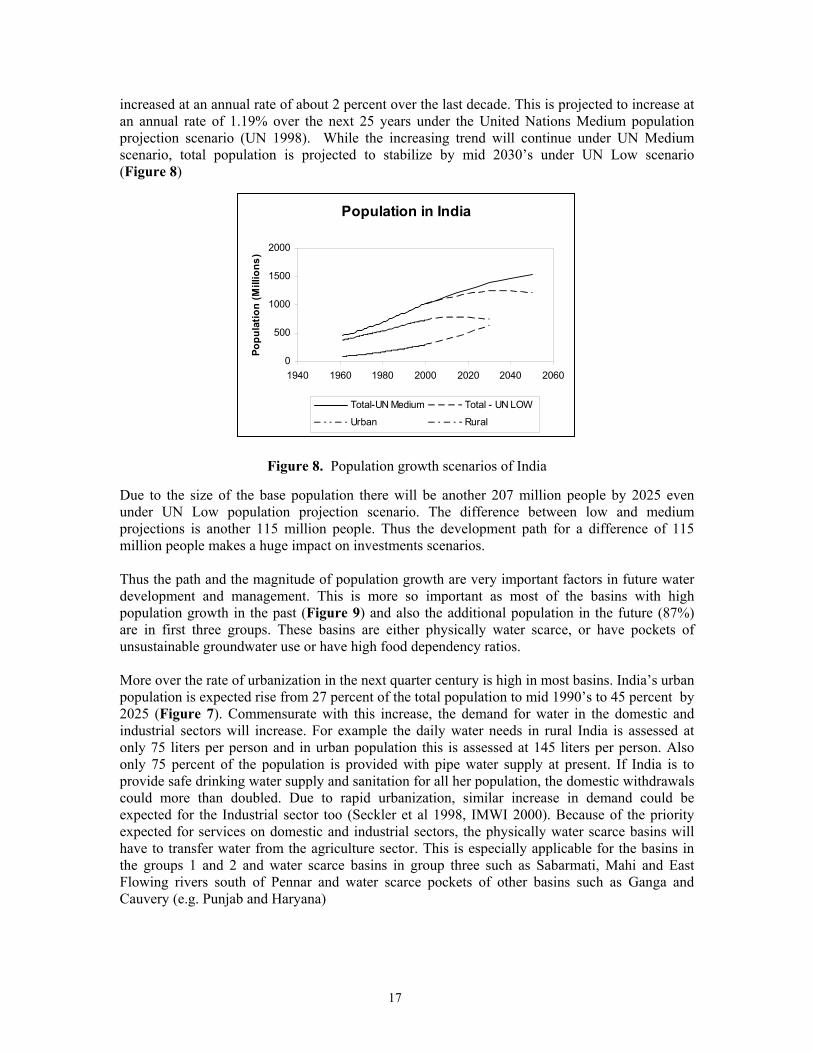
Due to the size of the base population there will be another 207 million people by 2025 even under UN Low population projection scenario. The difference between low and medium projections is another 115 million people. Thus the development path for a difference of 115 million people makes a huge impact on investments scenarios. Thus the path and the magnitude of population growth are very important factors in future water development and management. This is more so important as most of the basins with high population growth in the past (Figure 9) and also the additional population in the future (87%) are in first three groups. These basins are either physically water scarce, or have pockets of unsustainable groundwater use or have high food dependency ratios. More over the rate of urbanization in the next quarter century is high in most basins. India’s urban population is expected rise from 27 percent of the total population to mid 1990’s to 45 percent by 2025 (Figure 7). Commensurate with this increase, the demand for water in the domestic and industrial sectors will increase. For example the daily water needs in rural India is assessed at only 75 liters per person and in urban population this is assessed at 145 liters per person. Also only 75 percent of the population is provided with pipe water supply at present. If India is to provide safe drinking water supply and sanitation for all her population, the domestic withdrawals could more than doubled. Due to rapid urbanization, similar increase in demand could be expected for the Industrial sector too (Seckler et al 1998, IMWI 2000). Because of the priority expected for services on domestic and industrial sectors, the physically water scarce basins will have to transfer water from the agriculture sector. This is especially applicable for the basins in the groups 1 and 2 and water scarce basins in group three such as Sabarmati, Mahi and East Flowing rivers south of Pennar and water scarce pockets of other basins such as Ganga and Cauvery (e.g. Punjab and Haryana)
Population in India
0
500
1000
1500
2000
1940 1960 1980 2000 2020 2040 2060
Popu
latio
n (M
illio
ns)
Total-UN Medium Total - UN LOW
Urban Rural
18
Figure 9. Annual growth of River Basin Population
19
Unless there is a significant increase in productivity, the surplus of crop production in basins such as Indus and Pennar in group 2 may decrease and deficits of crop production in water scarce basins in group 1 and 3 may increase. Issues that are critical for crop production growth are our next focus of discussion.
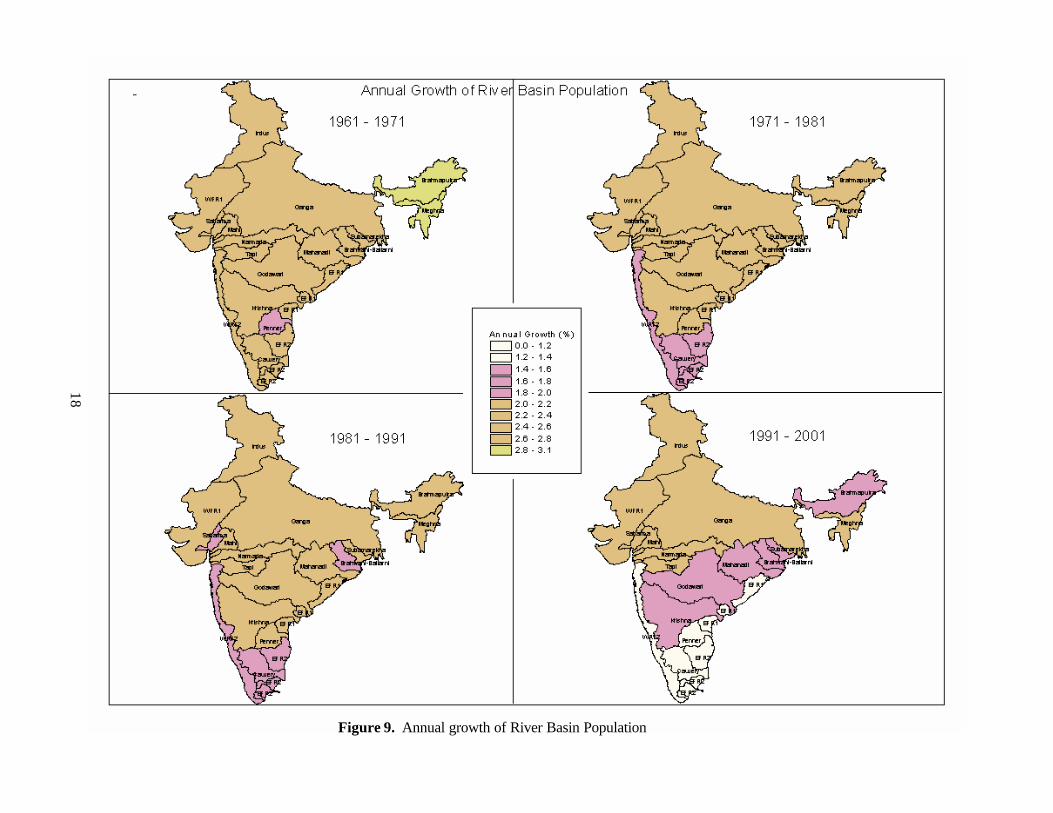
Growth in Crop Production Crop production In India has increased substantially over the last few decades. For example the grains crop production has increased at an annual rate of 2.94 percent while net sown area of grain crops has increased only by 0.16 percent (Figure 10).
Figure10. Area and Production of Grain crops
Most of the growth in production in the past was due to cropping intensity increase and average yield increase. Though the magnitude of contribution is still a debatable issue, irrigation expansion and intensification has thought to have contributed significantly for both intensity and yield increase (WCD 2000, Dhawan 1998, Bhatarri 2003). We briefly look at the role of irrigation on the trends of cropping intensity and crop yields. Growth in cropping Intensity The growth of net sown area, i.e., the cultivable area of all crops of India was increased in the 1960’s and stagnated around 142 M ha during the last three decades (Figure 11). No significant trends of net sown area were recorded in any of the river basins. However, the gross sown area, i.e., the area cropped more than once, in India has increased by 22 percent due mainly to increase in gross irrigated area in cropping intensity. The cropping intensity has increased from 115 percent in 1960 to 132 percent by 1995. The cropping intensity increase has contributed 43 percent of the gross irrigated area increase in the 1960’s. This has increase to 90 and 82 percents respectively in the 1970’s and 1980’s. Over the period from 1960 to 1995, the cropping intensity increase has contributed over three-quarters of the growth in gross sown area. The contributions of cropping intensity increase to gross sown area increase vary significantly across basins (Figure 12).
Area and Production of Grain Crops
0
50
100
150
200
250
1950 1960 1970 1980 1990 2000
Prod
uctio
n ( M
Mt)
Are
a (M
Ha)
Production Area

20
Figure 11. Net and Gross Sown under irrigated and rainfed conditions
The negative values of the Figure 10 show where and when the increase of gross sown area due to cropping intensity increase was less than the increase due to net sown area increase or the decrease in gross sown area was smaller than the net sown area. The positive values show where and when the increase in gross sown area due to cropping intensity increase was higher than the gains due to net irrigated area increase. In general the locations with negative values show where and when area expansion was more prominent and the locations with positive values show where and when the cropping intensity increase was more prominent.
Several basins are in the expansion phase of net sown area in the 1960’s. However, in the 1970’s and after cropping intensity increase has taken a prominent role in most basins. Overall, the contribution from cropping intensity increase to gross sown area growth was higher than the contribution from net sown area increase in all basins. In fact in some basins the gains due to cropping intensity increase was large enough to offset the negative effect on due to decrease net sown area. The cropping intensity increase varies from 1 percent in the Pennar basin to 44 percent in the Indus basin (Table 5). The growth of irrigation was the major factor that contributed for cropping intensity increase. While net sown area of all crops stagnated the net irrigated area, i.e., the area equipped for irrigation continued increasing (Figure 11). The irrigation expansion in most states was mostly at the expense of marginal rainfed lands. The ratio of net irrigated area to net sown area has increased substantially in all river basins, with some basins recording more than 300 percent increase over the period from 1960 to 1995. The expansion and the intensification of cropping irrigated area were the major factors for the growth of cropping intensity in India and also of most river basins.
Net Irrigated and Rainfed area
0
20
40
60
80
100
120
140
160
180
200
1961 1967 1973 1979 1985 1991 1997
Rainfed Irrigated
Gross Irrigated and Rainfed area
0
20
40
60
80
100
120
140
160
180
200
1961 1967 1973 1979 1985 1991 1997
Rainfed Irrigated
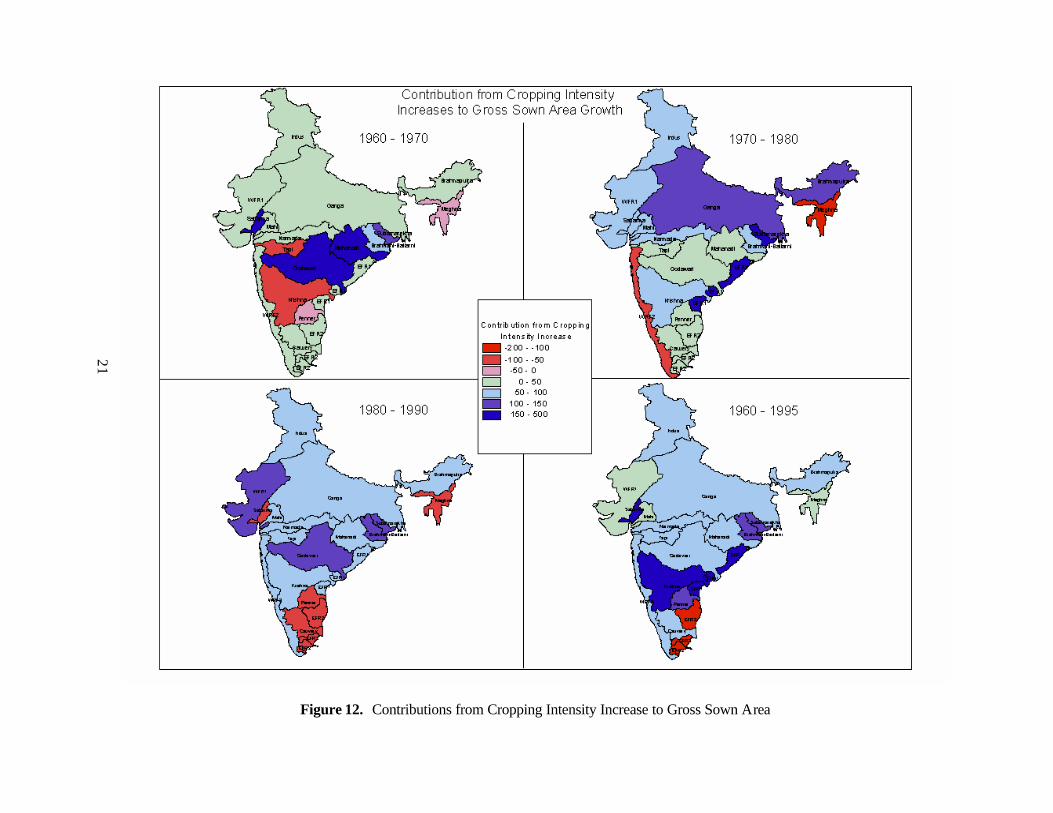
Figure 12. Contributions from Cropping Intensity Increase to Gross Sown Area
21
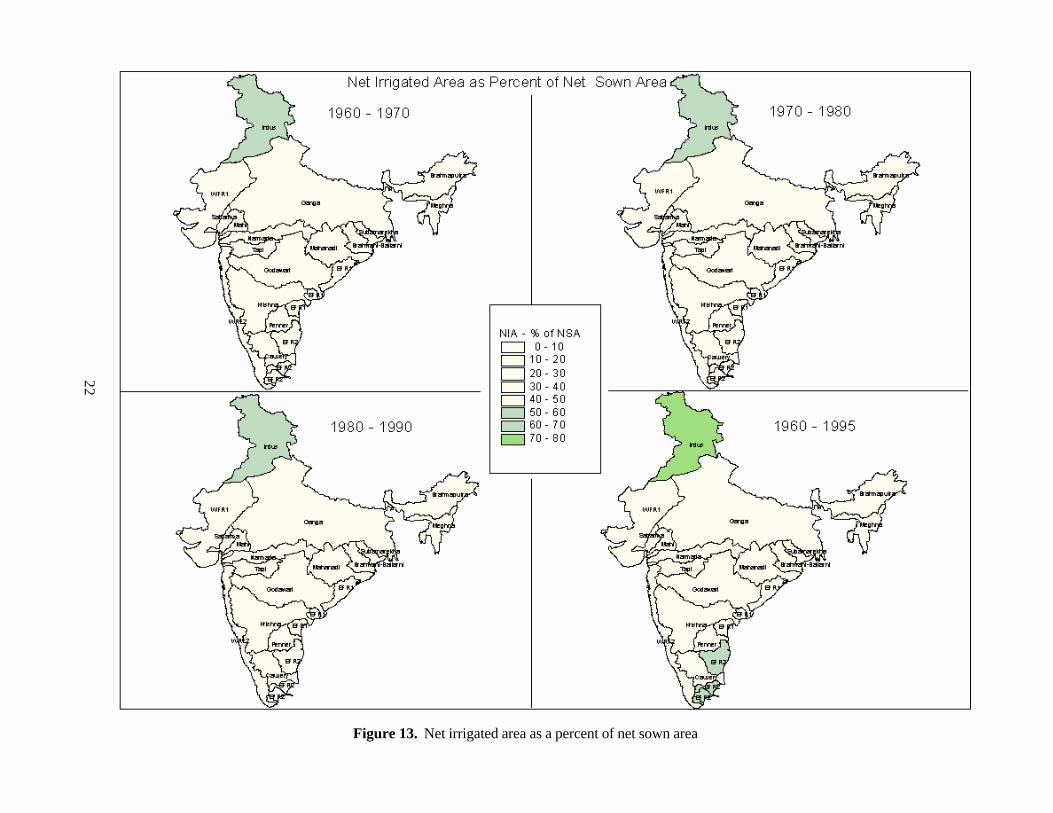
Figure 13. Net irrigated area as a percent of net sown area
22
23
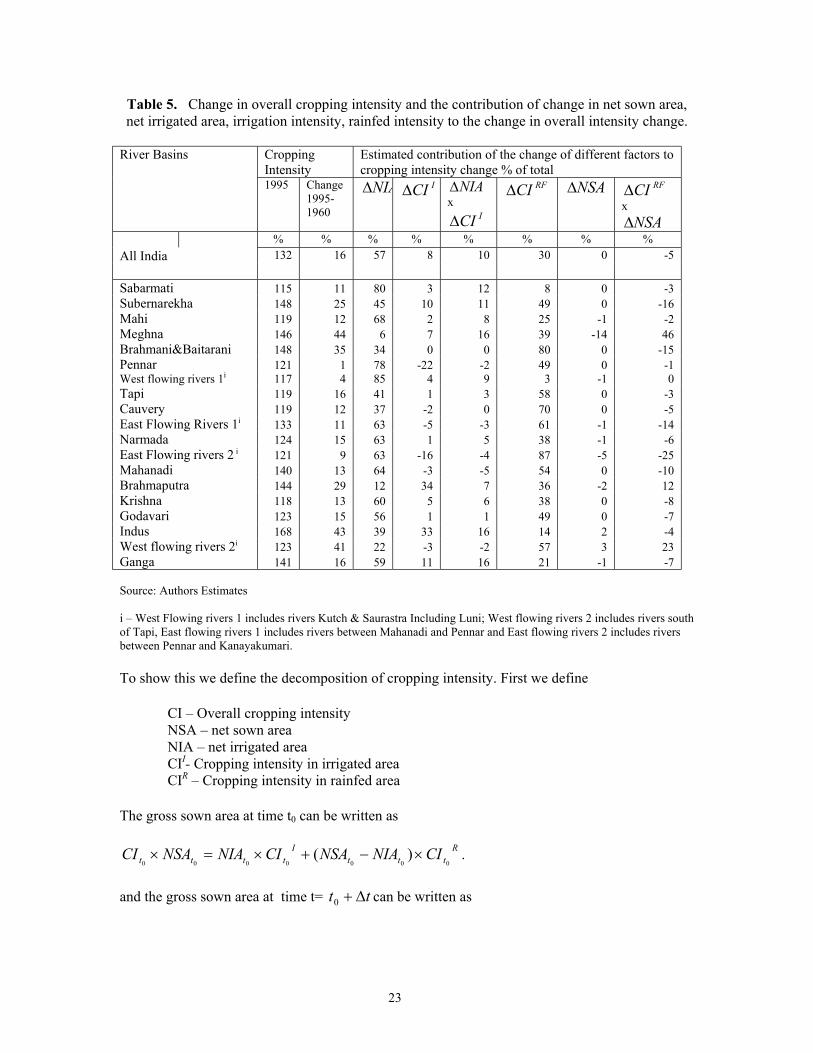
Table 5. Change in overall cropping intensity and the contribution of change in net sown area, net irrigated area, irrigation intensity, rainfed intensity to the change in overall intensity change.
Cropping Intensity
Estimated contribution of the change of different factors to cropping intensity change % of total
River Basins
1995 Change 1995-1960
NIA∆
ICI∆
NIA∆x
ICI∆
RFCI∆
NSA∆
RFCI∆x
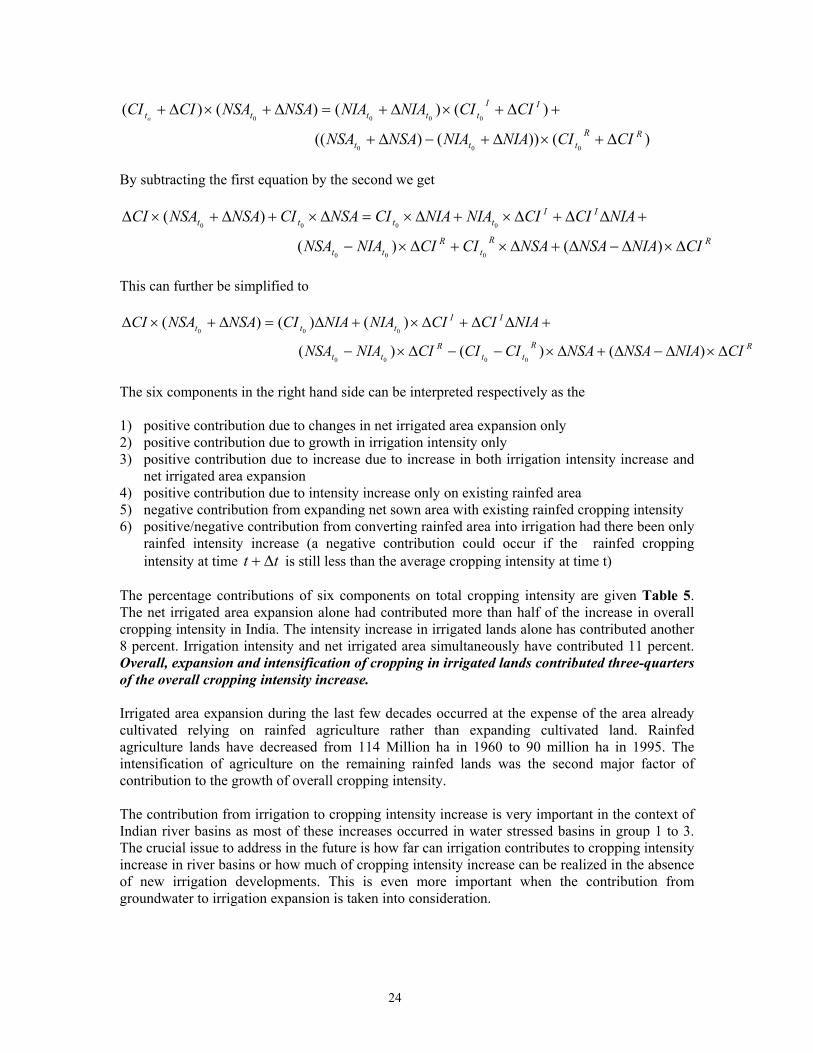
NSA∆ % % % % % % % % All India 132 16 57 8 10 30 0 -5 Sabarmati 115 11 80 3 12 8 0 -3 Subernarekha 148 25 45 10 11 49 0 -16 Mahi 119 12 68 2 8 25 -1 -2 Meghna 146 44 6 7 16 39 -14 46 Brahmani&Baitarani 148 35 34 0 0 80 0 -15 Pennar 121 1 78 -22 -2 49 0 -1 West flowing rivers 1i 117 4 85 4 9 3 -1 0 Tapi 119 16 41 1 3 58 0 -3 Cauvery 119 12 37 -2 0 70 0 -5 East Flowing Rivers 1i 133 11 63 -5 -3 61 -1 -14 Narmada 124 15 63 1 5 38 -1 -6 East Flowing rivers 2 i 121 9 63 -16 -4 87 -5 -25 Mahanadi 140 13 64 -3 -5 54 0 -10 Brahmaputra 144 29 12 34 7 36 -2 12 Krishna 118 13 60 5 6 38 0 -8 Godavari 123 15 56 1 1 49 0 -7 Indus 168 43 39 33 16 14 2 -4 West flowing rivers 2i 123 41 22 -3 -2 57 3 23 Ganga 141 16 59 11 16 21 -1 -7 Source: Authors Estimates i – West Flowing rivers 1 includes rivers Kutch & Saurastra Including Luni; West flowing rivers 2 includes rivers south of Tapi, East flowing rivers 1 includes rivers between Mahanadi and Pennar and East flowing rivers 2 includes rivers between Pennar and Kanayakumari. To show this we define the decomposition of cropping intensity. First we define
CI – Overall cropping intensity NSA – net sown area NIA – net irrigated area CII- Cropping intensity in irrigated area CIR – Cropping intensity in rainfed area
The gross sown area at time t0 can be written as
Rttt
Itttt CINIANSACINIANSACI
0000000)( ×−+×=× .
and the gross sown area at time t= tt ∆+0 can be written as
24
)())()((
)()()()(
000
0000
RRttt
IIttttt
CICINIANIANSANSA
CICINIANIANSANSACICIo
∆+×∆+−∆+
+∆+×∆+=∆+×∆+
By subtracting the first equation by the second we get
RRt
Rtt
IItttt
CINIANSANSACICINIANSA
NIACICINIANIACINSACINSANSACI
∆×∆−∆+∆×+∆×−
+∆∆+∆×+∆×=∆×+∆+×∆
)()(
)(
000
0000
This can further be simplified to
RRtt
Rtt
IIttt
CINIANSANSACICICINIANSA
NIACICINIANIACINSANSACI
∆×∆−∆+∆×−−∆×−
+∆∆+∆×+∆=∆+×∆
)()()(
)()()(
0000
000
The six components in the right hand side can be interpreted respectively as the 1) positive contribution due to changes in net irrigated area expansion only 2) positive contribution due to growth in irrigation intensity only 3) positive contribution due to increase due to increase in both irrigation intensity increase and
net irrigated area expansion 4) positive contribution due to intensity increase only on existing rainfed area 5) negative contribution from expanding net sown area with existing rainfed cropping intensity 6) positive/negative contribution from converting rainfed area into irrigation had there been only
rainfed intensity increase (a negative contribution could occur if the rainfed cropping intensity at time tt ∆+ is still less than the average cropping intensity at time t)
The percentage contributions of six components on total cropping intensity are given Table 5. The net irrigated area expansion alone had contributed more than half of the increase in overall cropping intensity in India. The intensity increase in irrigated lands alone has contributed another 8 percent. Irrigation intensity and net irrigated area simultaneously have contributed 11 percent. Overall, expansion and intensification of cropping in irrigated lands contributed three-quarters of the overall cropping intensity increase. Irrigated area expansion during the last few decades occurred at the expense of the area already cultivated relying on rainfed agriculture rather than expanding cultivated land. Rainfed agriculture lands have decreased from 114 Million ha in 1960 to 90 million ha in 1995. The intensification of agriculture on the remaining rainfed lands was the second major factor of contribution to the growth of overall cropping intensity. The contribution from irrigation to cropping intensity increase is very important in the context of Indian river basins as most of these increases occurred in water stressed basins in group 1 to 3. The crucial issue to address in the future is how far can irrigation contributes to cropping intensity increase in river basins or how much of cropping intensity increase can be realized in the absence of new irrigation developments. This is even more important when the contribution from groundwater to irrigation expansion is taken into consideration.
25
Growth in Groundwater Irrigation: The net groundwater irrigated area in India has increased from about 40 of the net irrigated area in early 1960’s to 55 percent in 1995. Most of the groundwater irrigation expansion occurred in river basins in groups 1 and 2 and also in few basins in group 3 (Figure 13). These basins have moderate to high groundwater abstraction ratios. This indicates these basins may already have pockets of severe groundwater overdraft and hence signs of unsustainable water development. In the absence of large scale surface water resources development, the trend of groundwater development expected to continue and would be a source for livelihood of poor people in rural sector. However, given the unsustainable water use in some locations, where and to what extent in these basins can groundwater development be continued are important issues to be dealt with. For example Tushar Shah (2000) contends that groundwater expansion in eastern Ganga plains would be a partial solution to much of the floods and associated poverty. The unprecedented growth in water development, both surface and groundwater in western states such as Punjab and Haryana had increased the food production in the past, but the rate of growth of food production there is decreasing. With little emphasis on large scale surface water development schemes, groundwater irrigation expanding fast in Eastern India. Growth in Crop Yield The contribution of irrigation to the growth of agriculture production in India is well documented (CWC 1998, Dhawan 1988 , Battari 2003). Battari et al 2003 has estimated that irrigation has contributed as much as quarter of the growth in total crop productivity. Though the estimates of magnitude vary, the statistics at national level clearly show the association between irrigation growth and crop yields. For example, the average yield of grain crops is highly associated with the ratio of irrigated grain area to total grain harvested area (Figure 14). The average yield of grain crops has increased at an annual rate of 2.94 percent over the last three decades. The ratio of irrigated grain area to total grain area has increased at an annual rate of 2.48 percent. The association of irrigation and average yield seems much stronger after mid 1980’s. Part of the reason for this is that most of the other inputs such as fertilizer, high yielding varieties that has contributed for yield growth have reached its full potential impacts now. Of the different sources of irrigation, the groundwater has contributed the most to average yield growth. Across river basins, there exist a strong correlation between net groundwater irrigated area and the growth in grain yield. Thus the crucial issue that every river basin has to tackle is the potential for irrigated yield growth in the absence or with a little growth in irrigated area. Further more, where and what magnitude the groundwater irrigation expansion would also be crucial factor for average yield growth. This is especially true for river basins in Group 1 and 3 with high groundwater abstraction ratios.
Environmental Flow Requirements The environmental flow requirements (environmental water demands) of river basins are attracting increasing attention in recent years (e.g. Naiman et al, 2002). The increasing demands of irrigation, domestic and industrial sectors in the past were met without consideration of the needs of freshwater ecosystems themselves. Some previous practices of environmental water allocations were narrowed down to keeping some minimum flow in the river downstream of the major abstractions. Even these practices however had limited applications in India. In general, the research on estimating eco-system water requirements in most of the developing countries is currently at the very beginning. A recent first global study conducted jointly by IWMI, WRI,
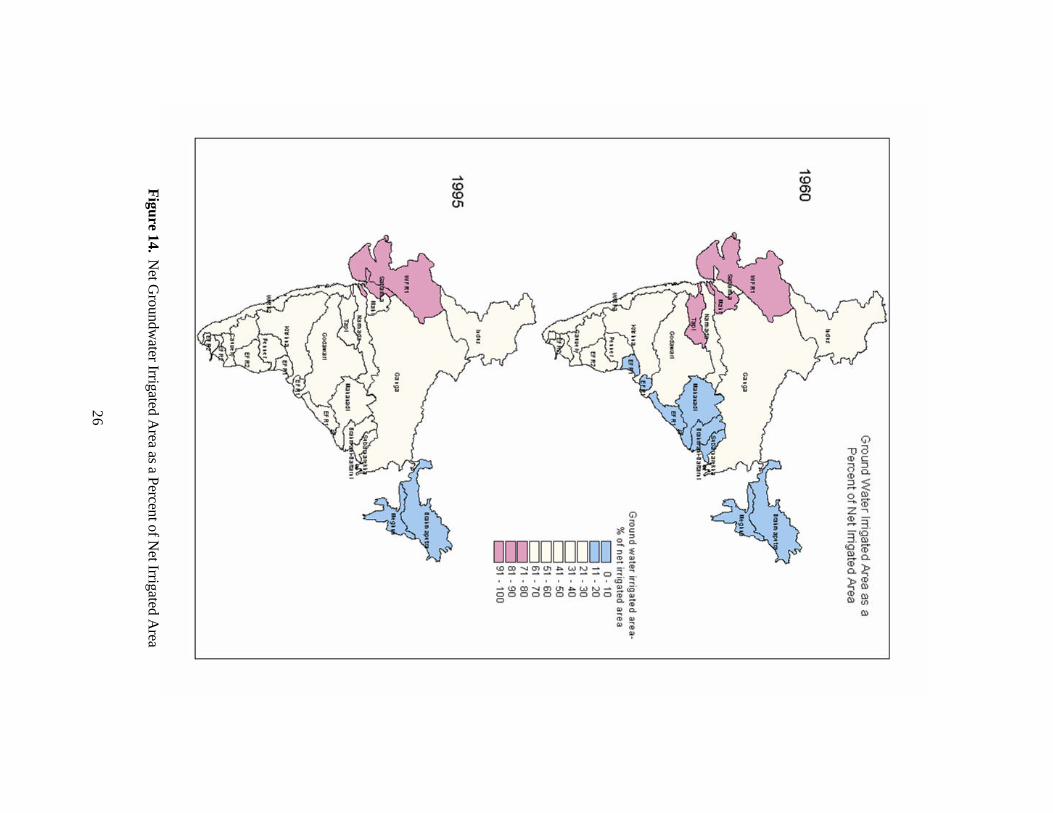
Figure 14. N
et Groundw
ater Irrigated Area as a P
ercent of Net Irrigated A
rea
26
27
Figure 15. Indices of average grain yield and the grain irrigated are
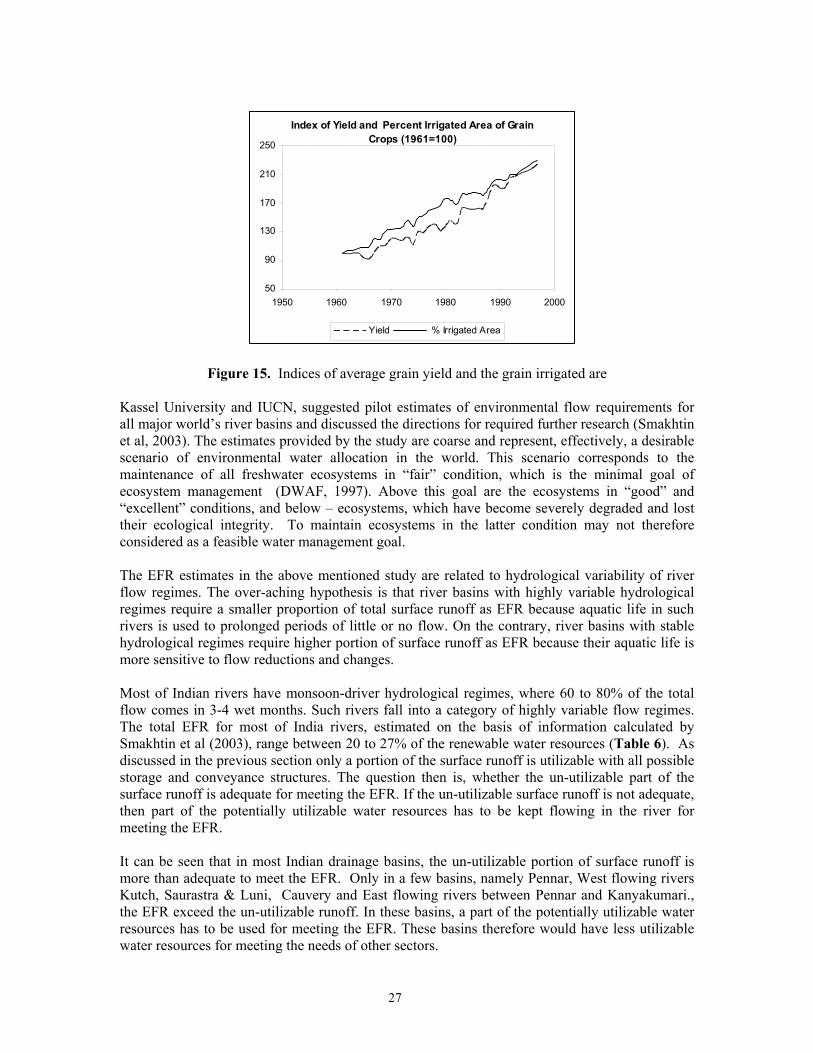
Kassel University and IUCN, suggested pilot estimates of environmental flow requirements for all major world’s river basins and discussed the directions for required further research (Smakhtin et al, 2003). The estimates provided by the study are coarse and represent, effectively, a desirable scenario of environmental water allocation in the world. This scenario corresponds to the maintenance of all freshwater ecosystems in “fair” condition, which is the minimal goal of ecosystem management (DWAF, 1997). Above this goal are the ecosystems in “good” and “excellent” conditions, and below – ecosystems, which have become severely degraded and lost their ecological integrity. To maintain ecosystems in the latter condition may not therefore considered as a feasible water management goal. The EFR estimates in the above mentioned study are related to hydrological variability of river flow regimes. The over-aching hypothesis is that river basins with highly variable hydrological regimes require a smaller proportion of total surface runoff as EFR because aquatic life in such rivers is used to prolonged periods of little or no flow. On the contrary, river basins with stable hydrological regimes require higher portion of surface runoff as EFR because their aquatic life is more sensitive to flow reductions and changes. Most of Indian rivers have monsoon-driver hydrological regimes, where 60 to 80% of the total flow comes in 3-4 wet months. Such rivers fall into a category of highly variable flow regimes. The total EFR for most of India rivers, estimated on the basis of information calculated by Smakhtin et al (2003), range between 20 to 27% of the renewable water resources (Table 6). As discussed in the previous section only a portion of the surface runoff is utilizable with all possible storage and conveyance structures. The question then is, whether the un-utilizable part of the surface runoff is adequate for meeting the EFR. If the un-utilizable surface runoff is not adequate, then part of the potentially utilizable water resources has to be kept flowing in the river for meeting the EFR. It can be seen that in most Indian drainage basins, the un-utilizable portion of surface runoff is more than adequate to meet the EFR. Only in a few basins, namely Pennar, West flowing rivers Kutch, Saurastra & Luni, Cauvery and East flowing rivers between Pennar and Kanyakumari., the EFR exceed the un-utilizable runoff. In these basins, a part of the potentially utilizable water resources has to be used for meeting the EFR. These basins therefore would have less utilizable water resources for meeting the needs of other sectors.
Index of Yield and Percent Irrigated Area of Grain Crops (1961=100)
50
90
130
170
210
250
1950 1960 1970 1980 1990 2000
Yield % Irrigated Area
28
Table 6. Environmental Flow Requirements Environmental flow
requirements (EFR) River Basins Total -% of total total
renewable water resources
Un-utilizable total renewable water resources
EFR -Un-utilizable TRWR
Degree of Development
with environmental
flow requirements into account
Km3 % Km3 Km3 All basins 476.3 25 1197.2 721 42 Sabarmati 0.9 23 1.9 1.0 67 Subernarekha 3.0 24 5.6 2.6 42 Mahi 2.6 23 7.9 5.3 65 Meghna 13.2 27 46.7 33.5 15 Brahmani&Baitarani 6.9 24 10.2 3.3 26 Pennar 1.7 27 0.0 -1.7 108 West flowing rivers 1i 3.1 21 0.1 -3.0 151 Tapi 3.5 23 0.4 -3.1 36 Cauvery 5.3 25 2.4 -2.9 48 East Flowing Rivers 1i 6.1 27 9.4 3.3 45 Narmada 10.6 23 11.1 0.5 20 East Flowing rivers 2 i 4.4 27 0.0 -4.4 76 Mahanadi 16.0 24 16.9 0.9 21 Brahmaputra 159.3 27 563.3 404.0 11 Krishna 19.1 24 20.1 1.0 41 Godavari 26.4 24 34.2 7.8 27 Indus 18.5 25 27.3 8.8 84 West flowing rivers 2i 54.0 27 164.7 110.6 22 Ganga 121.8 23 275.0 153.2 44 Source: Authors estimates i – West Flowing rivers 1 includes rivers Kutch & Saurastra Including Luni; West flowing rivers 2 includes rivers south of Tapi, East flowing rivers 1 includes rivers between Mahanadi and Pennar and East flowing rivers 2 includes rivers between Pennar and Kanayakumari.
The EFR estimates, which have currently been built into our assessment, may only be considered as preliminary. They have been based exclusively on hydrological information, simulated at the coarse level and do not explicitly include ecological information on Indian freshwater ecosystems and social aspects, associated with river water use and conservation. These estimates need verification through more detailed, basin-specific assessments of the EFR. At the same time, it is important to understand that environmental allocations of less then 20% of the total flow are most likely to degrade any river beyond the limits of possible re-habilitation. An additional factor, not yet considered in the assessment, is that a reduction in river flows decreases the ability of a river to cope with pollution loads. These loads are known to be massive in many Indian basins.
Reallocation of Agriculture Withdrawals The water productivity of grain crops varies substantially across river basins (Figure 14) and also is substantially different from non-grain crops. The water productivity of irrigated grain crops (0.13 $/m3 of ET) is only one-third of the water productivity of non-grain crops (0.35 $/m3 of ET). The estimation of the value of crop production is given in the appendix. The difference of

29
water productivities of grains and non-grain crops are substantial in all river basins except the physically water scarce basins in groups 1 and 2. The river basins in groups 1 and 2 have relatively higher land productivity compared to other basins. Also the differences between grain and non-grain crop productivities in these river basins are not substantial.
Figure 16. Water productivities of grain and non-grain crops
This indicates that substantial increases in production increases can be attained in some basins by slight reallocation of water withdrawals from grains to non-grains crops. To illustrate this we consider two scenarios of water reallocation. Table 4 shows the gains in the value of total production and changes in the value of production surpluses or deficits for the two different scenarios. Here reallocation scenarios are applied to all basins regardless of their productivity differences. Scenario 1- 5% reallocation: If 5 percent of the water withdrawal to grain crops in each basin is reallocated to non-grain crops, there would be a production surplus of 3 percent. Under this scenario, there would be a deficit of 2.5% of grain crop production. However the surplus value of

30
production of non-grain crops would be sufficient to off set the deficits of the value of the production of grain crops . Scenario 2 – 10% reallocation: The second scenario reallocates 10 percents of the water withdrawals to non-grain crops. This scenario would record a substantial production surplus of all crops. However, the deficit of the value of grain crop production would increase to 6% and the surplus of the value of non-grain crops would increase to 13 percent. India is a large country and its grain production is ranked third behind USA and China and most non-grain crop production ranked first or second or third with USA and China. Therefore substantial production deficits or production surpluses of grain or non-grain crops would have a significant impact on the prices. Such scenarios would affect both producers and consumers. India cannot offered to be in such a situation due to two reasons: 1) livelihoods of more than 250 million people are directly depended on agriculture (FAO 2002) and 2) more than 400 million people are poor and undernourished at present (FAO 2000) . Therefore such water reallocation scenarios have to be carefully planned, especially among the river basins so that overall production surpluses will not only help the Indian producers with better prices but also help poor people to buy food at affordable prices. POLICY ISSUES AND CONCLUSION Our discussion here centers on few issues for meeting future water demand. These are 1. How much more irrigation is required and which basins could contributes to meet this
demand, 2. What would be the potential contribution from groundwater for meeting future water
demand 3. What is the potential for water transfers in and out of basins
How Much More Irrigation
The issue of how much more irrigation requires from each river basin depends on several factors including
How much of productivity of water use can be increased from the present levels of water use?
What percentage of non-beneficial depletion can be reduced from the present level? What portion of un-utilized return flows can be tapped for water reuse? What is potential for improvements in rain-fed agriculture? What is the additional demand of domestic and industrial sectors which competes directly
with irrigation sector for scarce water use? What portion of the environmental water requirements has to be met from utilizable
water resources? What is the potential for increase trade of crop commodities?
Increasing productivity of water use: In most Indian basins the productivity of water consumed is very low at present. Substantial room exists for further improvements. Possible avenues for increasing productivities are discussed in Molden 1998, Molden, Amarasinghe, Huzzain 2001. Briefly these are, changing crop varieties thus providing increased yields for present level of water consumed or increased yield for fewer units of water consumed; substituting crops from
31
high water consuming to low water consuming crops; practicing deficit, supplemental or precision irrigation techniques to save water and increased irrigated area; Improving water management through reliable water supplies to increase yields directly or indirectly through better input applications; and optimizing non water inputs. Improvements in the above areas in a basin would result in net water savings or improvements in production thus reducing the requirement for additional irrigation water resources developments. Reducing Non-beneficial Evaporation: At present more than one-third of the primary water supply in India is lost as non-beneficial depletion. Most of this lost at the moment is from irrigation water withdrawals. Non-beneficial evaporation can be reduced by effective irrigation practices such as precision irrigation techniques, adjustments of crop planting to match periods of less evaporative demand etc; reducing water or polluted water flowing to sinks; increase water re-use etc. Tapping un-utilized return flows: Part of the return flows cannot be captured for further use with the available infrastructure at present. Reusing these flows through gravity or pump diversions would reduce the un-utilized return flows. Potential for rainfed production Increase: Almost two-third of the total crop sown area at present in India is in rainfed areas. However, due to low productivity rain-fed area contributes to only 40 percent of the total production. For example, had rain-fed grain yield been 0.50 ton/ha higher (Only 0.99 tons/ha at present) the total grain production would have been 20 percent higher. What is the true potential for rainfed productivity increase and hence production increase would be significant factor in future irrigation needs estimate. Supplemental irrigation in rainfed areas shows high potential for rainfed productivity increase. Increasing domestic and industrial demand: The domestic and industrial water demand receives higher priority over irrigation water supplies. These two sectors, especially in water scarce regions or in water scarce periods compete for water resources available for irrigation. Thus the portion of present irrigation water withdrawals which will be allocated for meeting the additional domestic and industrial demand is a key factor in future irrigation withdrawals of a basin.
Potential from Groundwater Most river basins in the third to fifth group have high potential for further groundwater exploitation. For example, only about half of the groundwater is exploited at present in the Ganga basin, only one-third of the groundwater resources is exploited in the Godhavari basins. Majority of the groundwater development in the past was in western areas of these river basins. There is evidence that the groundwater development is spreading fast into eastern parts of the basins (Shah 2002). Overall, groundwater contributes to 57 percent of the total irrigated area, but its contribution to total irrigation is only 44 percent. Because of easy access to the resources and also due to the reliability of supply, the quantity of irrigation required from groundwater is much less than surface water resources. Therefore, the potential expansion of groundwater irrigation is a major factor in the equation of determining how much more irrigation in the future. Environmental Water Needs The environmental flow requirements of most basins, as considered in this paper can be met from the un-utilizable portion of the surface runoff. Only four basins require allocation from the potentially utilizable water resources. Three of the basin areas, the Pennar, West flowing Rivers

32
of Kutch, Saurastra and Luni and East Flowing Rivers between Pennar and Kanayakumari are already severely water scarce that they already have developed significant amount of their utilizable water resources for meeting irrigation, domestic and Industrial needs. If environmental requirements as specified in the paper are to be met in the future, these basins will have to forgo portion of the water resources already developed for other sectors. The estimates presented will certainly need to be revised. While hydrological variability is an important determinant of ecosystem water needs, other factors, including bio-physical and social aspects, institutional context, technical and political feasibility of allocating water to ecosystems in each basin and/or state, need to be taken into account in determining the environmental flow requirements ( e.g.Dyson et al, 2003). Therefore, accurate estimates of environmental flow needs represent a research issues of utmost importance, if sustainable water resources development in India is to be achieved. What portion of the surface runoff should be allocated for meeting of environmental needs is a crucial policy issue for the future water resources development. Water Transfers between Basins The potential for water transfers between river basins is an option strongly considered for alleviating water scarcity in some basins. Linking of major rivers is getting momentum. Major objective here is to transfer water from water rich rivers in basins such as Ganga, Brahmaputra, Godhawari to water scarce central, western and southern regions. Like in many other water development work, the there are strong concerns on linking of rivers due to adverse impact on freshwater eco-systems down stream and on displacing millions of people from potential storage locations (www.narmada.org 2003) as well as strong reasons for linking of rivers on the premise that this will provide water to millions of people in water scarce regions. In most cases, linking rivers means diverting water from the potentially utilizable water resources (PUWR). Which basins have excess PUWR for transferring out after meeting the additional future demand of all other sectors in a basin?. Which basins can divert un-utilizable renewable water resources to water scarce region? These issues needs to be further researched for understanding the benefits and cost of such a programme.
Trade At present the water productivity of grain crops in some basins is quite low. A slight re-allocation of water withdrawals from grain crops to non-grain crops would result in significant surpluses of value of non-grain crop production. The value of production surpluses of non-grain crops is adequate to meet the value of production deficits in grain crops. Thus in principle the exports of non-grain crop production surpluses are adequate to pay for the imports of grain crops, for which the most of the present water withdrawals diverted for. However, India is a big country and does contribute to substantial part of the worlds’ grain and non-grain crop production. Substantial deficits of grain crops or surpluses of non-grain crops would have an adverse impact on the import and export prices. This in turn would affect both producers where majority of them live in rural areas, and also consumers where majority of them are India’s malnourished population. Yet, there are other options that India can consider. Though hugh surpluses or deficits at national scale are not desirable, surpluses or deficits at basin scale would offer a solution for water scarce basins. Basins where water productivity is high or where water is not a constraint for grain crop production can offer to have higher surpluses in grain crops, while basins with water scarcities can reallocate water to non-grain crops or other use to pay for imports of grain crops. Where and in what magnitude these can be done needs to researched for individual basins.
33
CONCLUSION The water resources availability and demand in India show substantial spatial and temporal variations. Water supply and demand analyses across river basins indicate that some basins are water scarce due to inadequate availability of water resources while some other basins are water scarce due to excessive development. India as a country has abundant water resources and also is utilizing less than half of the potentially utilizable water resources. However, this varies substantially across basins. Water availability varies from 340 m3 per person in Sabarmati basin to more than 17000 m3 per person in Brahmaputra basin. The total water resource per person in India is about 2000 m3. The total water withdrawals in India are primarily dominated by irrigation needs. About 90 percent of the total water withdrawals are for irrigation sector. The per capita irrigation withdrawals vary from 190 m3 in Megna basin to 1678 m3 in Indus basin. The mis-matches in water supply and demand are creating water scarcities in some basins. The water scarcities in some basins are exacerbated by unsustainable groundwater uses and high dependency for food from other basins. The West flowing rivers of Kutch, Saurastra & Luni area is not only physically water scarce but also has unsustainable groundwater use and substantial food production deficits. In terms of severity of water scarcity this basin stands out from others. Two other basins, Indus and Pennar, are also physically water scarce and also have pockets of unsustainable groundwater use. However, these basins have substantial food production surpluses. Several other basins have mix bag of problems ranging from either physical water scarcities, or pockets of unsustainable ground water use or high dependency ratios for the basin’s crop demand. The paper identified few critical issues that need to be carefully considered for meeting the future water demand estimation in river basins. The spatial variation of growth of population is a major factor in future water demand estimations. This is very important factor that most of the basins with severe water scarcity problems have also had high population growth in the past and are projected to have substantial part of the additional population in the future. The growth of crop production in a scenario of reduce growth in irrigation is another important issue to be addressed. In most basins, irrigation growth in the past few decades was a key factor in the growth of cropping intensity and crop yields. The cropping intensity increase was the significant contributor to crop area growth in most basins. However the growth of irrigation is slowing down and impact of this on overall crop production growth need careful attention. The sustainability of groundwater use in some locations is an important issue for future demand estimations. Groundwater contributes to a significant amount of the irrigation needs. However, there are indications that some basins have pockets of unsustainable groundwater use. These will factor in estimating future irrigation demands. The low water productivity is also an important issue to be tackled. The grain crops dominate irrigation in most basins. However, the water productivity of grain crops is about one-third of the non-grain crops. There is a substantial potential for increasing overall water productivity through reallocation of water resources. A slight reallocation of irrigation water to non-grain crops has the potential to generate substantial surpluses in overall crop production. Because of India’s position in the world’s agriculture production, substantial deficits in production in grain crops or substantial production surpluses in non-grains crops would have significant effects on prices and hence both the consumers and producers needs careful attention. One alternative option is to have substantial surpluses or deficits at basin level but have overall self sufficiency at national level. An important policy issue here is which basins to have substantial surpluses or deficits in grain or non-grain crops.
34
The all important question of “How much more irrigation in the future?” for India depend on several factors. The potential growth in productivity in both existing irrigation and rain-fed lands, potential reduction in non-process depletion and un-utilized return flows, potential for groundwater development, environment flow requirements, all play a major role. LITERATURE CITATION Agrawal, A. 1998, Coping with dry spells and drought years – India’s traditions in water harvesting. Stockhlom Water
Front, No.1-2, May 1998. Stockholm, Sweden: Amarasinghe, Upali A., R. Sakthivadivel, L. Mutuwatta 1998, Water Scarcity Variations within a country: A case
Study of Sri Lanka IWMI Research Report 32. Colombo: International Water Management Institute. Battari, M, R. Barker, A. Narayanmoorthy 2003, Impact of Irrigation and Selected other Factor-inputs to Agricultural
Productivity Growth in India: A Cross-state Level Macro Analysis from 1970 to 1994, (Paper submitted for World Development journal on June 23rd, 2003)
Dhawan, D. 1998, Irrigation in India’s agricultural Development. Productivity, Stability and Equity. New Delhi: SAGE Publications
DWAF (1997) White paper on a National Water Policy for South Africa. Department of Water Affairs and Forestry. Pretoria, South Africa
Dyson, M. Bergkamp, G. Scanlon, J.-(eds) (2003) Flow – the essentials of environmental flows. IUCN. Gland, Switzerland and Cambridge, UK . xiv+118 pp.
Central Water Commission (CWC) 1998, Water Statistics of India, Delhi, India: Central Water Commission. Falkenmark, Lundqvist and Widstrand (1989). Macro-scale water scarcity requires micro-scale approaches: Aspects of
vulnerability in semi-arid development. Natural Resources Forum 13 (4): 258-267. FAO (Food and Agriculture Organization) 2002a, AQUASTAT Statistical Database www.fao.org Rome: FAO FAO (Food and Agriculture Organization) 2002a FAOSTAT Statistical Database, www.fao.org Rome: FAO. Glieck, Peter H. 2000. The world’s water 2000-2001. The Biennial Report on Freshwater Resources. Oxford, England:
Oxford University Press. GOI (Government of India) 1999, Report of the National Planning Commission Integrated Water Resources
Development, India: Government of India ICID (International Commission of Irrigation and Drainage) 2000. Country Policy Support Study – India, In Country
Policy Support Studies, Delhi: International Commission of Irrigation and DrainageIWMI IWMI (International Water management Institute) 2000. World Water Supply and Demand 1995 to 2025, Draft Report
prepared for World water Vision. Colombo, Sri Lanka: International Water Management Institute IWP (India Water Partnership) 2000, India Water Vision 2025, New Delhi, India: Institute for Human Development. Molden, David 1997. Accounting for water use and productivity. SWIM paper 1. Colombo, Sri Lanka: International
Water Management Institute Naiman R.J., Bunn S.E., Nilsson C., Petts G.E., Pinay G. & Thompson L.C. (2002) Legitimizing fluvial ecosystems as
users of water. Environmental Management 30, 455-467. Rijisberman, Frank R. 2000 World water Scenarios. Analysis, London: UK: Earthscan Publications Ltd. Rosegrant, M. W.; Cai, X.; Cline, S. A. 2002. World water and food to 2025: Dealing with scarcity. Washington, DC,
USA: International Food Policy Research Institute. Seckler D, Upali A. Amarasinghe, David Molden, Radhika de Silva and Randoloph Barker 1998. World Water Supply
and Demand, 1995-2025: IWMI Research Report 19, Colombo, Sri Lanka: International Water management Institute
Scott, C, Barker, R.;. A.; de Fraiture, C.; Amarasinghe, U. 2000. Global water shortages and the challenge facing Mexico. International Journal of Water Resources Development, 16(4):525-542
Shah, T. 2001. Wells and Welfare in the Ganga Basin: Public Policy and Private Initiative in Eastern Uttar Pradesh, India. IWMI Research Report 54. Colombo, Sri Lanka: International Water Management Institute.
Smakhtin, V., Revenga, C. and Doll, P. 2003. Environmental water requirements and global water availability. International Water Management Institute, Sri Lanka (In Draft).
SPSS 1998. SPSS Advance Statistical Software Package, Illinois, U.S.A: SPSS Inc. Shiklomonove, I. A. 1997.Assessment of Water Resources and Water Availability of the World. World Meteorological
Organization. (Duplicated) WCD (World Commission of Dams). 2000. Dams and Development, A New Framework for Decision Making. The
report of the World Commission of Dams. London: Earthscan Publication Ltd. WRI (World Resources Institute). 1999. World Resources 1998-1999. New-York: Oxford University Press.
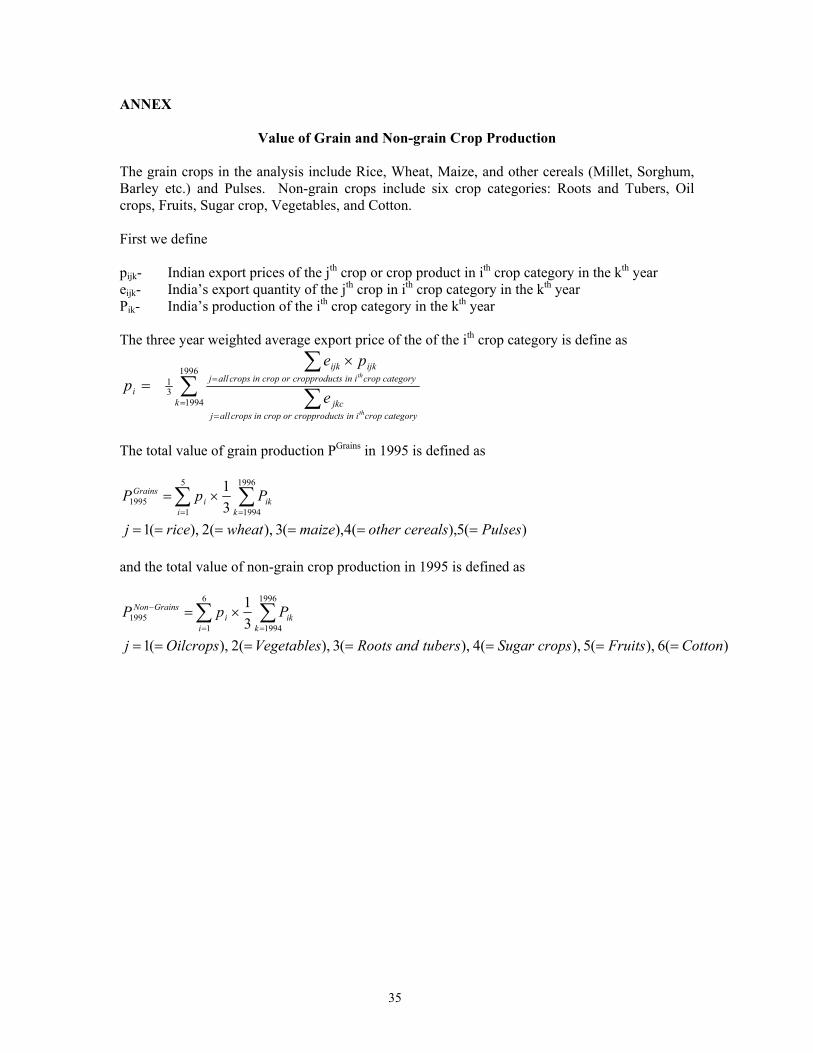
35
ANNEX
Value of Grain and Non-grain Crop Production The grain crops in the analysis include Rice, Wheat, Maize, and other cereals (Millet, Sorghum, Barley etc.) and Pulses. Non-grain crops include six crop categories: Roots and Tubers, Oil crops, Fruits, Sugar crop, Vegetables, and Cotton. First we define pijk- Indian export prices of the jth crop or crop product in ith crop category in the kth year eijk- India’s export quantity of the jth crop in ith crop category in the kth year Pik- India’s production of the ith crop category in the kth year The three year weighted average export price of the of the ith crop category is define as
∑ ∑
∑=
=
=
×
=1996
199431
kcategorycropiintscropproducorcropincropsallj
jkc
categorycropiintscropproducorcropincropsalljijkijk
i
th
th
e
pep
The total value of grain production PGrains in 1995 is defined as
)(5),(4),(3),(2),(1315
1
1996
19941995
Pulsescerealsothermaizewheatricej
PpPi k
ikiGrains
======
×=∑ ∑= =
and the total value of non-grain crop production in 1995 is defined as
)(6),(5),(4),(3),(2),(1316
1
1996
19941995
CottonFruitscropsSugartubersandRootsVegetablesOilcropsj
PpPi k
ikiGrainsNon
=======
×=∑ ∑= =
−

36
Annex Table 1. Percentage of Area of Indian States in Different River Basins
Riv
er
Bas
in
Indu
s
Gan
ga
Bram
hap
utra
Bara
k &
Oth
ers
Sube
rnar
ekha
Brah
man
i-B
aita
rni
Mah
anad
i
God
avar
i
Kris
hna
Penn
ar
Cau
very
Tapi
Nar
mad
a
Mah
i
Saba
rmat
i Wes
t flo
win
g riv
ers
1 W
est
Flow
ing
river
s 2
East
Fl
owin
g riv
ers
1
East
Fl
owin
g riv
ers
2
Tota
l
State % % % % % % % % % % % % % % % % % % % % Andhra Pradesh 0 0 0 0 0 0 0 28 29 17 0 0 0 0 0 0 0 20 5.1 100 Arunanchal Pradesh 0 0 100 0 0 0 0 0 0 0 0 0 0 0 0 0 0 0 0 100 Assam 0 0 90 9.8 0 0 0 0 0 0 0 0 0 0 0 0 0 0 0 100 Bihar 0 84 0 0 7.4 8.9 0.1 0 0 0 0 0 0 0 0 0 0 0 0 100 Goa 0 0 0 0 0 0 0 0 0 0 0 0 0 0 0 0 100 0 0 100 Gujrat 0 0 0 0 0 0 0 0 0 0 0 2.1 5.9 6.5 12 69 4 0 0 100 Haryana 30 70 0 0 0 0 0 0 0 0 0 0 0 0 0 0 0 0 0 100 Himachal Pradesh 90 10 0 0 0 0 0 0 0 0 0 0 0 0 0 0 0 0 0 100 Jammu & Kashmir 100 0 0 0 0 0 0 0 0 0 0 0 0 0 0 0 0 0 0 100 Karnatka 0 0 0 0 0 0 0 3 59 4 17 0 0 0 0 0 14 0 2.8 100 kerla 0 0 0 0 0 0 0 0 0 0 5.7 0 0 0 0 0 93 0 1 100 Madhya Pradesh 0 46.7 0 0 0 0.3 16 14 0 0 0 1.5 20 1.9 0 0 0 0 0 100 Maharastra 0 0 0 0 0 0 0 47 22 0 0 18 1 0 0 0 12 0 0 100 Manipur 0 0 0 100 0 0 0 0 0 0 0 0 0 0 0 0 0 0 0 100 Meghalaya 0 0 38 62 0 0 0 0 0 0 0 0 0 0 0 0 0 0 0 100 Mizoram 0 0 0 100 0 0 0 0 0 0 0 0 0 0 0 0 0 0 0 100 Nagaland 0 0 69 34 0 0 0 0 0 0 0 0 0 0 0 0 0 0 0 100 Orissa 0 0 0 0 6.2 23 45 11 0 0 0 0 0 0 0 0 0 15 0 100 Punjab 100 0 0 0 0 0 0 0 0 0 0 0 0 0 0 0 0 0 0 100 Rajasthan 5.3 34.2 0 0 0 0 0 0 0 0 0 0 0 4.6 1 54 0 0 0 100 Sikkim 0 0 100 0 0 0 0 0 0 0 0 0 0 0 0 0 0 0 0 100 Tamil Nadu 0 0 0 0 0 0 0 0 0 0 37 0 0 0 0 0 6.1 0 56 100 Tripura 0 0 0 100 0 0 0 0 0 0 0 0 0 0 0 0 0 0 0 100 Uttar Pradesh 0.2 99.8 0 0 0 0 0 0 0 0 0 0 0 0 0 0 0 0 0 100 West Bengal 0 81 11 0 7.6 0 0 0 0 0 0 0 0 0 0 0 0 0 0 100 Others 1 90 0 0 0 0 0 0 0 0 1.4 0 0 0 0 0.4 5.2 0 3 100 Source: GOI 1999 i – West Flowing rivers 1 includes rivers Kutch & Saurastra Including Luni; West flowing rivers 2 includes rivers south of Tapi, East flowing rivers 1 includes rivers between Mahanadi and Pennar and East flowing rivers 2 includes rivers between Pennar and Kanayakumari.