Spatial distribution of the Nile crocodile ( Crocodylus...
54
Spatial distribution of the Nile crocodile (Crocodylus niloticus) in the Mariarano River system, Northwestern Madagascar By Caroline A. Jablonicky A Thesis Presented to the FACULTY OF THE USC GRADUATE SCHOOL UNIVERSITY OF SOUTHERN CALIFORNIA In Partial Fulfillment of the Requirements for the Degree MASTER OF SCIENCE (GEOGRAPHIC INFORMATION SCIENCE AND TECHNOLOGY) May 2013 Copyright 2013 Caroline A. Jablonicky
Transcript of Spatial distribution of the Nile crocodile ( Crocodylus...

Spatial distribution of the Nile crocodile (Crocodylus niloticus) in the Mariarano River system,
Northwestern Madagascar
By
Caroline A. Jablonicky
A Thesis Presented to the FACULTY OF THE USC GRADUATE SCHOOL
UNIVERSITY OF SOUTHERN CALIFORNIA In Partial Fulfillment of the
Requirements for the Degree MASTER OF SCIENCE
(GEOGRAPHIC INFORMATION SCIENCE AND TECHNOLOGY)
May 2013
Copyright 2013 Caroline A. Jablonicky
ii
Contents
List of Tables iv
List of Figures v
Abstract vii
Chapter 1: Introduction 1
Purpose 1
Organization 4
Chapter 2: Literature Review 6
Human-crocodile conflict 6
Species Distribution Models 8
Maximum Entropy Methods 10
Detection Probability 11
Chapter 3: Methods 12
Study Site 12
Data Collection and Methodology 13
Database 14
Model Covariates 15
Maxent Modeling Procedure 24
Model Performance Measures and Covariate Importance 25

iii
Chapter 4: Results 27
Survey Results 27
Nile crocodile (Crocodylus niloticus) Habitat Suitability Maps 28
Model Validation 30
Variable Contribution and Importance 32
Predictor Variable (Covariate) Importance 33
Chapter 5: Discussion 36
Field Data 36
Model Strengths and Conclusions 36
Model Limitations 38
Future Research Directions 40
Future Uses 41
References 42

iv
List of Tables
Table 1. List, explanation and source of covariates used within the two Maxent models 15
Table 2. Maxent model regularization parameters and applied model constraints 24
Table 3. Measure of the performance of the model produced by Maxent based on the AUC value (Araújo
and Guisan, 2006) 25
Table 4. Percent contribution of each predictor variable, including only biophysical covariates in the
model 32
Table 5. Percent contribution of each predictor variable, when all covariates were included in the model33
v
List of Figures
Figure 1. Location of the Mahamavo region within Madagascar. Inset: Location of Madagascar in relation
to the African continent. 3
Figure 2. Map of the six boat routes along Mariarano River and its tributaries, and the location of the boat
jetty used in the 2011 and 2012 field seasons. 14
Figure 3. Road and village locations used to calculate the two anthropogenic distance metric covariates
incorporated in the model 18
Figure 4. Rasters of the six covariates used in the model (elevation, topographic wetness index, wetland
designation, distance from water, distance from roads, and distance from villages). All rasters have 30 m
pixel resolution. 24
Figure 5. Crocodile observation locations used in creating Crocodylus niloticus habitat suitability maps 28
Figure 6. Representation of the predicted Crocodylus niloticus habitat suitability map based on the
maximum value of 1 and minimum value of 0, with 1 being highly suitable habitat, and 0 being
unsuitable habitat based on the different covariates included a) only the 4 biophysical covariates b) all 6
covariates including distance to roads and villages. 30
Figure 7. Receiving Operation Curve (ROC) with corresponding area under the curve (AUC) values for
the Maxent models produced a) using only biophysical covariates as predictor variables b) using all
covariates as predictor variables including distance to roads and villages 32
Figure 8. Jackknife test of variable importance with the inclusion of only biophysical covariates for a)
regularized training gain b) test gain c) area under the curve (AUC) 34

vi
Figure 9. Jackknife test of variable importance with the inclusion of all covariates for a) regularized
training gain b) test gain c) area under the curve (AUC). 35

vii
Abstract
Little is known about the Nile crocodile (Crocodylus niloticus) population in Madagascar;
however, its population is believed to be in decline resulting from hunting and habitat loss. This
study maps the distribution of the Nile crocodile population in the Mariarano River in
Northwestern Madagascar during the dry season (May-October) using the maximum entropy
model Maxent. Four biophysical factors are included in the first model and the second model
includes two additional anthropogenic factors of distance from roads and distance from villages
to observe the effect of humans on suitable habitat for crocodiles. Data were collected in June-
August 2011 and 2012. Model performance was assessed using the Receiving Operating Curve
(ROC) and Area under the Curve (AUC), using 10 replicates of both models. Both models
adequately predicted species occupancy using the test data: the anthropogenic model receiving
model performance rating of excellent and the biophysical factor-only model receiving a rating
of average. While the results initially indicated that the distance from roads was the most
important variable to the model, other possible anthropogenic influences such as boat activity on
the river and mangrove destruction were not included. The distribution map produced for the
model can be used as a baseline for Nile crocodile distribution within the river and aid in
conservation management decisions about the Nile crocodile in the region.
1
Chapter 1: Introduction
Purpose
The Nile crocodile (Crocodylus niloticus) is the most widespread of the three crocodilian
species found in Africa, and is the only crocodilian species found in Madagascar. Conflict with
humans and uncontrolled exploitation resulting from increased international demand for
crocodile skin led to severe population declines throughout Africa beginning in 1945 after the
end of World War II (Thorbjarnarson 1999). Today many sustainable harvest programs
combined with captive breeding or ranching through crocodile farming have been established for
other crocodile populations in mainland Africa (Thorbjarnarson 1999). The lack of knowledge
about the Madagascar crocodile population, however, has limited effective conservation
strategies in the country (Ottley et al. 2008). Hunting pressure for skins, conflict with humans,
and an increasing rate of habitat degradation and destruction all pose potential threats to the Nile
crocodile population in Madagascar (Ottley et al. 2008).
Nile crocodiles historically ranged throughout Africa and are typically the largest apex
predator in their environment (Fergusson 2010). They often maintain and encourage biodiversity
of wetlands; they can be considered an environmental indicator species especially concerning the
build-up of contaminants; they can be a source of economic importance both for tourism and
crocodile ranching/farming; and as apex predators they aid in the recycling of nutrients (Botha
2010). This status as an indicator species allows crocodiles to serve as proxies for the overall
health of wetland ecosystems.
2
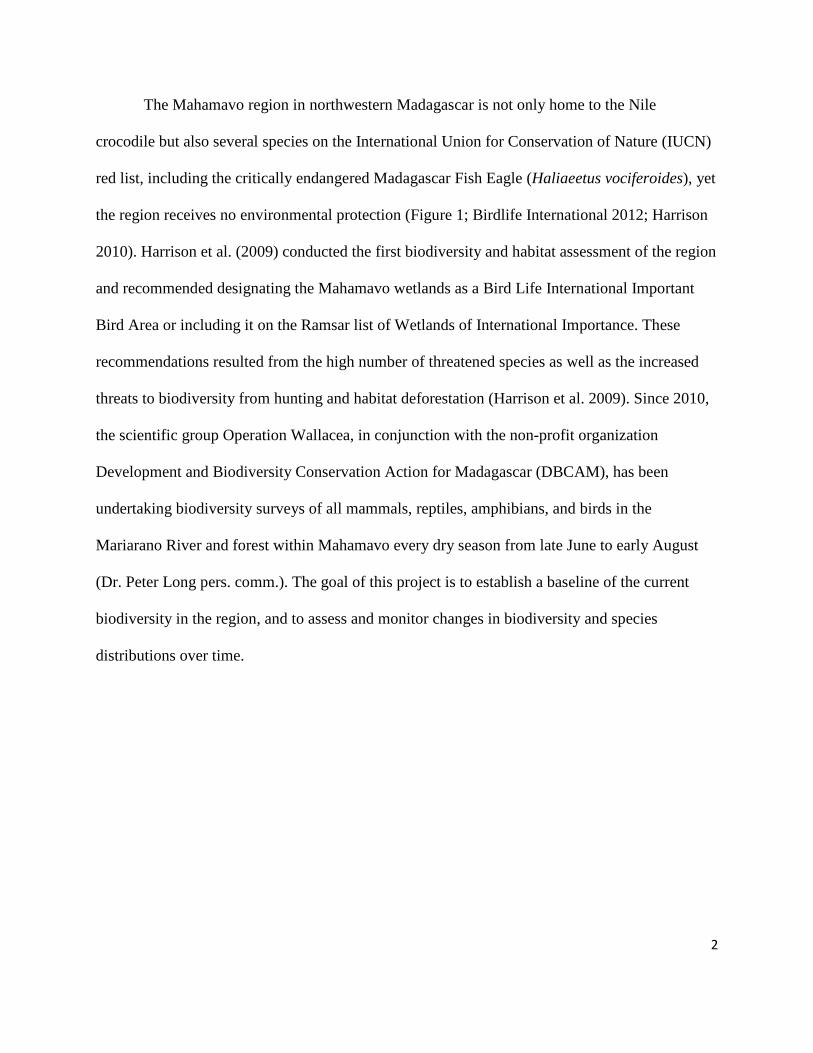
The Mahamavo region in northwestern Madagascar is not only home to the Nile
crocodile but also several species on the International Union for Conservation of Nature (IUCN)
red list, including the critically endangered Madagascar Fish Eagle (Haliaeetus vociferoides), yet
the region receives no environmental protection (Figure 1; Birdlife International 2012; Harrison
2010). Harrison et al. (2009) conducted the first biodiversity and habitat assessment of the region
and recommended designating the Mahamavo wetlands as a Bird Life International Important
Bird Area or including it on the Ramsar list of Wetlands of International Importance. These
recommendations resulted from the high number of threatened species as well as the increased
threats to biodiversity from hunting and habitat deforestation (Harrison et al. 2009). Since 2010,
the scientific group Operation Wallacea, in conjunction with the non-profit organization
Development and Biodiversity Conservation Action for Madagascar (DBCAM), has been
undertaking biodiversity surveys of all mammals, reptiles, amphibians, and birds in the
Mariarano River and forest within Mahamavo every dry season from late June to early August
(Dr. Peter Long pers. comm.). The goal of this project is to establish a baseline of the current
biodiversity in the region, and to assess and monitor changes in biodiversity and species
distributions over time.

3
Figure 1. Location of the Mahamavo region within Madagascar. Inset: Location of Madagascar
in relation to the African continent.
Examining the Nile crocodile population in Mahamavo will provide necessary
information for a conservation management program in Madagascar. Illegal hunting and
crocodile farming have long been issues in Madagascar, yet only one study has been conducted
investigating the state of the current Nile crocodile population sponsored by the IUCN (Ottley et
al. 2008). This study briefly surveyed several areas throughout Madagascar, and determined that
though it appeared the population and overall distribution throughout the country was in decline,
4
they did not have confidence in this assessment because of their short survey period and lack of
historical data (Ottley et al. 2008).
The aim of this study was to determine suitable habitat for the Nile crocodile within the
Mariarano River system and identify potential environmental factors affecting this habitat. A
habitat suitability map was constructed using two models created in the computer program
Maxent– the first with only biophysical factors; the second with anthropogenic factors included -
distance of crocodile observations from roads and villages. The results of this study form a
baseline habitat suitability map of the Nile crocodile within the Mariarano River system during
the dry season which can serve as the basis for a long term Nile crocodile monitoring program
and provide general information about the influence of anthropogenic factors on crocodile
distribution that could be useful for crocodile management in other regions.
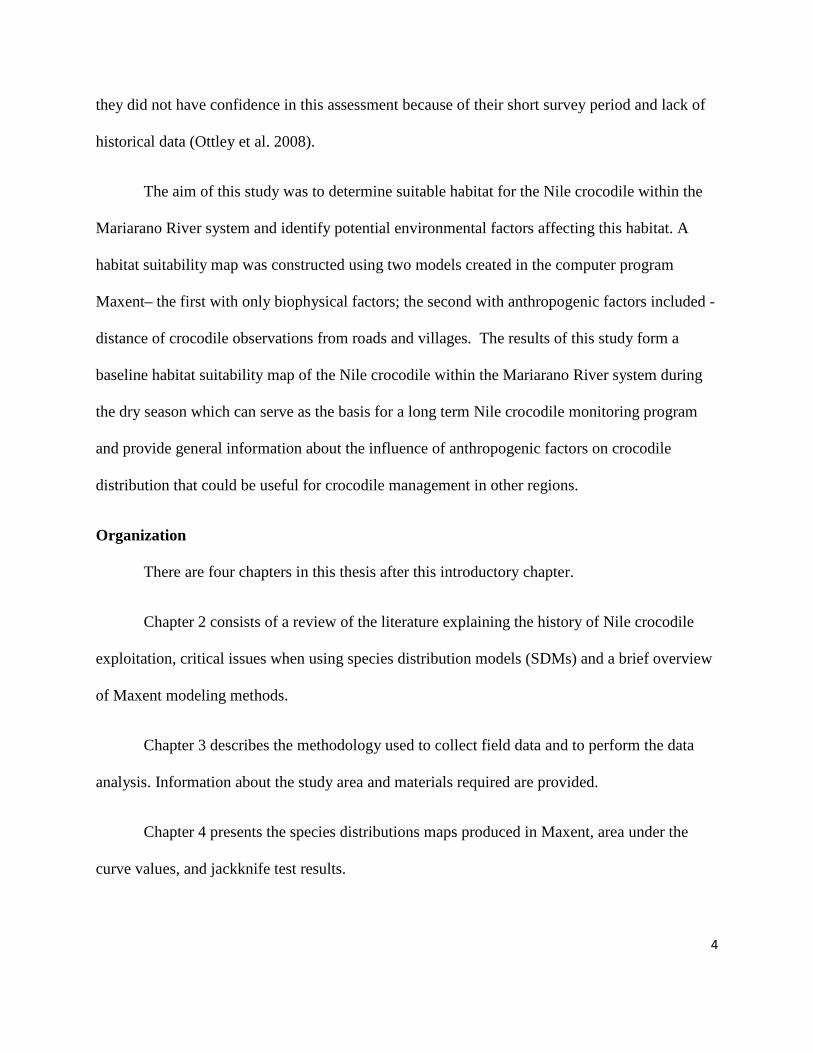
Organization
There are four chapters in this thesis after this introductory chapter.
Chapter 2 consists of a review of the literature explaining the history of Nile crocodile
exploitation, critical issues when using species distribution models (SDMs) and a brief overview
of Maxent modeling methods.
Chapter 3 describes the methodology used to collect field data and to perform the data
analysis. Information about the study area and materials required are provided.
Chapter 4 presents the species distributions maps produced in Maxent, area under the
curve values, and jackknife test results.

5
Chapter 5 discusses the results including the general performance and appropriateness of
each modeling approach. It also provides recommendations for crocodile management and
monitoring based on these results.

6
Chapter 2: Literature Review
This chapter briefly describes human-crocodile conflict, how this conflict has led to the
decline of crocodilians throughout the world, and the recovery of some of these populations due
to hunting regulations and crocodile farming (Bourquin and Leslie 2011; Caldicott et al. 2005;
Ross 2000). The history of the Nile crocodile in Madagascar, how overexploitation and habitat
degradation has led to their presumed decline, and the lack of knowledge about this population’s
ecology are discussed (Ottley et al. 2008). Species distribution modeling, its importance in
ecology, and the different types of modeling available are explained, as well as the motivation
for using Maxent modeling in this research (Franklin 2009). The probability of detecting
crocodiles and the different types of detection bias encountered in a field survey are also
examined (Shirley et al. 2012).
Human-crocodile conflict
Crocodilian species throughout the world are highly valued for their skin. The monetary
value of their skin, as well as their constant conflict with humans makes them a target for
hunting. In many regions, locals view crocodiles as a threat to their safety, and as competition for
resources (Aust et al. 2009; McGregor 2005). Until the mid-1970s, which saw the formation of
the Convention on International Trade in Endangered Species of Wild Fauna and Flora (CITES),
unregulated hunting led many crocodilian species to the brink of extinction. These species
include the Nile crocodile (Crocodylus niloticus) in parts of mainland Africa, the saltwater
crocodile (Crocodylus porousus) in Australia, and the black caiman (Melanosuchus niger) in
South America – all of which are especially valued for their skin (Bourquin and Leslie 2011;
Caldicott et al. 2005; Ross 2000).

7
Today many crocodilian populations have recovered with the help of both governmental
and international protection through the IUCN and regulation under CITES (Fergusson 2010).
CITES regulates the trade of crocodile skins and works with the IUCN Crocodile Specialist
Group (CSG) and governmental agencies to monitor crocodile farms and to issue permits for
annual skin exportation quotas.
Despite hunting regulations, trade restrictions, and international and government
protection, human-crocodile conflicts persist — many crocodiles are hunted illegally and their
eggs are taken to supply crocodile farms (Aust et al. 2009; McGregor 2005; Ottley et al. 2008).
Bishop et al. (2009) found that although a previously exploited Nile crocodile population in the
Panhandle region of the Okavango Delta in Botswana has partially recovered, the population
remains at risk. The effective size of the Okavango population has decreased, meaning fewer
individuals are contributing successfully to the gene pool, leading to a loss of genetic diversity in
the population. In countries like Madagascar, which are permitted to export crocodile skins but
do not possess adequate information on the wild Nile crocodile population and distribution, it is
difficult to determine whether current harvest numbers are sustainable.
Since 1998, Madagascar has implemented a wild harvest program of its crocodile
population, allowing the two crocodile farms in Madagascar to remove animals deemed a
“nuisance” or threat to human livelihood (Ottley et al. 2008). The skins collected from those
“nuisance” animals are then exported as “wild skins.” Additionally, these two farms have
received permits from CITES to export a specified number of farmed skins each year. Due to
lack of enforcement of the export regulations imposed by CITES, however, as well as the
perceived decrease in the country’s wild crocodile populations, a six-month ban was imposed on

8
crocodile skin exports in early 2010 (CITES 2010). This ban was still in effect in 2012 because
the Madagascan government has not complied with the recommendations of the National
Crocodile Management Workplan created by the CSG.
In 2007 a three-year National Crocodile Management Workplan was created by the CSG
in association with CITES and the IUCN. This workplan called for various management
strategies, as well as a survey of the wild crocodile populations in Madagascar, which was done
in 2008. The results of the survey indicated that locals often killed any crocodile encountered,
and nests were frequently destroyed or collected for crocodile farms (Ottley et al. 2008).
Additionally, crocodile populations in many of the rivers surveyed appeared to have diminished
compared to surveys conducted in 1987, 1988 and 1997 although the low numbers of crocodiles
observed made general comparisons difficult (Behra 1987; Behra and Hutton 1988; Games et al.
1997; Ottley 2008). By establishing a baseline crocodile distribution model in the Mariarano
River region, future studies will be able to monitor the status of the distribution of crocodiles and
identify priority areas for conserving crocodiles in the region.
Species Distribution Models
Species distribution modeling (SDM) is a commonly used technique to spatially identify
and describe a species’ suitable or available habitat, as well as provide a spatial understanding of
a species niche (Franklin 2009). With the advent of powerful computers and the rise of
Geographic Information Systems (GIS) in ecological and conservational applications, many
SDMs have been developed and their techniques have been compared against each other (Guisan
and Zimmerman 2000; Guisan and Thuiller 2005; Hernandez et al. 2006). Proper consideration,
however, must be given when selecting an appropriate model since many SDM studies lack

9
sufficient ecological theory and rationalization in the selection of variables and models (Austin
2002). Scale and type of available data play an important role when selecting a SDM (Austin
2002).
Before formulating the statistical aspect of the SDM it is essential to develop a strong
conceptual model that incorporates the underlying ecological motivations and concepts (Guisan
and Zimmerman 2000). This includes understanding the general biology and ecology of the
species selected, the type of available data and predictors that should be incorporated, and the
motivation for creating the model. How the model is to be used affects the data sampling
strategy, sample scale and density, and spatial resolution of both the collected data and chosen
covariates (Franklin 2009). Conversely, when using previously collected data, the type of
available data (i.e. presence-absence versus presence-only) will play a key role in the choice of
model. Another significant ecological consideration is whether or not the species is in
equilibrium with its environment, meaning it is only found in areas deemed suitable and is not
affected by biotic interactions, such as interspecific competition, or lack of dispersal ability
(Pearson 2007). Guissan and Zimmerman (2000) and Austin (2002) address the drawbacks of
assuming a high degree of equilibrium for a species in its environment, noting however that this
assumption is often necessary in large-scale distribution models.
Franklin (2009) divided the most commonly used models into three categories based on
the methodology used by each model: statistical, machine learning, and classification and
distance methods. Statistical models incorporate modern regression methods, such as generalized
linear models (GLMs), generalized additive models (GAMs), and multivariate adaptive
regression splines (MARS). These three methods use statistical inference to estimate the

10
parameters from the available data and the user chooses the distributional form. Machine
learning methods include decision trees, artificial neural networks (ANNs), genetic algorithms
(GAs), maximum entropy (Maxent) and support vector machines (SVM) – all of which use
algorithms to learn the mapping rules set by the user from the provided training data. The last
category, classification and distance methods, are based on presence-only data (absences were
not recorded), and include some of the methods previously mentioned such as the GA framework
underlying the genetic algorithms for rule production (GARP) and Maxent models, as well as
other methods such as ecological niche factor analysis (ENFA) and environmental envelope
methods (BIOCLIM, HABITAT).
Maximum Entropy Methods
The crocodile observational data collected for this study were collected for two years
during the 2011 and 2012 field seasons (June-August) and can be considered presence-only data,
as no absence data were available, and the sample size was relatively small ( <75 observations).
For presence-only modeling methods, maximum entropy models (using the software application
Maxent) have been found to be the most capable, maintaining high predictive accuracy across a
large range of sample sizes (Elith et al. 2006; Hernandez et al. 2006). Maximum entropy models
do not require absence data, but use background environmental data throughout the study area
and determines the probability distribution of maximum entropy, subject to covariates and
observational records defined by the user (Pearson 2007; Phillips et al. 2006). The predictive
power of the model is measured using the receiver operating curve (ROC) and its area-under-the-
curve value (AUC; Phillips et al. 2006).

11
Detection Probability
In any study using observational species data there is always the issue of how likely the
observer is to detect and record each animal in the given survey space, known as detection
probability. Detection probability is affected not only by the skill/experience of the observer but
also by the probability that detecting an animal decreases the further the animal is from the
area/transects being surveyed (Bayliss et al. 1987; Hutton and Woolhouse 1989; Fujisaki et al.
2011; Shirley et al. 2012). The habitat being surveyed, weather at time of survey and behavior
and morphology of the animal also affect the ability of an observer to detect an animal (Bayliss
et al. 1986). Crocodiles are elusive creatures — their ability to submerge underwater, and
preference for both open and dense vegetation can make them difficult to detect (Bayliss 1987;
Hutton and Woolhouse 1989; Shirley et al. 2012). Submerging and concealment bias contribute
greatly to how well an observer is able to detect a crocodile, but are difficult to quantify without
absolute abundance already being known (Bayliss et al. 1987). Observer bias (based on
experience/skill level) can be accounted for by using two independent observers on each survey
— this method has been used successfully to survey American alligators (Alligator
mississippiensis) in the Everglades National Park Florida, and to survey Nile crocodiles
(Crocodylus niloticus) in Lake Nasser, Egypt (Fujisaki et al. 2011; Shirley et al. 2012).
Unfortunately this method could not be used in this study as local guides would typically point
out crocodiles before the observers were able to detect the crocodiles themselves.
12
Chapter 3: Methods
This chapter describes the field and analytical methodology used in the study. The study
site and data collection procedures are described, for both the data collected in the 2012 field
season and the previously collected data (the 2011 field season) from the Operation Wallacea
database. The covariates used for the model and appropriate justifications are explained. Lastly,
an overview of the Maxent modeling procedure is discussed, including the parameters and
constraints of the model, as well as the performance measures used to assess the model.
Study Site
Surveys for the 2011 and 2012 field season took place for 6 weeks from late June to early
August along the Mariarano River and several nearby lakes. The Mariarano River is located
within the Mahamavo Peninsula in Northwestern Madagascar. The surveys occurred during the
Madagascan winter (May-October), which is the driest season; the mean precipitation for the
region in July is less than 1 mm per day. However, during the summer months (November-April)
or wet season, the region receives greater than 10 mm per day, and extensive flooding occurs
throughout the region (Washington et al. 2009, Washington 2010). Accessibility to the region
greatly decreases during this time and often the only access is by boat. Due to budgetary and
time constraints surveys were only conducted during the dry season.
Within the Mahamavo watershed there are four main river systems, and several inland
lakes. The data for this thesis were collected along the Mariarano River and its tributaries along
the eastern edge of the Mahamavo Peninsula. The Mahamavo peninsula consists of a mosaic of
dry forest and wooded grassland/bush habitat. Deforestation is becoming a critical problem, and
much of the area that was once forested is now savannah, especially areas near villages

13
(Washington et al. 2009). The four inland lakes surveyed were surrounded by such a mosaic. The
habitat encompassing the Mariarano River consists of extensive mangroves; with evidence of
habitat degradation due to cyclone damage and the use of mangrove wood as a source of
charcoal by the local villages.
Data Collection and Methodology
Surveys of the Mariarano River were conducted in a 6 m fiberglass boat, during the day
and at night, along fixed segments of the river named A through F (Figure 2). Each route was
surveyed at least twice during the day and only the three closest routes to the jetty (A-C) were
surveyed at least twice during the night due to fuel and safety constraints. During the daytime
crocodiles were detected through the use of binoculars, and the data recorded included the date,
time, distance and angle from observer location, and location (using a Global Positioning System
(GPS)), as well as the estimated length of the specimen. The recorded location, distance (based
on observer estimation) and angle (using a compass) from the observer were used to determine
the true location of the animal (Buckland et al. 2000). Locations were only recorded if there was
at least 10 m accuracy on the GPS receiver. At night crocodiles were detected by observation of
eyeshine using Fenix E21 flashlights, and the same information was recorded as in the daytime
surveys. On every survey at least two observers were present, as well as additional observers
who were recording bird biodiversity along the river.

14
Figure 2. Map of the six boat routes along Mariarano River and its tributaries, and the location of
the boat jetty used in the 2011 and 2012 field seasons.
Database
In addition to the data collected in the 2012 field season, observational crocodile data
from the 2011 field season were also used to model crocodile distribution. The data were
collected by various members of the scientific organization Operation Wallacea using similar
methods to those outlined in the previous sections. The observational records for both field
seasons are also included as part of a larger database used to measure the biodiversity within the
Mahamavo region. All crocodile observations were input into the database, managed by Dr.
Peter Long, a James Martin research fellow at the Institute of Biodiversity in the Department of
Zoology at Oxford University working with Operation Wallacea. Dr. Long then calculated the

15
true location of each species observation using the recorded coordinates of the observer and,
distance and angle of the animal from the observer. The calculated true locations provided by Dr.
Long were used for all analysis.
Model Covariates
Selection of covariates was based on a literature review and expert opinion from Dr.
Peter Long and Robert Gandola senior scientist of the Herpetological Society of Ireland and
member of the IUCN Crocodile Specialist Group. Table 1 lists the purpose and source of each of
the covariates.
Table 1. List, explanation and source of covariates used within the two Maxent models
Covariate Explanation Source
Elevation (m) High elevations are believed to be
a factor in determining suitable
crocodile habitat (R. Gandola pers.
comm)
USGS 2004, Shuttle Radar
Topography Mission, 1 Arc
Second scene SRTM_p161r071
Topographic Wetness
Index (TWI)
Crocodiles require a certain
amount of moisture and water for
their survival and TWI measures
water saturation capabilities in the
soil (Franklin 2009; Rodder et al.
2010; Steel 1989; R. Gandola pers.
comm.)
USGS 2004, Shuttle Radar
Topography Mission, 1 Arc
Second scene SRTM_p161r071

16
Wetland designation Wetland designation is used as a
limiting factor since this study only
examines suitable habitat during
the dry season (P. Long, pers.
comm.)
USGS Landsat 7 satelite images:
7_p161r071_2012may04
LE71600712012125ASN00 &
7_p161r071_2012may20
LE71600702012141ASN00
Distance to water (m) Crocodiles are dependent on water
and can only travel so far from a
water source (Rodder et al. 2010;
Steel 1989; R. Gandola pers.
comm.)
USGS Landsat 7 satelite images:
7_p161r071_2012may04
LE71600712012125ASN00 &
7_p161r071_2012may20
LE71600702012141ASN00
Distance to roads (m) Roads allow for increased access to
all regions, and can lead to
deforestation and an increase in
hunting (Pearson et al. 2002;
Lindemeyer et al. 2000; R Gandola
pers. comm.)
Foiben i Tsasarintanini
Madagasikara (1951) Sarintany
topografika 1:100000 LM38,
N3738, L39, M39, N39, L40,
M40, N40. Antananarivo.
Distance to villages
(m)
Human settlements in suitable
crocodile habitat can lead to
human-crocodile conflict over
safety & competition for resources
(Pearson et al. 2002; Lindemeyer et
al. 2000; Aust et al. 2009)
Foiben i Tsasarintanini
Madagasikara 1951 Sarintany
topografika 1:100000 LM38,
N3738, L39, M39, N39, L40,
M40, N40. Antananarivo.

17
Four of the covariates are “biophysical”: elevation, topographic wetness index, distance
to water, and whether the area is a designated wetland. Climatic variables such as temperature
and average rainfall were not included, because the available data resolution was too coarse to be
useful for the small study site. Instead more local, high resolution data were used for the
biophysical covariates.
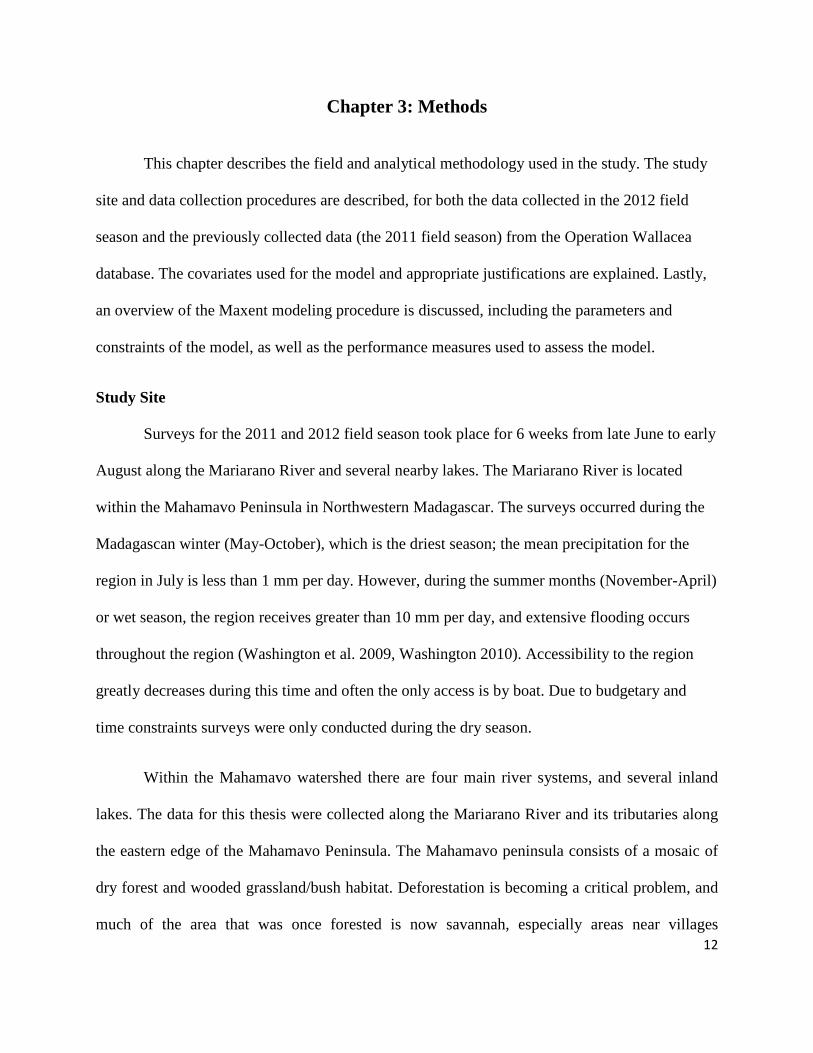
Nearby roads and villages, whose locations are depicted in Figure 3, are considered
important “anthropogenic” factors and are included in one of the final models as two distance
metric covariates: distance to roads and distance to villages. The anthropogenic covariates were
included as humans are thought to have a great impact on a crocodile’s movement and
distribution, both in terms of hunting and human avoidance. Studies by Pearson et al. (2002) and
Lindemeyer et al. (2000) have shown that such metrics affect the outcome of a species
distribution model.
18
Figure 3. Road and village locations used to calculate the two anthropogenic distance metric
covariates incorporated in the model
Some important issues about these covariates require additional explanation. The
remaining paragraphs in this section provide additional detail about some of the covariates.
Distance to water and topographic wetness index (TWI) were incorporated into the model
because, being semi-aquatic, crocodiles are dependent on water, especially during the dry season
when there is limited water available (Rodder et al. 2010; Steel 1989; R. Gandola pers. comm.).
The TWI is a method of measuring how water will be distributed across the landscape and how

19
much water the ground is capable of absorbing before it becomes run-off (Franklin 2009). It is
calculated using Equation 1.
��� � ln �
�� (1)
The variable a is defined as the upslope contributing area calculated using the watershed tool in
IDRISI, while β is defined as the angle of the surface slope. The data used in calculating TWI
came from a digital elevation model (DEM) at 30 m resolution from the Shuttle Radar
Topographic Mission, 1 Arc Second scene SRTM_p161r071. The value of TWI can range from
-6.68 (dry) to 18.12 (wet).
Elevation was included in the models as it has been considered a potential factor in the
distribution of other crocodiles (R. Gandola pers. comm.). It is important to note that elevation is
correlated with TWI as both covariates were derived from the same DEMs (Shuttle Radar
Topographic Mission, 1 Arc Second scene SRTM_p161r071).
Since this study focuses on modeling C. niloticus distribution only during the dry season,
wetland habitat designation is included as a potential limiting factor on species distribution and
was used as a mask variable in the model. The areas designated as wetland habitat were extracted
from a land cover dataset developed using a maximum likelihood classifier on high resolution
satellite data from 2008 (Quickbird 2008 and Landsat 2008) and applied to Landsat 2012 data (P.
Long pers. comm.). As this habitat suitability map is only for the dry season, areas designated
here as wetland habitat include both open water habitat areas and areas classified as mangrove
forest since the seasonally flooded areas are not underwater during the dry season. The
designated wetland areas were then reclassified so that all designated areas received a value of 1,
20
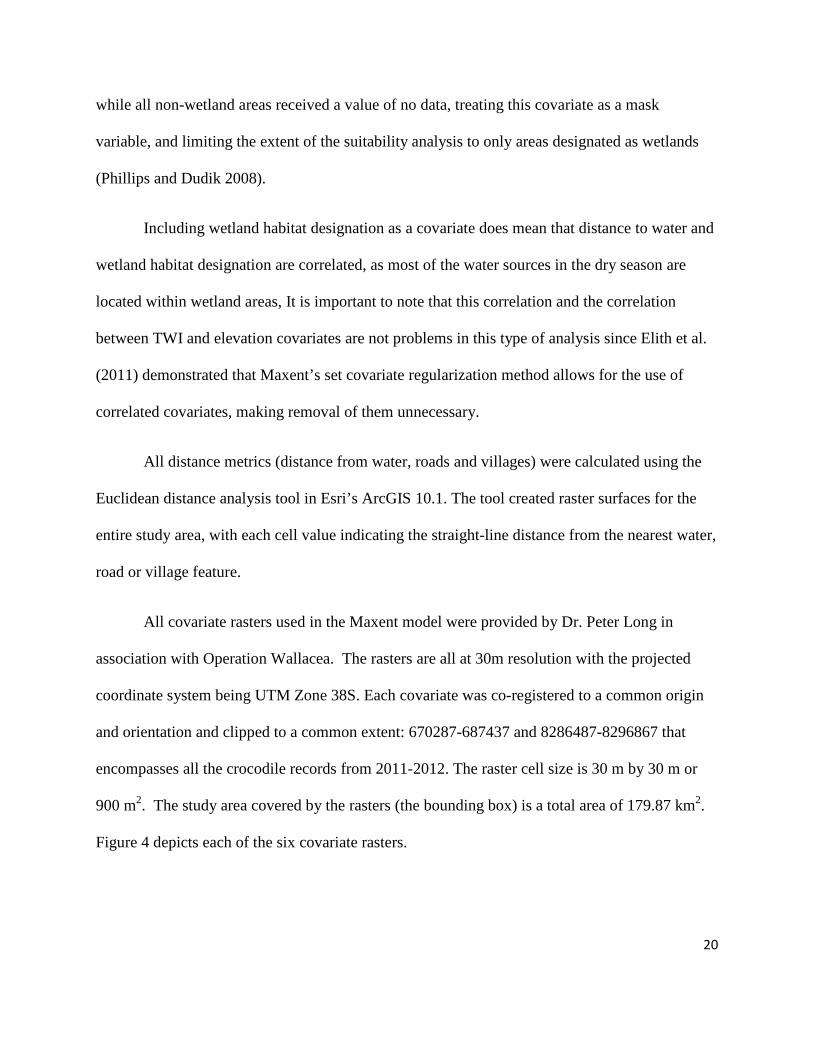
while all non-wetland areas received a value of no data, treating this covariate as a mask
variable, and limiting the extent of the suitability analysis to only areas designated as wetlands
(Phillips and Dudik 2008).
Including wetland habitat designation as a covariate does mean that distance to water and
wetland habitat designation are correlated, as most of the water sources in the dry season are
located within wetland areas, It is important to note that this correlation and the correlation
between TWI and elevation covariates are not problems in this type of analysis since Elith et al.
(2011) demonstrated that Maxent’s set covariate regularization method allows for the use of
correlated covariates, making removal of them unnecessary.
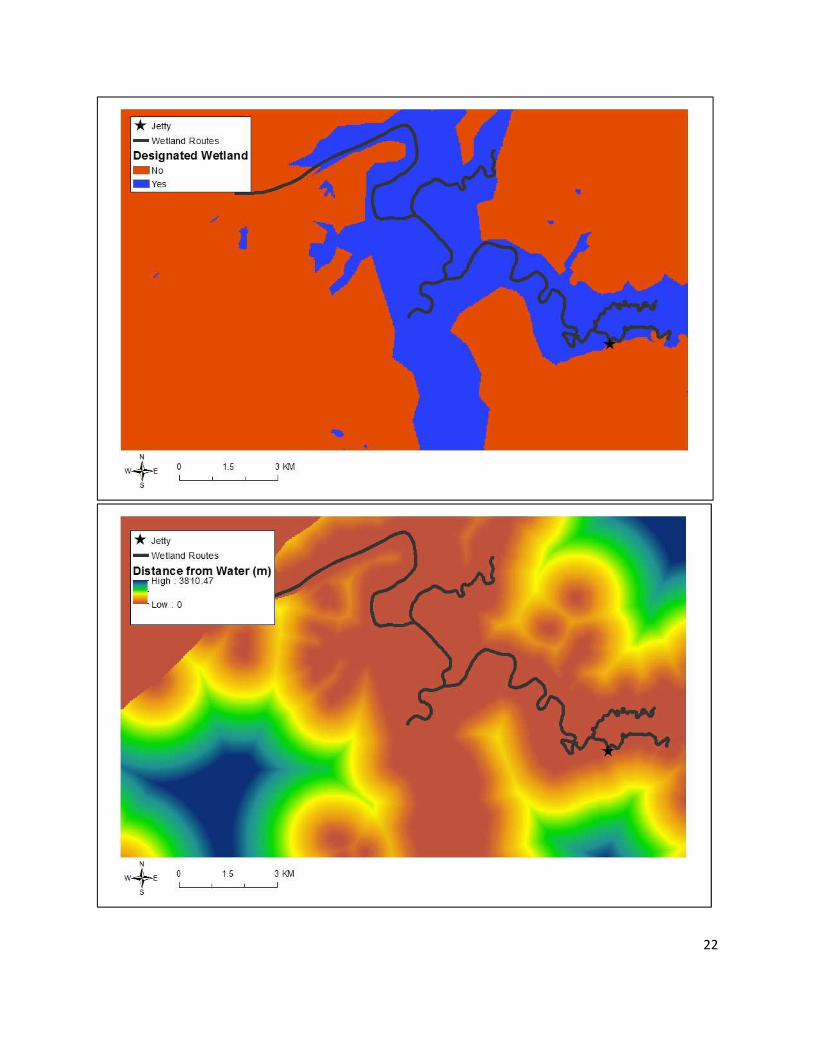
All distance metrics (distance from water, roads and villages) were calculated using the
Euclidean distance analysis tool in Esri’s ArcGIS 10.1. The tool created raster surfaces for the
entire study area, with each cell value indicating the straight-line distance from the nearest water,
road or village feature.
All covariate rasters used in the Maxent model were provided by Dr. Peter Long in
association with Operation Wallacea. The rasters are all at 30m resolution with the projected
coordinate system being UTM Zone 38S. Each covariate was co-registered to a common origin
and orientation and clipped to a common extent: 670287-687437 and 8286487-8296867 that
encompasses all the crocodile records from 2011-2012. The raster cell size is 30 m by 30 m or
900 m2. The study area covered by the rasters (the bounding box) is a total area of 179.87 km2.
Figure 4 depicts each of the six covariate rasters.

21
22

23

24
Figure 4. Rasters of the six covariates used in the model (elevation, topographic wetness index,
wetland designation, distance from water, distance from roads, and distance from villages). All
rasters have 30 m pixel resolution.
Maxent Modeling Procedure
The free software program Maxent (version 3.3.3e, available at http://www.cs.
princeton.edu/~schapire/maxent/) was used for all modeling and subsequent analysis. The
program is based on a species distribution algorithm which uses maximum entropy methods
(Phillips et al. 2006). The program requires two different input datasets. The presence data is
input as a table listing the point locations of all observations. The second input is the set of
covariates provided as a collection of rasters in ASCII grid format.
Two models were run: one with only the biophysical covariates, the other including the
anthropogenic factors of distance to roads and villages. The regularization default settings
presented by Maxent were used because Phillips and Dudik (2008) found that when using
Maxent’s default settings, the model performance showed little improvement from when the
settings were altered to reflect the data. Table 2 displays the regularization parameters used for
each model.
Table 2. Maxent model regularization parameters and applied model constraints
Number of Overall Samples 72
Regularization multiplier 1
Max number of background points 10000
Replicates 10
25
Maximum iterations 1000
Output format Logistic
Convergence threshold 0.00001
Apply threshold rule Minimum training presence
Model Performance Measures and Covariate Importance
Ten replicates were produced of the model using the cross-validation procedure. Cross-
validation uses all of the occurrence data, with the data being split into 10 groups (the number of
replicates) and one group used each time as the test data, while the other data is used to train the
model. This procedure is then replicated 10 times, so that every group serves as a test group at
least once. For each replicate Maxent produces a receiver operating curve (ROC) analysis, which
determines the area under the curve (AUC) value, and this value is then averaged to obtain an
average AUC value with a standard deviation.. The AUC was used to measure the predictive
performance of the model of C. niloticus occurrences produced by Maxent. The AUC value
ranges from 0 to 1, with 1 being the optimal value and 0.5 meaning the predictive performance
of the model is no better than random. Araújo and Guisan (2006) provide a scale of the
thresholds for the goodness of fit for the model which is presented in Table 3.
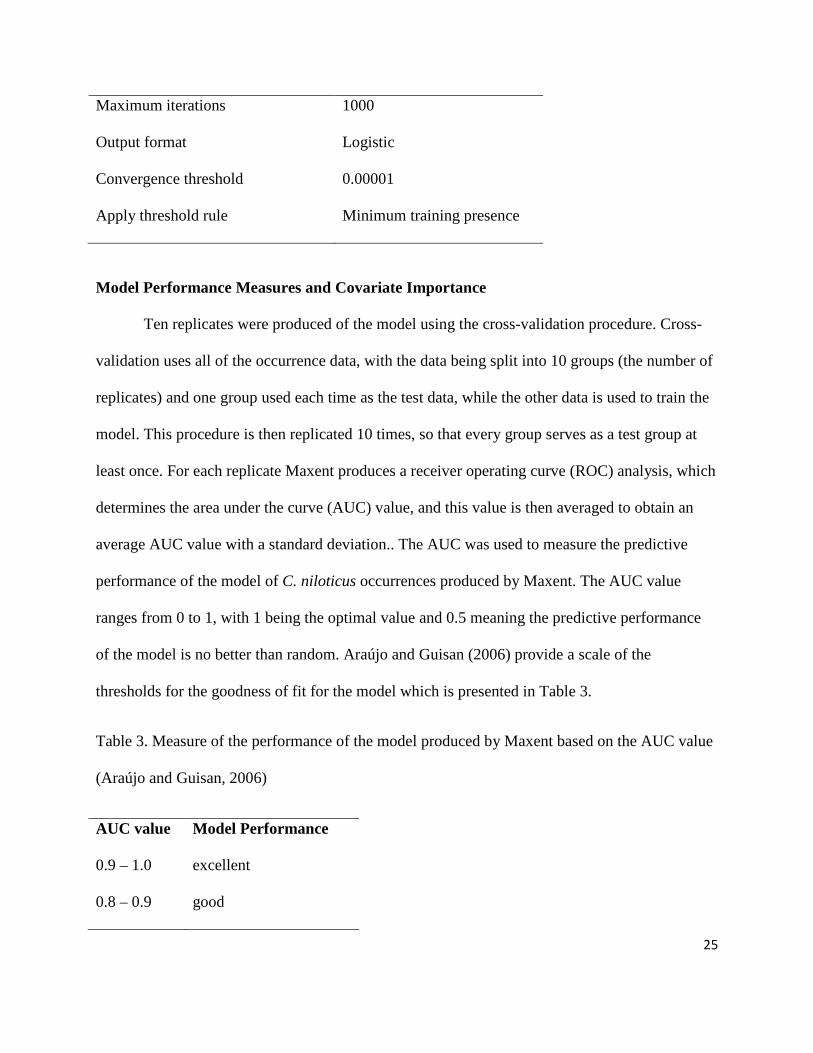
Table 3. Measure of the performance of the model produced by Maxent based on the AUC value
(Araújo and Guisan, 2006)
AUC value Model Performance
0.9 – 1.0 excellent
0.8 – 0.9 good

26
0.7 – 0.8 average
0.6 – 0.7 poor
When the model is produced in Maxent, an analysis is presented on the contributions of
each predictor variable or covariate to the model. The percent contribution of each covariate is
determined by examining which variable influences the model the most, and is dependent on the
path used to obtain the optimal solution, thus caution is advised when interpreting the overall
contributions (Phillips et al. 2006). The Maxent software also provided the option to run a
jackknife test to measure the importance of each predictor variable/covariate in the model
outcome. The jackknife test was used to identify which covariates contributed most to the model
by running the model with each covariate being the only covariate in the model, and with each
covariate being individually excluded from the model (all other covariates were present; Elith et
al. 2011). However, it is important to note that highly correlated covariates can alter the
contributions of each covariate to the model and increase the contribution of one of several
correlated variables (Phillips et al. 2006, Baldwin 2009).

27
Chapter 4: Results
Survey Results
Crocodylus niloticus was observed on surveys 84 times in 2011-2012 (Figure 5). Twelve
records were removed prior to analysis because their locations were believed to be inaccurate.
The remaining 72 records were used in creating the habitat suitability map. Many observations
were located in the southeast and southernmost parts of the Mariarano River system, due in part
to the higher number of surveys in those regions. This creates bias for the distribution of
crocodiles observed towards this region, however this bias does not affect the Maxent model,
which is based on presence-only data (absence data are not included).
28
Figure 5. Crocodile observation locations used in creating Crocodylus niloticus habitat suitability
maps
Nile crocodile (Crocodylus niloticus) Habitat Suitability Maps
Figure 6a represents the predicted Crocodylus niloticus habitat suitability map using only
the four biophysical covariates: topographic wetness index (TWI), wetland designation, distance
to water, and elevation. Both the habitat suitability map using the 4 biophysical covariates and
the map using all 6 covariates were limited by the wetland designation covariate, which was used
as a mask to remove the surrounding, non-wetland areas (total area of all wetlands 45.3 km2).
Areas of predicted high occupancy or habitat suitability are found in the southeast and
southernmost parts of the Mariarano River system and along its banks.
Figure 6b represents the predicted C. niloticus habitat suitability map using all 6
covariates including distance from roads and distance from villages. Again areas of predicted
high occupancy or habitat suitability are found in the southeast and southernmost parts of the
Mariarano River system, however the areas along the edge of the system were deemed less
suitable.

29
a)
b)

30
Figure 6. Representation of the predicted Crocodylus niloticus habitat suitability map based on
the maximum value of 1 and minimum value of 0, with 1 being highly suitable habitat, and 0
being unsuitable habitat based on the different covariates included a) only the 4 biophysical
covariates b) all 6 covariates including distance to roads and villages.
Model Validation
The mean area under the curve (AUC) for the test data using the model with only
biophysical covariates was 0.780 with a standard deviation of 0.065 (Figure 7a). According to
the AUC classification by Araújo and Guisan (2006) this ranks the model as “average” in terms
of predictive performance. The AUC value for the test data using the model with all of the
covariates was 0.913 with a standard deviation of 0.028, ranking the model as excellent (Figure
7b). The receiver operating curve (ROC) produced by both models plots the sensitivity (true
positive) against the 1 - specificity (false positive), as well as the corresponding AUCs,
indicating model performance (Figure 7). The red line shows the mean AUC value, while the
blue shaded areas represent the standard deviation from the mean value. The closer the red line is
to the left (closer to 1) and the smaller the standard deviation value the better the model
performance.

a)
Biophysical Model
b)
Anthropogenic Model
31
32
Figure 7. Receiving Operation Curve (ROC) with corresponding area under the curve (AUC)
values for the Maxent models produced a) using only biophysical covariates as predictor
variables b) using all covariates as predictor variables including distance to roads and villages
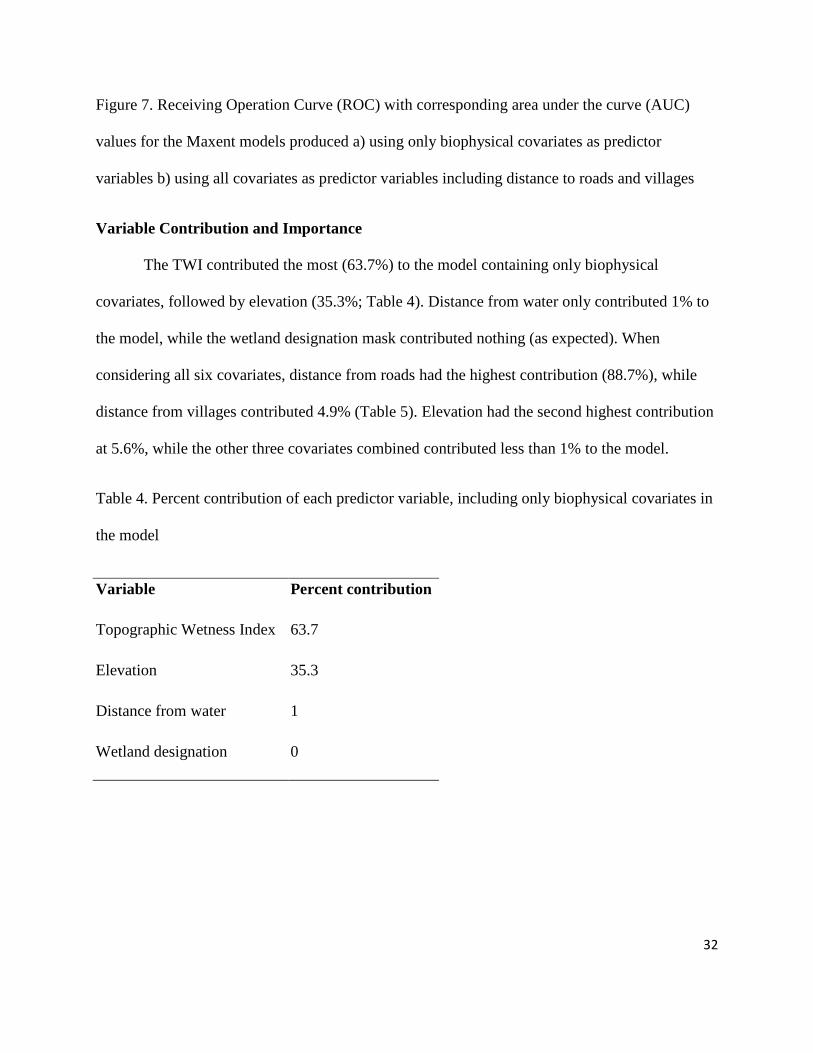
Variable Contribution and Importance
The TWI contributed the most (63.7%) to the model containing only biophysical
covariates, followed by elevation (35.3%; Table 4). Distance from water only contributed 1% to
the model, while the wetland designation mask contributed nothing (as expected). When
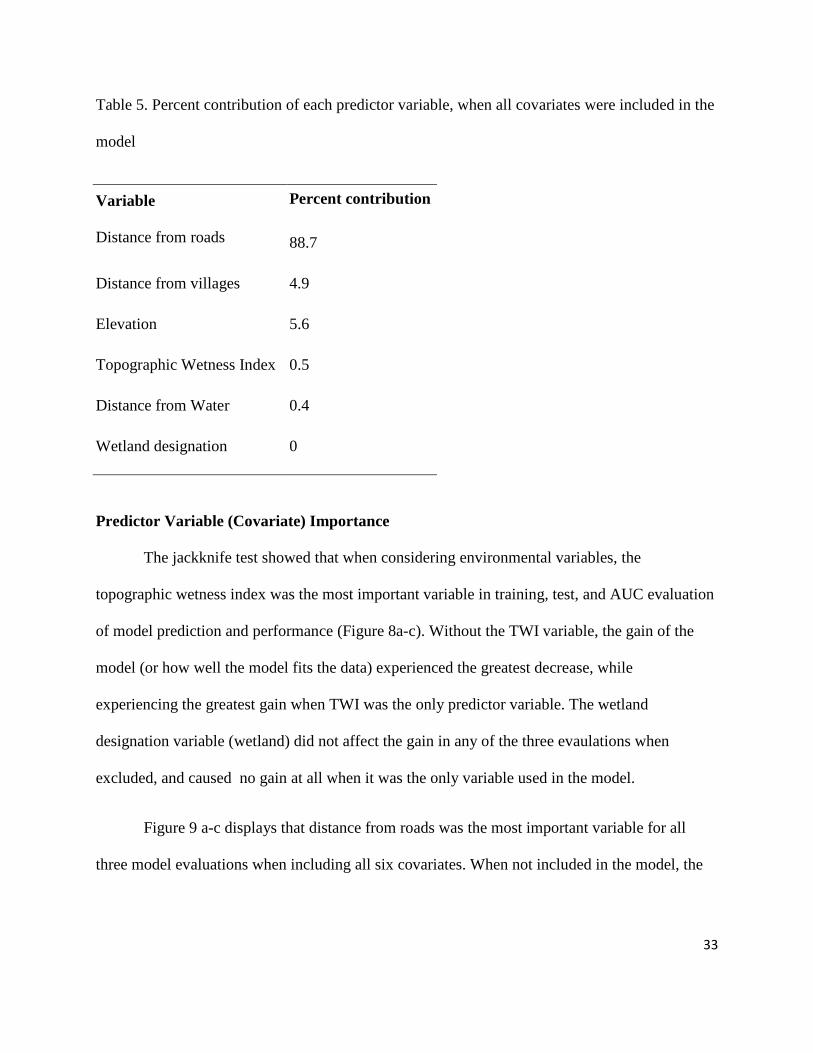
considering all six covariates, distance from roads had the highest contribution (88.7%), while
distance from villages contributed 4.9% (Table 5). Elevation had the second highest contribution
at 5.6%, while the other three covariates combined contributed less than 1% to the model.
Table 4. Percent contribution of each predictor variable, including only biophysical covariates in
the model
Variable Percent contribution
Topographic Wetness Index 63.7
Elevation 35.3
Distance from water 1
Wetland designation 0
33
Table 5. Percent contribution of each predictor variable, when all covariates were included in the
model
Variable
Distance from roads
Percent contribution
88.7
Distance from villages 4.9
Elevation 5.6
Topographic Wetness Index 0.5
Distance from Water 0.4
Wetland designation 0
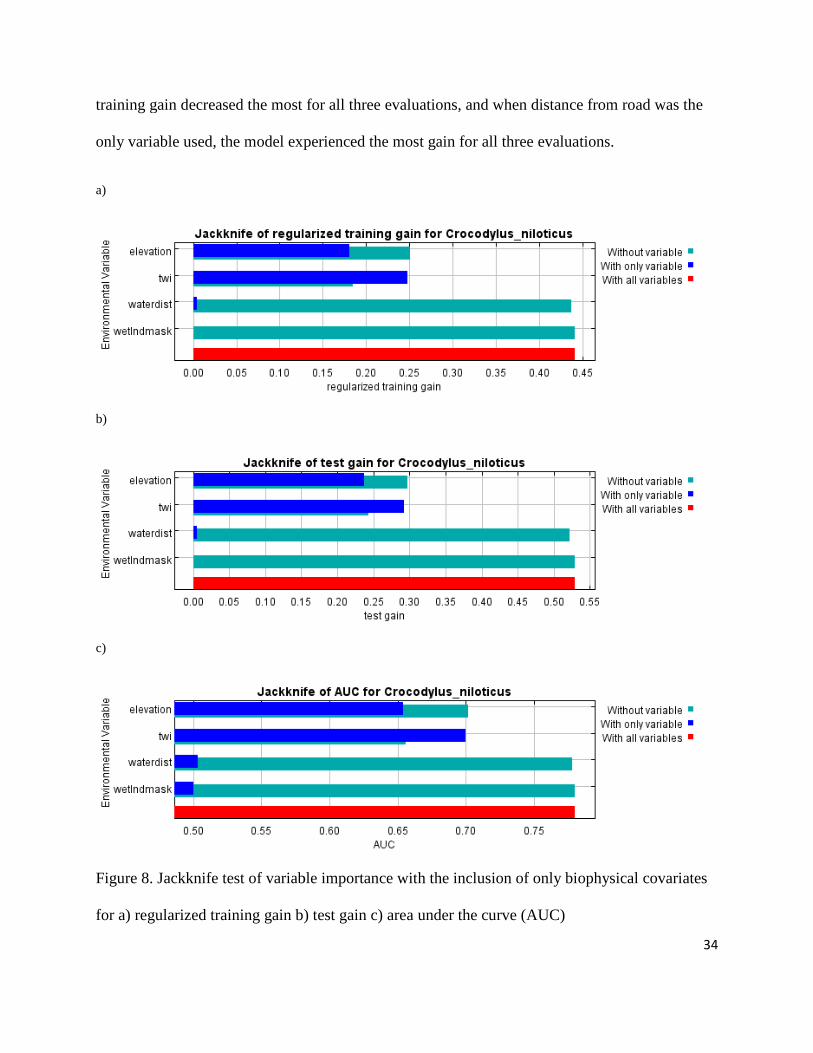
Predictor Variable (Covariate) Importance
The jackknife test showed that when considering environmental variables, the
topographic wetness index was the most important variable in training, test, and AUC evaluation
of model prediction and performance (Figure 8a-c). Without the TWI variable, the gain of the
model (or how well the model fits the data) experienced the greatest decrease, while
experiencing the greatest gain when TWI was the only predictor variable. The wetland
designation variable (wetland) did not affect the gain in any of the three evaulations when
excluded, and caused no gain at all when it was the only variable used in the model.
Figure 9 a-c displays that distance from roads was the most important variable for all
three model evaluations when including all six covariates. When not included in the model, the
training gain decreased the most for all three evaluations, and when distance from road was the
only variable used, the model experienced the most gain for all three evaluations.
a)
b)
c)
Figure 8. Jackknife test of variable importance with the inclusion of only
for a) regularized training gain b) test gain c) area under the curve (AUC)
gain decreased the most for all three evaluations, and when distance from road was the
only variable used, the model experienced the most gain for all three evaluations.
variable importance with the inclusion of only biophysical
for a) regularized training gain b) test gain c) area under the curve (AUC)
34
gain decreased the most for all three evaluations, and when distance from road was the
only variable used, the model experienced the most gain for all three evaluations.
biophysical covariates

a)
b)
c)
Figure 9. Jackknife test of variable importance with the inclusion of all covariates for a)
regularized training gain b) test gain c) area under the curve
. Jackknife test of variable importance with the inclusion of all covariates for a)
regularized training gain b) test gain c) area under the curve (AUC).
35
. Jackknife test of variable importance with the inclusion of all covariates for a)

36
Chapter 5: Discussion
Chapter 5 describes the field data used in the model and provides an overview of the
model strengths and conclusions drawn from the results of the model, together with a discussion
about the most influential variables for each model (biophysical and anthropogenic). The
limitations of the model are presented, including concerns with species detectability and
potentially insufficient anthropogenic covariates. Lastly, future research directions are described
as well as how the results and conclusions of this study may be used in crocodile management
practices.
Field Data
The use of 72 presence-only records to create the habitat suitability maps were sufficient
as Maxent is equipped to deal with a wide range of sample sizes (Elith et al. 2006; Hernandez et
al. 2006). The unequal survey effort due to time and safety constraints (only routes A, B, and C
were surveyed at night – D through F were not; see Figure 2), as well as the issue of species
detectability (see Model Limitations) may have resulted in an increase in observations in the
south and southwestern portions of the study area. However, according to locals, crocodiles are
not found in the areas near routes D through F, and it was believed by them to be a waste of time
surveying these portions of the river (Mamy Rabenero, pers. comm.). As no crocodiles were
recorded in these areas, the unequal survey efforts are believed not to have impacted the overall
findings of the study.
Model Strengths and Conclusions
Using the AUC classifications presented by Araújo and Guisan (2006) both models
performed very well, with the first model containing only the biophysical covariates scoring a

37
rating of “average” (AUC = 0.780), while the second model with the anthropogenic factors
(distance from roads and villages) scored a rating of “excellent” (AUC = 0.913). The inclusion of
the anthropogenic factors not only increased the resulting AUC value of the model, implying that
the model had better predictive performance than without those two predictive variables, but also
greatly reduced the amount of predicted crocodile habitat within the Mariarano River system.
The results of the jackknife test indicated that without the inclusion of anthropogenic
factors, the most influential variable was the topographic wetness index (TWI), which is used to
predict water accumulation within a distinct area. The areas deemed as highly suitable crocodile
habitat corresponded with high levels of TWI, indicating that C. niloticus may prefer areas with
higher soil moisture content. Studies that have incorporated TWI when considering suitable
habitat for crocodilians normally consider it based on nest site suitability rather than suitability
for the animal itself (Lutz and Dunbar-Cooper 1982; Kushlan 1982). However if C. niloticus
does prefer high levels of TWI, this may not be due to nesting site preference as other studies
have found that C. niloticus prefer dry, sandy areas as nesting sites (Steel 1989; Shacks 2006).
Elevation also played an important role not only according to the jackknife test results but also in
the percent contributed by the variable to the model’s performance. Wetland designation and
distance to water contributed little to the model. Distance to water may have added little to the
model because it was related to wetland designation, which was used as a mask for the model.
However, once the anthropogenic factors of distance from roads and distance from
villages were included, distance from roads became the most important variable, contributing
88.7% to the model predictions and causing the largest decrease in model gain when excluded
from the model and the largest increase in model gain when it was the only covariate included in

38
the model. Topographic wetness index contributed very little to the anthropogenic model. This
minimized role may have been due to the greater influence of distance to roads. Human-
crocodile conflict occurs where humans and crocodiles overlap, and increased access to
crocodile habitat by roads may negatively affect their distribution (Aust et al. 2009;
Thorbjarnarson et al. 1999; R. Gandola pers. comm.). While this may indicate that humans play
an influential role in limiting crocodile distribution within the Mariarano River, there may be
other anthropogenic and biological factors missing from the model.
Though roads may allow for greater access to crocodile habitat, the large percent
contribution of the distance to road covariate (88.7%) may also be due in part to co-linearity of
the independent variable with the predictor variable (i.e. crocodile observations). Though Maxent
is not a statistical technique and the overall output is not affected by co-linearity among
variables, the contributions of individual variables to the model as determined by Maxent can be
affected though co-linearity (Phillips et al. 2006; Baldwin 2009). This possible co-linearity
between the distance to roads and crocodile observations may have caused the greater
contribution of the distance to roads covariate, decreasing the contributions of other covariates
such as TWI, which had previously had a higher contribution in the biophysical model.
Model Limitations
Species detectability is a source of error that could have possibly biased recorded
observations. Crocodiles are often very elusive and behavioral factors (such as submersion) and
environmental factors (habitat, weather, observer bias) can influence detectability (Shirley et al.
2011; Hutton and Woolhouse 1989). Environmental factors may have caused variability in the
detectability of crocodiles within the river, causing an increase in observations in certain areas of

39
the river. This may have influenced any spatial autocorrelation present in the data. By using the
cross-validation procedure available in Maxent using ten replicates, all sets would experience the
same spatial autocorrelation which would contribute to the same error (Fielding and Bell 1997;
Stockwell 1992). Although spatial autocorrelation is a common issue in all species distribution
models, it was not addressed here due to the disparities in addressing this issue in the literature
(Hijmans 2012, Lennon 2000, Liu et al. 2011, Václavík et al. 2011). Václavík et al. (2011) did
find that while accounting for spatial autocorrelation improved the performance of the models
produced by Maxent, it did not decrease the amount of residual autocorrelation.
Using the wetland designation covariate as a mask for the model limited the effectiveness
of the model, as it expanded the habitat suitability analysis beyond the extent of the surveyed
areas. While Maxent is equipped to perform projections of the original model, extending its
overall area analyzed, those procedures were not performed in this analysis, limiting the use of
the results of the biophysical and anthropogenic models created in this study (Phillips and Dudik
2008). Thus while the two models originally may have been seen as the potential suitable habitat
for crocodiles in the Mariarano River area (biophysical model) and the realized suitable habitat
for crocodiles (anthropogenic model), the use of the wetland designation as a mask rather than
the areas surveyed reduces the viability of the model.
The variables of distance from road and village contributed 88.7% and 4.9% respectively
to the model, and were the two most important variables identified in all three model evaluations
using the jackknife test. However, these results may not accurately reflect the effects of
anthropogenic activities on C. niloticus distribution along the Mariarano River. For example
while roads may increase accessibility to waterways, other anthropogenic factors not included in
40
this model, such as boat traffic along the river may be a greater contributing factor to C.
niloticus’s distribution. The habitat suitability model created for C. niloticus nesting sites
included boat traffic and burning activity as additional anthropogenic factors affecting the
location of suitable nesting sites (Shacks 2006). Thus, although the model may have been ranked
as excellent based on its resulting AUC value, its lack of inclusion of all of the potential
anthropogenic factors may limit its usefulness in creating an appropriate habitat suitability map
for C. niloticus in the region.
Future Research Directions
Future work on examining C. niloticus distribution within the Mariarano River system
should include additional anthropogenic factors such as boat traffic along the river, as well as
areas of high fishing intensity, and mangrove deforestation. Shacks (2006) determined that in the
Okavango Delta, 59% of previously suitable habitat had been disturbed by humans at the time of
study, specifically by boat traffic, fire disturbance, vegetation harvesting and cattle grazing.
Determining which anthropogenic disturbances affect crocodile distribution would aid future
monitoring programs of crocodiles in the region, as well as potentially contributing to knowledge
about crocodile distributions in other regions of Madagascar.
Further surveys should also be conducted in the wet season (November-April), because
extensive flooding occurs throughout the region, making many areas inaccessible except by boat,
and connecting the Mariarano River to many of the surrounding lakes. The amount of rain
received and subsequent flooding dramatically alters the landscape, which should increase the
distribution of C. niloticus during this season. Understanding how C. niloticus distribution in the

41
region changes between the dry and wet season will aid in future conservation management
measures.
Future Uses
This study was conducted under the advisement of Operation Wallacea, an organization
that runs biological and conservation management science programs throughout the world. The
Mariarano River system and surrounding areas have acted as a field site for the organization
since 2010, and will continue to be used in future field seasons. By establishing a species
distribution model for the Nile crocodile, this will aid in the project site’s long term monitoring
goals through the creation of a baseline crocodile distribution map for the area (P. Long pers.
comm.). Additionally, the model limitations outlined, and the future work and modifications
suggested in this thesis, will aid researchers in the monitoring of the Nile crocodile population in
the Mariarano River System.
On a larger scale, this is one of the first studies conducted on Nile crocodiles in
Madagascar that has spanned over the course of two years, and the only study conducted on Nile
crocodiles in Madagascar in 2012 (R. Gandola pers. comm.). With the ban on exporting
crocodile goods put in place by the International Union for Conservation of Nature (IUCN) and a
lack of information about the status of the Nile crocodile throughout the country, the findings of
this study will provide future motivation to continue monitoring crocodiles in the Mariarano
region and possibly provide information on conservational management practices that may be
used in other regions.

42
References
Araújo M B and Guisan A 2006 Five (or so) challenges for species distribution modelling.
Journal of Biogeography 33(10): 1677–1688
Aust P Boyle B Fergusson R and Coulson T 2009 The Impact of Nile Crocodiles on Rural
Livelihoods in Northeastern Namibia. South African Journal of Wildlife Research 39(1):
57–69
Austin M 2002 Spatial prediction of species distribution: an interface between ecological theory
and statistical modelling. Ecological Modelling 157: 101–118
Baldwin R A 2009 Use of maximum entropy modelling in wildlife research. Entropy 11: 854-
866
Bishop J M, Leslie A J, Bourquin S L, and O’Ryan C 2009 Reduced effective population size in
an overexploited population of the Nile crocodile (Crocodylus niloticus). Biological
Conservation 142(10): 2335–2341
BirdLife International 2012 Haliaeetus vociferoides. In: IUCN 2012. IUCN Red List of
Threatened Species. Version 2012.2 www.iucnredlist.org
Botha P J 2010 The distribution, conservation status and blood biochemistry of Nile crocodiles
in the Olifants river system, Mpumalanga, South Africa. PhD Thesis. South Africa,
University of Pretoria

43
Bourquin S L and Leslie A J 2011 Estimating demographics of the Nile crocodile (Crocodylus
niloticus Laurenti) in the panhandle region of the Okavango Delta, Botswana. African
Journal of Ecology 50(1): 1-8
Buckland S T, Anderson D R, Burnham K P, Laake J L, Borchers, D L, and Thomas L 2001
Introduction to Distance Sampling: Estimating Abundance of Biological Populations.
USA, Oxford University Press
Caldicott D G E, Croser D, Manolis C, Webb G, and Britton A 2005 Crocodile attack in
Australia: an analysis of its incidence and review of the pathology and management of
crocodilian attacks in general. Wilderness and Environmental Medicine 16: 143-159
CITES 2010 Notification to the Parties: Madagascar: Recommendation to suspend trade. No.
2010/015. http://www.cites.org/eng/notif/2010/E015.pdf (accessed on 12 March 2012)
Elith J, Graham C H, Anderson R P, Dudík M, Ferrier S, Guisan A, Hijmans R J, Huettman F,
Leathwick J R, Lehmann A, Li J, Lohman L.G., Loiselle B A, Manion G, Mortiz C,
Nakamura M, Nakazawa Y, Overton J M, Peterson A T, Phillips S J, Richardson K,
Scachetti-Pereira S, Schapire R E, Soberon J, Williams S, Wisz M S, and Zimmerman E
2006 Novel methods improve prediction of species’ distributions from occurrence data.
Ecography 29(2): 129–151
Fielding A H and Bell J F 1997 A Review of Methods for the Assessment of Prediction Errors in
Conservation Presence/Absence Models. Environmental Conservation 24(01): 38–49

44
Fergusson R A 2010 Nile Crocodile (Crocodylus niloticus). 84-89 in Crocodiles. Status Survey
and Conservation Action Plan. Third Edition, ed. by S.C. Manolis and C. Stevenson.
Crocodile Specialist Group: Darwin
Franklin J 2009 Mapping species distributions: Spatial inference and prediction. New York,
Cambridge University Press
Guisan A and Thuiller W 2005 Predicting species distribution: offering more than simple habitat
models. Ecology Letters 8(9): 993–1009
Guisan A and Zimmermann N E 2000 Predictive habitat distribution models in ecology.
Ecological Modelling, 135(2–3), 147–186
Hernandez P A, Graham C H, Master L L, and Albert D L 2006 The effect of sample size and
species characteristics on performance of different species distribution modeling
methods. Ecography 29(5): 773–785
Hijmans R J 2012 Cross-validation of species distribution models: removing spatial sorting bias
and calibration with a null model. Ecology 93(3): 679–688
Hutton J M and Woolhouse M E J 1989 Mark-recapture to assess factors affecting the proportion
of a Nile crocodile population seen during spotlight counts at Ngezi, Zimbabwe, and the
use of spotlight counts to monitor crocodile abundance. Journal of Applied Ecology
26:381–395

45
Kushlan J A 1988 Conservation and management of the American Crocodile. Environmental
Management 12(6): 777-790
Lennon J J 2000 Red-shifts and red herrings in geographical ecology. Ecography 23(1): 101–113
Lindenmayer D B, McCarthy M A, Parris K M, and Pope M L 2000 Habitat fragmentation,
landscape context, and mammalian assemblages in Southeastern Australia. Journal of
Mammalogy 81(3): 787–797
Liu C, White M, and Newell G 2011 Measuring and comparing the accuracy of species
distribution models with presence-absence data. Ecography 34: 232-243
Lutz P L and Dunbar-Cooper A 1982 The nest environment of the American crocodile. Florida,
USA, National Park Service, South Florida Research Center, Final Report T-671
McGregor J 2005 Crocodile crimes: people versus wildlife and the politics of postcolonial
conservation on Lake Kariba, Zimbabwe. Geoforum 36(3): 353–369
Ottley B, Lippai C, and Rakotondrazafy A M M 2008 Surveys of Wild Crocodile Populations in
Madagascar. Final Report to Madagascar government and CITES
Pearson R G 2007 Species’ distribution modeling for conservation educators and practitioners.
Retrieved from http://ncep.amnh.org
Pearson R G, Dawson T P, Berry P M, and Harrison P A 2002 Species: A spatial evaluation of
climate impact on the envelope of species. Ecological Modelling 154: 289-300
46
Phillips S J, Anderson R P, and Schapire R E 2006 Maximum entropy modeling of species
geographic distributions. Ecological Modelling 190: 231-259
Phillips S J and Dudik M 2008 Modeling of species distributions with Maxent: New extensions
and a comprehensive evaluation. Ecography 31: 161-175
Rödder D, Engler J O, Bonke R, Weinsheimer F, and Pertel W 2010 Fading of the Last Giants:
An Assessment of Habitat Availability of the Sunda Gharial (Tomistoma Schlegelii) and
Coverage with Protected Areas. Aquatic Conservation: Marine and Freshwater
Ecosystems 20(6): 678–684
Ross J P 2000 Melanosuchus niger. In: IUCN 2011. IUCN Red List of Threatened Species.
Version 2011.2. http://www.iucnredlist.org. (accessed on 12 March 2012)
Shacks V 2006 A habitat suitability model for the Nile crocodile, Crocodylus niloticus, in the
Okavango Delta, Botswana. MA thesis. South Africa Stellenbosch University
Shirley M H, Dorazio R M., Abassery E, Elhady E E, Mekki M S, and Asran, H H 2012
Accounting for heterogeneity of detectability of multiple observers. The Journal of
Wildlife Management 76(5): 966-975
Steel R 1989 Crocodiles. Kent United Kingdom, Christopher Helm
Stockwell D R B 1992 Machine learning and the problem of prediction and explanation in
ecological modelling. PhD thesis. Australian National University, Canberra
47
Thorbjarnarson J 1999 Crocodile Tears and Skins: International Trade, Economic Constraints,
and Limits to the Sustainable Use of Crocodilians. Conservation Biology 13(3): 465-470
Václavík T, Kupfer J A, and Meentemeyer R K 2012 Accounting for multi-scale spatial
autocorrelation improves performance of invasive species distribution modelling (iSDM).
Journal of Biogeography 39(1): 42–55
Washington H, Rabenoro M, Andiambololona N, Griffin O, Higgins F, Osmond T, Shah P, and
Clementine V M 2009 University of Bath Mahamavo Expedition 2009: Final Report.
United Kingdom, University of Bath
Washington H 2011 Patterns and trends in biodiversity in the Mahamavo watershed, western
Madagascar: species distribution models as a monitoring tool. Undergraduate thesis.
United Kingdom, University of Bath


![Analysis of Siamese Crocodile (Crocodylus siamensis ... · In the egg white of the 5 Siamese crocodile, twenty isoforms of transferrin precursor were found [5]. Ovotransferrin, being](https://static.fdocuments.net/doc/165x107/6084bd66e0f5240fa35f6ba6/analysis-of-siamese-crocodile-crocodylus-siamensis-in-the-egg-white-of-the.jpg)