Spatial data integration for classification of 3D point ... · SPATIAL DATA INTEGRATION FOR...
15
SPATIAL DATA INTEGRATION FOR CLASSIFICATION OF 3D POINT CLOUDS FROM DIGITAL PHOTOGRAMMETRY Joshphar Kunapo, Monash University Correspondence to Joshphar Kunapo: [email protected] Under increased urban settlement density, access to a high resolution (land-parcel scale) bare-earth Digital Elevation Model (DEM) is a pre-requisite for much decision support for planning: stormwater assessment, flood control, 3D visualisation, automatic delineation of flow paths, sub watersheds and flow networks for hydrological modelling. In these terms, a range of options face the DEM-building team. Apart from using necessarily expensive field survey, or use of out-of-date terrain information (usually in the form of digital contours of less-than-satisfactory interval) the model will be built from point-clouds. These will have been assembled via digital photogrammetry or acquisition of LiDAR data. In the first instance, both these data types soon yield a model that is known as a digital surface model (DSM). It includes any buildings, vehicles, vegetation (canopy and understory), as well as the “bare ground". To generate the required ’bare-earth' DEM, ground and non-ground features/data points must be distinguished from each other so that the latter can be eliminated before DEM building. Existing methods for doing this are based on data filtering routines, and are known to produce errors of omission and commission. Moreover, their implementation is complex and time consuming. I report here, the results of deploying spatial data integration instead of the previously favoured filtering routines. The challenge was to identify a process flow for separating the ground and non-ground points. It is shown that this alternative approach can be implemented if the client can supply a range of ancillary height data, this being most economically forthcoming if archivally available. The relative significance of these archival datasets emerges from exploring the various process flow paths and devising relevant quality tests designed to distinguish input suitable to support modelling at a land-parcel scale of analysis. Then the ArcGIS topological overlay technique was used to collect zonal statistics for each 3D point. Thus each output 3D point acquires z (elevation) values derived from the digital photogrammetry and “z-statistics” (minimum, maximum, mean) of its assigned zone. Clearly there is value in spatial data integration for a city with spatial data archives of adequately supportive scope and quality. INTRODUCTION Planners at Victorias’ fastest-growing LGA, the City of Casey (2005) (~ 400 square kilometres on the south-eastern edge of Melbourne) are formulating the Cranbourne West and Lyndhurst Residential Development Plan in the spirit of Melbourne 2030 (Department of Sustainability and Environment 2002). Under increased urban settlement density, access to a high resolution bare-earth Digital Elevation Model (DEM) is a pre-requisite for much decision support: storm- water assessment, flood control, 3D visualisation (Hodgson and Bresnahan 2004), automatic delineation of flow paths, sub watersheds and flow networks for hydrological modelling (Wilson and Gallant 2000). The DEM choice, quality and resolution is known to be of very critical im- portance for realistic definition of the watershed and sub-watershed boundaries and topographic ARTICLES APPLIED GIS, VOLUME 1, NUMBER 3, 2005 MONASH UNIVERSITY EPRESS 26.1
Transcript of Spatial data integration for classification of 3D point ... · SPATIAL DATA INTEGRATION FOR...
SPATIAL DATA INTEGRATION FORCLASSIFICATION OF 3D POINT CLOUDS FROMDIGITAL PHOTOGRAMMETRYJoshphar Kunapo, Monash UniversityCorrespondence to Joshphar Kunapo: [email protected]
Under increased urban settlement density, access to a high resolution (land-parcel scale) bare-earth DigitalElevation Model (DEM) is a pre-requisite for much decision support for planning: stormwater assessment,flood control, 3D visualisation, automatic delineation of flow paths, sub watersheds and flow networksfor hydrological modelling. In these terms, a range of options face the DEM-building team. Apart from usingnecessarily expensive field survey, or use of out-of-date terrain information (usually in the form of digitalcontours of less-than-satisfactory interval) the model will be built from point-clouds. These will have beenassembled via digital photogrammetry or acquisition of LiDAR data. In the first instance, both these datatypes soon yield a model that is known as a digital surface model (DSM). It includes any buildings, vehicles,vegetation (canopy and understory), as well as the “bare ground". To generate the required ’bare-earth'DEM, ground and non-ground features/data points must be distinguished from each other so that the lattercan be eliminated before DEM building. Existing methods for doing this are based on data filtering routines,and are known to produce errors of omission and commission. Moreover, their implementation is complexand time consuming.
I report here, the results of deploying spatial data integration instead of the previously favoured filteringroutines. The challenge was to identify a process flow for separating the ground and non-ground points.It is shown that this alternative approach can be implemented if the client can supply a range of ancillaryheight data, this being most economically forthcoming if archivally available. The relative significance ofthese archival datasets emerges from exploring the various process flow paths and devising relevantquality tests designed to distinguish input suitable to support modelling at a land-parcel scale of analysis.Then the ArcGIS topological overlay technique was used to collect zonal statistics for each 3D point. Thuseach output 3D point acquires z (elevation) values derived from the digital photogrammetry and “z-statistics”(minimum, maximum, mean) of its assigned zone. Clearly there is value in spatial data integration for acity with spatial data archives of adequately supportive scope and quality.
INTRODUCTIONPlanners at Victorias’ fastest-growing LGA, the City of Casey (2005) (~ 400 square kilometreson the south-eastern edge of Melbourne) are formulating the Cranbourne West and LyndhurstResidential Development Plan in the spirit of Melbourne 2030 (Department of Sustainabilityand Environment 2002). Under increased urban settlement density, access to a high resolutionbare-earth Digital Elevation Model (DEM) is a pre-requisite for much decision support: storm-water assessment, flood control, 3D visualisation (Hodgson and Bresnahan 2004), automaticdelineation of flow paths, sub watersheds and flow networks for hydrological modelling (Wilsonand Gallant 2000). The DEM choice, quality and resolution is known to be of very critical im-portance for realistic definition of the watershed and sub-watershed boundaries and topographic
ARTICLES
APPLIED GIS, VOLUME 1, NUMBER 3, 2005 MONASH UNIVERSITY EPRESS 26.1
input, and subsequent simulated outputs (Luzio et al. 2005). In these terms, a range of optionsface the decision-support team.
Traditionally, DEMs have been produced by survey methods or by stereo photogrammetry(Sties et al. 2000). The airborne light detection and ranging (LiDAR) technology is revolutionisinga high-resolution DEM generation by producing the means for rapid measurements of topographyover a large area (Zhang et al. 2003; Hodgson and Bresnahan 2004). Since the introduction ofLiDAR in the mapping industry, its applications in GIS and other areas has increased exponentiallyand diversified innovatively. Airborne LiDAR systems usually obtain measurements for the hori-zontal coordinates (x, y) and elevation (z) of the reflective objects scanned by the laser beneaththe flight path. These measurements generate a three-dimensional cloud of points with irregularspacing. Digital photogrammetry is evolving as the art, science and technology of obtaining reliablemeasurements, maps, digital elevation models and other GIS data about the earth and its envir-onment from aerial and satellite imagery. Photogrammetrists are responsible for all phases ofmapping projects and provide spatially accurate base maps that form the foundation for manyGIS applications. Digital mapping cameras (DMC) like Ultracam-D, allow true integration ofdigital photogrammetry and remote sensing mapping (Perko et al. 2004; Leberl and Gruber2005).
LiDAR provides very accurate position and height information, but less direct informationon the geometrical shape of objects within the field of view. High-resolution imagery on theother hand offers very detailed information on object attributes, such as spectral signature, textureand shape. Davis et al., (2002) found that for monitoring volume changes in riparian resources,photogrammetry provides more accurate monitoring data than LiDAR, although more carefulphotogrammetric processing is necessary to attain monitoring accuracy requirements within ve-getated zones with any kind of canopy. It is found that photogrammetry and LiDAR have theirunique advantages and drawbacks for building extraction during 3D city modelling (Tao andYasuoka 2002). This illustrates the general point that some of the shortcomings of one methodcan be compensated by taking advantage of unique capabilities offered to users of the othermethod (Schenk and Csatho 2002).
Urbanisation brings terrain change, which inturn makes even the costliest elevation modelsobsolete. This is most evident in the fast-developing suburbs such as found in the Melbournemetropolitan City of Casey. Procurement of high resolution imagery (e.g. Aerial photos) is a pre-requisite for monitoring land-cover changes. Often it is not economical to opt for both Aerialphotos (for image map) and LiDAR data (for elevation). As always, the principle of economy(Dale and McLaughlin 1988) dictates deployment of data integration. In the absence of accessto LiDAR data, or a contour map of very close contour intervals, the key data set will be fromphotogrammetric analysis of stereo-pairs of air photos of suitable (nominal) scale. In that, CaseyCity procures high resolution aerial photos as part of the image map acquisition, there is potentialfor widening the data and information flows for terrain modelling if the coverage is in stereo.However, first there is a need to assess the scope for delivering a bare-earth DEM of high-enoughquality via this path.
Both the LiDAR and the digital photogrammetry most readily generate a model that is knownas a digital surface model (DSM), which include buildings, vehicles, vegetation (canopy and un-derstory), as well as the “bare ground”. To generate a ‘bare-earth’ DEM, measurements fromground and non-ground features have to be identified and classified (Sties et al. 2000; Zhang et
CLASSIFICATION OF 3D POINT CLOUDS ARTICLES26.2
al. 2003) from the 3D point clouds of DSM. Removing non-ground points from 3D point cloudseither from digital photogrammetry or LiDAR has proven to be a challenging task (Zhang, etal. 2003).
Kraus and Pfeifer (1997; 1998) utilised linear least squares interpolation iteratively to removetree measurements to generate bare-earth DEM in forest areas. This method was extended laterto filter buildings and trees in urban areas by (Pfeifer et al. 2001). The iterative linear interpolationmethod removes a low-degree polynomial trend surface from the original elevation data to producea set of reduced elevation values. This method requires that the reduced elevation follows arandom process of ergodic property. However, this criterion is hard to satisfy in urban areaswhere significant anthropogenic modification of natural terrain occurs. Vosselman (2000) pro-posed a slope-based filter that identifies ground data by comparing slopes between a 3D pointand its neighbours.
There are two basic error types in classifying 3D point clouds by virtually any filteringmethod: they refer to errors of commission and errors of omission. In the first of these, non-ground points are classified as ground measurements (Congalton 1991). The errors of omissionoccur when ground points are mistakenly removed. Vosselman (2000) demonstrated that goodfiltering results could be obtained by using threshold slopes from training datasets. However, toachieve such good results, the training datasets have to include all types of ground measurementsin a study area. This is not always practical. Other attempts to improve the slope-based filterhave been published by Roggero (2001) and Sithole (2001). The implicit premise of applying theslope-based filter is that there is a distinct difference between the slope of terrain and that ofnon-ground objects such as trees and buildings.
Haugerud and Harding (2001) developed an algorithm to filter tree points in forest areas bycomparing local curvatures of point measurements. Ground measurements were selected by re-moving tree vertices iteratively from a triangulated irregular network (TIN) constructed from3D points. Alternatively, ground points can be classified by iteratively selecting ground measure-ments from an original dataset. Axelsson (2000) suggested adaptive TIN models to find groundpoints in urban areas. First, seed ground points within a user-defined grid of a size greater thanthe largest non-ground features are selected to compose an initial ground dataset. Then, onepoint above each TIN facet is added to the ground dataset with every iteration if its parametersare below selected threshold values. The iteration continues until no points can be added to theground dataset. The problem with the adaptive TIN method is that different thresholds have tobe given for various land cover types.
Another commonly used algorithm to remove non-ground objects is a mathematical morpho-logy filter which is applied to a grayscale image (Kilian et al. 1996; Lohmann et al. 2000; Vossel-man 2000). The elevation of trees, cars, and buildings is usually higher than those of surroundingground points. If 3D points are converted into a regular, greyscale grid image in terms of elevation,then the shapes of buildings, cars, and trees can be identified by the change of gray tone. It iswell known that compositions of algebraic set operations based on mathematical morphologycan be used to identify objects in a grayscale image. Mathematical morphology composes opera-tions based on set theory to extract features from an image. Two fundamental operations, dilation(focal maximum) and erosion (focal minimum), are commonly employed to enlarge (dilate) orreduce (erode) the size of features in binary images. Dilation and erosion operations may becombined to produce opening and closing operations (Zhang et al. 2003). This process has been
CLASSIFICATION OF 3D POINT CLOUDS ARTICLES 26.3

tested in the current study. It was found that like other filtering methods, the progressive mor-phological filter is also subject to omission and commission errors. Moreover, its implementationis complex and time consuming. Also, the raster-based approach is not found to be suitable forclassifying the input points, because too many non-ground points tend to be removed.
Accordingly, given the complexity involved, the following are the objectives of the papers:a) to explore spatial dataset archives for range of ancillary height data wishing to make mostout of the data, b) to identify GIS methods to help performing a quick quality check on ancillaryheight data, c) to identify a process flow for the classification of 3D point clouds into groundand non-ground points with the help of spatial data integration.
TEST SITEThe test site (between 38.088 to 38.108 S and longitudes 145.245 to 145.270 E, see Figure 1)covers a part of City of Casey, Victoria, Australia and is supported by all the data required forthe study.
Figure 1 Location map of the test site.
SOFTWARE AND DATA USEDLeica Photogrammetry Suite (LPS©) (http://www.gis.leica-geosystems.com) photogrammetrictools and ESRI © (http://www.esri.com) ArcGIS Spatial Analyst tools were used in this study.
CLASSIFICATION OF 3D POINT CLOUDS ARTICLES26.4
High resolution aerial stereo photos from Qasco (http://www.qasco.com.au) with camera calib-ration information were assembled in digital form. Access to the Victorian Spatial Database In-frastructure (VSDI) datasets, along with ancillary data from the City of Casey and South EastWater Corporation (eg Manhole covers) completed the list of primary input data.
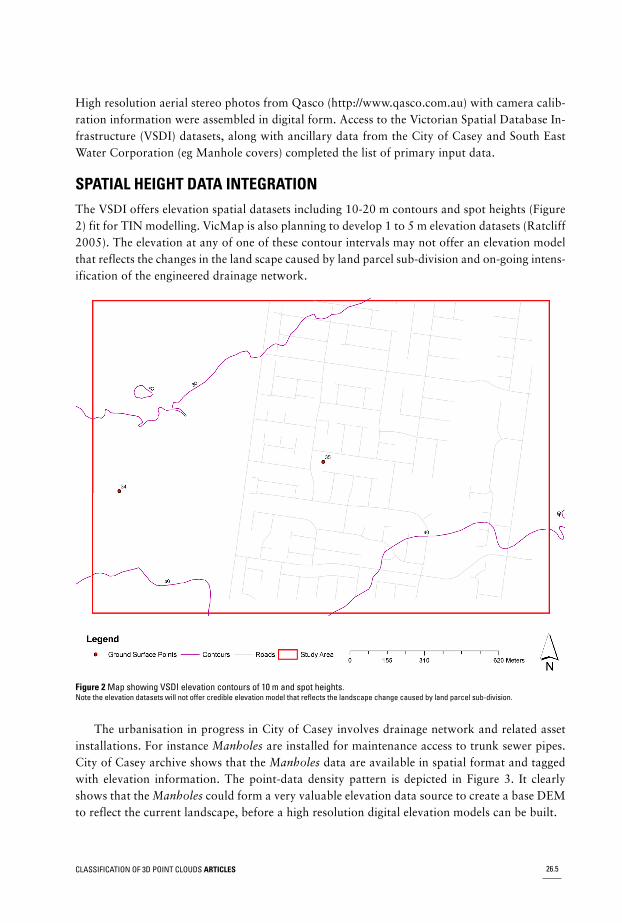
SPATIAL HEIGHT DATA INTEGRATIONThe VSDI offers elevation spatial datasets including 10-20 m contours and spot heights (Figure2) fit for TIN modelling. VicMap is also planning to develop 1 to 5 m elevation datasets (Ratcliff2005). The elevation at any of one of these contour intervals may not offer an elevation modelthat reflects the changes in the land scape caused by land parcel sub-division and on-going intens-ification of the engineered drainage network.
Figure 2 Map showing VSDI elevation contours of 10 m and spot heights.Note the elevation datasets will not offer credible elevation model that reflects the landscape change caused by land parcel sub-division.
The urbanisation in progress in City of Casey involves drainage network and related assetinstallations. For instance Manholes are installed for maintenance access to trunk sewer pipes.City of Casey archive shows that the Manholes data are available in spatial format and taggedwith elevation information. The point-data density pattern is depicted in Figure 3. It clearlyshows that the Manholes could form a very valuable elevation data source to create a base DEMto reflect the current landscape, before a high resolution digital elevation models can be built.
CLASSIFICATION OF 3D POINT CLOUDS ARTICLES 26.5
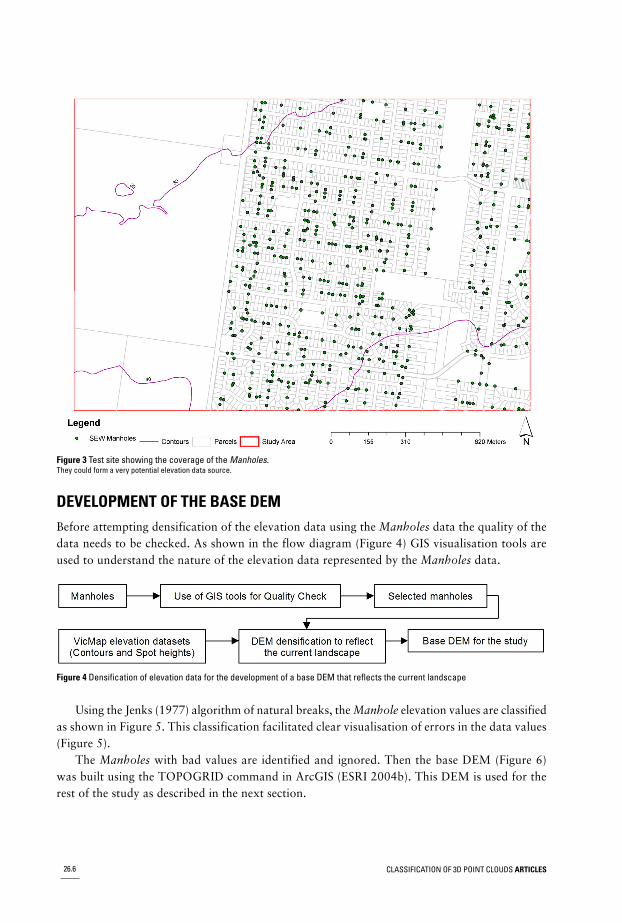
Figure 3 Test site showing the coverage of the Manholes.They could form a very potential elevation data source.
DEVELOPMENT OF THE BASE DEMBefore attempting densification of the elevation data using the Manholes data the quality of thedata needs to be checked. As shown in the flow diagram (Figure 4) GIS visualisation tools areused to understand the nature of the elevation data represented by the Manholes data.
Figure 4 Densification of elevation data for the development of a base DEM that reflects the current landscape
Using the Jenks (1977) algorithm of natural breaks, the Manhole elevation values are classifiedas shown in Figure 5. This classification facilitated clear visualisation of errors in the data values(Figure 5).
The Manholes with bad values are identified and ignored. Then the base DEM (Figure 6)was built using the TOPOGRID command in ArcGIS (ESRI 2004b). This DEM is used for therest of the study as described in the next section.
CLASSIFICATION OF 3D POINT CLOUDS ARTICLES26.6
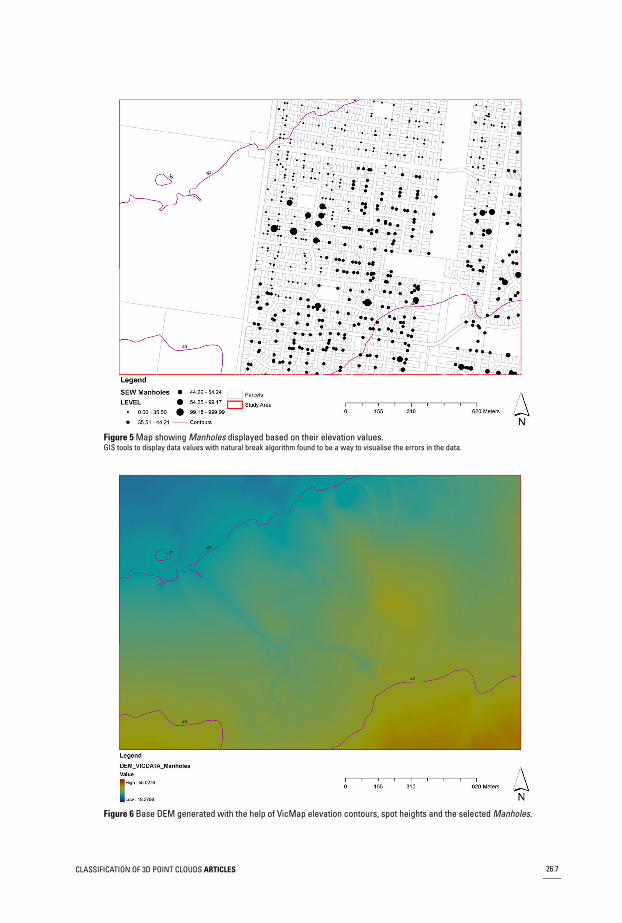
Figure 5 Map showing Manholes displayed based on their elevation values.GIS tools to display data values with natural break algorithm found to be a way to visualise the errors in the data.
Figure 6 Base DEM generated with the help of VicMap elevation contours, spot heights and the selected Manholes.
CLASSIFICATION OF 3D POINT CLOUDS ARTICLES 26.7
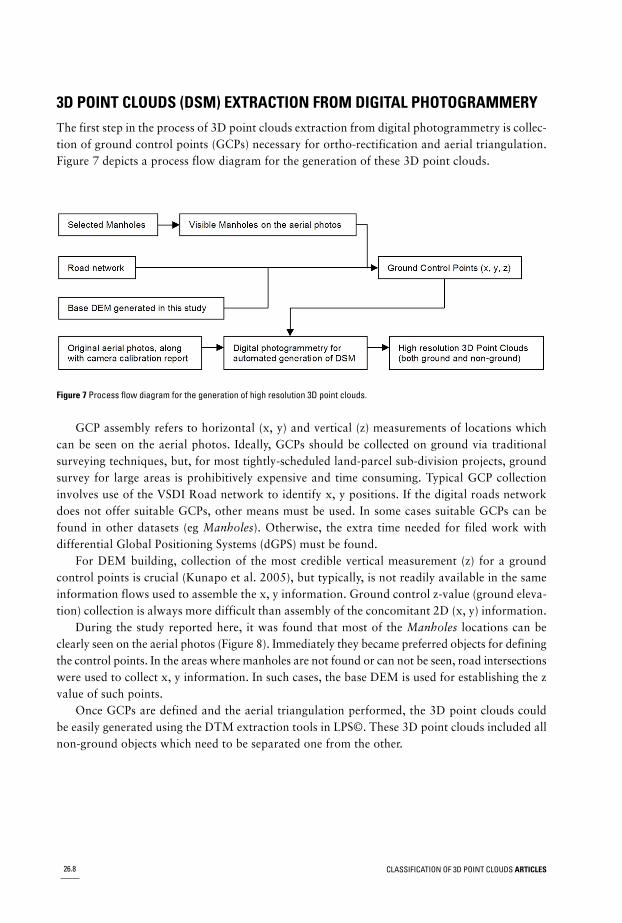
3D POINT CLOUDS (DSM) EXTRACTION FROM DIGITAL PHOTOGRAMMERYThe first step in the process of 3D point clouds extraction from digital photogrammetry is collec-tion of ground control points (GCPs) necessary for ortho-rectification and aerial triangulation.Figure 7 depicts a process flow diagram for the generation of these 3D point clouds.
Figure 7 Process flow diagram for the generation of high resolution 3D point clouds.
GCP assembly refers to horizontal (x, y) and vertical (z) measurements of locations whichcan be seen on the aerial photos. Ideally, GCPs should be collected on ground via traditionalsurveying techniques, but, for most tightly-scheduled land-parcel sub-division projects, groundsurvey for large areas is prohibitively expensive and time consuming. Typical GCP collectioninvolves use of the VSDI Road network to identify x, y positions. If the digital roads networkdoes not offer suitable GCPs, other means must be used. In some cases suitable GCPs can befound in other datasets (eg Manholes). Otherwise, the extra time needed for filed work withdifferential Global Positioning Systems (dGPS) must be found.
For DEM building, collection of the most credible vertical measurement (z) for a groundcontrol points is crucial (Kunapo et al. 2005), but typically, is not readily available in the sameinformation flows used to assemble the x, y information. Ground control z-value (ground eleva-tion) collection is always more difficult than assembly of the concomitant 2D (x, y) information.
During the study reported here, it was found that most of the Manholes locations can beclearly seen on the aerial photos (Figure 8). Immediately they became preferred objects for definingthe control points. In the areas where manholes are not found or can not be seen, road intersectionswere used to collect x, y information. In such cases, the base DEM is used for establishing the zvalue of such points.
Once GCPs are defined and the aerial triangulation performed, the 3D point clouds couldbe easily generated using the DTM extraction tools in LPS©. These 3D point clouds included allnon-ground objects which need to be separated one from the other.
CLASSIFICATION OF 3D POINT CLOUDS ARTICLES26.8
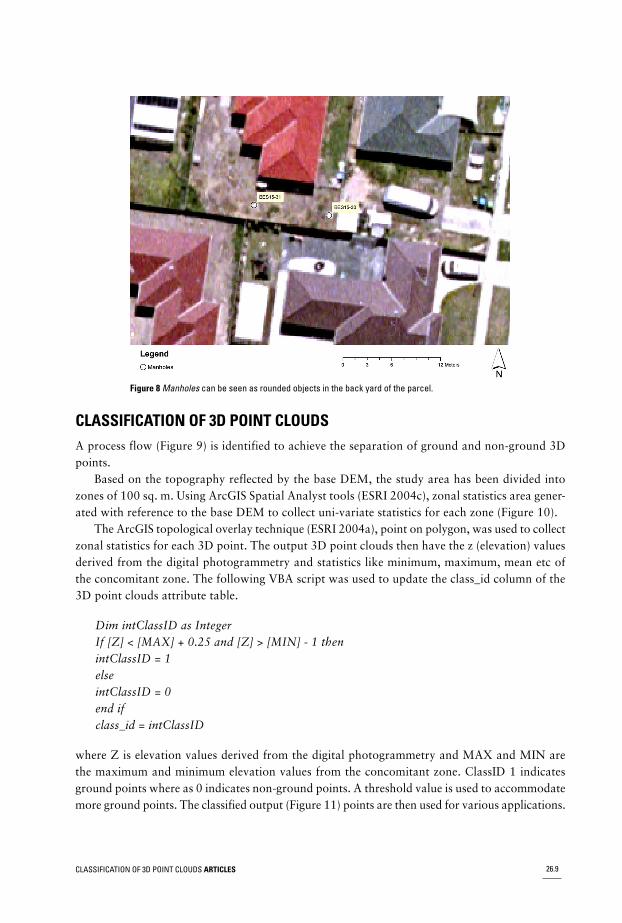
Figure 8 Manholes can be seen as rounded objects in the back yard of the parcel.
CLASSIFICATION OF 3D POINT CLOUDSA process flow (Figure 9) is identified to achieve the separation of ground and non-ground 3Dpoints.
Based on the topography reflected by the base DEM, the study area has been divided intozones of 100 sq. m. Using ArcGIS Spatial Analyst tools (ESRI 2004c), zonal statistics area gener-ated with reference to the base DEM to collect uni-variate statistics for each zone (Figure 10).
The ArcGIS topological overlay technique (ESRI 2004a), point on polygon, was used to collectzonal statistics for each 3D point. The output 3D point clouds then have the z (elevation) valuesderived from the digital photogrammetry and statistics like minimum, maximum, mean etc ofthe concomitant zone. The following VBA script was used to update the class_id column of the3D point clouds attribute table.
Dim intClassID as IntegerIf [Z] < [MAX] + 0.25 and [Z] > [MIN] - 1 thenintClassID = 1elseintClassID = 0end ifclass_id = intClassID
where Z is elevation values derived from the digital photogrammetry and MAX and MIN arethe maximum and minimum elevation values from the concomitant zone. ClassID 1 indicatesground points where as 0 indicates non-ground points. A threshold value is used to accommodatemore ground points. The classified output (Figure 11) points are then used for various applications.
CLASSIFICATION OF 3D POINT CLOUDS ARTICLES 26.9
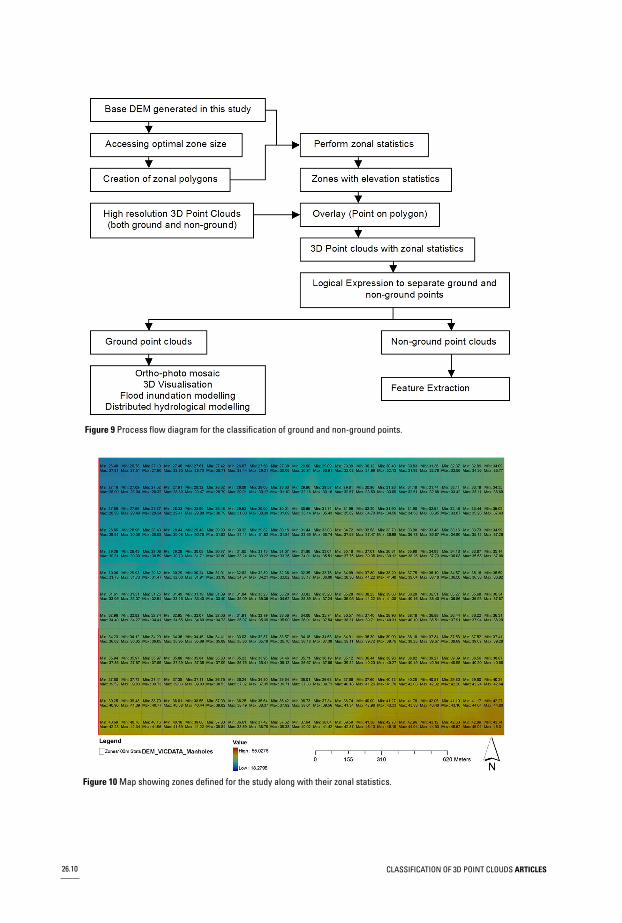
Figure 9 Process flow diagram for the classification of ground and non-ground points.
Figure 10 Map showing zones defined for the study along with their zonal statistics.
CLASSIFICATION OF 3D POINT CLOUDS ARTICLES26.10
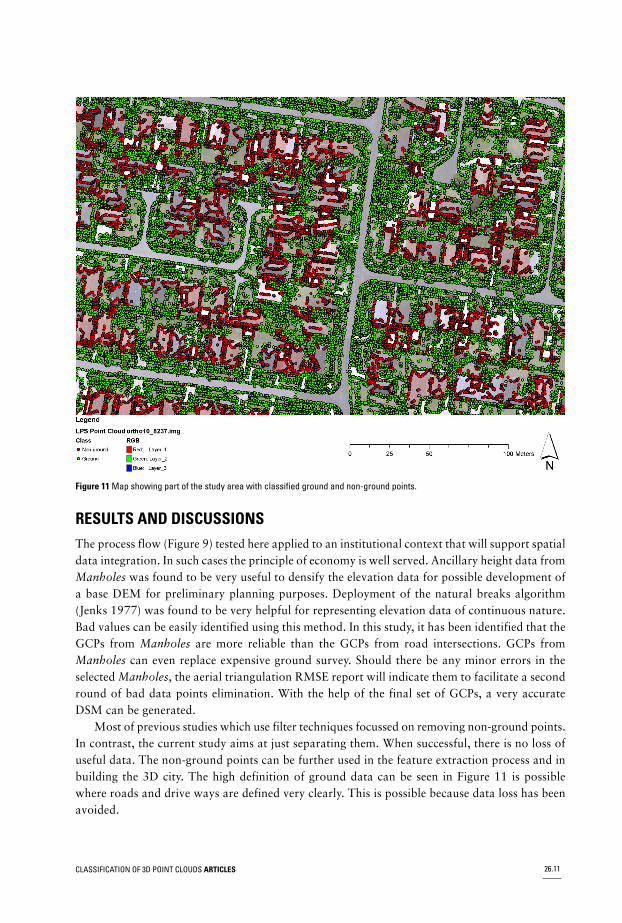
Figure 11 Map showing part of the study area with classified ground and non-ground points.
RESULTS AND DISCUSSIONSThe process flow (Figure 9) tested here applied to an institutional context that will support spatialdata integration. In such cases the principle of economy is well served. Ancillary height data fromManholes was found to be very useful to densify the elevation data for possible development ofa base DEM for preliminary planning purposes. Deployment of the natural breaks algorithm(Jenks 1977) was found to be very helpful for representing elevation data of continuous nature.Bad values can be easily identified using this method. In this study, it has been identified that theGCPs from Manholes are more reliable than the GCPs from road intersections. GCPs fromManholes can even replace expensive ground survey. Should there be any minor errors in theselected Manholes, the aerial triangulation RMSE report will indicate them to facilitate a secondround of bad data points elimination. With the help of the final set of GCPs, a very accurateDSM can be generated.
Most of previous studies which use filter techniques focussed on removing non-ground points.In contrast, the current study aims at just separating them. When successful, there is no loss ofuseful data. The non-ground points can be further used in the feature extraction process and inbuilding the 3D city. The high definition of ground data can be seen in Figure 11 is possiblewhere roads and drive ways are defined very clearly. This is possible because data loss has beenavoided.
CLASSIFICATION OF 3D POINT CLOUDS ARTICLES 26.11
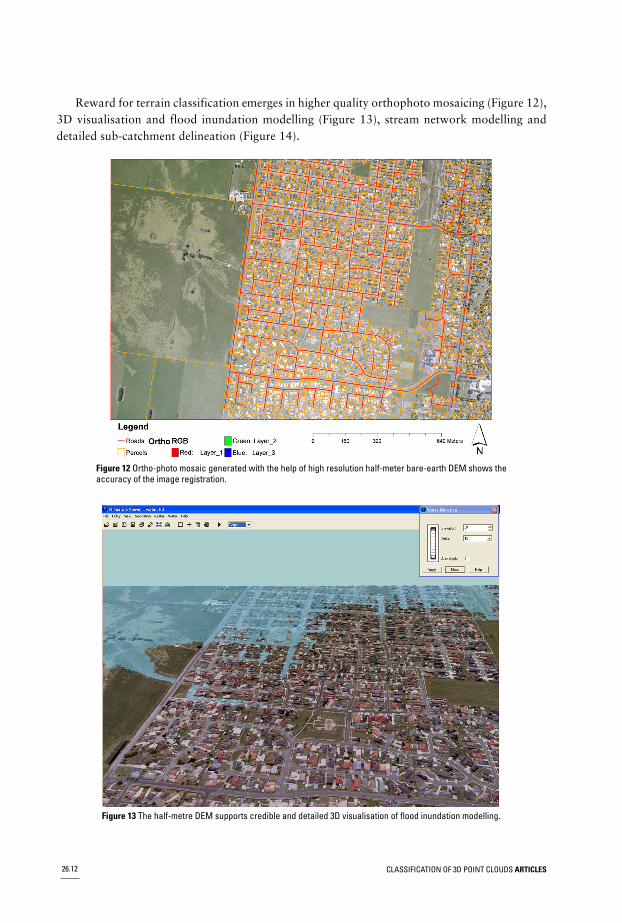
Reward for terrain classification emerges in higher quality orthophoto mosaicing (Figure 12),3D visualisation and flood inundation modelling (Figure 13), stream network modelling anddetailed sub-catchment delineation (Figure 14).
Figure 12 Ortho-photo mosaic generated with the help of high resolution half-meter bare-earth DEM shows theaccuracy of the image registration.
Figure 13 The half-metre DEM supports credible and detailed 3D visualisation of flood inundation modelling.
CLASSIFICATION OF 3D POINT CLOUDS ARTICLES26.12
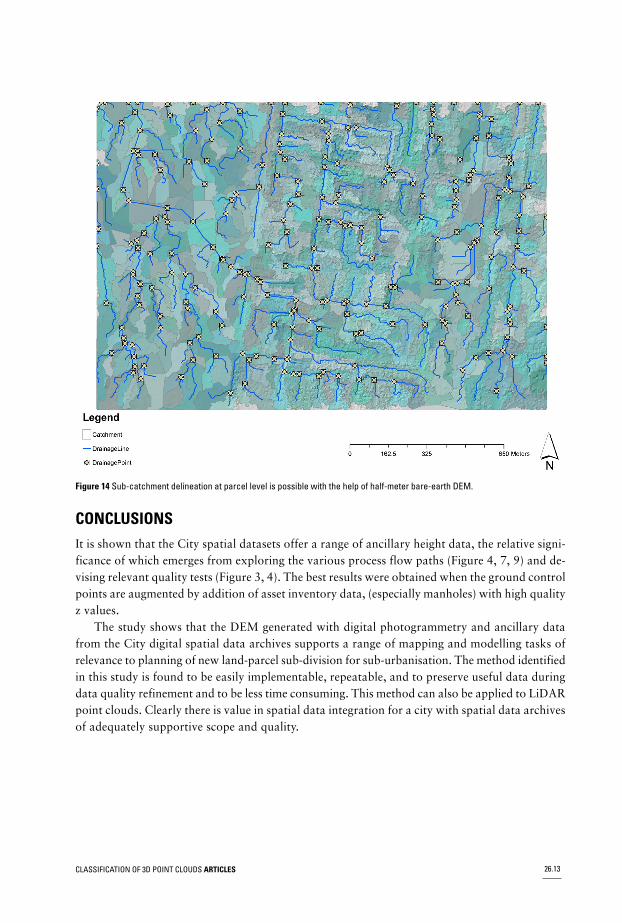
Figure 14 Sub-catchment delineation at parcel level is possible with the help of half-meter bare-earth DEM.
CONCLUSIONSIt is shown that the City spatial datasets offer a range of ancillary height data, the relative signi-ficance of which emerges from exploring the various process flow paths (Figure 4, 7, 9) and de-vising relevant quality tests (Figure 3, 4). The best results were obtained when the ground controlpoints are augmented by addition of asset inventory data, (especially manholes) with high qualityz values.
The study shows that the DEM generated with digital photogrammetry and ancillary datafrom the City digital spatial data archives supports a range of mapping and modelling tasks ofrelevance to planning of new land-parcel sub-division for sub-urbanisation. The method identifiedin this study is found to be easily implementable, repeatable, and to preserve useful data duringdata quality refinement and to be less time consuming. This method can also be applied to LiDARpoint clouds. Clearly there is value in spatial data integration for a city with spatial data archivesof adequately supportive scope and quality.
CLASSIFICATION OF 3D POINT CLOUDS ARTICLES 26.13

ACKNOWLEDGEMENTSAerial photos were kindly provided by the City of Casey and the Manhole data by South EastWater via the City of Casey. Access to the road network, elevation datasets was via the custodiansof the Victorian Spatial Data Infrastructure (SDI). The exchange of ideas with Monash colleagues– Assoc. Prof. Jim Peterson, Ms Ratna Kunapo, Dr. Shobhit Chandra, Dr Xuan Zhu and Mr McMahon, Centre for Geographical Information Systems, School of Geography and EnvironmentalScience – is acknowledged.
REFERENCESAxelsson, P'DEM generation from laser scanner data using adaptive tin models'. International Archives of
Photogrammetry and Remote Sensing 2000; 33 (pt. B3): 85–92.City of Casey. (2005). "Inside Info." Retrieved July 12th, 2005, from
http://www.casey.vic.gov.au/insideinfo/section.asp?Major=88.Congalton, R'A review of assessing the accuracy of classifications of remotely sensed data'. Remote Sensing
Environment 1991; 37: 35–46.Dale, P. F. and McLaughlin, J. Land Information Management: An Introduction withSpecial Reference to
Cadastral Problems in Third World Countries. Oxford: Clarendon Press; 1988.Davis, P. A., Mietz, S. N., Kohl, K. A., Rosiek, M. R. and Gonzales, F. M. 'Evaluation of LiDAR and
Photogrammetry for monitoring volume changes in riparian resources within the Grand Canyon,Arizona'. ISPRS. Pecora; 2002.
Department of Sustainability and Environment. (2002). "Melbourne 2030 Key Directions." Retrieved01/07/05, from http://www.dse.vic.gov.au/melbourne2030online/content/strategic_framework/03a_compact.html.
ESRI. Identity: ArcGIS Desktop help. Redlands, CA: Environment Systems Research Institute Inc.; 2004a.ESRI. Topogrid: ArcGIS Desktop help. Redlands, CA: Environment Systems Research Institute Inc.; 2004b.ESRI. Zonal Statistics: ArcGIS Desktop, Spatial Analyst help. Redlands, CA: Environment Systems Research
Institute Inc.; 2004c.Haugerud, R; Harding, D'Some algorithms for virtual deforestation (VDF) of LIDAR topographic survey
data'. International Archives of Photogrammetry and Remote Sensing 2001; 34 (pt. 3/W4): 211–218.Hodgson, M; Bresnahan, P'Accuracy of airbourne LiDAR-derived elevation: Empirical assessment and error
budget.' Photogrammetric Engineering and Remote Sensing 2004; 70 (3): 331–339.Jenks, G. F. 'Optimal Data Classification for Choropleth Maps'. Occasional Paper No.2, Department of
Geography. University of Kansas; 1977.Kilian, J; Haala, N; Englich, M'Capture and evaluation of airborne laser scanner data'. International Archives
of Photogrammetry and Remote Sensing 1996; 31: 383–388.Kraus, K; Pfeifer, N. 'A new method for surface reconstruction from laser scanner data'. International
Archives of Photogrammetry and Remote Sensing 1997; 32: pt. 3–2W3.Kraus, K; Pfeifer, N'Determination of terrain models in wood areas with airborne laser scanner data'. ISPRS
Journal of Photogrammetry and Remote Sensing. 1998; 53: 193–203.Kunapo, J., Chandra, S., Peterson, J. and Brady, C. 'Optimisation of process flow for high resolution DEM
generation via digital photogrammetry: test of options with and without ancillary data'. Proceedingsof SSC 2005 Spatial Intelligence, Innovation and Praxis: The national biennial Conference of theSpatial Sciences Institute. Melbourne; 2005. September. 1388–1392.
Leberl, F. and Gruber, M. 'Ultracam-D: Understanding Some Noteworthy Capabilities'. PhotogrammetricWeek 2005 in Stuttgart, Germany. 2005.
Lohmann, P; Koch, A; Schaeffe, M'Approaches to the filtering of laser scanner data'. International Archivesof Photogrammetry and Remote Sensing 2000; 33: 540–547.
CLASSIFICATION OF 3D POINT CLOUDS ARTICLES26.14

Luzio, M; Arnold, J; Raghavan, S'Effect of GIS data quality on small watershed stream flow and sedimentsimulations'. Hydrological Processes 2005; 19: 629–650. DOI: 10.1002/hyp.5612
Perko, R., Klaus, A. and Gruber, M. 'Quality Comparison Of Digital And Film-Based Images ForPhotogrammetric Purposes'. ISPRS (International Society for Photogrammetry and Remote Sensing),DVD-proceedings. 2004.
Pfeifer, N., Stadler, P. and Briese, C. 'Derivation of digital terrain models in the SCOP++ environment'. Proc.OEEPE Workshop on Airborne Laserscanning and Interferometric SAR for Digital Elevation Models.Stockholm, Sweden.; 2001.
Ratcliff, C. 'Victoria's Statewide Digital Elevation Model Improvement Project '. Proceedings of SSC 2005Spatial Intelligence, Innovation and Praxis: The national biennial Conference of the Spatial SciencesInstitute. Melbourne; 2005. September.
Roggero, M'Airborne laser scanning: Clustering in raw data'. International Archives of Photogrammetryand Remote Sensing 2001; 34 (pt. 3/W4): 227–232.
Schenk, T; Csatho, B'Fusion of LIDAR data and aerial imagery for a more complete surface description'.International Archives of Photogrammetry and Remote Sensing; 2002.
Sithole, G'Filtering of laser altimetry data using a slope adaptive filter'. International Archives ofPhotogrammetry and Remote Sensing 2001; 34 (pt. 3/W4): 203–210.
Sties, M; Kruger, S; Mercer, J; Schnick, S. 'Comparision of digitial elevation data from airbourne laser andinterferometric SAR systems'. International Society for Photogrammetry and Remote Sensing 2000;33.
Tao, G. and Yasuoka, Y. 'Combining High Resolution Satellite Imagery and Airborne Laser Scanning Datafor Generating bareland DEM in Urban Areas'. Proceedings of International Workshop onVisualization and Animation of Landscape, International Archives of Photogrammetry, RemoteSensing and Spatial Information Science. Kunming, China; 2002. February. 26–28.
Vosselman, G. 'Slope based filtering of laser altimetry data'. International Society for Photogrammetry andRemote Sensing 2000; 33 (pt. B4): 958–964.
Wilson, J. P. and Gallant, J. C. Terrain Analysis: Principles and Applications. New York: John Wiley andSons; 2000.
Zhang, K; Chen, S; Whitman, D; Shyu, M; Yan, J; Zhang, C'A progressive morphological filter for removingnonground measurements from airborne LiDAR data'. IEEE Transactions on Geoscience and RemoteSensing 2003; 41 (4): 872–882.
Cite this article as: Kunapo, Joshphar. ‘Spatial data integration for classification of 3D point clouds fromdigital photogrammetry’. Applied GIS, Vol. 1, No. 3, 2005. pp. 26.1–26.15. DOI: 10.2104/ag050026.
CLASSIFICATION OF 3D POINT CLOUDS ARTICLES 26.15