SPECTRAL-SPATIAL CLASSIFICATION OF HYPERSPECTRAL … · SPECTRAL-SPATIAL CLASSIFICATION OF...
5
SPECTRAL-SPATIAL CLASSIFICATION OF HYPERSPECTRAL IMAGERY USING NEURAL NETWORK ALGORITHM AND HIERARCHICAL SEGMENTATION D. Akbari a , M. Moradizadeh b , M. Akbari c a Department of Surveying and Geomatics Engineering, College of Engineering, University of Zabol, Zabol, Iran- . [email protected] b Department of Geomatics, Faculty of Civil and Transportation Engineering, University of Isfahan, Isfahan, Iran c Department of Civil Engineering, College of Engineering, University of Birjand, Birjand, Iran Commission II, WG II/5 KEY WORDS: Remote sensing, Hyperspectral image, neural network, Hierarchical segmentation, Marker selection ABSTRACT: This paper describes a new framework for classification of hyperspectral images, based on both spectral and spatial information. The spatial information is obtained by an enhanced Marker-based Hierarchical Segmentation (MHS) algorithm. The hyperspectral data is first fed into the Multi-Layer Perceptron (MLP) neural network classification algorithm. Then, the MHS algorithm is applied in order to increase the accuracy of less-accurately classified land-cover types. In the proposed approach, the markers are extracted from the classification maps obtained by MLP and Support Vector Machines (SVM) classifiers. Experimental results on Washington DC Mall hyperspectral dataset, demonstrate the superiority of proposed approach compared to the MLP and the original MHS algorithms. 1. INTRODUCTION Hyperspectral imagery has been widely investigated for land- cover classification due to its broad coverage of wavelength and high spectral sampling rate. Among the many studies that have been published on this topic, two main categories of techniques have been established: the spectral (i.e., pixel-based) techniques and the spectral-spatial (i.e., object-based) techniques. The pixel-based classification methods are often unable to accurately differentiate between some classes with high spectral similarity. This is mainly because they employ only the spectral information in order to identify different land-cover types. Consequently, methods that can exploit the spatial information are essential for more accurate classification results (Carleer and Wolff, 2006; Shackelford and Davis, 2003). Many researchers have demonstrated that the use of spectral-spatial information improves the classification results, compared to the use of spectral data alone, in hyperspectral imagery (Argüello and Heras, 2015; Blaschke et al., 2014; Fauvel et al., 2012; Huang and Zhang, 2011; Negri et al., 2014; Paneque-Gálvez et al., 2013; Tarabalka et al., 2010). In the early studies on these methods, the spectral information from the neighborhoods is extracted by either a fixed size window (Camps-Valls et al., 2006) or morphological profiles (Fauvel et al., 2008), and used for classifying and labeling of image pixels. Segmentation techniques are powerful means for defining the spatial dependencies among the pixels and for finding the homogeneous regions in an image (Gonzalez and Woods, 2002). Among the various methods of segmentation, the hierarchical segmentation method is state-of-the-art for hyperspectral image analysis (Tilton, 2003). It successfully integrates the spatial and spectral information in a two-step procedure. In the first step, the homogenous and distinct areas are segmented at their maximum details, and then, by grouping the spectrally similar but spatially disjointed regions, larger and more uniform objects are created. An alternative way in order to improve the accuracy of segmentation is performing a marker- based technique (Gonzalez and Woods, 2002; Soille, 2003). In this approach for each spatial object of the image, one or several pixels are selected as seed or marker. The selected markers then grow and create a unique region in the segmentation map. Marker-based segmentation considerably decreases the over- segmentation, and as a result, leads to more reliable accuracies (Soille, 2003). In (Tarabalka et al., 2011) an efficient approach was proposed for spectral-spatial classification using the Marker-based Hierarchical Segmentation (MHS) grown from automatically selected markers. It uses a pixel-wise SVM classification, in order to select pixels with the highest probability estimate to each class, as markers. In this framework, a connected components labeling is applied on the classification map. Then, if a region is large enough, its marker is determined as the P% of pixels within this region with the highest probability estimates. Otherwise, it should lead to a marker only if it is very reliable. A potential marker is formed by pixels with estimated probability higher than a defined threshold. The disadvantage of this approach is that the selection of the markers strongly depends on the performances of the selected pixel-wise classifier. In this paper, a modified spectral-spatial classification approach is proposed for improving the spectral-spatial classification of hyperspectral images. In the proposed approach, the MLP neural network pixel-based algorithm is, first, used to classify the hyperspectral images. Afterwards, for classes with low accuracy, the enhanced MHS spectral-spatial algorithm is used to improve their accuracies. In the enhanced MHS algorithm, for selecting markers, the outputs of SVM and MLP classifiers are combined using the estimated class probability for each pixel. That is, each pixel is labeled to its corresponding class with maximum probability estimation of two classifiers. Then, the most reliable labeled pixels are selected as the markers. This paper is organized as follows. Section 2 introduces our proposed methodology. The data sets, the experimental results, and discussions presented in Section 3. Conclusions drawn from the study are presented in Section 4. The International Archives of the Photogrammetry, Remote Sensing and Spatial Information Sciences, Volume XLII-2/W12, 2019 Int. Worksh. on “Photogrammetric & Computer Vision Techniques for Video Surveillance, Biometrics and Biomedicine”, 13–15 May 2019, Moscow, Russia This contribution has been peer-reviewed. https://doi.org/10.5194/isprs-archives-XLII-2-W12-1-2019 | © Authors 2019. CC BY 4.0 License. 1
Transcript of SPECTRAL-SPATIAL CLASSIFICATION OF HYPERSPECTRAL … · SPECTRAL-SPATIAL CLASSIFICATION OF...
SPECTRAL-SPATIAL CLASSIFICATION OF HYPERSPECTRAL IMAGERY USING
NEURAL NETWORK ALGORITHM AND HIERARCHICAL SEGMENTATION
D. Akbari a, M. Moradizadehb, M. Akbari c
a Department of Surveying and Geomatics Engineering, College of Engineering, University of Zabol, Zabol, Iran-
[email protected] b Department of Geomatics, Faculty of Civil and Transportation Engineering, University of Isfahan, Isfahan, Iran
c Department of Civil Engineering, College of Engineering, University of Birjand, Birjand, Iran
Commission II, WG II/5
KEY WORDS: Remote sensing, Hyperspectral image, neural network, Hierarchical segmentation, Marker selection
ABSTRACT:
This paper describes a new framework for classification of hyperspectral images, based on both spectral and spatial information. The
spatial information is obtained by an enhanced Marker-based Hierarchical Segmentation (MHS) algorithm. The hyperspectral data is
first fed into the Multi-Layer Perceptron (MLP) neural network classification algorithm. Then, the MHS algorithm is applied in order
to increase the accuracy of less-accurately classified land-cover types. In the proposed approach, the markers are extracted from the
classification maps obtained by MLP and Support Vector Machines (SVM) classifiers. Experimental results on Washington DC Mall
hyperspectral dataset, demonstrate the superiority of proposed approach compared to the MLP and the original MHS algorithms.
1. INTRODUCTION
Hyperspectral imagery has been widely investigated for land-
cover classification due to its broad coverage of wavelength and
high spectral sampling rate. Among the many studies that have
been published on this topic, two main categories of techniques
have been established: the spectral (i.e., pixel-based) techniques
and the spectral-spatial (i.e., object-based) techniques. The
pixel-based classification methods are often unable to
accurately differentiate between some classes with high spectral
similarity. This is mainly because they employ only the spectral
information in order to identify different land-cover types.
Consequently, methods that can exploit the spatial information
are essential for more accurate classification results (Carleer and
Wolff, 2006; Shackelford and Davis, 2003). Many researchers
have demonstrated that the use of spectral-spatial information
improves the classification results, compared to the use of
spectral data alone, in hyperspectral imagery (Argüello and
Heras, 2015; Blaschke et al., 2014; Fauvel et al., 2012; Huang
and Zhang, 2011; Negri et al., 2014; Paneque-Gálvez et al.,
2013; Tarabalka et al., 2010). In the early studies on these
methods, the spectral information from the neighborhoods is
extracted by either a fixed size window (Camps-Valls et al.,
2006) or morphological profiles (Fauvel et al., 2008), and used
for classifying and labeling of image pixels.
Segmentation techniques are powerful means for defining the
spatial dependencies among the pixels and for finding the
homogeneous regions in an image (Gonzalez and Woods,
2002). Among the various methods of segmentation, the
hierarchical segmentation method is state-of-the-art for
hyperspectral image analysis (Tilton, 2003). It successfully
integrates the spatial and spectral information in a two-step
procedure. In the first step, the homogenous and distinct areas
are segmented at their maximum details, and then, by grouping
the spectrally similar but spatially disjointed regions, larger and
more uniform objects are created. An alternative way in order to
improve the accuracy of segmentation is performing a marker-
based technique (Gonzalez and Woods, 2002; Soille, 2003). In
this approach for each spatial object of the image, one or several
pixels are selected as seed or marker. The selected markers then
grow and create a unique region in the segmentation map.
Marker-based segmentation considerably decreases the over-
segmentation, and as a result, leads to more reliable accuracies
(Soille, 2003).
In (Tarabalka et al., 2011) an efficient approach was proposed
for spectral-spatial classification using the Marker-based
Hierarchical Segmentation (MHS) grown from automatically
selected markers. It uses a pixel-wise SVM classification, in
order to select pixels with the highest probability estimate to
each class, as markers. In this framework, a connected
components labeling is applied on the classification map. Then,
if a region is large enough, its marker is determined as the P%
of pixels within this region with the highest probability
estimates. Otherwise, it should lead to a marker only if it is very
reliable. A potential marker is formed by pixels with estimated
probability higher than a defined threshold. The disadvantage of
this approach is that the selection of the markers strongly
depends on the performances of the selected pixel-wise
classifier.
In this paper, a modified spectral-spatial classification approach
is proposed for improving the spectral-spatial classification of
hyperspectral images. In the proposed approach, the MLP
neural network pixel-based algorithm is, first, used to classify
the hyperspectral images. Afterwards, for classes with low
accuracy, the enhanced MHS spectral-spatial algorithm is used
to improve their accuracies. In the enhanced MHS algorithm,
for selecting markers, the outputs of SVM and MLP classifiers
are combined using the estimated class probability for each
pixel. That is, each pixel is labeled to its corresponding class
with maximum probability estimation of two classifiers. Then,
the most reliable labeled pixels are selected as the markers. This
paper is organized as follows. Section 2 introduces our proposed
methodology. The data sets, the experimental results, and
discussions presented in Section 3. Conclusions drawn from the
study are presented in Section 4.
The International Archives of the Photogrammetry, Remote Sensing and Spatial Information Sciences, Volume XLII-2/W12, 2019 Int. Worksh. on “Photogrammetric & Computer Vision Techniques for Video Surveillance, Biometrics and Biomedicine”, 13–15 May 2019, Moscow, Russia
This contribution has been peer-reviewed. https://doi.org/10.5194/isprs-archives-XLII-2-W12-1-2019 | © Authors 2019. CC BY 4.0 License.
1
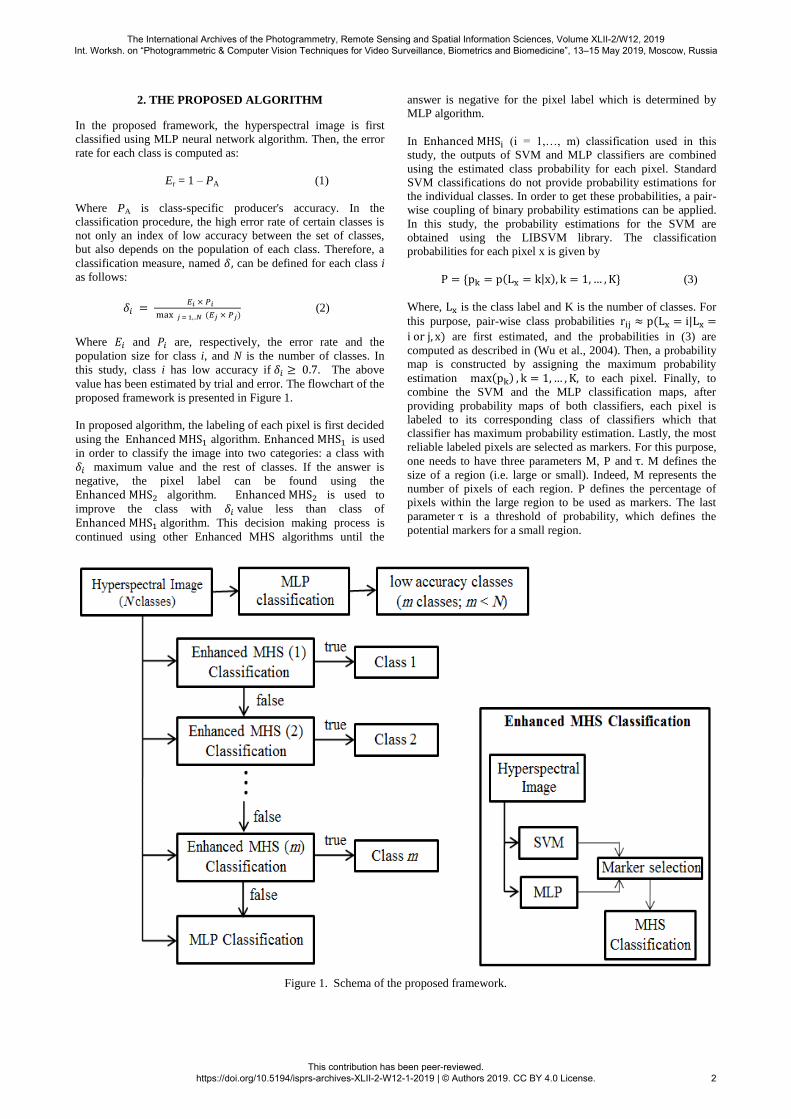
2. THE PROPOSED ALGORITHM
In the proposed framework, the hyperspectral image is first
classified using MLP neural network algorithm. Then, the error
rate for each class is computed as:
Er = 1 – PA (1)
Where PA is class-specific producer's accuracy. In the
classification procedure, the high error rate of certain classes is
not only an index of low accuracy between the set of classes,
but also depends on the population of each class. Therefore, a
classification measure, named can be defined for each class i
as follows:
(2)
Where and are, respectively, the error rate and the
population size for class i, and N is the number of classes. In
this study, class i has low accuracy if . The above
value has been estimated by trial and error. The flowchart of the
proposed framework is presented in Figure 1.
In proposed algorithm, the labeling of each pixel is first decided
using the algorithm. is used
in order to classify the image into two categories: a class with
maximum value and the rest of classes. If the answer is
negative, the pixel label can be found using the
algorithm. is used to
improve the class with value less than class of
algorithm. This decision making process is
continued using other Enhanced MHS algorithms until the
answer is negative for the pixel label which is determined by
MLP algorithm.
In (i = 1,…, m) classification used in this
study, the outputs of SVM and MLP classifiers are combined
using the estimated class probability for each pixel. Standard
SVM classifications do not provide probability estimations for
the individual classes. In order to get these probabilities, a pair-
wise coupling of binary probability estimations can be applied.
In this study, the probability estimations for the SVM are
obtained using the LIBSVM library. The classification
probabilities for each pixel x is given by
| (3)
Where, is the class label and K is the number of classes. For
this purpose, pair-wise class probabilities |
are first estimated, and the probabilities in (3) are
computed as described in (Wu et al., 2004). Then, a probability
map is constructed by assigning the maximum probability
estimation to each pixel. Finally, to
combine the SVM and the MLP classification maps, after
providing probability maps of both classifiers, each pixel is
labeled to its corresponding class of classifiers which that
classifier has maximum probability estimation. Lastly, the most
reliable labeled pixels are selected as markers. For this purpose,
one needs to have three parameters M, P and . M defines the
size of a region (i.e. large or small). Indeed, M represents the
number of pixels of each region. P defines the percentage of
pixels within the large region to be used as markers. The last
parameter is a threshold of probability, which defines the
potential markers for a small region.
Figure 1. Schema of the proposed framework.
The International Archives of the Photogrammetry, Remote Sensing and Spatial Information Sciences, Volume XLII-2/W12, 2019 Int. Worksh. on “Photogrammetric & Computer Vision Techniques for Video Surveillance, Biometrics and Biomedicine”, 13–15 May 2019, Moscow, Russia
This contribution has been peer-reviewed. https://doi.org/10.5194/isprs-archives-XLII-2-W12-1-2019 | © Authors 2019. CC BY 4.0 License.
2
3. EXPERIMENTAL RESULTS AND DISCUSSIONS
3.1. Hyperspectral Data
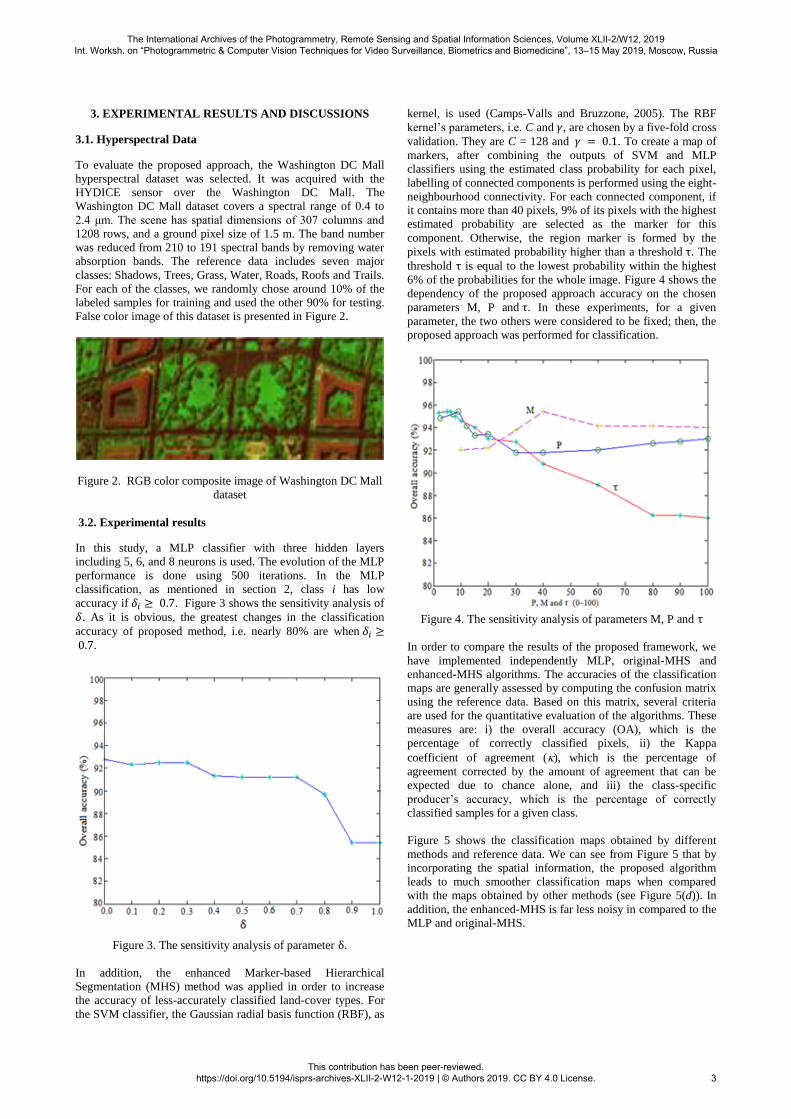
To evaluate the proposed approach, the Washington DC Mall
hyperspectral dataset was selected. It was acquired with the
HYDICE sensor over the Washington DC Mall. The
Washington DC Mall dataset covers a spectral range of 0.4 to
2.4 μm. The scene has spatial dimensions of 307 columns and
1208 rows, and a ground pixel size of 1.5 m. The band number
was reduced from 210 to 191 spectral bands by removing water
absorption bands. The reference data includes seven major
classes: Shadows, Trees, Grass, Water, Roads, Roofs and Trails.
For each of the classes, we randomly chose around 10% of the
labeled samples for training and used the other 90% for testing.
False color image of this dataset is presented in Figure 2.
Figure 2. RGB color composite image of Washington DC Mall
dataset
3.2. Experimental results
In this study, a MLP classifier with three hidden layers
including 5, 6, and 8 neurons is used. The evolution of the MLP
performance is done using 500 iterations. In the MLP
classification, as mentioned in section 2, class i has low
accuracy if . Figure 3 shows the sensitivity analysis of
. As it is obvious, the greatest changes in the classification
accuracy of proposed method, i.e. nearly 80% are when .
Figure 3. The sensitivity analysis of parameter .
In addition, the enhanced Marker-based Hierarchical
Segmentation (MHS) method was applied in order to increase
the accuracy of less-accurately classified land-cover types. For
the SVM classifier, the Gaussian radial basis function (RBF), as
kernel, is used (Camps-Valls and Bruzzone, 2005). The RBF
kernel’s parameters, i.e. C and , are chosen by a five-fold cross
validation. They are C = 128 and . To create a map of
markers, after combining the outputs of SVM and MLP
classifiers using the estimated class probability for each pixel,
labelling of connected components is performed using the eight-
neighbourhood connectivity. For each connected component, if
it contains more than 40 pixels, 9% of its pixels with the highest
estimated probability are selected as the marker for this
component. Otherwise, the region marker is formed by the
pixels with estimated probability higher than a threshold . The
threshold is equal to the lowest probability within the highest
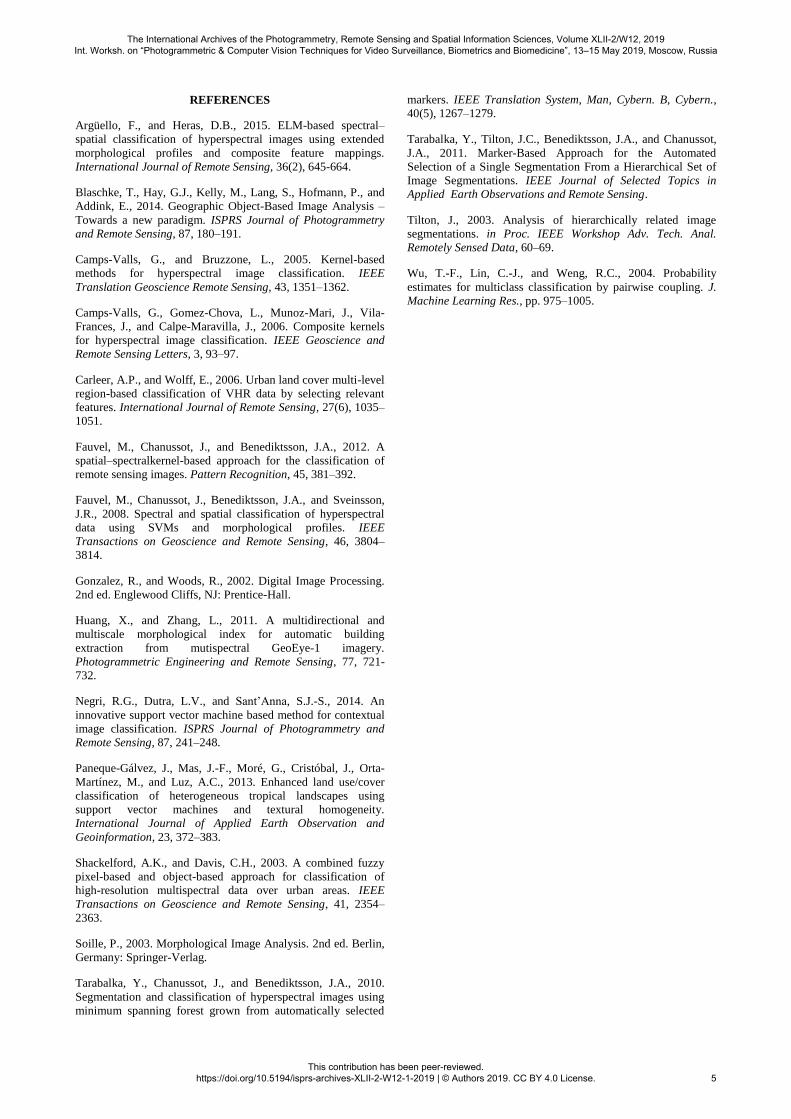
6% of the probabilities for the whole image. Figure 4 shows the
dependency of the proposed approach accuracy on the chosen
parameters M, P and . In these experiments, for a given
parameter, the two others were considered to be fixed; then, the
proposed approach was performed for classification.
Figure 4. The sensitivity analysis of parameters M, P and
In order to compare the results of the proposed framework, we
have implemented independently MLP, original-MHS and
enhanced-MHS algorithms. The accuracies of the classification
maps are generally assessed by computing the confusion matrix
using the reference data. Based on this matrix, several criteria
are used for the quantitative evaluation of the algorithms. These
measures are: i) the overall accuracy (OA), which is the
percentage of correctly classified pixels, ii) the Kappa
coefficient of agreement (), which is the percentage of
agreement corrected by the amount of agreement that can be
expected due to chance alone, and iii) the class-specific
producer’s accuracy, which is the percentage of correctly
classified samples for a given class.
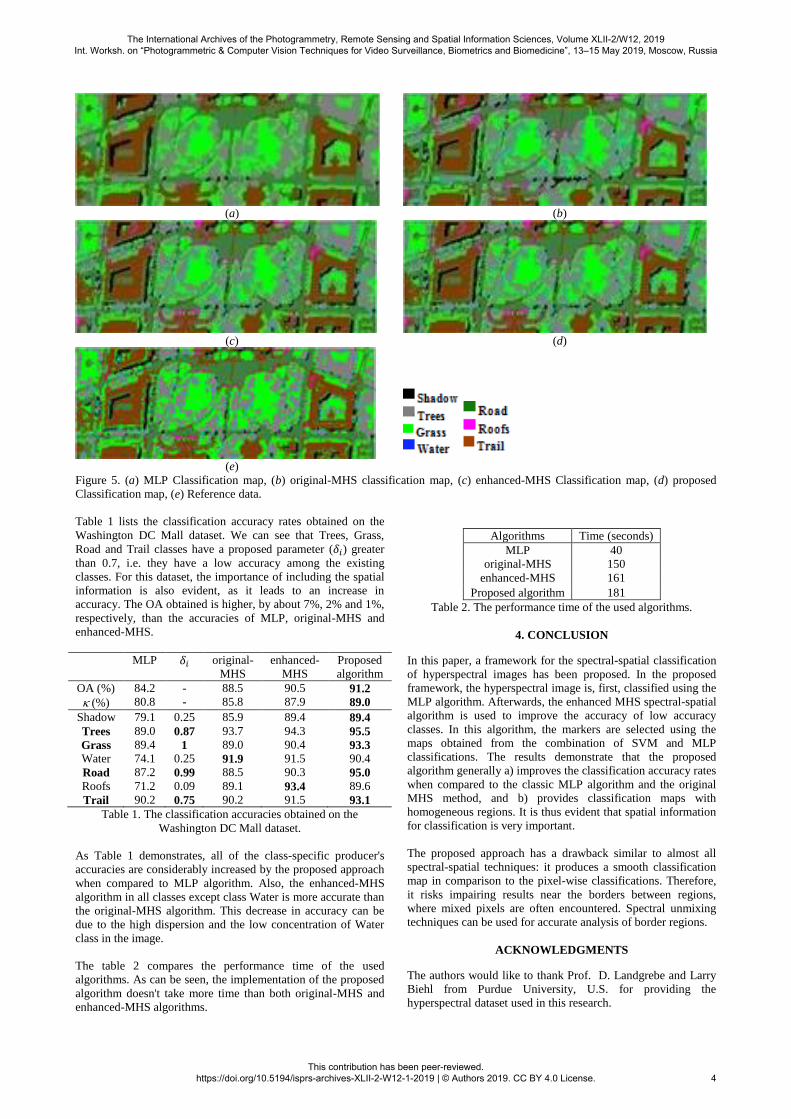
Figure 5 shows the classification maps obtained by different
methods and reference data. We can see from Figure 5 that by
incorporating the spatial information, the proposed algorithm
leads to much smoother classification maps when compared
with the maps obtained by other methods (see Figure 5(d)). In
addition, the enhanced-MHS is far less noisy in compared to the
MLP and original-MHS.
The International Archives of the Photogrammetry, Remote Sensing and Spatial Information Sciences, Volume XLII-2/W12, 2019 Int. Worksh. on “Photogrammetric & Computer Vision Techniques for Video Surveillance, Biometrics and Biomedicine”, 13–15 May 2019, Moscow, Russia
This contribution has been peer-reviewed. https://doi.org/10.5194/isprs-archives-XLII-2-W12-1-2019 | © Authors 2019. CC BY 4.0 License.
3
(a) (b)
(c) (d)
(e)
Figure 5. (a) MLP Classification map, (b) original-MHS classification map, (c) enhanced-MHS Classification map, (d) proposed
Classification map, (e) Reference data.
Table 1 lists the classification accuracy rates obtained on the
Washington DC Mall dataset. We can see that Trees, Grass,
Road and Trail classes have a proposed parameter ( ) greater
than 0.7, i.e. they have a low accuracy among the existing
classes. For this dataset, the importance of including the spatial
information is also evident, as it leads to an increase in
accuracy. The OA obtained is higher, by about 7%, 2% and 1%,
respectively, than the accuracies of MLP, original-MHS and
enhanced-MHS.
MLP original-
MHS
enhanced-
MHS
Proposed
algorithm
OA (%) 84.2 - 88.5 90.5 91.2
(%) 80.8 - 85.8 87.9 89.0
Shadow 79.1 0.25 85.9 89.4 89.4
Trees 89.0 0.87 93.7 94.3 95.5
Grass 89.4 1 89.0 90.4 93.3
Water 74.1 0.25 91.9 91.5 90.4
Road 87.2 0.99 88.5 90.3 95.0
Roofs 71.2 0.09 89.1 93.4 89.6
Trail 90.2 0.75 90.2 91.5 93.1
Table 1. The classification accuracies obtained on the
Washington DC Mall dataset.
As Table 1 demonstrates, all of the class-specific producer's
accuracies are considerably increased by the proposed approach
when compared to MLP algorithm. Also, the enhanced-MHS
algorithm in all classes except class Water is more accurate than
the original-MHS algorithm. This decrease in accuracy can be
due to the high dispersion and the low concentration of Water
class in the image.
The table 2 compares the performance time of the used
algorithms. As can be seen, the implementation of the proposed
algorithm doesn't take more time than both original-MHS and
enhanced-MHS algorithms.
Algorithms Time (seconds)
MLP 40
original-MHS 150
enhanced-MHS 161
Proposed algorithm 181
Table 2. The performance time of the used algorithms.
4. CONCLUSION
In this paper, a framework for the spectral-spatial classification
of hyperspectral images has been proposed. In the proposed
framework, the hyperspectral image is, first, classified using the
MLP algorithm. Afterwards, the enhanced MHS spectral-spatial
algorithm is used to improve the accuracy of low accuracy
classes. In this algorithm, the markers are selected using the
maps obtained from the combination of SVM and MLP
classifications. The results demonstrate that the proposed
algorithm generally a) improves the classification accuracy rates
when compared to the classic MLP algorithm and the original
MHS method, and b) provides classification maps with
homogeneous regions. It is thus evident that spatial information
for classification is very important.
The proposed approach has a drawback similar to almost all
spectral-spatial techniques: it produces a smooth classification
map in comparison to the pixel-wise classifications. Therefore,
it risks impairing results near the borders between regions,
where mixed pixels are often encountered. Spectral unmixing
techniques can be used for accurate analysis of border regions.
ACKNOWLEDGMENTS
The authors would like to thank Prof. D. Landgrebe and Larry
Biehl from Purdue University, U.S. for providing the
hyperspectral dataset used in this research.
The International Archives of the Photogrammetry, Remote Sensing and Spatial Information Sciences, Volume XLII-2/W12, 2019 Int. Worksh. on “Photogrammetric & Computer Vision Techniques for Video Surveillance, Biometrics and Biomedicine”, 13–15 May 2019, Moscow, Russia
This contribution has been peer-reviewed. https://doi.org/10.5194/isprs-archives-XLII-2-W12-1-2019 | © Authors 2019. CC BY 4.0 License.
4
REFERENCES
Argüello, F., and Heras, D.B., 2015. ELM-based spectral–
spatial classification of hyperspectral images using extended
morphological profiles and composite feature mappings.
International Journal of Remote Sensing, 36(2), 645-664.
Blaschke, T., Hay, G.J., Kelly, M., Lang, S., Hofmann, P., and
Addink, E., 2014. Geographic Object-Based Image Analysis –
Towards a new paradigm. ISPRS Journal of Photogrammetry
and Remote Sensing, 87, 180–191.
Camps-Valls, G., and Bruzzone, L., 2005. Kernel-based
methods for hyperspectral image classification. IEEE
Translation Geoscience Remote Sensing, 43, 1351–1362.
Camps-Valls, G., Gomez-Chova, L., Munoz-Mari, J., Vila-
Frances, J., and Calpe-Maravilla, J., 2006. Composite kernels
for hyperspectral image classification. IEEE Geoscience and
Remote Sensing Letters, 3, 93–97.
Carleer, A.P., and Wolff, E., 2006. Urban land cover multi-level
region-based classification of VHR data by selecting relevant
features. International Journal of Remote Sensing, 27(6), 1035–
1051.
Fauvel, M., Chanussot, J., and Benediktsson, J.A., 2012. A
spatial–spectralkernel-based approach for the classification of
remote sensing images. Pattern Recognition, 45, 381–392.
Fauvel, M., Chanussot, J., Benediktsson, J.A., and Sveinsson,
J.R., 2008. Spectral and spatial classification of hyperspectral
data using SVMs and morphological profiles. IEEE
Transactions on Geoscience and Remote Sensing, 46, 3804–
3814.
Gonzalez, R., and Woods, R., 2002. Digital Image Processing.
2nd ed. Englewood Cliffs, NJ: Prentice-Hall.
Huang, X., and Zhang, L., 2011. A multidirectional and
multiscale morphological index for automatic building
extraction from mutispectral GeoEye-1 imagery.
Photogrammetric Engineering and Remote Sensing, 77, 721-
732.
Negri, R.G., Dutra, L.V., and Sant’Anna, S.J.-S., 2014. An
innovative support vector machine based method for contextual
image classification. ISPRS Journal of Photogrammetry and
Remote Sensing, 87, 241–248.
Paneque-Gálvez, J., Mas, J.-F., Moré, G., Cristóbal, J., Orta-
Martínez, M., and Luz, A.C., 2013. Enhanced land use/cover
classification of heterogeneous tropical landscapes using
support vector machines and textural homogeneity.
International Journal of Applied Earth Observation and
Geoinformation, 23, 372–383.
Shackelford, A.K., and Davis, C.H., 2003. A combined fuzzy
pixel-based and object-based approach for classification of
high-resolution multispectral data over urban areas. IEEE
Transactions on Geoscience and Remote Sensing, 41, 2354–
2363.
Soille, P., 2003. Morphological Image Analysis. 2nd ed. Berlin,
Germany: Springer-Verlag.
Tarabalka, Y., Chanussot, J., and Benediktsson, J.A., 2010.
Segmentation and classification of hyperspectral images using
minimum spanning forest grown from automatically selected
markers. IEEE Translation System, Man, Cybern. B, Cybern.,
40(5), 1267–1279.
Tarabalka, Y., Tilton, J.C., Benediktsson, J.A., and Chanussot,
J.A., 2011. Marker-Based Approach for the Automated
Selection of a Single Segmentation From a Hierarchical Set of
Image Segmentations. IEEE Journal of Selected Topics in
Applied Earth Observations and Remote Sensing.
Tilton, J., 2003. Analysis of hierarchically related image
segmentations. in Proc. IEEE Workshop Adv. Tech. Anal.
Remotely Sensed Data, 60–69.
Wu, T.-F., Lin, C.-J., and Weng, R.C., 2004. Probability
estimates for multiclass classification by pairwise coupling. J.
Machine Learning Res., pp. 975–1005.
The International Archives of the Photogrammetry, Remote Sensing and Spatial Information Sciences, Volume XLII-2/W12, 2019 Int. Worksh. on “Photogrammetric & Computer Vision Techniques for Video Surveillance, Biometrics and Biomedicine”, 13–15 May 2019, Moscow, Russia
This contribution has been peer-reviewed. https://doi.org/10.5194/isprs-archives-XLII-2-W12-1-2019 | © Authors 2019. CC BY 4.0 License.
5