SOYABEAN - Minister of Agriculture, Forestry and Fisheries · SOYABEAN MARKET VALUE CHAIN PROFILE...
23
SOYABEAN MARKET VALUE CHAIN PROFILE 2010-2011 SOYABEAN
Transcript of SOYABEAN - Minister of Agriculture, Forestry and Fisheries · SOYABEAN MARKET VALUE CHAIN PROFILE...

SOYABEANMARKET VALUE CHAIN PROFILE 2010-2011
SOYABEAN

1. DESCRIPTION OF THE INDUSTRY
Recently, there is a growing interest in soy bean products in South Africa because of the health benefits associated with these products. Soybean consumption in the country is estimated at 25% for oil and oilcake, 60% for animal feed (especially in the broiler and egg industries) and 20% for human consumption. Soy oil (18% of the seed) is processed to specific oil products for use in the food industry. Soy bean products also have very specific advantages such as the lowering of cholesterol and combating of heart diseases. Soybeans also serve as valuable source of proteins for vegetarians.
Figure 1: Soybeans Gross Value of Agricultural Production
0
200000
400000
600000
800000
1000000
1200000
1400000
1600000
1800000
2000
2001
2002
2003
2004
2005
2006
2007
2008
2009
Marketing Years
Gro
ss V
alue
(R'0
00)
Source: Agricultural Statistics
The contribution of the soybean industry to the Gross value of agricultural production corresponds to the trends in the area planted and total production of soybeans. The industry’s contribution to the gross value of agricultural production was at very lower levels during 2000 season, which increased steadily until 2002 season. This was followed by considerable fluctuations from 2003 until the gross value of agricultural production reached its maximum in during 2009season. The observed fluctuation in Soya beans GVP was as a result of inconsistencies in both production volumes and prices of soya beans over the period under analysis.
1.1 PRODUCTION AREAS
The Mpumalanga province produces the greatest quantities of soybeans in three districts namely, Gert Sibande, Nkangala and Mankaligwa in the towns of Middleburg, Delmas, Ermelo and Secunda. It is followed by the Free State province, the Thabo Mofutsanyane district around the towns of Bethlehem, Witsieshoek and Harrismith serve as the main producing areas in the Free State Province. In KwaZulu-Natal Province most soya bean productions occur the Umgungundlovu and Izingolweni districts around the towns of Pietermaritzburg, Ezingolweni and Mooi River, while three districts in the North West province namely, Central district, Southern District and the Bojanala district are the major producers of this crop around the towns of Mafikeng, Delareyville, Lichtenburg, Zeerust, Potchefstroom (Tlokwe), Ventersdorp, Klerksdorp (Matlosana), Rustenburg, Moretele, Koster and Brits. In the Gauteng province, Germiston in Ekurhuleni district, Randfontein in Sedibeng district and Vereeniging in the West Rand are the main producing areas. Small quantities of soybeans are
181SOYABEAN MARKET VALUE CHAIN PROFILE 2010-2011

also produced in the Western Cape, Eastern Cape and Northern Cape provinces. The contribution of various provinces to the total Soya beans production is depicted in Figure 2.
Figure 2 : Soybean Production by province 2009
Free State19%
Kw azulu-Natal15%
Limpopo9%
Mpumalanga51%
North-West4%
Gauteng2%
Eastern Cape0%
Northern Cape0%
Eastern Cape Northern Cape Free State Kw azulu-Natal Limpopo Mpumalanga Gauteng North-West
Source: Agricultural Statistics
Table 1: Soybean production by provinces
PROVINCEProduction (tons) 2005
Production (tons) 2006
Production (tons) 2007
Production (tons) 2008
Production (tons) 2009
Western Cape 420 70 0 0 0
Eastern Cape 800 750 1000 750 1600
Northern Cape 300 1500 1500 1750 2 250
Free State 30000 77000 33750 64500 99 000
Kwazulu-Natal 39270 62500 45100 44000 75 600
Limpopo 27 360 34 450 25 000 22 500 44 000
Mpumalanga 136650 210000 76500 128 000 262 500
Gauteng 9200 10730 4150 5500 12 520
North West 28500 27000 18000 28200 18 530
Source: Agricultural Statistics
During the past five years the Mpumalanga Province has been the top producer of soybeans followed by the Free State, Kwazulu-Natal, Limpopo and North-West provinces. The Western and Eastern Cape provinces of South Africa have been the lowest producers of soybeans with the Western Cape Province going out of production of this crop between 2007 and 2009 production seasons. On average, Table 1 shows an increasing trend in the production of soybeans in the major producing regions of the country. Production volumes in Mpumalanga Province increased by about
182 SOYABEAN MARKET VALUE CHAIN PROFILE 2010-2011

105% between the years 2008 and 2009. Over the same period, production in Free State and KZN Provinces increased by about 53% and 71% respectively.
1.2 PRODUCTION TRENDS
Soybean production in the Republic of South Africa on average ranges between 400 000 and 450 000 tons per annum at an average yield of 1.7 to 2 tons per hectare under dry land conditions. As shown in Figure 3 and Table 2, the area planted to soy beans has shown some fluctuations since 1998/99 to 2007/08 with increases in hectares planted between 2000 and 2002 and a sharp decrease during 2000/2001 due to unfavorable weather conditions. The production volumes have also been fluctuating in response to changes in the area planted to soy beans. During 2005/06 production season soya beans production increased significantly mainly as a result of a massive increment in area planted.
Figure 3: Soyabean Area Planted and Total Production
0
50000
100000
150000
200000
250000
300000
1999/002000/'01
2001/'022002/'03
2003/042004/05
2005/'062006/'07
2007/082008/09
Production Years
Are
a P
lant
ed (H
a)
0
100000
200000
300000
400000
500000
600000
Pro
duct
ion
Vol
ume
(Ton
s)Area Planted (ha) Total Production (tons)
Source: Agricultural Statistics
The period under analysis was characterized by fluctuations in production volumes as indicated in Figure 3. The period opened with lower production volumes during 1999/00 season followed by slight increase in production volumes in 2001. The highest production volumes were experienced during 2008/09 season mainly as a result of increased plantings in major producing provinces as well as improved yields. The production volumes for 2008/09 season are about 83% higher than the volumes harvested during the preceding season and about 200% higher than volumes produced during 1999/2000 season.
183SOYABEAN MARKET VALUE CHAIN PROFILE 2010-2011
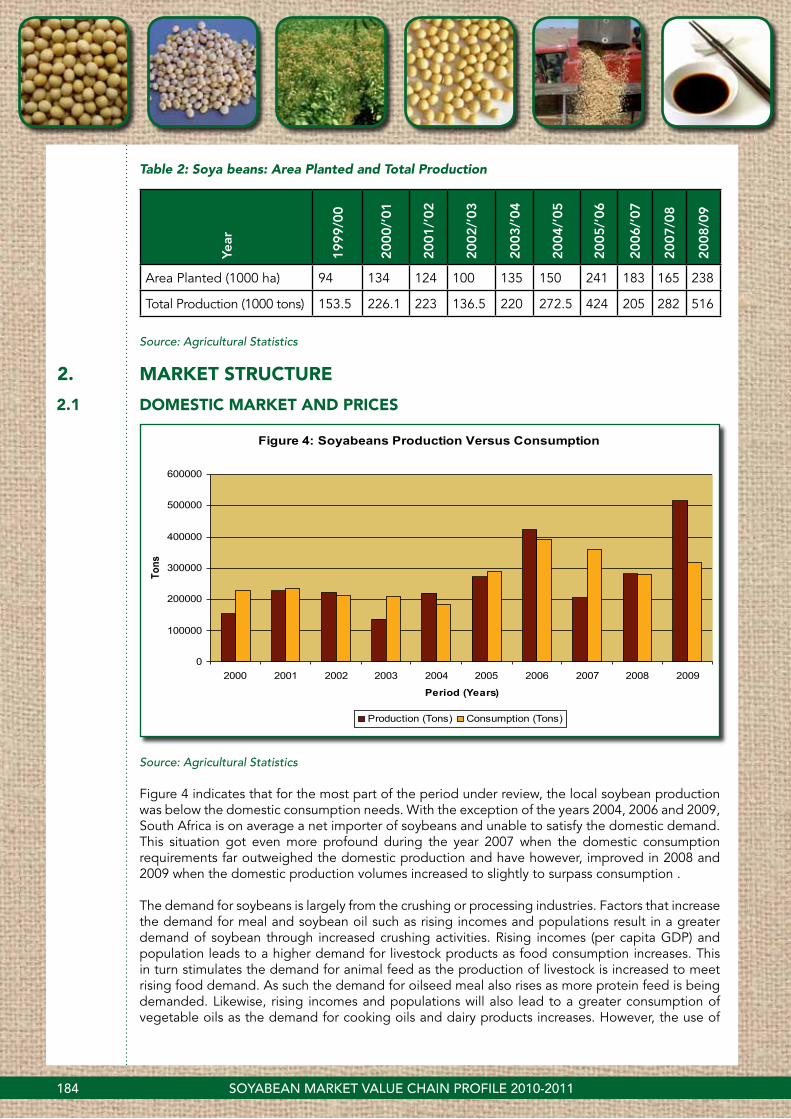
Table 2: Soya beans: Area Planted and Total Production
Year
1999/0
0
2000/’
01
2001/’
02
2002/’
03
2003/’
04
2004/’
05
2005/’
06
2006/’
07
2007/0
8
2008/0
9
Area Planted (1000 ha) 94 134 124 100 135 150 241 183 165 238
Total Production (1000 tons) 153.5 226.1 223 136.5 220 272.5 424 205 282 516
Source: Agricultural Statistics
2. MARKET STRUCTURE
2.1 DOMESTIC MARKET AND PRICES
Figure 4: Soyabeans Production Versus Consumption
0
100000
200000
300000
400000
500000
600000
2000 2001 2002 2003 2004 2005 2006 2007 2008 2009
Period (Years)
Tons
Production (Tons) Consumption (Tons)
Source: Agricultural Statistics
Figure 4 indicates that for the most part of the period under review, the local soybean production was below the domestic consumption needs. With the exception of the years 2004, 2006 and 2009, South Africa is on average a net importer of soybeans and unable to satisfy the domestic demand. This situation got even more profound during the year 2007 when the domestic consumption requirements far outweighed the domestic production and have however, improved in 2008 and 2009 when the domestic production volumes increased to slightly to surpass consumption .
The demand for soybeans is largely from the crushing or processing industries. Factors that increase the demand for meal and soybean oil such as rising incomes and populations result in a greater demand of soybean through increased crushing activities. Rising incomes (per capita GDP) and population leads to a higher demand for livestock products as food consumption increases. This in turn stimulates the demand for animal feed as the production of livestock is increased to meet rising food demand. As such the demand for oilseed meal also rises as more protein feed is being demanded. Likewise, rising incomes and populations will also lead to a greater consumption of vegetable oils as the demand for cooking oils and dairy products increases. However, the use of
184 SOYABEAN MARKET VALUE CHAIN PROFILE 2010-2011

soybean oil in cooking and other food preparation activities is relatively lower than for other oils from other oilseeds namely, canola and sunflower.
Domestically, soy beans are sold to expressers who produce oil and oilcake, animal feed and as seeds. They are also sold directly to consumers for the edible market. Table 3 below shows the annual soy bean harvest in South Africa, the value of the crop and the producer prices since the year 2000. The table shows a significant decrease in the producer price of soy beans since the year 2004 but with a significant increase between 2006 and 2008.
Table 3: Annual Soy bean harvest in South Africa
Year Tons Value R’000 Rand per Ton% Change in Rand per
Ton p.a.
2000 153 500 197 330 1 285.54
2001 226 100 280 938 1 242.54 -3.3%
2002 223 000 448 442 2 010.95 61.8%
2003 136 500 339 497 2 487.16 23.7%
2004 220 010 469 664 2 134.74 -14.2%
2005 272 500 315 397 1 157.42 -45.8%
2006 424 000 611 857 1 443.06 24.7%
2007 205 000 529 910 2 584.93 79.1%
2008 282000 1 134 293 4 026.26 55.76%
2009 516000 1 644 700 3 187.40 -20.83
Source: Agricultural Statistics
Domestic sales of soy beans as shown in Figure 5 indicate that since the year 2000 the greatest quantities of soy beans were sold as seed and animal feed while the quantities of soybeans sold to expressers for oil extraction declined substantially between the year 2000 and 2004. Sales of soybeans to expressers then increased substantially between 2006 and 2008 followed by a slight decline in 2009. During the period under review the volume of soybeans used for human consumption has remained relatively stable far below 50 thousand tons per annum. The quantities used for animal feed manufacturing declined dramatically between the years 2007 until 2008 followed by an increase in 2009.
185SOYABEAN MARKET VALUE CHAIN PROFILE 2010-2011

Figure 5 : Local sales for Soyabeans
0
50000
100000
150000
200000
250000
2000
2001
2002
2003
2004
2005
2006
2007
2008
2009
Marketing Year
Sale
s (to
ns)
Oil & Oilcake (tons) Human Consumption (tons) Seed & Feed (tons)
Source: Agricultural Statistics
The local producer price for soy beans has been relatively stable between 2000 and 2001 and increased to higher levels during the year 2003 and then declined to the lowest level 2005 (R1 274.47/ton). The average local producer price of soy beans for 2006 increased to approximately R1 443.06/ton and continued to increase until a peak was reached in 2008 (R4000/ton). The producer price for soya bean declined by about 20.83% during the year 2009 compared to 2008, mainly as a result of increased local production volumes.
Figure 6 : Soyabean Producer Prices
0
500
1000
1500
2000
2500
3000
3500
4000
4500
2000 2001 2002 2003 2004 2005 2006 2007 2008 2009
Marketing Years
Rand
s/To
n
Source: Agricultural Statistics
The main influences on local soy bean prices include the rate of increase in South American soy bean production, the Chinese demand for imported soy beans, marine freight rates, the strengthening of the rand/dollar exchange rate and the spread of genetically modified cultivars in the main production areas which could increase yields and help stabilize prices.
186 SOYABEAN MARKET VALUE CHAIN PROFILE 2010-2011

2.2 ExPORTS AND IMPORTS ANALYSIS
The South African soybean industry is not competitive when it comes to exports. As shown in Figure 7, exports of soybeans from South Africa over the ten year period starting from 2000 have been very insignificant.
Figure 7: Soybean local sales versus Exports
0
50000
100000
150000
200000
250000
300000
350000
400000
2000 2001 2002 2003 2004 2005 2006 2007 2008 2009
Market Years
Tons
Total Sales (tons) Exports (tons)
Source: Agricultural Statistics
In volume terms soybean exports to various regions of the world have been far below 50 thousand tons during the entire period under review, as compared to the volume of soybeans sold on the domestic market as shown in Figure 7. Soya bean exports increased significantly during the year 2009 mainly due to increased local production volumes. Sales of soybeans in the domestic market follow a similar trend to that of the total production, having reached the lowest level during 2004 and thereafter increased substantially until 2007. Local sales of soya beans declined slightly into the year 2008, following a huge increase in local producer prices. Table 4 provides estimates of the most recent import and export soybean market volumes and values in South Africa up to 2009.
187SOYABEAN MARKET VALUE CHAIN PROFILE 2010-2011

Table 4: Soybean Imports and Exports
YearTotal Soybean Import Market Total Soybean Export Market
Trade BalanceTons Value (R’000) Tons Value (R’000)
2000 599 435 774 023 2 800 31 492 -742 531
2001 623 707 986 009 1 400 81 888 -904 121
2002 564 554 1 219 063 1 200 64 424 -1 154 639
2003 480 417 857 160 5 100 67 565 -789 595
2004 688 341 1 282 445 2 200 70 712 -1 211 733
2005 621 406 992 174 8 400 76 747 -915 427
2006 10 433 16 608 1 200 2029 -14 579
2007 143 873 228 701 1 200 2031 -226 670
2008 17 986 38 103 5 813 29 997 -8 106
2009 1 495 4 328 161 620 570 246 565 918
Source: Quantec Easy Data & Agricultural Statistics
As indicated in the above table, the South African soybean industry has a negative trade balance which implies that we import to supplement domestic production. South African soybean exports are therefore not competitive in world terms. However, the opposite was experienced in 2009 when soya bean exports rose above imports mainly as a result of improved local soya bean production. The most quantities of soybean exports as depicted in Figure 8 originate mainly from three provinces namely, Gauteng, Western Cape, Kwazulu-Natal, and intermittently from North West and Mpumalanga provinces. The Gauteng province commanded the greatest share of soybean exports between the years 2000 and 2009 followed by KwaZulu-Natal and the Western Cape provinces. It thus appears that most of the soybean is exported from the Gauteng in spite of the fact that Mpumalanga is the top producer of soybeans in the country. This is attributable to the presence of exporters, processors and favorable agro-logistics in the Gauteng province.
Figure 8: Value of Soya-Bean Exports by Province
0
50000000
100000000
150000000
200000000
250000000
300000000
350000000
400000000
450000000
2000 2001 2002 2003 2004 2005 2006 2007 2008 2009
Period (years)
Expo
rt Va
lue
(Ran
ds)
Western Cape Kwazulu-Natal North West Gauteng Mpumalanga Source: Quantec Easy Data
188 SOYABEAN MARKET VALUE CHAIN PROFILE 2010-2011
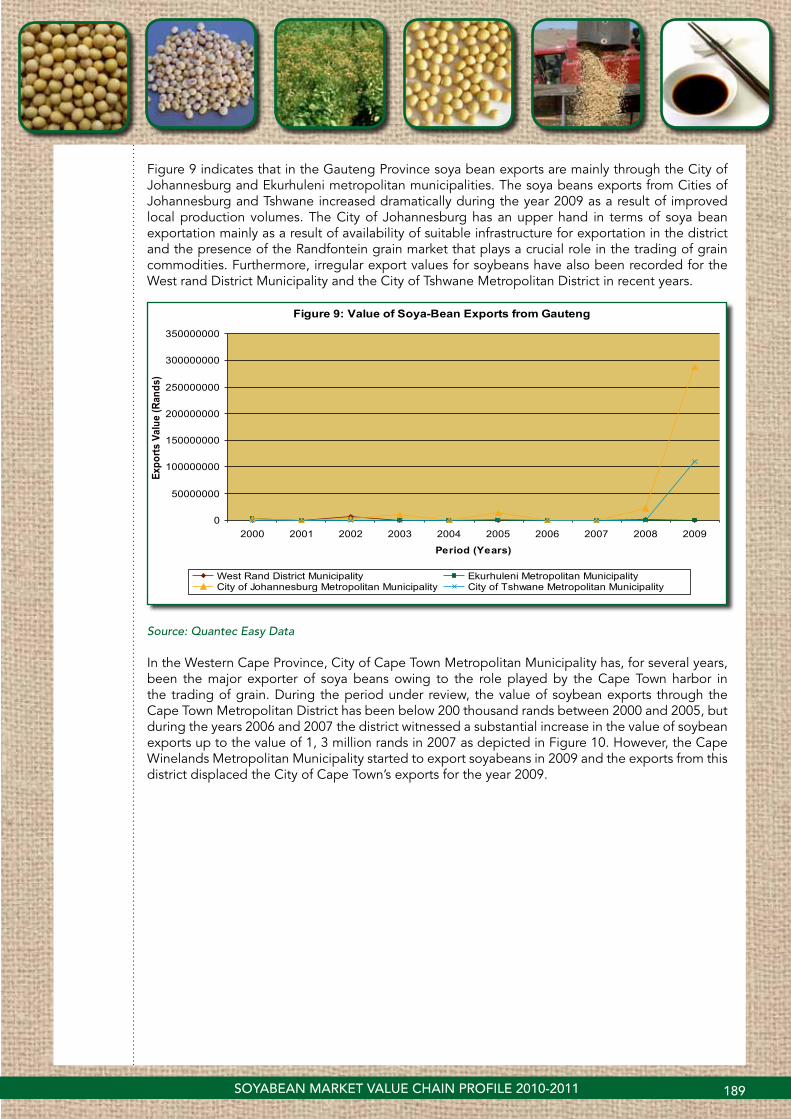
Figure 9 indicates that in the Gauteng Province soya bean exports are mainly through the City of Johannesburg and Ekurhuleni metropolitan municipalities. The soya beans exports from Cities of Johannesburg and Tshwane increased dramatically during the year 2009 as a result of improved local production volumes. The City of Johannesburg has an upper hand in terms of soya bean exportation mainly as a result of availability of suitable infrastructure for exportation in the district and the presence of the Randfontein grain market that plays a crucial role in the trading of grain commodities. Furthermore, irregular export values for soybeans have also been recorded for the West rand District Municipality and the City of Tshwane Metropolitan District in recent years.
Figure 9: Value of Soya-Bean Exports from Gauteng
0
50000000
100000000
150000000
200000000
250000000
300000000
350000000
2000 2001 2002 2003 2004 2005 2006 2007 2008 2009
Period (Years)
Expo
rts V
alue
(Ran
ds)
West Rand District Municipality Ekurhuleni Metropolitan MunicipalityCity of Johannesburg Metropolitan Municipality City of Tshwane Metropolitan Municipality
Source: Quantec Easy Data In the Western Cape Province, City of Cape Town Metropolitan Municipality has, for several years, been the major exporter of soya beans owing to the role played by the Cape Town harbor in the trading of grain. During the period under review, the value of soybean exports through the Cape Town Metropolitan District has been below 200 thousand rands between 2000 and 2005, but during the years 2006 and 2007 the district witnessed a substantial increase in the value of soybean exports up to the value of 1, 3 million rands in 2007 as depicted in Figure 10. However, the Cape Winelands Metropolitan Municipality started to export soyabeans in 2009 and the exports from this district displaced the City of Cape Town’s exports for the year 2009.
189SOYABEAN MARKET VALUE CHAIN PROFILE 2010-2011

Figure 10: Value of Soya-Bean Exports from the Western Cape Province
0
2000000
4000000
6000000
8000000
10000000
12000000
14000000
16000000
18000000
2000 2001 2002 2003 2004 2005 2006 2007 2008 2009
Period (years)
Expo
rts V
alue
(Ran
ds)
City of Cape Town Metropolitan Municipality Cape Winelands
Source: Quantec Easy Data
Figure 11: Value of Soya-Bean Exports from Kwazulu-Natal Province
0
1000000
2000000
3000000
4000000
5000000
6000000
7000000
8000000
9000000
2000 2001 2002 2003 2004 2005 2006 2007 2008 2009
Period (Years)
Expo
rt Va
lue
(Ran
ds)
Umzinyathi District municipality eThekwini Metropolitan Municipality Source: Quantec Easy Data
Figure 11 indicates that from KwaZulu-Natal Province, Soybeans are exported mainly through the UMzinyathi District and the EThekwini Metropolitan Municipality. This province’s export capacity is enhanced by the presence of the Durban harbor through which Soybean can be traded. The value of soybean exports from the UMzinyathi district began in 2001 and reached a peak in 2002 and then declined substantially until 2007. Menial exports of soybeans also occurred intermittedly through the eThekwini Metropolitan Municipality during the period under review, with the most being exported from eThekwini in 2009.
The quantity of soybeans produced in South Africa is basically less than the demand and our country is a net importer as far as soybeans are concerned. This also becomes evident when one looks at the previous figures (Figures 8 to 10) since they indicate that only few provinces in South Africa are
190 SOYABEAN MARKET VALUE CHAIN PROFILE 2010-2011

the exporters of soybeans, and that only few districts within the exporting Provinces participate in the export market and furthermore only fractional amounts are exported from each district.
Figure 12: Volume of Soya Beans Imports from Various Regions
0
20000
40000
60000
80000
100000
120000
2000 2001 2002 2003 2004 2005 2006 2007 2008 2009
Period (Years)
Impo
rt Vo
lum
e (To
ns)
Africa Americas Asia Europe Oceania
Source: Quantec Easy Data
As mentioned earlier on that South Africa is a net importer of soybeans; this product was imported from the SADC region, the Americas, Asia, Europe and some countries in Oceania as depicted in Figure 12. The trend in Figure 12 indicates that the volume of soybean imports from the Americas has been greater than those from the rest of the other continents and this became even more profound during the year 2007. This is mainly due to the fact that the biggest producers of soybeans such as USA, Argentina and Brazil are located in the Americas. Very menial values of soybean imports have been recorded from Asian and European countries during the period under review.
Figure 13: Volume of Soya Beans Imports from SADC
0
5000
10000
15000
20000
25000
30000
2000 2001 2002 2003 2004 2005 2006 2007 2008 2009
Period (Years)
Impo
rts V
olum
e (T
on)
Malawi Mozambique United Republic of Tanzania Zambia Zimbabwe
Source: Quantec Easy Data
191SOYABEAN MARKET VALUE CHAIN PROFILE 2010-2011

On average, South Africa imports about 7 thousand tons of soya beans from the SADC region per annum. Figure 13 indicates that the value of soybean imports from the SADC region into South Africa were higher during the year 2000, mainly from Zimbabwe and thereafter declined substantially until there were no imports from SADC countries between 2004 and 2006. Soybean imports, originating mainly from Malawi, Zambia and Tanzania, resurfaced again during the year 2007. Of importance to note also, is the disappearance of imports from Zimbabwe between 2003 and 2007 owing to the political and economic meltdown in the country. Soya bean imports from Zimbabwe have increased slightly in the year 2008 and dropped during the year 2009.
Figure 14: Volume of Soya Beans Imports from South America
0
20000
40000
60000
80000
100000
120000
2000 2001 2002 2003 2004 2005 2006 2007 2008 2009
Period (Years)
Impo
rts V
olum
e (T
ons)
Argentina Brazil
Source: Quantec Easy Data
Figure 14 further illustrates the fact that, while soybean imports into South Africa from the SADC region experienced a substantial decline from the year 2001, Argentina in South America became a formidable force by increasing its share of soybean exports into South Africa. South Africa imports greater volumes of soybeans from Argentina in South America than from any other region. This is attributable to favorable logistics and location between SA and Argentina, in spite of the fact that Argentina is a major producer and exporter of most grain crops. Similar to the trend in Figure 12, the volume of soybean imports originating from Argentina in South America experienced a substantial increase during 2007. This substantial increase in soybean imports from South America do not come as a surprise since during 2007, the demand for soybeans domestically far outweighed the domestic supply. The soybean imports from Argentina declined significantly between 2008 and 2009 mainly as a result of increased production volumes.
192 SOYABEAN MARKET VALUE CHAIN PROFILE 2010-2011

2.3 SHARE ANALYSIS
Table 7: Share of provincial soybean exports to the total RSA soybean exports (%)
Year 2000 2001 2002 2003 2004 2005 2006 2007 2008 2009
District
Western Cape 0.00 3.15 0.00 0.00 1.27 0.01 23.24 56.13 0.02 28.48
Kwazulu-Natal 0.00 55.18 45.80 28.97 87.57 2.75 45.69 12.54 25.23 1.56
North West 0.01 0.34 0.00 0.00 0.00 0.00 0.00 0.00 0.00 0.00
Gauteng 99.99 41.33 54.16 28.97 11.16 97.24 31.07 31.33 74.75 69.95
Mpumalanga 0.00 0.00 0.04 0.00 0.00 0.00 0.00 0.00 0.00 0.00
Source: Calculated from Quantec data
Table 7 indicates that, over the ten year period under review the Gauteng province commanded the greatest share of soybean exports to the world with irregular soybean exports recorded from the Western Cape, Mpumalanga and North West provinces. Fractional exports were recorded from the North West province between the years 2000 and 2001 and from the Mpumalanga Province during 2002. During 2008 Gauteng Province alone accounted for 74.75% of South Africa’s total soya bean exports followed by Kwazulu-Natal and Western Cape with 25.23% and 0.02% respectively. During 2009 Gauteng Province’s contribution to South Africa’s total soya beans exports declined to 69.95% while the Western Cape Province’s contribution increased from 0.02% to 28.48%.
Table 8: Share of district soybean exports to the total Western Cape soybean exports (%)
Year 2000 2001 2002 2003 2004 2005 2006 2007 2008 2009
District
City of Cape Town 0.00 100 0.00 0.00 100 100 100 100 100 0.03
Cape Winelands 0.00 0.00 0.00 0.00 0.00 0.00 0.00 0.00 0.00 99.97
Source: Calculated from Quantec data
Soybean exports from the Western Cape Province were mainly through the City of Cape Town district due to the use of the Cape Town harbor as a bypass. Since from the year 2000 to 2008, the City of Cape Town has been doing well in terms of soybean exports, having been the only exporter of soya beans in the province between 2000 and 2008. During the year 2009, the exports of soya beans started to emerge from the Cape Winelands District. During the same year, the latter contributed 99.97% to the Western Cape’s total soya beans exports leaving the City of Cape Town with only 0.03%.
Table 11: Share of district soybean exports to the total Kwazulu-Natal soybean exports (%)
Year 2000 2001 2002 2003 2004 2005 2006 2007 2008 2009
District
UMzinyathi 0.00 100 99.99 100 38.28 99.99 96.51 55.91 20.57 5.27
EThekwini 0.00 0.00 0.01 0.00 61.72 0.00 3.48 44.08 79.43 94.73
Source: Calculated from Quantec data
The Kwazulu-Natal province has had exports originating from two districts, namely the UMzinyathi and EThekwini districts primarily due to the use of the Durban harbor as a viaduct of produce
193SOYABEAN MARKET VALUE CHAIN PROFILE 2010-2011

that are transported from the Randfontein grain market for export purposes. The level of exports from Kwazulu-Natal province in 2004, 2008 and 2009 has been higher in EThekwini District, which commanded the greatest share of soybean exports than UMzinyathi District. The UMzinyathi District commanded a greater share of soybean exports for the most part of the period under analysis.
Table 12: Share of district soybean exports to the total Gauteng soybean exports (%)
Year 2000 2001 2002 2003 2004 2005 2006 2007 2008 2009
District
West Rand 0.00 0.00 71.29 2.13 3.12 0.59 0.00 34.87 3.86 0.11
City of Tshwane 55.18 39.91 1.46 0.74 20.69 1.22 0.00 0.02 0 0.00
Ekurhuleni 44.82 60.08 27.25 97.13 76.13 93.62 34.99 41.76 0 72.13
City of Johannesburg 0.00 0.00 0.00 0.00 0.05 4.56 65.00 23.34 96.14 27.75
Source: Calculated from Quantec data
In the Gauteng province, over the ten year period under review Ekurhuleni Metropolitan Municipality has been commanding the greatest share of soybean exports, followed by the City of Tshwane, then the City of Johannesburg due to the role played by the Randfontein grain market in transporting grains to the Durban harbor in particular; in spite of the fact that the province is not a producer of soybeans. City of Johannesburg played a huge role in exportation of soya beans in 2008, having accounted for 96.14% of the total provincial exports although this declined to 27.75% in 2009.
2.4 PROCESSINg, VALUE ADDITION AND UTILIzATION
During the processing of soybeans, when the seed is pressed crude oil is released from the seed while the other product that is derived from the process is soybean oilcake. The crude oil is then refined to produce soybean oil as shown in Figure15 below.
Figure 15: The processing of soybeans
SOYBEAN SEED PRESS
CRUDE OIL REFINING OIL
OILCAKE HEXANE
Source: Grain SA
Soybean seeds can be eaten as a vegetable and the dried seeds can be eaten whole, split or spouted. When processed they give soy milk which is a valuable protein supplement in infant feeding which also provides curds and cheese. Soy sauce can be made from mature fermented beans while roasted seeds can be used as a coffee substitute. Soy flour can be prepared from beans while producing full fat flour with about 20% oil. The flour is used in bakeries and other food products and as additives and extenders to cereal flour and meat products and in health foods. Other industrial uses of the oil are that it is used in manufacturing of paints, linoleum, oilcloth, printing inks, soap, insecticides and disinfectants. The lecithin phospholipids that are obtained
194 SOYABEAN MARKET VALUE CHAIN PROFILE 2010-2011

as a by-product of the oil industry are used as wetting and stabilizing agents in food, cosmetics, pharmaceuticals, leather, paint, plastic, soaps and detergent industries. Soybean meal and soybean protein are used in the manufacture of synthetic fibre, adhesives, textile sizing, waterproofing and firefighting foam. The straw can be used to make paper that is stiffer than that made from wheat straw.
Soybean meal is a very rich protein feedstuff for livestock for which there is an increasing demand while the vegetative portions of the plant can be used as silage, hay, pasture or may be ploughed in as green manure. The various uses of soybeans are illustrated in Figure 16.
Figure 16: The Soybean value chain tree: explaining its various uses
SOYBEANS
OIL
COOKING OIL
INDUSTRIAL FOOD PRODUCTS
SOY OILCAKE
ANIMAL FEEDS
FULL FAT SOYA
HIGH QUALITY ANIMAL FEEDS
PRINTER’S INK
Pro-Nutro Mincemeat Products Processed Meat products Ingredient in bread and other bakers’ products Milk products (milk & cheese)
SOYA BEAN MEAL
- Paints - Linoleum - Oil Cloth - Soap - Insecticides - Disinfectants
- Water proofing - Adhesives - Textile sizing - Fire fighting foam
PHOSPHO- LIPIDS
- Plastic - Paint - Cosmetics - Soaps - Pharmaceuticals
Source: Adapted from Grain SA
195SOYABEAN MARKET VALUE CHAIN PROFILE 2010-2011

2.5 MARKET INTELLIgENCE
2.5.1 TARIFFS
South Africa applies the following import tariffs to the imports of Soybeans from various regions:
Table 13
Trade RegimeAggregated Ad Valorem Applied
Tariffs (2008)
Aggregated Ad Valorem Applied
Tariffs (2009)
Aggregated Ad Valorem Applied
Tariffs (2010)
Intra-SACU rate 0.00% 0.00% 0.00%
MFN duties (Applied) 8.00% 8.00% 8.00%
Preferential Tariff for European Union Countries 4.15% 4.15% 4.15%
Preferential Tariff for SADC countries 3.43% 3.43% 3.43%
Preferential Tariff for COMESA countries 5.52% 5.52% 5.52%
Source: ITC Market Access Map
From Table 13 it is clear that the normal tariff rate applied by South Africa to soybeans imports from other countries is 8.00% unless in scenarios where there is a special trade deal between South Africa and those countries. South Africa has a preferential tariff 4.15% for soya beans imports originating from EU while SADC and COMESA member countries are charged a tariff of3.43% and 5.52% respectively. There is no import tariff on soya beans imports originating from the SACU member states.
2.5.2 KNOwN NON-TARIFF BARRIERS
The increase in trade in oilseeds over the last decade has also seen a rapid increase in issues surrounding sanitary and phyto-sanitary requirements pertaining to oilseeds and related products. It has been argued that SPS requirements have been wrongfully used to restrict the importation of oilseeds and products in some countries in an attempt to protect domestic producers, especially against the backdrop of World Trade Organization commitments and obligations to reduce tariff barriers and increasing trade liberalization. SPS regulations and requirements are implemented primarily on the basis of human, animal and crop health, protection and safety. Since oilseeds are primarily destined fro animal feed and/or human consumption, SPS measures have a direct bearing on oilseeds and their products. SPS measures go as far as including issues pertaining to labeling requirements of products, the use of genetically modified organisms, and the physical handling and/or transportation of goods. Such requirements are enforced or determined by governments through statutory legislation or voluntary codes of practice implemented by the private sector, or by international bodies such as the FAO/WHO Codex Alimentarius Commission which has international standards and guidelines that apply to a wide range of products. Below are some of the general applications of SPS regulations applied to oilseeds which have a bearing on soybeans in international markets.
2.5.2.1 OILSEED MATERIAL
Oilseeds are subject to official phyto-sanitary certification to guarantee the absence of harmful organisms. There may also be regulations on the maximum permissible pesticide residue levels of plant origin destined for the manufacture of food and feedstuffs. China permits up to one fungicide tainted seed per kilogram of soybeans. The quality control has to take place at the port of entry.
196 SOYABEAN MARKET VALUE CHAIN PROFILE 2010-2011

2.5.2.2 SHIPPINg CONTRACTS AND TRANSPORT ISSUES
A very large portion of international trade in oilseeds, oils and oil meals is based on widely recognized shipping contracts issued by two international associations. Used on a voluntary basis, these contracts have evolved over many years to suit the needs of the oilseed trade. Included in these contracts are requirements to ensure that goods traded are in good condition and of fair quality. They help trading partners comply with national or international SPS legislation and standards.
2.5.3 PERFORMANCE OF THE SOUTH AFRICAN SOYA BEAN INDUSTRY.
Table 14: List of suppliers of Soybean imported by South Africa in 2009
Exp
ort
ers
Imp
ort
ed v
alue
in
20
09
(th
ous
and
U
S$)
Shar
e in
So
uth
Afr
ica’
s im
po
rts
(%)
Imp
ort
ed q
uant
ity
in 2
00
9 (
tons
)
Uni
t va
lue
(US$
/un
it)
Imp
ort
ed g
row
th
in v
alue
bet
wee
n 2
00
5 a
nd 2
009 (
%
p.a
.)
Imp
ort
ed g
row
th in
q
uant
ity
bet
wee
n 2
00
5 a
nd 2
009 (
%
p.a
.)
Imp
ort
ed g
row
th
in v
alue
bet
wee
n 2
00
8 a
nd 2
009 (
%
p.a
.)
World 509 100 1 496 340 -26 -33 -89
Zambia 410 80.6 1 087 377 - - -
Brazil 39 7.7 42 929 - - -47
UK 36 7.1 32 1 125 - 138 177
Malawi 9 1.8 28 321 - 13
Zimbabwe 9 1.8 292 31 - - -96
China 2 0.4 2 1 000 - 41 -85
Hong Kong 2 0.4 2 1 000 - 7 -
Source: ITC Trade Map
Table 14 above indicates that most of the South Africa’s Soybean imports are mainly from Zambia, Brazil, UK and Malawi. It is also clear from the above table that more than 80% of South Africa’s total soya beans imports originated from Zambia while the combination of countries such as Brazil, United Kingdom, Malawi, Zimbabwe and China accounted for less than 20%. Table 14 also indicates that soya beans imports from the rest of the world into South Africa declined by 26% between the years 2005 and 2009.
197SOYABEAN MARKET VALUE CHAIN PROFILE 2010-2011

Source: ITC Trade Map
198 MAIZE MARKET VALUE CHAIN PROFILE 2010-2011
2.6 FIgURE 17: PROSPECTS FOR DIVERSIFICATION OF SUPPLIERS OF SOYA BEANS (120100) IMPORTED BY SOUTH AFRICA IN 2009

Figure 17 shows that, if South Africa is to diversify its soybean imports, prospective import markets exist in Canada, Argentina, Paraguay and the United States of America. The abovementioned countries are among the world’s largest exporters of soya beans although South Africa did not import any soya beans from them in 2009. The United States of America is the largest exporter of soya beans having accounted for approximately 50% of the world’s total soya beans exports in 2009.
Table 15: List of Importers of Soybean Exported by South Africa in 2009
Importers
Exp
ort
ed v
alue
in 2
009
(tho
usan
d U
S$)
Shar
e in
So
uth
Afr
ica’
s ex
po
rts
(%)
Exp
ort
ed q
uant
ity
in
2009 (
tons
)
Uni
t va
lue
(US$
/uni
t)
Exp
ort
ed g
row
th in
va
lue
bet
wee
n 2005
and
2009 (
% p
.a.)
Exp
ort
ed g
row
th in
q
uant
ity
bet
wee
n 2005
and
2009 (
% p
.a.)
Exp
ort
ed g
row
th in
va
lue
bet
wee
n 2008
and
2009 (
% p
.a.)
World 67 896 100 161 922 419 162 57 1 751
United Arab Emirates 27 791 40.90 62 302 466 - - -
Indonesia 20 095 29.60 46 826 429 202 253 -
Saudi Arabia 14 913 22 35 000 426 - - -
Thailand 1 983 2.9 13 000 153 - - -
Malawi 1 880 2.8 2 515 748 - - -8
China 452 0.7 1 042 434 - - -
Sri Lanka 390 0.6 843 463 - - -43
Zimbabwe 200 0.3 214 935 -16 -65 -59
Zambia 108 0.2 73 1 479 153 212 -31
Source: ITC Trade Map
Table 15 above shows that, the greatest quantities of soybeans exported from South Africa in various forms are destined to the export markets given as follows: United Arab Emirates, Indonesia, Saudi Arabia, Malawi, Sri Lanka, Zimbabwe, and Zambia. Table 15 shows that between 2005 and 2009, exports of soya beans from South Africa to the rest of the world have increased by 162% in value terms and 57% in volume terms. The country that has imported most soya beans from South Africa in 200 is United Arab Emirates having absorbed 40.9% of South Africa’s total soya beans exports. South Africa exported 27 791 tons of soya bens to United Arab Emirates in 2009 and 20 095 tons to Indonesia during the same period. Exports of soya beans from South Africa to Zimbabwe have declined by 16% and 65% in value and volume respectively between 2005 and 2009.
199SOYABEAN MARKET VALUE CHAIN PROFILE 2010-2011

Source: ITC Trade Map
200 SOYABEAN MARKET VALUE CHAIN PROFILE 2010-2011
Figure 18: Prospects for market diversification for Soya beans (120100) exported by South Africa in 2009
If South Africa is to diversify its soybean exports the biggest prospective markets exists in Japan, which is the second largest importer of soya beans, followed by Germany, Mexico and Netherland.. Figure 18 shows that during 2009, Indonesia commanded a share of about 30% in soya bean imports originating from South Africa, followed by Saudi Arabia and Thailand. Soya bean exports to Indonesia and Zimbabwe have increased dramatically at a pace of 202% and 153% respectively.
3. ORgANIzATIONAL ANALYSIS
3.1 STRENgTHS, OPPORTUNITIES AND THREATS
Strengths
� Due to the health benefits associated with soybeans, there is a growing interest in soybeans and soybean products in South Africa and worldwide.
� Soybeans are known to be a cheap source of good quality protein which is free from cholesterol.
Opportunities
� The crop can be used in the fight against malnutrition in North Africa and sub-Saharan Africa in the future.
� Can be used to meet the increased demand for protein which is predicted to can be 75% by 2025.
� Due to the fact that soybeans are legumes, they can be used in crop rotational systems for their ability to fix nitrogen and; because they are more tolerant to acid and drought conditions than maize they can be grown for home consumption or as a cash crop.
Threats
� Farmers can lose out on the non-GM niche market if they become too lax in separating GM soybeans from non-GM soybeans.
� The USA has established an initiative that aims to lobby for the use of more soybeans in food aid.
� The US is also seeking new markets for its surplus soybeans.
4. EMPOwERMENT AND TRANSFORMATION
The Tshwane Metropolitan Council in collaboration with the Rotary Club of Pretoria, the Rotary Club of Cham in Germany, Tshwane University of Technology, Nutri-soya and the Department of Provincial and Local Government has launched a project that transforms locally grown soybeans into nutritional foodstuffs in Mamelodi..
201SOYABEAN MARKET VALUE CHAIN PROFILE 2010-2011

5. ACKNOwLEDgEMENTS
The following organizations are acknowledged:
grain South AfricaTel: (056) 515 0918Fax: (056) 515 1517www.grainsa.co.za
Agricultural Statistics: Department of Agriculture, Forestry and Fisheries.Tel: (012) 319 8453Fax: (012) 319 8031www.nda.agric.za
Quantec EasydataP.O.Box 35466Menlo ParkPretoria0102Tel: 012 361 5154Fax: 012 348 5874Website: www.quantec.co.za
ITC Market Access MapWebsite: http://www.macmap.org/South Africa
ITC Trade MapWebsite: www.trademap.org
South African Soy Food Association (SASFA)Tel: (015) 491 7939Website: http://www.soyfood.co.za
South African Revenue Service (SARS)Website: http://www.sars.gov.za
Disclaimer: This document and its contents have been compiled by the Department of Agriculture for the purpose of detailing the soybean industry. Anyone who uses the information as contained in this document does so at his/her own risk. The views expressed in this document are those of the Department of Agriculture with regard to the industry, unless otherwise stated. The Department of Agriculture therefore accepts no liability that can be incurred resulting from the use of this information.
202 SOYABEAN MARKET VALUE CHAIN PROFILE 2010-2011