South West Neonatal Term Admissions Report
44
South West Neonatal Term Admissions Report March 2017
Transcript of South West Neonatal Term Admissions Report

South West Neonatal Term Admissions Report
March 2017
i
Foreword
At a National level, there is very considerable focus on the organisation of services and clinical
outcomes of babies born prematurely, particularly for extremely preterm infants born before 27/40
gestation. This patient group is extremely important, as they carry the highest mortality rates and
have the longest duration of admission, so account for a significant proportion of neonatal unit
activity. The adverse effect on individual families is enormous, and always challenging. However, in
terms of numbers of families affected by neonatal unit admission, term admissions (>37/40) are
equally if not more important – accounting for 60% of all neonatal unit admissions. They arguably
offer more opportunity for intervention to reduce admissions and maternal infant separation as
these infants are less unwell than their preterm counterparts and National data suggests that
admission rates have been climbing despite falling birth rates.
This report describes changes in the neonatal unit admission rates, reasons for admission and levels
of treatment required for babies born in the South West Neonatal ODN over the last 6 years to the
end of December 2016. The data has been collected from the Badger database and relates to first
admissions only. It reflects a range of practises in terms of different ways of recording admissions
and diagnostic coding, but nonetheless represents data and coding as recorded in individual units
and given the duration of the study period, and the number of admissions clearly demonstrates
some interesting trends:
Climbing admission numbers and rates/ 1000 live births in the region over the 6 year period
There is a wide range of admission rates between units of the same and different levels, with
8 out of 12 units admitting at above the National average of 5%, and 4 out of 12 units
admitting at considerably below this level. The lowest admission rates for babies <37/40
was around 3% and it seems reasonable to assume that all units should aspire to this level.
With the exception of one unit, St Michael’s, which hosts the regional cardiac and surgical
services and provides surgical care to infants with complex medical conditions that have
been diagnosed antenatal, one would expect the population of infants born over 37/40 to
be demographically / medically similar across all units of all levels in the region.
Although units with TC wards seem to have more unwell babies admitted to their neonatal
units, they also have quite high admission rates as a percentage of live births.
The commonest reasons for admission in the SW region vary slightly from the national
picture with fewer admissions for jaundice, but a greater proportion of admissions for
suspected sepsis.
The absolute number of babies recorded as being admitted for suspected sepsis has risen
dramatically since the implementation of the NICE neonatal sepsis guideline in 2012.
Other factors that may contribute to the increasing admission rate include lower thresholds
for screening mothers for sepsis, increasing rates of early induction of labour for possible
intra-uterine growth failure and earlier elective delivery for multiple pregnancies. Other
maternal factors such as increasing maternal age and weight and increasing rates of
diagnosis of gestational diabetes may also be playing a part.
ii
A significant minority of babies received no treatment / observation only or only minimal
treatment that could be delivered in a transitional care setting. This is truer of Local
Neonatal units (LNUs) and Special Care units (SCUs) than NICUs.
There is evidence of a trend for lower admission rates for specific conditions in SCUs and
LNUs vs Neonatal Intensive Care units (NICUs) – specifically, they demonstrate lower
admission rates for HIE / cooling, hypoglycaemia and respiratory symptoms. Admission
rates /1000 deliveries are higher for babies with possible sepsis.
This report is generated in 2 parts: the first describes the changing pattern of neonatal unit
admission across the whole South West region, followed by unit specific reports which have been
generated to offer individual units the chance to identify areas where local practise might have
deviated from a regional norm, and where reductions in neonatal unit admission rates are
achievable.
As a final note, many teams have commented that babies >37/40 who require minimal additional
levels of care or observation are admitted to neonatal units because the post-natal ward
environment in many units are simply not well enough staffed to deliver the extra care and support
these babies and their mothers need. This report suggests strongly that the opportunity to improve
the patient experience exists, by reducing neonatal unit admission and the associated maternal
infant separation - but that at least a portion of savings liberated may need to be invested in
improved post-natal support outside neonatal services and within maternity services to enable that
change to happen in a safe way. It additionally seems possible that some changes in practise e.g.
NICE sepsis guidance has driven up admission rates with relatively limited evidence of improvements
in outcome and these areas merit more detailed review.
Dr Rebecca Mann
Clinical Director of the South West Neonatal Operational Delivery Network
April 2017
iii
Contents
Foreword
Contents
1. Introduction
2. Background
3. Method
4. Term Admission Trends Data 4.1 National trends in Term Admission Rates 4.2 South West Trends in Term Admissions Rates 4.3 Current Term Admission Activity & ATAIN Targets 4.4 Financial Impact of Changing Trends in Term Admissions to NNU
5. South West Term Admissions Data – 2016 5.1 Principal Admission Reasons for SW Term Admissions to NNU 5.2 Treatment Levels for SW Term Admissions to NNU
6. South West Top Five Reasons for Term Admissions to NNU – Further Analysis 6.1 Respiratory Symptoms 6.2 Suspected Infection 6.3 Hypoglycaemia 6.4 Monitoring 6.5 Suspected HIE
7. Summary and Conclusions
Appendices
Appendix 1: Term admission activity with varying measurement criteria Appendix 2: SW Regional Scheme PID Appendix 3: 2017/18 Action Plans Appendix 4: Resources Directory Appendix 5: SW NHS ATAIN Leads Appendix 6: SW NHS Trusts Case Study Template Appendix 7: Neonatal Critical Care Mandatory Data Set

1
1. Introduction In 2013 there were 80,251 admissions to neonatal units across England of which almost 60%
(48,000) were infants delivered >37 weeks gestation. By 2015 the number of term admissions had
risen to 54,821 nationally despite a 3.6% fall in term live births. This trend is mirrored in the South
West where live birth rates have decreased by an average of 2% per year between 2012 and 2016
against an increase in term admissions of 4% per year over the same time period.
Work undertaken across the South West in 2015/16 as part of a national CQUIN demonstrated a
need within the region to more fully understand potentially preventable factors leading to full term
babies being admitted to a neonatal unit.
The main section of this report is presented at a regional level comparing SW network data against
national trends and breaking down SW network data analysis by unit level. The report looks in
detail at the top five most frequently recorded reasons for admission to a neonatal hospital in the
South West according to admissions data recorded in 2016. These reasons differ slightly to the top
four factors identified at national level (hypoglycaemia, jaundice, respiratory conditions and
asphyxia) and include:
• Respiratory
• Suspected Infection
• Hypoglycaemia
• Monitoring
• Suspected HIE
The report also looks into babies whose care could potentially have been managed without
separation from their mother either in a transitional care or postnatal ward setting, at home or in
the community without admission. This is particularly important given the overwhelming evidence
summarised in a recent NHS improvement document which highlighted:
• That separation of mother and baby at or soon after birth can affect the positive
development of the mother–child attachment process (Crenshaw 2014).
• Mothers may find it harder to establish and maintain breastfeeding and it may affect their
mental health (Bigelow et al 2012; Dumas et al 2013).
• Preventing separation, except with compelling medical indications, is an essential part of
providing safe maternity services and an ethical responsibility for healthcare professionals
(Crenshaw 2007; 2014).
2
Alongside the main report each trust will find an individualised unit report setting out term
admission data specific to their neonatal and maternity services. This individualised report explores
the individual trusts term admission activity in relation to current national ATAIN targets and
compares data across the SW Network as a whole and against the relevant unit level. In addition
each Trust is provided with suggested key areas for exploration in relation to potential reductions in
term admissions to NNU.
The intention is that these unit reports will form the basis of evidence for Trusts participation the
Avoiding Term Neonatal Admissions into Neonatal Units (ATAIN) QIPP NHS England (South) 17/18
Improving Value Project within which, through varying initiatives, Trusts will seek to identify areas
for improvement and reduce the percentage of term admissions within their Trusts.
To further support Trusts participation in the ATAIN QIPP Improving Value Project, and to provide a
fuller overview to wider audiences this document also includes:
• Term admission activity with varying measurement criteria – This appendix highlights that
term admissions can be defined in varying ways and shows how the use of differing criteria
changes term admission activity figures at each unit (Appendix one)
• The Avoiding Term Neonatal Admissions into Neonatal Units (ATAIN) QIPP NHS England
(South) 17/18 Project Initiation Document – This sets out the QIPP in more detail and the
quality improvement initiatives NHS England (South) and the SW Neonatal Network ask
Trusts to participate in. (Appendix two)
• A unit based ‘Action Plan’ for the ATAIN QIPP – This sets out your identified areas for
improvement in 2017/18 and actions and timescales for achieving this. This should be
completed and submitted to the South West Neonatal Network for review and monitoring.
(Appendix three)
• The SW ATAIN QIPP useful resources directory – To signpost Trusts to useful resources and
areas of best practice to further support implementation and improvement. (Appendix four)
• A SW ATAIN Lead nomination form – For Trusts to identify ATAIN leads within Maternity
and Neonatal Services. (Appendix five)
• A SW ATAIN case study template – For Trusts to submit examples of best practice and
service improvements to share across the region. (Appendix six)
• Neonatal Critical Care Mandatory Data Set (NNMDS) – National Neonatal Data Set as
agreed by the CRG in 2016. This should be used by units to determine the categories of care
for their infants and reduce and inconsistencies around what determines, SC, TC and normal
care babies (Appendix seven).
We strongly acknowledge that some term admissions are necessary even when the appropriate
postnatal care has been provided (e.g. a baby born with a congenital abnormality requiring surgical
management). Other admissions may reflect successful implementation of improvement
programmes in related areas, such as stillbirth reduction programmes.

3
Some babies will require admission for antibiotic treatment or intensive phototherapy for jaundice,
however, babies who remain well with these conditions can often be managed in a transitional care
or postnatal ward setting alongside their mothers. Indeed, one unexpected finding of the work led
by the ATAIN Programme and the South West programme of work has been the number of babies
who would not have needed to be admitted if there were greater services were available to keep
mother and baby together.
Therefore our conclusions and findings in this report focus not just on the improvements required to
clinical care and admission practice on Maternity Units to reduce admissions but also on
consideration of the role that transitional care and family integrated care models could play locally
in reducing unnecessary admissions to neonatal units whilst keeping mother and baby together.
2. Background Improving the safety of maternity services is a key priority for the NHS and reducing admission of
full-term babies to neonatal care is an indicator in the NHS Outcomes Framework for 2016 to 2017.
The number of unexpected admissions of term babies is seen as a proxy indicator that harm may
have been caused at some point along the maternity or neonatal pathway. A recent report by NHS
Improvement in early 20171 emphasised the coalition of commitment across the NHS in addressing
this as a priority.
As well as setting out key national findings in relation to Term Admissions it also summarised the
work of the ATAIN programme2 and highlighted opportunities and resources for care delivery and
service improvement across Maternity and Neonatal Services. The drive to reduce Term Admissions
into Neonatal Units also aligns with further national priorities including:
the Secretary of State for Health’s ambition to reduce stillbirth, neonatal brain injury and
neonatal death by 50% by 2030¹
recommendations in Better Births, taken forward in the NHS England-led Maternity
Transformation Programme
reducing harm through learning from serious incidents and litigation claims
Improving culture, team work and improvement capability within maternity units.
To better understand term admission activity in the South West of England and to identify where
safe reduction in term admissions may be possible this report explores five year trends in term
admission activity, key reasons for term admissions to NNU across the SW and provides a
retrospective investigation of patients for whom care may have been possible within a transitional
or family integrated care setting.
1 NHS Improvement, ‘Reducing harm leading to avoidable admission of full-term babies into neonatal units,
Findings and Resources for improvement’, February 2017 2 Atain (an acronym for ‘avoiding term admissions into neonatal units’) is a programme of work led by clinical
experts to reduce harm leading to avoidable admission to a neonatal unit for infants born at term, ie ≥ 37+0 weeks gestation.
4
3. Method Data was collected from all 12 of the South West network neonatal units, including three level 3
units (Neonatal Intensive Care Units (NICUs)), six level 2 units (Local Neonatal Units (LNUs)) and
three level 1 units (Special Care Units (SCUs)):
Level 3 - NICUs:
Southmead, North Bristol NHS Trust
St Michaels, University Hospitals Bristol NHS Foundation Trust
Plymouth Hospitals NHS Trust
Level 2 - LNUs:
Great Western Hospitals NHS Foundation Trust
Gloucestershire Hospitals NHS Foundation Trust
Taunton and Somerset NHS Foundation Trust
Bath, Royal United Hospital S Bath NHS Foundation Trust
Exeter, Royal Devon and Exeter NHS Foundation Trust
Truro, Royal Cornwall Hospitals NHS Trust
Level 1 - SCUs:
Northern Devon Healthcare NHS Trust
South Devon Healthcare NHS Foundation Trust
Yeovil District Hospital NHS Foundation Trust
Data was collected from the national BadgerNet dataset that UK neonatal units routinely use to
record information relating to all neonatal episodes of care. Anonymised patient data was
downloaded for all babies admitted to a neonatal unit between 1st January 2012 and 31st December
2016 based on the following criteria:
Born ≥37 weeks gestation (full term)
First episode of care only
Admitted to the neonatal unit (NNU) for any portion of their neonatal care episode based on
location of care in the BadgerNet Day Summary
Admitted within 28 days of birth from any setting
Babies for whom the full neonatal care episode was based within a transitional care (TC) or postnatal
(PN) ward setting were excluded.
This definition of term admissions is in line with that used for the national data collection to enable
comparison with national outcomes. However it is recognised that use of alternative criteria such as
‘carer status’ (whether or not mother is resident and caring for baby) rather than the physical
‘location of care’ would also be an appropriate measure in particular for South West units where a
TC service is provided within a NNU location. For further details please see Appendix 1.
The final dataset contained information on a total of 13,573 1st episode, term admissions to NNU.
Data from admissions during 2012 to 2016 (calendar years) were used to explore activity trends over

5
the past 5 years, whilst data on admissions from 2016 (calendar year) were used for a more detailed
analysis of current care practices across the SW network.
Since some babies (e.g. those with jaundice) may be admitted from home into a paediatric rather
than a neonatal setting the data presented in this report does not include these babies, this report
may therefore underestimate the issues affecting these groups.
4. Term Admission Trends Data: 2012-2016
4.1 National Trends in Term Admission Rates Between 2011 and 2014, the number of term live births in England declined by 3.6%, but the
number of admissions of term babies to neonatal units increased by 24% with a further increase of
6% in 2015. This increase is seen across all categories of care but particularly in special care where an
extra 10,000 babies were admitted in 2015 compared to 2011.
Term live births in England (2011 to 2014) in relation to term care days (2011 to 2015)3
Between 2011 and 2015 the number of care days for term admissions across care at levels 1, 2 and 3
rose by over 30%.
3 NHS Improvement, ‘Reducing harm leading to avoidable admission of full-term babies into neonatal units,
Findings and Resources for improvement’, February 2017
6
The increase in activity generated by term admissions was seen in all types of units: neonatal
intensive care units (NICUs), local neonatal units (LNUs) and special care units (SCUs) as well as in all
categories of care.
4.2 South West Trends in Term Admission Rates
In 2013 there were 80,251 admissions to neonatal units across England of which almost 60%
(48,000) were babies born at term. By 2015 the number of term admissions had risen to 54,821
nationally despite a 3.6% fall in term live births.
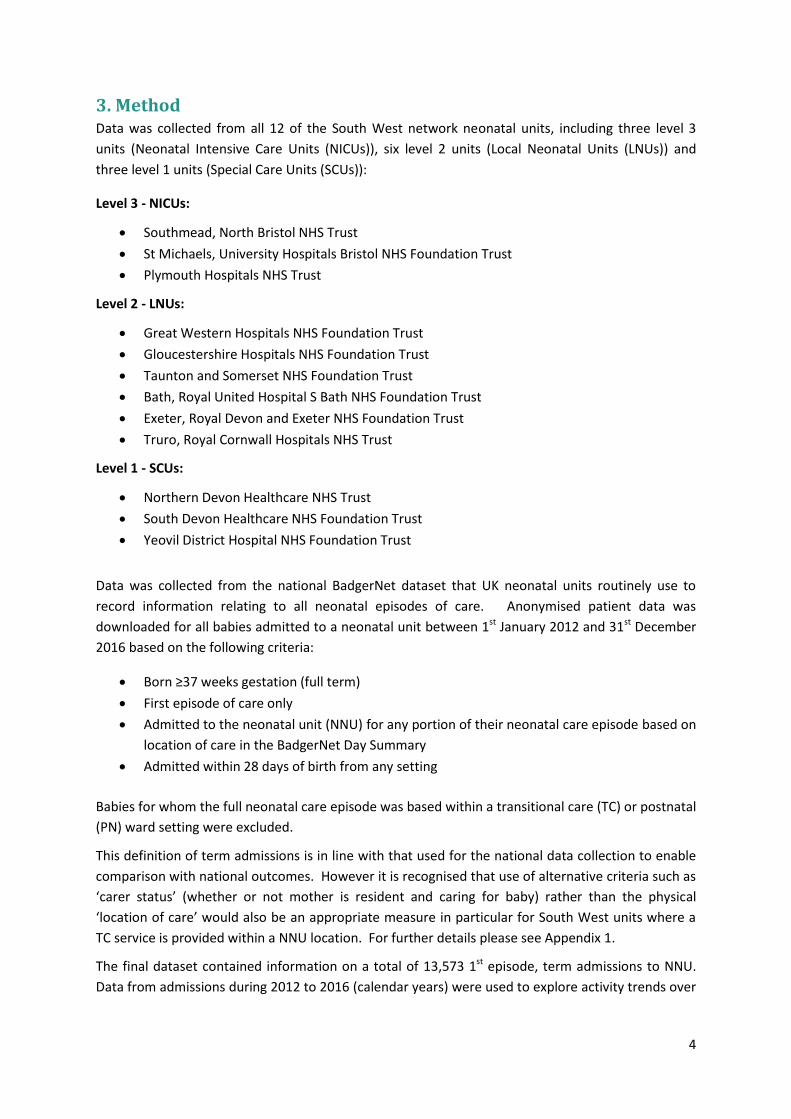
Findings are highly comparable across the South West of England where live birth rates have
decreased by an average of 2% per year between 2012 and 2016 from 61131 births in 2012 to 56764
in 2016, whilst term admissions to SW neonatal units (NNUs) have increased by an average of 4% per
year over the same time period from 2602 in 2012 to 2976 in 2016 (graph 1).
This has resulted in an increase from 42.6 term admissions per 1000 live births in 2012 to 52.4 in
2016. Thus by 2016 term admissions accounted for 57% of all admissions to NNU across the South
West of England.
Graph 1: Cumulative percentage change in South West births and term admissions from 2012 and 2016
Across the SW the total number of NNU care days provided has increased in line with the rising total
numbers of term admissions. The total number of NNU care days provided for term admissions to
NNU increased by 374 days per year between 2012 and 2016, this equates to an average yearly
increase of 2.9%. During this time period the average length of stay in NNU remained relatively
consistent at ~5 days per baby (table 1 below).
Table 1: Five Year Admissions Activity Trends
Year Live Births
1st Episode Term Admissions to NNU
1st
Episode Pre-term Admissions to NNU
Total NNU Care Days
Total NNU Care Days per Baby
2012 61131 2602 2226 12751 4.9
-10
-5
0
5
10
15
20
2012 2013 2014 2015 2016Pe
rce
nta
ge C
han
ge
Term Admissions Births

7
2013 58710 2524 2116 13233 5.2
2014 58403 2579 2218 13065 5.1
2015 58033 2892 2243 14663 5.1
2016 56764 2976 2175 15318 5.1
4.3 Current Term Admission Activity & ATAIN targets The NHS England Souths 17/18 Improving Value Project – ‘Reducing Term Admissions into Neonatal
Care’ recommends that no more than 5%4 of term live births should be admitted to a neonatal unit.
In 2016, term admissions accounted for 6.1% of all live births across the SW. In total 8 of the 12 SW
network units admitted more than the recommended 5%, ranging from 5.8% up to 11.0% of live
births becoming term admissions to NNU. If these units were to have reached the 5% target in 2016
this would have reduced total term admissions by a total of 740 babies across the SW network.
4.4 Financial Impact of Changing Trends in Term Admissions The average cost of a single term admission in 2016 was approximately £3,000. This figure based on
the average length of stay at each level of care for all term babies admitted to an NNU in the South
West in 2016 using 2013/14 National Neonatal Reference Costs.
In 2012, there were 2602 term admissions to an NNU, suggesting that the total cost of Term
Admissions in the South West equated to approximately £7.8 million. In 2016, term admissions to an
NNU rose to 2976, with a total cost of term admissions in the South West equating to approximately
£8.9 million, a £1.1 million increase in 4 years.
If all units who are currently above the national average for term admissions are able to reduce their
term admissions to 5% of all live births, in line with the regional ATAIN target, this could reduce
admissions to Neonatal Units by 740 babies, but realise a potential cost saving to neonatal services
of approximately £2.2 million per annum. Whilst recognising that such neonatal cost savings may
require greater investment in alternative models of care and maternity staff, we recognise that
reduction in avoidable clinical admissions, and greater efficiency in our systems, processes and ways
of working will create overall health system efficiencies. More importantly, aside from financial
savings this reduction will result in fewer mothers being separated from their babies and mothers
and families who will not face the anxiety or worry of a neonatal unit admission.
4 This figure was suggested by the ATAIN South of England Regional Programme as an average that all units should aim to achieve.
8
5. South West Term Admissions Data: 2016
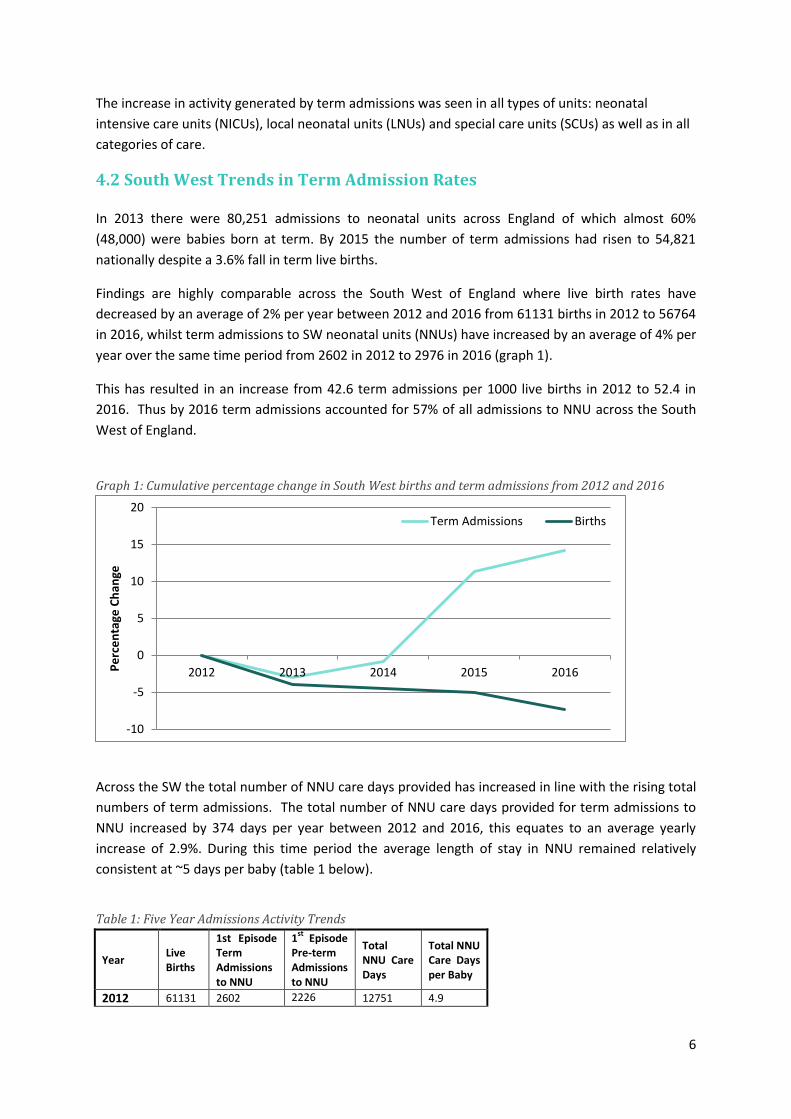
5.1 Principal admission reason for term admissions to NNU In 2016 the five most common reasons for term admissions in the South West of England were:
(1) Respiratory symptoms (36% of term admissions)
(2) Suspected Infection (23% of term admissions)
(3) Hypoglycaemia (9% of term admissions)
(4) Monitoring (6% of term admissions)
(5) Suspected HIE (5% of term admissions)
This differs slightly to findings from national data collected in 2015 where jaundice ranked in the top
5 admissions reasons across England (ranked 7th in the SW in 2016) but term admissions for
monitoring did not.
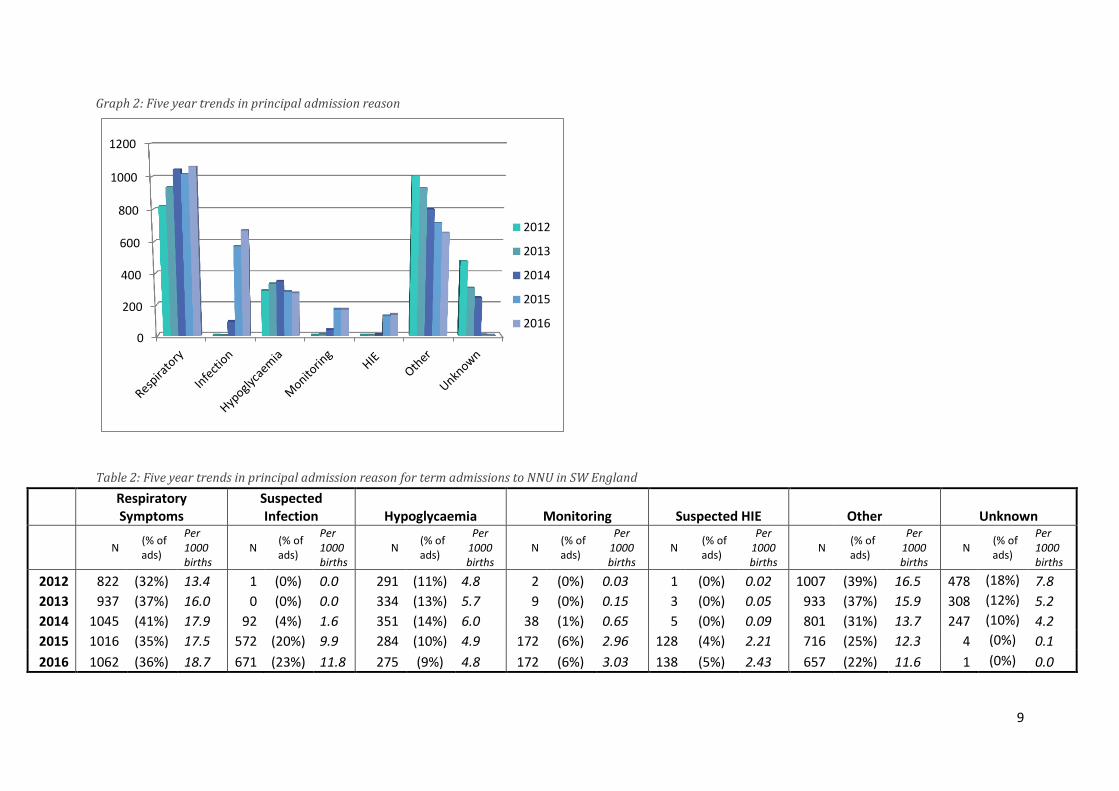
Respiratory symptoms have been the most common reason for term admission to NNU in the SW
consistently for the past five years with 1062 admissions in 2016 accounting for 36% of all term
admissions across the South West and equating to 18.7 admissions per 1000 live births (table 2). It is
possible and probable that there is an overlap in coding between patients admitted with
“respiratory symptoms” and those with possible infection, as one of the important differential
diagnoses in a patient with respiratory symptoms is infection. There may therefore be coding
differences between individuals as well as between units in regards to recording respiratory
symptoms or suspected infection as the principal admission reason.
The greatest increases in term admissions over the last 5 years are seen for suspected infection
rising from 1 (0% of total term admissions) in 2012 to 671 (23% of total term admissions) in 2016
equating to 11.8 admissions per 1000 live births. Notably new NICE guidance on the management
of neonatal sepsis was published in 2012.
Similarly term babies admitted for monitoring have risen from 2 (0%) in 2012 to 172 (6%) in 2016
and admitted for suspected HIE from 1 (0%) in 2012 to 138 (5%) in 2016 (graph 2 and table 2).
9
Graph 2: Five year trends in principal admission reason
Table 2: Five year trends in principal admission reason for term admissions to NNU in SW England
Respiratory Symptoms
Suspected Infection Hypoglycaemia Monitoring Suspected HIE Other Unknown
N
(% of ads)
Per 1000 births
N (% of ads)
Per 1000 births
N (% of ads)
Per 1000 births
N (% of ads)
Per 1000 births
N (% of ads)
Per 1000 births
N (% of ads)
Per 1000 births
N (% of ads)
Per 1000 births
2012 822 (32%) 13.4 1 (0%) 0.0 291 (11%) 4.8 2 (0%) 0.03 1 (0%) 0.02 1007 (39%) 16.5 478 (18%) 7.8
2013 937 (37%) 16.0 0 (0%) 0.0 334 (13%) 5.7 9 (0%) 0.15 3 (0%) 0.05 933 (37%) 15.9 308 (12%) 5.2
2014 1045 (41%) 17.9 92 (4%) 1.6 351 (14%) 6.0 38 (1%) 0.65 5 (0%) 0.09 801 (31%) 13.7 247 (10%) 4.2
2015 1016 (35%) 17.5 572 (20%) 9.9 284 (10%) 4.9 172 (6%) 2.96 128 (4%) 2.21 716 (25%) 12.3 4 (0%) 0.1
2016 1062 (36%) 18.7 671 (23%) 11.8 275 (9%) 4.8 172 (6%) 3.03 138 (5%) 2.43 657 (22%) 11.6 1 (0%) 0.0
0
200
400
600
800
1000
1200
2012
2013
2014
2015
2016
10
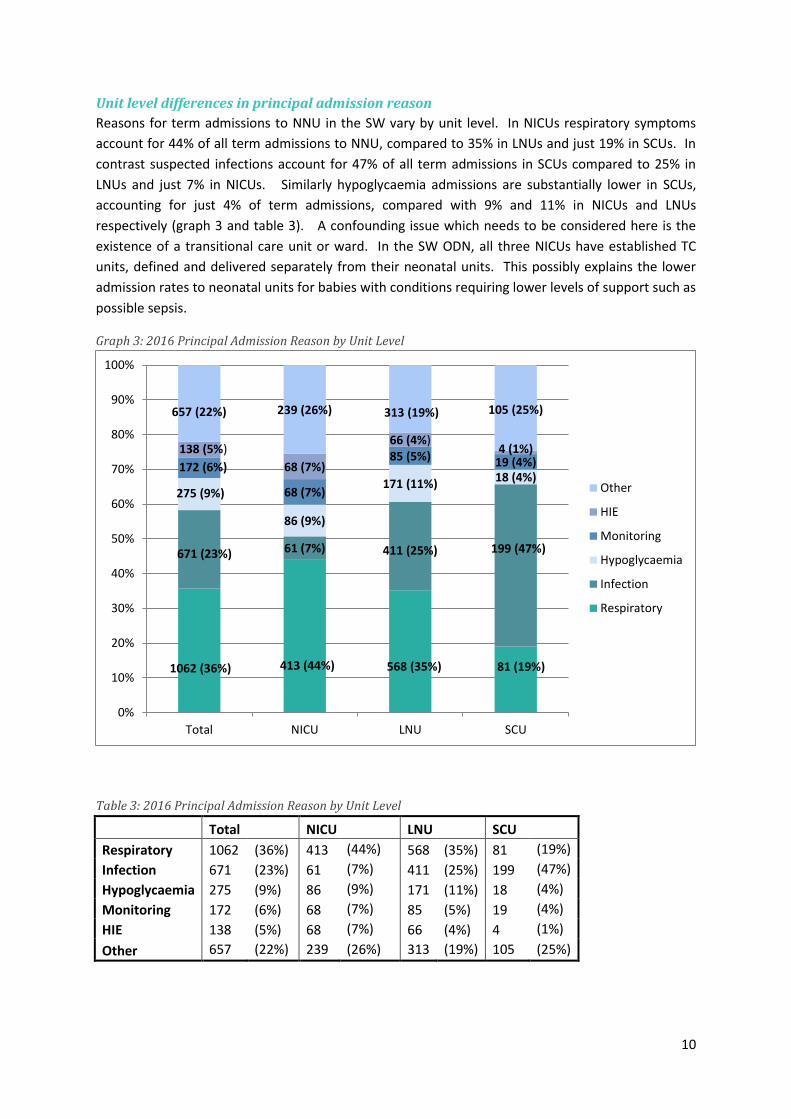
Unit level differences in principal admission reason
Reasons for term admissions to NNU in the SW vary by unit level. In NICUs respiratory symptoms
account for 44% of all term admissions to NNU, compared to 35% in LNUs and just 19% in SCUs. In
contrast suspected infections account for 47% of all term admissions in SCUs compared to 25% in
LNUs and just 7% in NICUs. Similarly hypoglycaemia admissions are substantially lower in SCUs,
accounting for just 4% of term admissions, compared with 9% and 11% in NICUs and LNUs
respectively (graph 3 and table 3). A confounding issue which needs to be considered here is the
existence of a transitional care unit or ward. In the SW ODN, all three NICUs have established TC
units, defined and delivered separately from their neonatal units. This possibly explains the lower
admission rates to neonatal units for babies with conditions requiring lower levels of support such as
possible sepsis.
Graph 3: 2016 Principal Admission Reason by Unit Level
Table 3: 2016 Principal Admission Reason by Unit Level
Total NICU LNU SCU
Respiratory 1062 (36%) 413 (44%) 568 (35%) 81 (19%)
Infection 671 (23%) 61 (7%) 411 (25%) 199 (47%)
Hypoglycaemia 275 (9%) 86 (9%) 171 (11%) 18 (4%)
Monitoring 172 (6%) 68 (7%) 85 (5%) 19 (4%)
HIE 138 (5%) 68 (7%) 66 (4%) 4 (1%)
Other 657 (22%) 239 (26%) 313 (19%) 105 (25%)
1062 (36%) 413 (44%) 568 (35%) 81 (19%)
671 (23%) 61 (7%) 411 (25%) 199 (47%)
275 (9%)
86 (9%)
171 (11%) 18 (4%) 172 (6%)
68 (7%)
85 (5%) 19 (4%) 138 (5%)
68 (7%)
66 (4%) 4 (1%)
657 (22%) 239 (26%) 313 (19%) 105 (25%)
0%
10%
20%
30%
40%
50%
60%
70%
80%
90%
100%
Total NICU LNU SCU
Other
HIE
Monitoring
Hypoglycaemia
Infection
Respiratory

11
5.2 Treatment Levels for SW Term Admissions to NNU In 2016 term admissions to NNUs received varying levels of treatment during their neonatal care
period that have been categorised as follows:
None
Observations only
Limited - only treatments that could potentially be provided on transitional care or post-natal wards
including:
IV antibiotics
NG or OG feeding
IV fluids
Some – required at least one treatment that is typically only available on NNU including:
Any respiratory support
Any cooling
Parenteral Nutrition
Across the SW 12% of term admissions to NNU (n=358) received no treatment other than
observations during their neonatal care period. A further 48% (n=1425) of term admissions received
only treatments that could potentially have been provided on a TC or PW ward (chart 1).
Chart 1: 2016 NNU Term Admissions by level of treatment received
None, 358 (12%)
Limited, 1425 (48%)
Some, 1193 (40%)
12
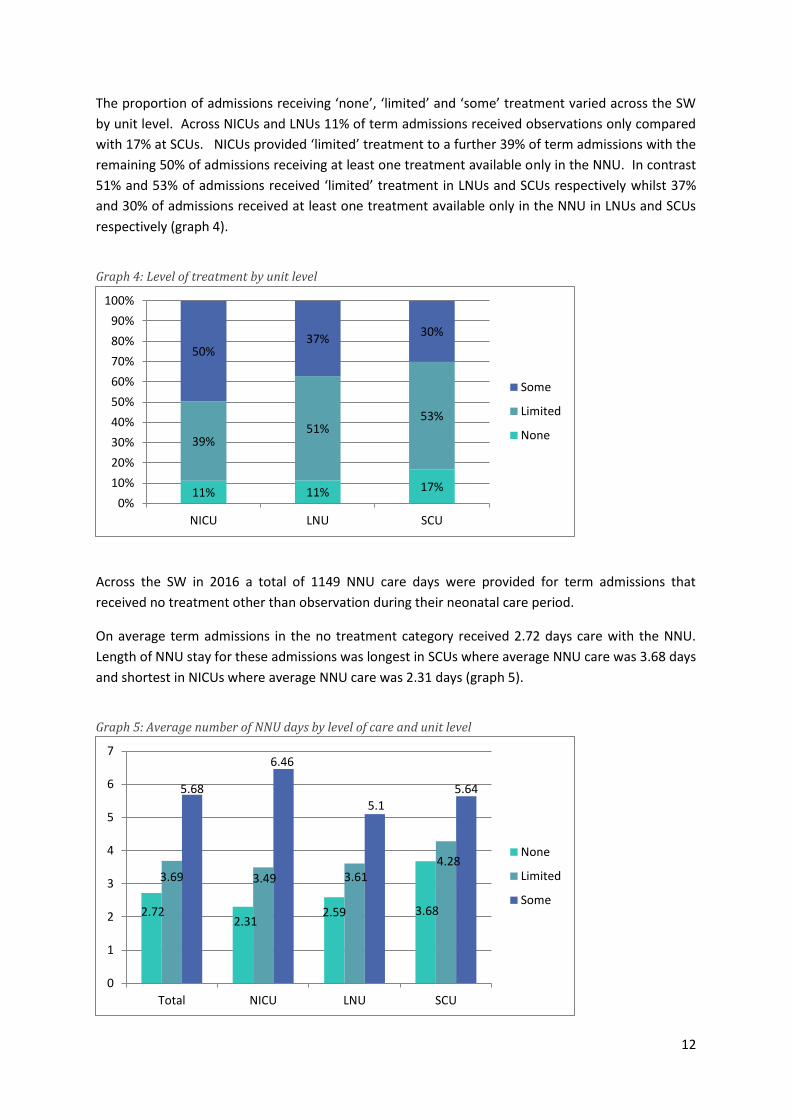
The proportion of admissions receiving ‘none’, ‘limited’ and ‘some’ treatment varied across the SW
by unit level. Across NICUs and LNUs 11% of term admissions received observations only compared
with 17% at SCUs. NICUs provided ‘limited’ treatment to a further 39% of term admissions with the
remaining 50% of admissions receiving at least one treatment available only in the NNU. In contrast
51% and 53% of admissions received ‘limited’ treatment in LNUs and SCUs respectively whilst 37%
and 30% of admissions received at least one treatment available only in the NNU in LNUs and SCUs
respectively (graph 4).
Graph 4: Level of treatment by unit level
Across the SW in 2016 a total of 1149 NNU care days were provided for term admissions that
received no treatment other than observation during their neonatal care period.
On average term admissions in the no treatment category received 2.72 days care with the NNU.
Length of NNU stay for these admissions was longest in SCUs where average NNU care was 3.68 days
and shortest in NICUs where average NNU care was 2.31 days (graph 5).
Graph 5: Average number of NNU days by level of care and unit level
11% 11% 17%
39% 51%
53%
50% 37%
30%
0%
10%
20%
30%
40%
50%
60%
70%
80%
90%
100%
NICU LNU SCU
Some
Limited
None
2.72 2.31
2.59 3.68
3.69 3.49 3.61 4.28
5.68
6.46
5.1
5.64
0
1
2
3
4
5
6
7
Total NICU LNU SCU
None
Limited
Some
13
6. South West Top Five Reasons for Term Admissions to NNU – Further
Analysis
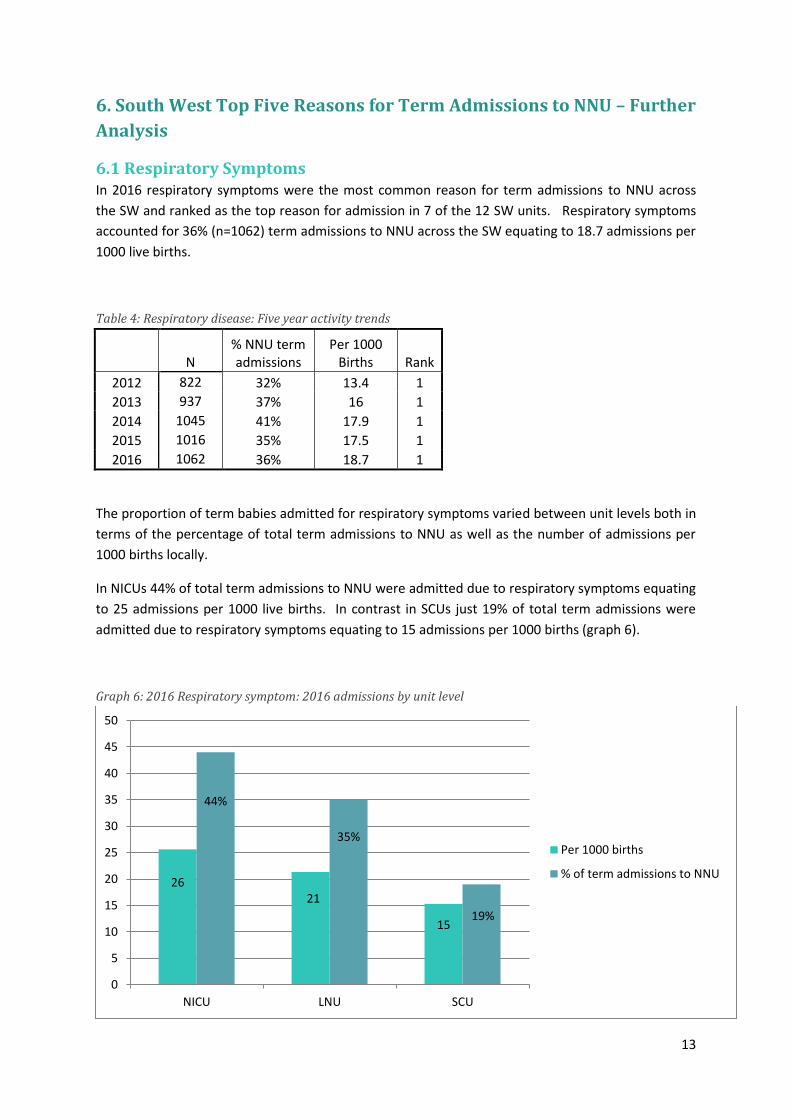
6.1 Respiratory Symptoms In 2016 respiratory symptoms were the most common reason for term admissions to NNU across
the SW and ranked as the top reason for admission in 7 of the 12 SW units. Respiratory symptoms
accounted for 36% (n=1062) term admissions to NNU across the SW equating to 18.7 admissions per
1000 live births.
Table 4: Respiratory disease: Five year activity trends
N
% NNU term admissions
Per 1000 Births Rank
2012 822 32% 13.4 1
2013 937 37% 16 1
2014 1045 41% 17.9 1
2015 1016 35% 17.5 1
2016 1062 36% 18.7 1
The proportion of term babies admitted for respiratory symptoms varied between unit levels both in
terms of the percentage of total term admissions to NNU as well as the number of admissions per
1000 births locally.
In NICUs 44% of total term admissions to NNU were admitted due to respiratory symptoms equating
to 25 admissions per 1000 live births. In contrast in SCUs just 19% of total term admissions were
admitted due to respiratory symptoms equating to 15 admissions per 1000 births (graph 6).
Graph 6: 2016 Respiratory symptom: 2016 admissions by unit level
26 21
15
44%
35%
19%
0
5
10
15
20
25
30
35
40
45
50
NICU LNU SCU
Per 1000 births
% of term admissions to NNU
14
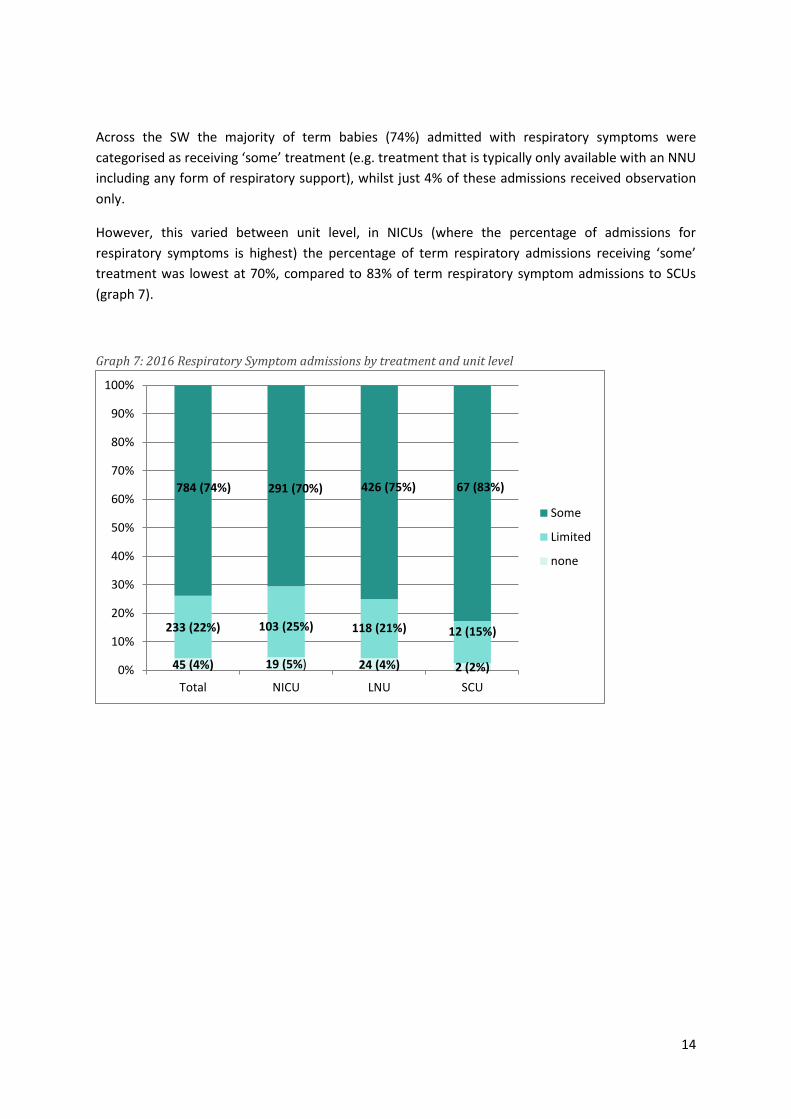
Across the SW the majority of term babies (74%) admitted with respiratory symptoms were
categorised as receiving ‘some’ treatment (e.g. treatment that is typically only available with an NNU
including any form of respiratory support), whilst just 4% of these admissions received observation
only.
However, this varied between unit level, in NICUs (where the percentage of admissions for
respiratory symptoms is highest) the percentage of term respiratory admissions receiving ‘some’
treatment was lowest at 70%, compared to 83% of term respiratory symptom admissions to SCUs
(graph 7).
Graph 7: 2016 Respiratory Symptom admissions by treatment and unit level
45 (4%) 19 (5%) 24 (4%) 2 (2%)
233 (22%) 103 (25%) 118 (21%) 12 (15%)
784 (74%) 291 (70%) 426 (75%) 67 (83%)
0%
10%
20%
30%
40%
50%
60%
70%
80%
90%
100%
Total NICU LNU SCU
Some
Limited
none
15
6.2 Suspected Infection In 2016 suspected infection was the second most common reason for term admission to NNU across
the South West accounting for 23% of all term admissions to NNU (n=671) and equating to 11.8
admissions per 1000 births.
This is a dramatic rise since 2012 where just 1 baby was admitted with suspected infection across
the region. Suspected infection was the most common reason for admission in all 5 units where
respiratory symptoms were ranked the second highest reason for admission. Jointly respiratory
symptoms and suspected infections accounted for nearly 60% of all term admissions to NNU in the
SW, and as discussed previously, it is possible that there is considerable overlap between these two
diagnostic criteria. A change on this scale in terms of recorded incidence cannot be explained by
changes in disease incidence alone, indeed there is not biologically plausible mechanism that would
explain an increase in the rate of underlying bacterial infection in the same population for infants
over such a short time frame. It seems the increasing rate of babies with suspected sepsis is likely to
be explained by a number of extraneous factors such as changes in clinical practise (NICE guidance)
changes in service delivery (more babies being admitted to NICUs rather than cared for on the PN
wards) and changes in coding (coding babies as being admitted to record activity as PN ward extra
workload is not as reliably recorded or remunerated).
Table 5: Suspected Infection: Five year activity trends
N % NNU term admissions
Per 1000 Births Rank
2012 1 0% 0 17
2013 0 0% 0 19
2014 92 4% 1.6 4
2015 572 20% 9.9 2
2016 671 23% 11.8 2
Suspected infection admissions to NNU differ between unit levels accounting for 6.5% of all NICU
term admissions, 25.4% of all LNU term admissions and 46.7% of SCU term admissions. Similarly
there was a substantial difference in terms of proportion of live births with 3.8, 15.4 and 37.5
admissions per 1000 live births local to NICUs, LNUs and SCUs respectively (graph 8).

16
Graph 8: 2016 Suspected Infection: 2016 admissions by unit level
The majority of term admissions for suspected infection (80%, n=537) across the SW were
categorised as receiving ‘limited’ treatment (e.g. treatments that could potentially be provided on TC
or PN wards) (graph 9) largely explained by the use of IV antibiotic (chart 2).
Graph 9: 2016 Suspected Infection admissions by treatment and unit level
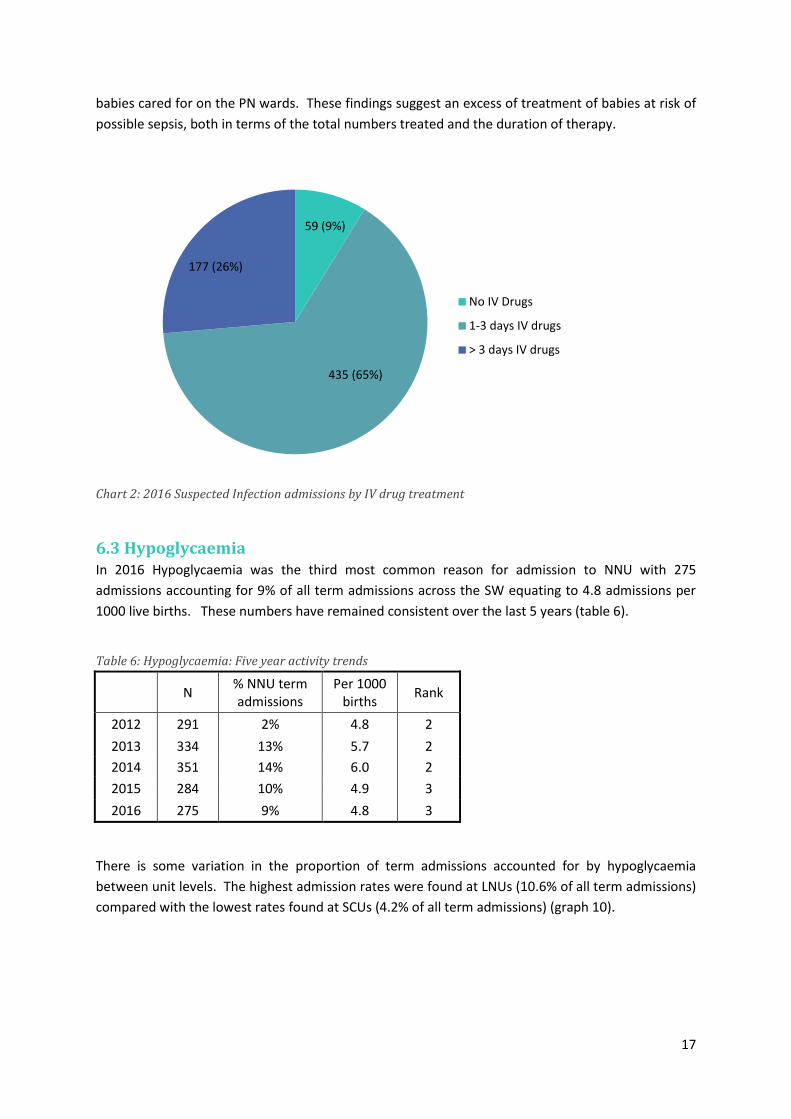
In total 9% (n=59) of SW babies admitted to NNU for suspected infection were not started on IV
antibiotics. Of the remaining 91% the majority (79% n=435) received just 1-3 days of IV antibiotics
indicating that no infection was found. Finally 26% were treated for more than 3 days. This is 5
times greater than the proportion predicted to have early onset sepsis as the national average is 0.5
per 1000 babies. Furthermore this figure does not take into account the additional 9 times more
3.8
15.4
37.5
6.5%
25.4%
46.7%
0
5
10
15
20
25
30
35
40
45
50
NICU LNU SCU
Per 1000 births
% of termadmissions to NNU
46 (7%) 9 (15%)
30 (7%) 7 (4%)
537 (80%) 41 (67%) 334 (81%) 162 (81%)
88 (13%) 11 (18%) 47 (11%) 30 (15%)
0%
10%
20%
30%
40%
50%
60%
70%
80%
90%
100%
Total NICU LNU SCU
Some
Limited
None
17
babies cared for on the PN wards. These findings suggest an excess of treatment of babies at risk of
possible sepsis, both in terms of the total numbers treated and the duration of therapy.
Chart 2: 2016 Suspected Infection admissions by IV drug treatment
6.3 Hypoglycaemia In 2016 Hypoglycaemia was the third most common reason for admission to NNU with 275
admissions accounting for 9% of all term admissions across the SW equating to 4.8 admissions per
1000 live births. These numbers have remained consistent over the last 5 years (table 6).
Table 6: Hypoglycaemia: Five year activity trends
N
% NNU term admissions
Per 1000 births
Rank
2012 291 2% 4.8 2
2013 334 13% 5.7 2
2014 351 14% 6.0 2
2015 284 10% 4.9 3
2016 275 9% 4.8 3
There is some variation in the proportion of term admissions accounted for by hypoglycaemia
between unit levels. The highest admission rates were found at LNUs (10.6% of all term admissions)
compared with the lowest rates found at SCUs (4.2% of all term admissions) (graph 10).
59 (9%)
435 (65%)
177 (26%)
No IV Drugs
1-3 days IV drugs
> 3 days IV drugs

18
Graph 10: 2016 Hypoglycaemia: 2016 admissions by unit level
In total 13% (n=36) of babies admitted for Hypoglycaemia across the SW received observation only
with 79% (n=216) receiving ‘limited’ treatment (e.g. only treatment that could potentially be
provided in a TC or PN ward) and just 8% (n=23) receiving at least one treatment typically only
provided in NNU. This varied slightly between unit levels in particular in SCUs where 33% of
hypoglycaemia term admissions received observation only. However it should be noted that total
numbers of hypoglycaemia term admissions to SCUs were very low (n=18) (graph 11).
Graph 11: 2016 Hypoglycaemia admissions by treatment and unit level
5.7 5.3
6.4
3.4
9.2% 9.2%
10.6%
4.2%
0.0
2.0
4.0
6.0
8.0
10.0
12.0
Total NICU LNU SCU
Per 1000 Births
% of termadmissions to NNU
36 (13%) 8 (9%) 22 (13%)
6 (33%)
216 (79%) 65 (76%)
140 (82%)
11 (61%)
23 (8%) 13 (15%)
9 (5%) 1 (6%)
0%
10%
20%
30%
40%
50%
60%
70%
80%
90%
100%
Total NICU LNU SCU
Some
Limited
None
19
6.4 Monitoring In 2016 monitoring was the fourth most common reason for term admission to NNU across the
South West accounting for 6% of all term admissions to NNU (n=172) and equating to 3 admissions
per 1000 live births. This is a substantial increase since 2012 where just 2 babies were admitted for
monitoring across the region (table 7).
Table 7: Monitoring: Five year activity trends
N % NNU term admissions
Per 1000 births
Rank
2012 2 (0%) 0.03 16
2013 9 (0%) 0.15 15
2014 38 (1%) 0.65 10
2015 172 (6%) 2.96 4
2016 172 (6%) 3.03 4
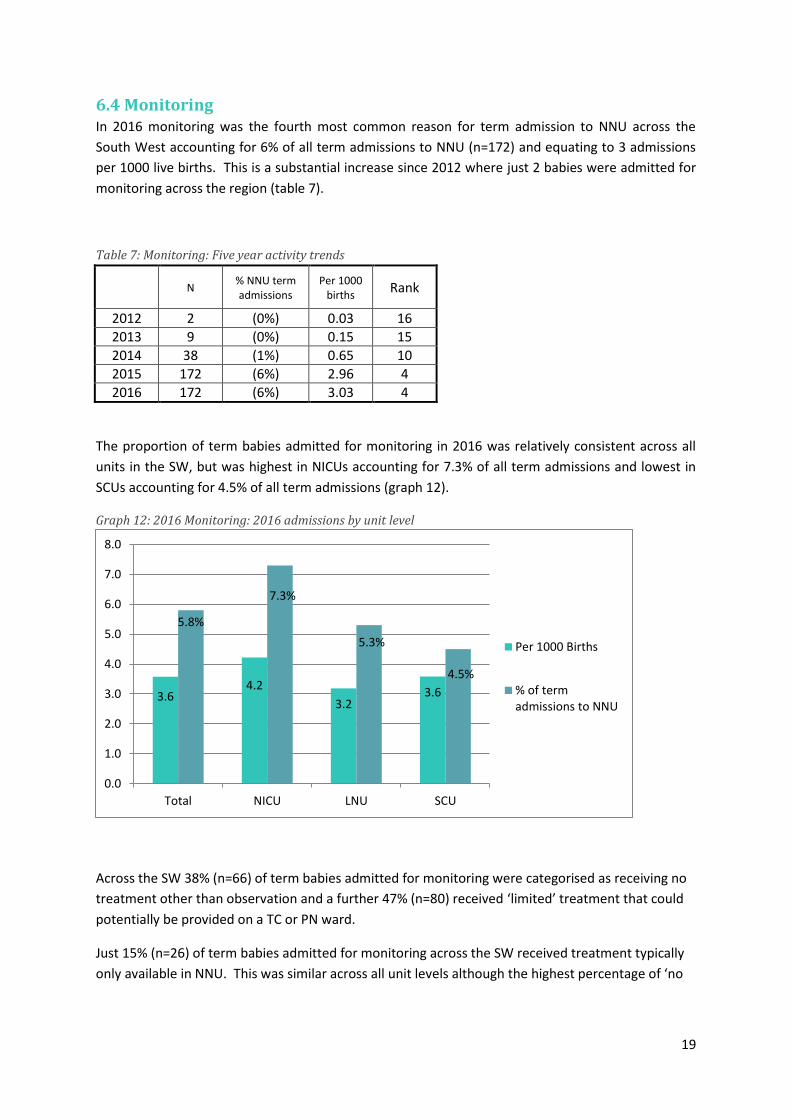
The proportion of term babies admitted for monitoring in 2016 was relatively consistent across all
units in the SW, but was highest in NICUs accounting for 7.3% of all term admissions and lowest in
SCUs accounting for 4.5% of all term admissions (graph 12).
Graph 12: 2016 Monitoring: 2016 admissions by unit level
Across the SW 38% (n=66) of term babies admitted for monitoring were categorised as receiving no
treatment other than observation and a further 47% (n=80) received ‘limited’ treatment that could
potentially be provided on a TC or PN ward.
Just 15% (n=26) of term babies admitted for monitoring across the SW received treatment typically
only available in NNU. This was similar across all unit levels although the highest percentage of ‘no
3.6 4.2
3.2 3.6
5.8%
7.3%
5.3%
4.5%
0.0
1.0
2.0
3.0
4.0
5.0
6.0
7.0
8.0
Total NICU LNU SCU
Per 1000 Births
% of termadmissions to NNU

20
treatment’ (47%) was recorded for SCUs compared with lowest percentage of ‘no treatment’ (34%)
at NICUs (graph 13).
Graph 13: 2016 Monitoring admissions by treatment and unit level
6.5 Suspected HIE In 2016 suspected HIE was the fifth most common reason for term admission to NNU across the
South West accounting for 5% of all term admissions to NNU (n=138) and equating to 2.4 admissions
per 1000 births. This is a substantial increase since 2012 where just 1 baby was admitted for
suspected HIE across the region (table 8).
Table 8: HIE: Five year activity trends
N
% NNU term Admissions
Per 1000 births
Rank
2012 1 0% 0.02 17
2013 3 0% 0.05 17
2014 5 0% 0.09 17
2015 128 4% 2.21 5
2016 138 5% 2.43 5
Term admissions for suspected HIE were highest in NICUs in 2016 accounting for 7.3% of all term
admissions and equating to 4.2 admissions per 1000 births. In contrast suspected HIE accounted for
<1% of term admissions to SCUs equating to 0.8 admissions per 1000 births.
66 (38%) 23 (34%) 34 (40%) 9 (47%)
80 (47%) 32 (47%) 43 (51%) 5 (26%)
26 (15%) 13 (19%) 8 (9%) 5 (26%)
0%
10%
20%
30%
40%
50%
60%
70%
80%
90%
100%
Total NICU LNU SCU
Some
Limited
None

21
Graph 14: 2016 HIE: 2016 admissions by unit level
Across the SW 9% (n=12) of term babies admitted for suspected HIE received no treatment other
than monitoring compared with 53% (n=73) receiving at least one treatment typically only provided
in NNU.
Graph 15: 2016 HIE admissions by treatment and unit level
2.9
4.2
2.5
0.8
4.6%
7.3%
4.1%
0.9% 0.0
1.0
2.0
3.0
4.0
5.0
6.0
7.0
8.0
Total NICU LNU SCU
Per 1000 Births
% of termadmissions to NNU
12 (9%) 5 (7%) 6 (9%) 1 (25%)
53 (38%) 27 (40%) 26 (39%) 0
73 (53%) 36 (53%) 34 (52%) 3 (75%)
0%
10%
20%
30%
40%
50%
60%
70%
80%
90%
100%
Total NICU LNU SCU
Some
Limited
None
22
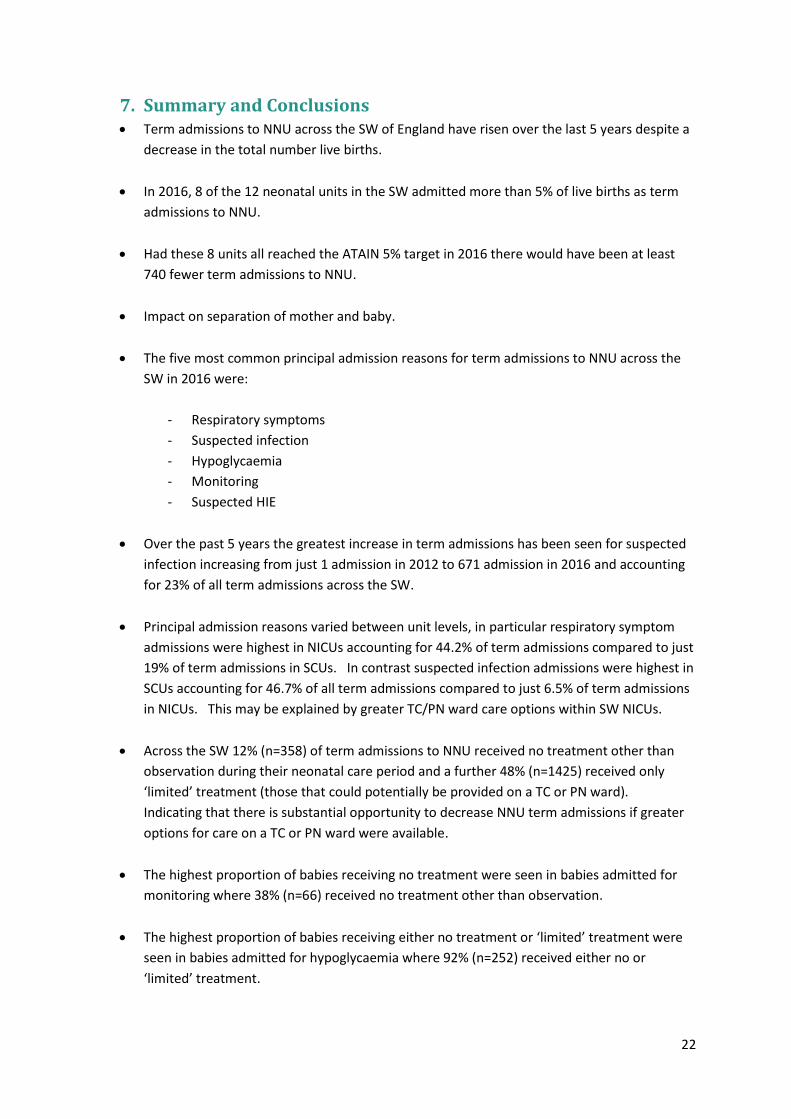
7. Summary and Conclusions Term admissions to NNU across the SW of England have risen over the last 5 years despite a
decrease in the total number live births.
In 2016, 8 of the 12 neonatal units in the SW admitted more than 5% of live births as term
admissions to NNU.
Had these 8 units all reached the ATAIN 5% target in 2016 there would have been at least
740 fewer term admissions to NNU.
Impact on separation of mother and baby.
The five most common principal admission reasons for term admissions to NNU across the
SW in 2016 were:
- Respiratory symptoms
- Suspected infection
- Hypoglycaemia
- Monitoring
- Suspected HIE
Over the past 5 years the greatest increase in term admissions has been seen for suspected
infection increasing from just 1 admission in 2012 to 671 admission in 2016 and accounting
for 23% of all term admissions across the SW.
Principal admission reasons varied between unit levels, in particular respiratory symptom
admissions were highest in NICUs accounting for 44.2% of term admissions compared to just
19% of term admissions in SCUs. In contrast suspected infection admissions were highest in
SCUs accounting for 46.7% of all term admissions compared to just 6.5% of term admissions
in NICUs. This may be explained by greater TC/PN ward care options within SW NICUs.
Across the SW 12% (n=358) of term admissions to NNU received no treatment other than
observation during their neonatal care period and a further 48% (n=1425) received only
‘limited’ treatment (those that could potentially be provided on a TC or PN ward).
Indicating that there is substantial opportunity to decrease NNU term admissions if greater
options for care on a TC or PN ward were available.
The highest proportion of babies receiving no treatment were seen in babies admitted for
monitoring where 38% (n=66) received no treatment other than observation.
The highest proportion of babies receiving either no treatment or ‘limited’ treatment were
seen in babies admitted for hypoglycaemia where 92% (n=252) received either no or
‘limited’ treatment.

23
CONTACT DETAILS
South West Neonatal Operational Delivery Network
Level C, St Michaels Hospital
Southwell Street
Bristol BS2 8EG
Telephone: 0117 3421738
Email: [email protected]
Website: www.swneonatalnetwork.co.uk
Twitter: @swneonatal
24
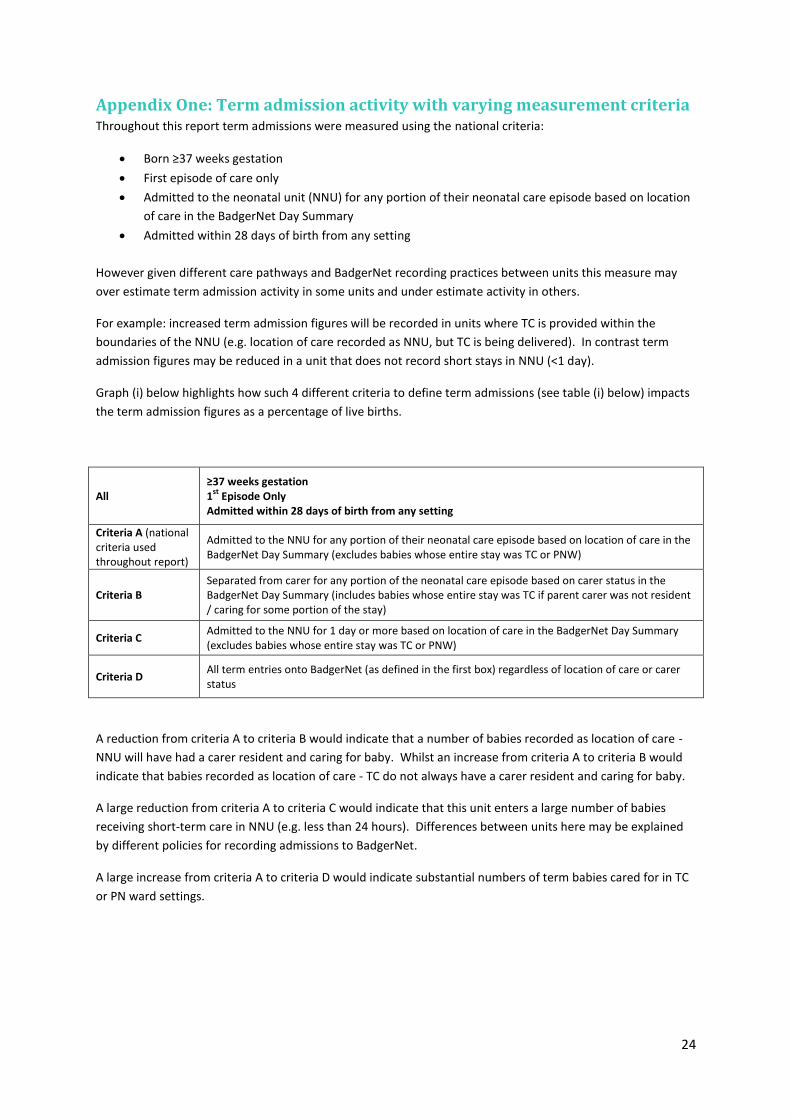
Appendix One: Term admission activity with varying measurement criteria Throughout this report term admissions were measured using the national criteria:
Born ≥37 weeks gestation
First episode of care only
Admitted to the neonatal unit (NNU) for any portion of their neonatal care episode based on location
of care in the BadgerNet Day Summary
Admitted within 28 days of birth from any setting
However given different care pathways and BadgerNet recording practices between units this measure may
over estimate term admission activity in some units and under estimate activity in others.
For example: increased term admission figures will be recorded in units where TC is provided within the
boundaries of the NNU (e.g. location of care recorded as NNU, but TC is being delivered). In contrast term
admission figures may be reduced in a unit that does not record short stays in NNU (<1 day).
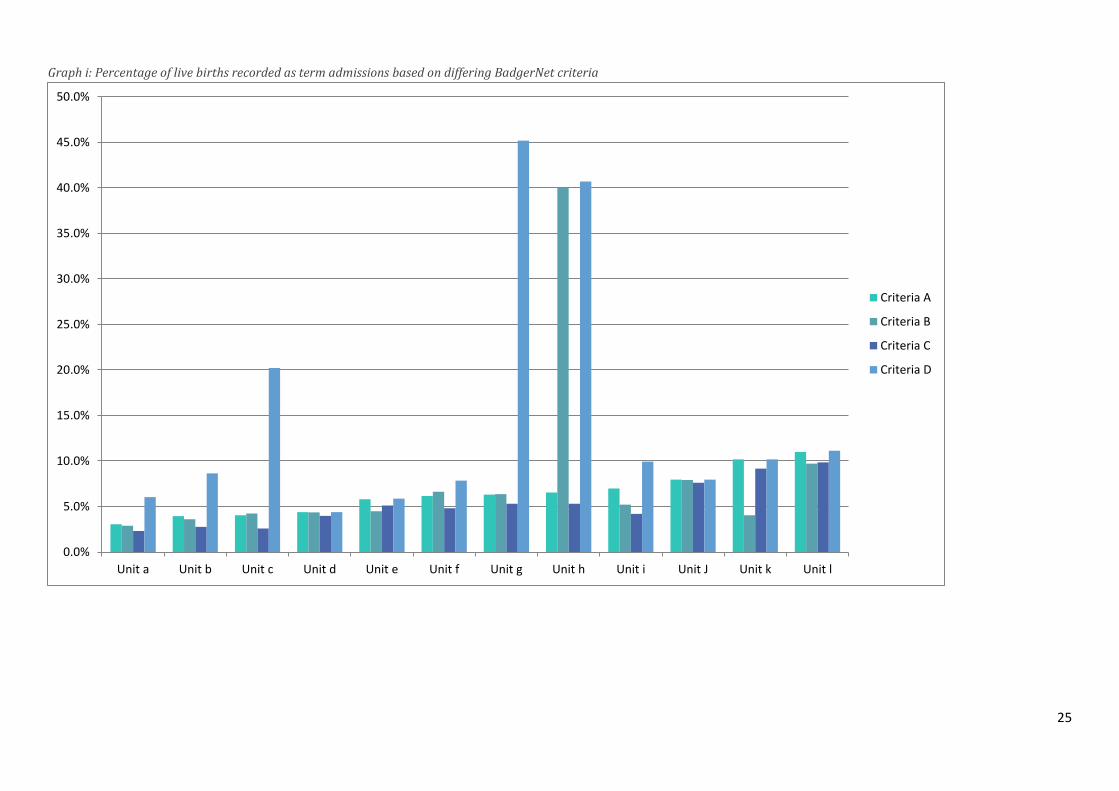
Graph (i) below highlights how such 4 different criteria to define term admissions (see table (i) below) impacts
the term admission figures as a percentage of live births.
All ≥37 weeks gestation 1
st Episode Only
Admitted within 28 days of birth from any setting
Criteria A (national criteria used throughout report)
Admitted to the NNU for any portion of their neonatal care episode based on location of care in the BadgerNet Day Summary (excludes babies whose entire stay was TC or PNW)
Criteria B Separated from carer for any portion of the neonatal care episode based on carer status in the BadgerNet Day Summary (includes babies whose entire stay was TC if parent carer was not resident / caring for some portion of the stay)
Criteria C Admitted to the NNU for 1 day or more based on location of care in the BadgerNet Day Summary (excludes babies whose entire stay was TC or PNW)
Criteria D All term entries onto BadgerNet (as defined in the first box) regardless of location of care or carer status
A reduction from criteria A to criteria B would indicate that a number of babies recorded as location of care -
NNU will have had a carer resident and caring for baby. Whilst an increase from criteria A to criteria B would
indicate that babies recorded as location of care - TC do not always have a carer resident and caring for baby.
A large reduction from criteria A to criteria C would indicate that this unit enters a large number of babies
receiving short-term care in NNU (e.g. less than 24 hours). Differences between units here may be explained
by different policies for recording admissions to BadgerNet.
A large increase from criteria A to criteria D would indicate substantial numbers of term babies cared for in TC
or PN ward settings.
25
Graph i: Percentage of live births recorded as term admissions based on differing BadgerNet criteria
0.0%
5.0%
10.0%
15.0%
20.0%
25.0%
30.0%
35.0%
40.0%
45.0%
50.0%
Unit a Unit b Unit c Unit d Unit e Unit f Unit g Unit h Unit i Unit J Unit k Unit l
Criteria A
Criteria B
Criteria C
Criteria D
26
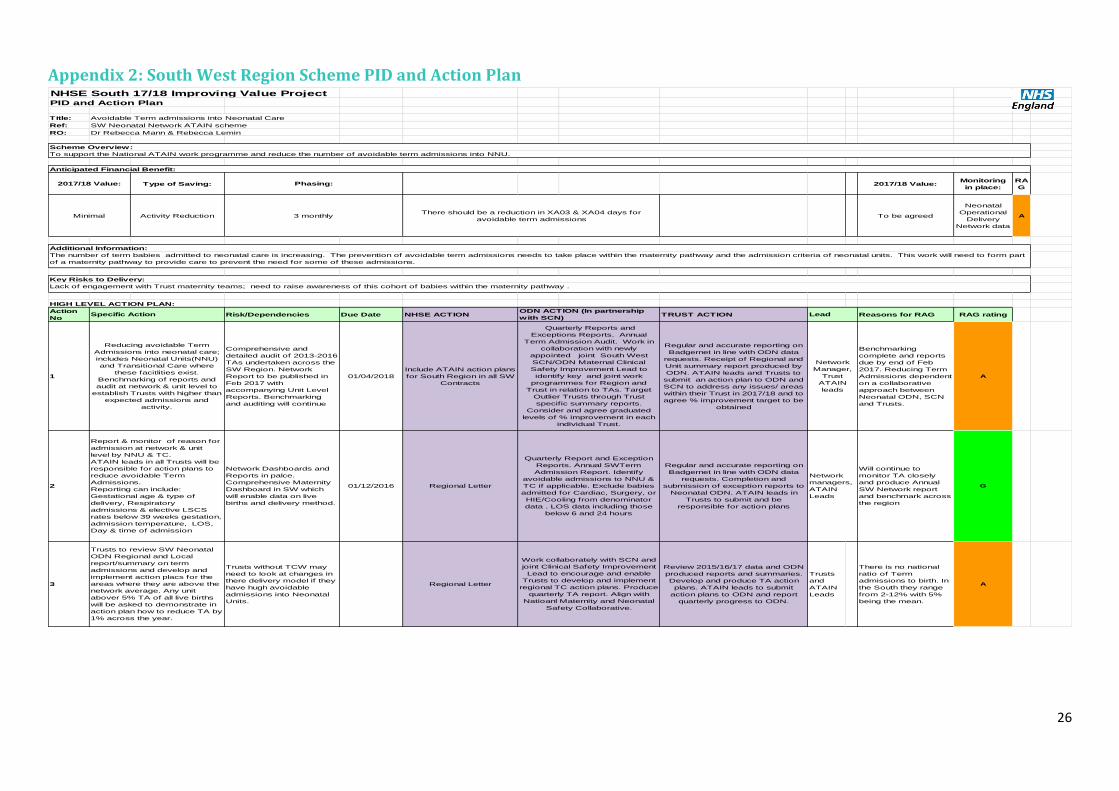
Appendix 2: South West Region Scheme PID and Action Plan
NHSE South 17/18 Improving Value ProjectPID and Action Plan
Title: Avoidable Term admissions into Neonatal Care
Ref: SW Neonatal Network ATAIN scheme
RO: Dr Rebecca Mann & Rebecca Lemin
Type of Saving: 2017/18 Value:Monitoring
in place:
RA
G
Activity Reduction To be agreed
Neonatal
Operational
Delivery
Network data
A
HIGH LEVEL ACTION PLAN:
Action
NoRisk/Dependencies Due Date NHSE ACTION TRUST ACTION Reasons for RAG RAG rating
1
Comprehensive and
detailed audit of 2013-2016
TAs undertaken across the
SW Region. Network
Report to be published in
Feb 2017 with
accompanying Unit Level
Reports. Benchmarking
and auditing will continue
01/04/2018
Include ATAIN action plans
for South Region in all SW
Contracts
Regular and accurate reporting on
Badgernet in line with ODN data
requests. Receipt of Regional and
Unit summary report produced by
ODN. ATAIN leads and Trusts to
submit an action plan to ODN and
SCN to address any issues/ areas
within their Trust in 2017/18 and to
agree % improvement target to be
obtained
Benchmarking
complete and reports
due by end of Feb
2017. Reducing Term
Admissions dependent
on a collaborative
approach between
Neonatal ODN, SCN
and Trusts.
A
2
Network Dashboards and
Reports in palce.
Comprehensive Maternity
Dashboard in SW which
will enable data on live
births and delivery method.
01/12/2016 Regional Letter
Regular and accurate reporting on
Badgernet in line with ODN data
requests. Completion and
submission of exception reports to
Neonatal ODN. ATAIN leads in
Trusts to submit and be
responsible for action plans
Will continue to
monitor TA closely
and produce Annual
SW Network report
and benchmark across
the region
G
3
Trusts without TCW may
need to look at changes in
there delivery model if they
have hugh avoidable
admissions into Neonatal
Units.
Regional Letter
Review 2015/16/17 data and ODN
produced reports and summaries.
Develop and produce TA action
plans. ATAIN leads to submit
action plans to ODN and report
quarterly progress to ODN.
Trusts
and
ATAIN
Leads
There is no national
ratio of Term
admissions to birth. In
the South they range
from 2-12% with 5%
being the mean.
A
Reducing avoidable Term
Admissions into neonatal care;
includes Neonatal Units(NNU)
and Transitional Care where
these facitlities exist.
Benchmarking of reports and
audit at network & unit level to
establish Trusts with higher than
expected admissions and
activity.
Quarterly Reports and
Exceptions Reports. Annual
Term Admission Audit. Work in
collaboration with newly
appointed joint South West
SCN/ODN Maternal Clinical
Safety Improvement Lead to
identify key and joint work
programmes for Region and
Trust in relation to TAs. Target
Outlier Trusts through Trust
specific summary reports.
Consider and agree graduated
levels of % improvement in each
individual Trust.
Network
Manager,
Trust
ATAIN
leads
Report & monitor of reason for
admission at network & unit
level by NNU & TC.
ATAIN leads in all Trusts will be
responsible for action plans to
reduce avoidable Term
Admissions.
Reporting can include:
Gestational age & type of
delivery, Respiratory
admissions & elective LSCS
rates below 39 weeks gestation,
admission temperature, LOS,
Day & time of admission
Quarterly Report and Exception
Reports. Annual SWTerm
Admission Report. Identify
avoidable admissions to NNU &
TC if applicable. Exclude babies
admitted for Cardiac, Surgery, or
HIE/Cooling from denominator
data . LOS data including those
below 6 and 24 hours
Network
managers,
ATAIN
Leads
Trusts to review SW Neonatal
ODN Regional and Local
report/summary on term
admissions and develop and
implement action placs for the
areas where they are above the
network average. Any unit
abover 5% TA of all live births
will be asked to demonstrate in
action plan how to reduce TA by
1% across the year.
Work collaborately with SCN and
joint Clinical Safety Improvement
Lead to encourage and enable
Trusts to develop and implement
regional TC action plans. Produce
quarterly TA report. Align with
Natioanl Maternity and Neonatal
Safety Collaborative.
Additional Information:
The number of term babies admitted to neonatal care is increasing. The prevention of avoidable term admissions needs to take place within the maternity pathway and the admission criteria of neonatal units. This work will need to form part
of a maternity pathway to provide care to prevent the need for some of these admissions.
Key Risks to Delivery:
Lack of engagement with Trust maternity teams; need to raise awareness of this cohort of babies within the maternity pathway .
Specific ActionODN ACTION (In partnership
with SCN) Lead
Minimal 3 monthlyThere should be a reduction in XA03 & XA04 days for
avoidable term admissions
Scheme Overview:
To support the National ATAIN work programme and reduce the number of avoidable term admissions into NNU.
Anticipated Financial Benefit:
2017/18 Value: Phasing:

27
4
Units / Microbiology & ICT
practices. Support regional
audit of all term babies in
SW who received
antibiotics against
international tool
Kaiserpermante Sepis
Calculator. Will identify
those Trusts with high rates
of admission.
01/06/2017
Regional Letter and to
receive and assess any
SW proposal to move
away from NICE antibiotic
guidelines.
To participate in the audit being
undertaken in the Network. To
engage in discussions around any
future development and adoption
of a region wider policy. To ensure
that babies where possible receive
care besides their mother.
Requires completion
of audit and buy in to
its outcomes. Lack of
TWC in some Trusts.
A
5
All Trusts asked to
nominate ATAIN leads in
July 2016. Work with
Maternity SCN and Clinical
Improvement Lead to
further this programme
01/04/2017 Regional Letter
Trusts to identify and appoint Atain
leads as specified by the National
Safety Collaborative: 1 Consultant
Obstetrician, 1 Senior Midwifery
lead , 1 Neonatal Consultant, I
Senior Neonatal Nurse . To
engage with the ODN and SCN to
implement improvement
programmes and share best
practice across the region.
Required
Implementation
supported by NHS
England and
Roadshows delivered
by ODNs
A
6
All Trusts sent details of
the e-learning in July 2016.
Work with SCN and Clinical
Improvement Lead to
integrate this into
mandatory training within
Trusts. Part of Safer Births
Initiative.
01/03/2018 Regional Letter
Trusts to include the e-learning tool
as part of their mandatory training
and report to ODN and SCN on
rollout and compliance within Trusts
www.nlmscontent.nesc
.nhs.uk/scsha/062016_
RATA/index.htm
A
7
ODN to undertake regular
analyse to identify re-
admitted babies. NHSE to
align badgernet data with
charging data.
01/04/2017
NHS England to write
clause into contract if
agreed.
Trusts to adhere to National
Neonatal Service Specification in
relation re-admissions to NICU.
Trusts to not seek renumerication
from NHSE for babies that sit
outside the pathway for Neonatal
Care ( e.g admitted back to NICU
post discharge) Trusts to not
include these patients on
Badgernet .
Ensuring change in
recording and payment
practice in relation to
re-admissions
dependent on NHSE
and ODN working in
partnership to align
activity and finance
data and to ensures its
compliance across
Trusts
R
8
ODN to circulate NNMDS
to all Units for use in
regards to data set
definitions Ensure that
outlier Trusts in the SW are
brought back into line with
the national average.
01/04/2017
NHSE to ensure that
NNMDS form part of
contracts for 17/18.
Monitor compliance to
contract.
Trusts to adopt and adhere to
NNMDS as published in 2016.
Adherence to NNMDS
dependent on NHSE
and ODN working in
partnership to align
activity and finance
data and to ensures its
compliance across
Trusts
R
Ensure that all units in the South
West comply with and record in
line with the NNMDS(NNational
Neonatal Minimum Data Set)
published in 2016. Adherence to
nationally agreed definitions and
data set to provide clarity as to
what babies currently on TC or
postnatal wards can be entered
into the Badgernet database.
Improve data entry in badgernet
across all units in relation to
location of care, presence of
carer and treatment being
received. The ODN is aware
that not all units in the South
West adhere to the NNMDS so
compliance with NNMDS should
realise NHSE cost savings
ODN take NNMBS through
Executive ODN boards. ODN to
circulate criteria to all clinical
teams. ODN to montior
compliance to contract for NHSE
through badgernet.
NHS
England/N
et Manager
and ODN
Clinical
Lead.
Mandatory completion of the
TV&WX Avoidable Term
Admission e learning
tool(RCPCH accredited). Trusts
to introduce training & report no
of clinical staff who have
completed e-learning package
Work with Maternity SCN to
support the introduction of the
ATAIN e-learning tool. Audit
compliance by Trusts.
NHS
England/
Trusts
South West re-admissions from
home: Realign the charging of
babies in NICU that do not fall
into the National Neonatal
Service Specification. This
namely means ensuring that all
term babies that are readmitted
post discharge from the
communicty to Neonatal Units
are not paid for under a
Neonatal Specialist Tariff by
NHSE Specialised
Commissioning. In the South
West in 2015/16 a total of 402
babies were readmitted from
home to a NICU. This equated
to approximately 1467 care
days and using reference cost
data calculates at approximately
£600,000 additional spend for
NHSE
ODN to inform clinical teams
across the region of enforcement
of Neonatal Pathway as
contained within the National
Neonatal Servcie Specification.
ODN to undertake regular audit of
re admissions from the
community, to monitor progress
and to inform NHSE of those
babies that fall outside contract.NHS
England/
Network
Manager
Identified ATAIN leads in all
Trusts & leading ATAIN
programme, working with the
Maternity & Neonatal Networks.
ODN to request information from
Trusts and link and work
collaboratively with ATAIN leads.
Network
Manager/
Trusts
Use of IV antibiotics based on
NICE guidance using NICE
audit tool, specific projects with
Trusts with high numbers of
admissions for suspected
infection.
Areas for review: where the
babies receive care, LOS, who
delivers care, administration of
IV AB's, availability of results.
South ODN Work Programme
2017 /18. Use audit to inform
regional discussion in relation to
Network wide antibiotic policy /
NICE implementation. Develop
regional guideline/ approach if felt
necessary. Work with Maternity
SCN to understand antibiotic use
and admission across the SW
more widely and to promote baby
being cared for alongside mother.
ODN
Clinical
leads
28
Appendix 3: South West Neonatal Network
Avoiding Term Neonatal Admissions into Neonatal Units (ATAIN) QIPP
2017/18 Action Plans
As part of the implementation of the Avoiding Term Neonatal Admissions into Neonatal Units (ATAIN) QIPP, Trusts are asked to complete and submit an
action plan which sets out their plans for reducing avoidable term neonatal admissions throughout 2017/18. These action plans will identify areas for
improvement as addressed within the unit specific term admission reports that have been produced and circulated by the South West Neonatal Network in
April 2017. These action plans should be developed collaboratively by the following:
Consultant Obstetricians
Senior Midwifery Leads
Neonatal Consultants
Senior Neonatal Nurses
ATAIN Leads (If different from above)
These action plans will form the basis upon which the South West Neonatal Network monitors and measures progress against the Avoiding Term Neonatal
Admissions in Neonatal Units (ATAIN) QIPP on behalf of NHS England (South). Progress reports will be requested quarterly from Trusts and term admission
specific dashboards will be developed and distributed by the Network. Please complete and return to:
South West Neonatal Network
Level C, Rm C061
St Michaels Hospital
Southwell Street, Bristol
BS2 8EG
Or email: [email protected]

29
Avoiding Term Neonatal Admissions into Neonatal Units (ATAIN) QIPP 2017/2018 ACTION PLAN
Aim/Objectives Action Nominated Lead Outcome/Success Criteria Evidence
30
Appendix 4: South West Neonatal Network
Avoiding Term Neonatal Admissions into Neonatal Units (ATAIN) QIPP
Resources Directory
South West Resources Links to National, Regional and Local Term Admissions documents and resources:
www.swneonatalnetwork.co.uk
Resources to support clinical review of term admissions For more information and guidance on clinical reviews go to:
https://improvement.nhs.uk/resources/reducing-admission-full-term-babies-neonatal-units/
Reducing Term Admissions E –Learning Tool (Mandatory Training in South West from April
2017)
https://www.hee.nhs.uk/hee-your-area/wessex/our-work/research-
innovation/elearning/mobile-learning/reducing-avoidable-term-admissions
Resources to support prevention, identification and management of
neonatal hypoglycaemia Anticipation and identification of ‘at risk’ babies:
www.cqc.org.uk/sites/default/files/20160707_babyclinicalrisks_web.pdf
www.bapm.org/publications/documents/guidelines/NEWTT%20framework%20final%20for
%20website.pdf
Implementation of the BAPM Newborn Early Warning Trigger and Track (NEWTT) tool:
www.cqc.org.uk/sites/default/files/20160707_babyclinicalrisks_web.pdf
www.bapm.org/publications/documents/guidelines/NEWTT%20framework%20final%20for
%20website.pdf
Prevention and management of neonatal hypoglycaemia outlined in UNICEF BFI
www.unicef.org.uk/BabyFriendly/Resources/Guidance-for-Health-Professionals/
Ensuring adequate feeding support is in place for all babies:
www.unicef.org.uk/BabyFriendly/Resources/Guidance-for-Health-Professionals/
www.nice.org.uk/guidance/cg132/chapter/1-guidance#care-of-the-baby-born-by-cs
Avoiding hypothermia after birth through appropriate thermal care including skin-to-skin
contact:
www.unicef.org.uk/BabyFriendly/Resources/Guidance-for-Health-Professionals/
Responsive attitudes to maternal concerns regarding feeding and/or infant wellbeing:
www.rcm.org.uk/sites/default/files/Emotional%20Wellbeing_Guide_WEB.pdf
Implement the BFI standards to achieve and maintain UNICEF Baby Friendly accreditation
(Unicef 2011))
Recommendations following the thematic review of litigation claims (Hawdon et al 2016):
http://fn.bmj.com/content/early/2016/08/23/archdischild-2016-310936.fulll
www.nhsla.com/Safety/Documents/Did_you_know_NHSLA_Neonatal_Hypo_Flyer.pdf

31
BAPM Framework for Practice: Identification and Management of Neonatal Hypoglycaemia
in the Full Term Infant
Resources to support prevention, identification and management of
neonatal jaundice Targeted assessment of jaundice in the first few days of life according to NICE guideline CG
98:Jaundice in new born babies under 28 days:
www.nice.org.uk/guidance/cg98
Implementation of the BAPM NEWTT tool:
www.cqc.org.uk/sites/default/files/20160707_babyclinicalrisks_web.pdf
www.bapm.org/publications/documents/guidelines/NEWTT%20framework%20final%20for
%20website.pdf
Postnatal care:
www.nice.org.uk/guidance/cg37/evidence
Resources to support prevention, identification and management of
respiratory symptoms Highlighting the increased risk of admission to a neonatal unit for babies born before 39
weeks associated with elective caesarean:
www.nice.org.uk/guidance/cg132/chapter/1-guidance
Care of the baby born by CS:
www.nice.org.uk/guidance/cg132/chapter/1-guidance#care-of-the-baby-born-by-cs
Implementation of the BAPM NEWTT tool:
www.cqc.org.uk/sites/default/files/20160707_babyclinicalrisks_web.pdf
www.bapm.org/publications/documents/guidelines/NEWTT%20framework%20final%20for
%20website.pdf
Postnatal care:
www.nice.org.uk/guidance/cg37/evidence
Avoiding hypothermia after birth through appropriate thermal care including skin-to-skin
contact:
www.unicef.org.uk/BabyFriendly/Resources/Guidance-for-Health-Professionals/
Responsive attitudes to maternal concerns about infant wellbeing:
http://fn.bmj.com/content/early/2016/08/23/archdischild-2016-310936.full
Royal College of Midwives Maternal Emotional Wellbeing and Infant Development: a good
practice guide for midwives:
www.rcm.org.uk/sites/default/files/Emotional%20Wellbeing_Guide_WEB.pdf
Resources to support mother–baby bonding, breastfeeding and
neonatal thermoregulation Promoting skin to skin between mother and baby as soon as possible after delivery:
www.unicef.org.uk/BabyFriendly/Resources/Guidance-for-Health-Professionals/
www.nice.org.uk/guidance/cg37/evidence
32
Discouraging early interruption (within two hours of birth) of skin-to-skin contact as this
reduces the chances of early breastfeeding:
www.unicef.org.uk/BabyFriendly/Resources/Guidance-for-Health-Professionals/
Evidence-based breastfeeding support and advice:
www.unicef.org.uk/BabyFriendly/Resources/Guidance-for-Health-Professionals/
www.nice.org.uk/guidance/cg37/evidence
Responsive attitudes to maternal concerns about infant wellbeing:
http://fn.bmj.com/content/early/2016/08/23/archdischild-2016-310936.full
Resources to support the reduction of maternal-infant separation
Family Integrated Care Models (FICare) as a model or keeping mother and baby together
even if an admission is necessary.
http://familyintegratedcare.com/
http://www.mountsinai.on.ca/education/patient-and-family-education/family-integrated-care-
training-module-ficare/family-integrated-care-training-module-ficare
http://www.bbc.co.uk/news/uk-39444127#
Evaluation of the FICare model
http://bmcpediatr.biomedcentral.com/articles/10.1186/s12887-015-0527-0
Promoting the role of the mother in the caring of the NICU infant
https://www.unicef.org.uk/babyfriendly/

33
Appendix 5: South West Neonatal Network
Avoiding Term Neonatal Admissions into Neonatal Units (ATAIN) QIPP
SW NHS Trusts ATAIN Leads
As part of the implementation of the Avoiding Term Neonatal Admissions into Neonatal Units
(ATAIN) QIPP that NHS England (South) is delivering in partnership with the South West Neonatal
Network in 2017/18, Trusts are asked to nominate the following ATAIN Leads. Please complete and
return to:
South West Neonatal Network Level C, Rm C061 St Michaels Hospital Southwell Street, Bristol BS2 8EG Or email: [email protected]
Atain Leads Nominated Name Contact details (including address, email and phone
number)
Consultant Obstetrician
Senior Midwifery Lead
Neonatal Consultant
Senior Neonatal Nurse
34
Appendix 6: South West Neonatal Network
Avoiding Term Neonatal Admissions into Neonatal Units (ATAIN) QIPP
SW NHS Trusts Case Study Template
This Case Study template enables the submission of information to the South West Neonatal Operational Delivery Network to highlight local practice and initiatives that have improved the delivery and outcomes of Neonatal Care across the South West Region. Please do not include any patient identifiable information in this template. Please return all submissions to: South West Neonatal Network Level C, Rm C061 St Michaels Hospital Southwell Street Bristol BS2 8EG Or email to [email protected]
Lead Contact
Case study title
Name of organisation
Contact details of the author of this case study
Name Tel E-mail
Background
Details about your Trust and the environment in which the initiative took place
What was the issue / problem being addressed?
Overview of the problem and its impact on patient care and outcomes

35
Aim/ Intended Outcomes
Outline of your main aims and objectives for the initiative
Action Taken
Overview of what you did to address the problem
Results
Summary of the benefits realised by implementing your solution – on both the part of the NHS, patients and wider stakeholders
Sustainability
How sustainable is this improvement?
Lessons Learnt
Challenges/barriers that arose during implementation and critical factors to success. What would you do differently next time?
Date completed / Last updated
Are you happy for this to be shared on the South West Neonatal Networks Website?

36
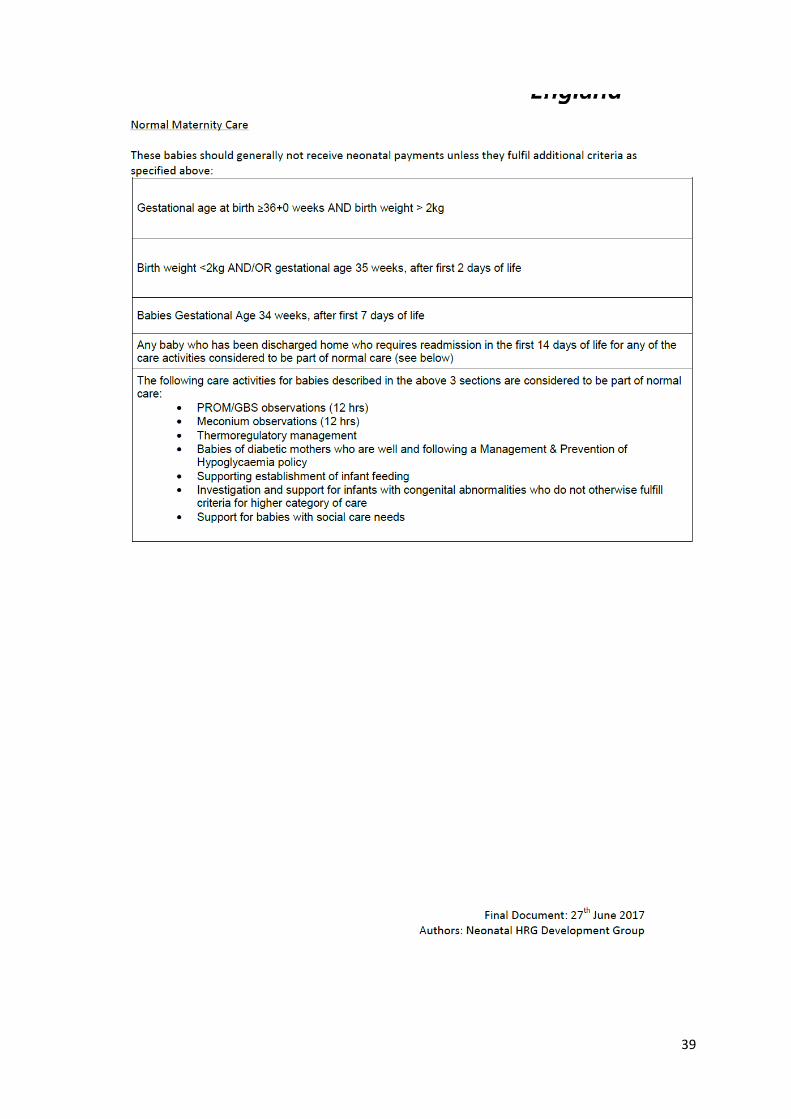
Appendix 7: Neonatal Critical Care Mandatory Data Set (NNMDS)
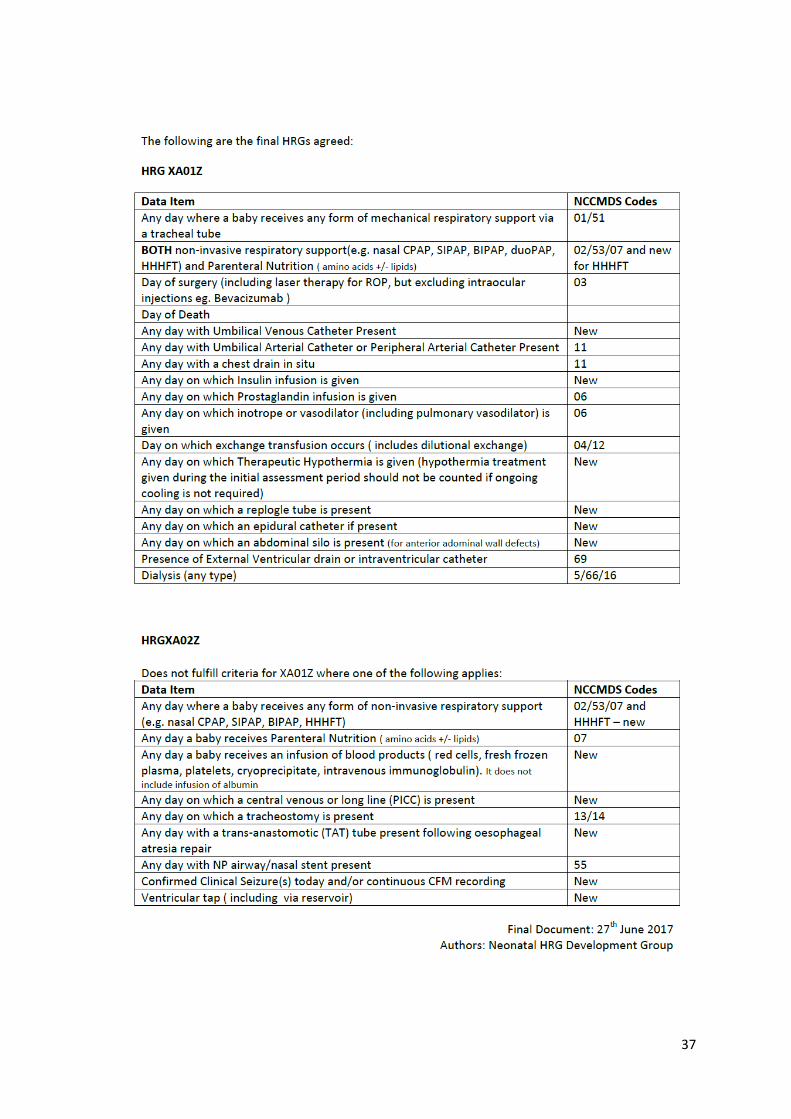
37

38
39

0
3/1/2017