Sources of structural change: Industrial Evolution of ...
27
Paper to be presented at the 35th DRUID Celebration Conference 2013, Barcelona, Spain, June 17-19 Sources of structural change: Industrial Evolution of Swedish Municipalities 1994-2010 Matte Hartog Utrecht University [email protected] Frank Neffke Harvard University [email protected] Ron Boschma Lund University, Utrecht University [email protected] Martin Henning Lund University [email protected] Abstract Regional economies are subject to a never-ending process of creative destruction, which was identified by Joseph Schumpeter as the driving force behind economic development. This paper investigates the drivers of structural change of local economies. We analyze changes in the industrial composition of 287 Swedish municipalities between 1994 and 2010. We find that the industrial portfolios of municipalities are organized around skill-related activities, and that the rise and fall of local industries between 1994 and 2010 does not really alter the skill cohesion of the local economies. On the one hand, the skill cohesion of municipalities is reinforced by the decline and exit of existing plants and product-switching behavior of plants. Employment lost in plant decline and exits is concentrated in industries that are underembedded skill-wise in local economies. Product-switching plants tend to switch to industries that are much better
Transcript of Sources of structural change: Industrial Evolution of ...

Paper to be presented at the
35th DRUID Celebration Conference 2013, Barcelona, Spain, June 17-19
Sources of structural change: Industrial Evolution of Swedish
Municipalities 1994-2010Matte Hartog
Utrecht University
Frank NeffkeHarvard University
Ron BoschmaLund University, Utrecht University
Martin HenningLund University
AbstractRegional economies are subject to a never-ending process of creative destruction, which was identified by JosephSchumpeter as the driving force behind economic development. This paper investigates the drivers of structural changeof local economies. We analyze changes in the industrial composition of 287 Swedish municipalities between 1994 and2010. We find that the industrial portfolios of municipalities are organized around skill-related activities, and that the riseand fall of local industries between 1994 and 2010 does not really alter the skill cohesion of the local economies. On theone hand, the skill cohesion of municipalities is reinforced by the decline and exit of existing plants andproduct-switching behavior of plants. Employment lost in plant decline and exits is concentrated in industries that areunderembedded skill-wise in local economies. Product-switching plants tend to switch to industries that are much better

skill embedded in local economies. Decreasing local skill cohesion, in the short as well as in the long run, is inducedmainly by non-local entrepreneurs from outside municipalities. Much of the employment they generate is concentrated inindustries that are under-embedded in local economies. Hence, they infuse local economies with new skills and henceinduce structural change.
Jelcodes:O10,R11

1
Sources of Diversification and Structural Change: Industrial Evolution of Swedish Municipalities 1994-2010
Matté Hartog, Frank Neffke, Ron Boschma, Martin Henning
May 2013
Paper presented at DRUID 2013
Very preliminary version
2
1. Introduction
How new regional growth paths emerge is an important question. Regional economies are subject to a
never-ending process of creative destruction that Schumpeter (1939) identified as the driving force
behind economic development. In the long run, regions depend on their ability to create new activities
in order to offset decline and destruction in other parts of their economies. This was underlined by the
recent economic crisis, which especially hit specialized regions such as the automobile center Detroit
in the United States, highlighting the importance of the entry and development of new industries in
regions.
Systematic evidence on how new regional growth paths emerge has been found in recent research on
the diversification of economies. Hidalgo et al. (2007) found that countries are more likely to expand
and diversify into industries that are closely related to pre-existing industries. Similar evidence at the
regional level has been found by Neffke et al. (2011), Colombelli et al. (2012), Rigby (2012), Balland et
al. (2013), Essletzbichler (2013) and Boschma et al. (2013). Hence, economies tend to diversify into
activities that re-use the capabilities of the activities in which economies are already specialized.
In this paper, we conceptualize and analyze structural change in terms of changes in the skill cohesion
of regions: the entry and exit of new activities that require to some extent different skills than the pre-
existing local skill base. We investigate what the sources of structural change are, distinguishing
between the growth and decline of existing plants, the entry of new plants, and product-switching of
plants. To do so, we carry out an empirical study on structural change of local economies in Sweden
between 1994 and 2010. We use annual matched employer-employee data from Statistics Sweden
that cover all individuals in the Swedish labor force (about 4,5 million each year).
The paper is structured as follows. Section 2 elaborates on the theory of structural change. Section 3
presents the data and develops an empirical framework to analyze the extent to which the different
sources have induced diversification and structural change of local economies over time. Section 4
gives an overview of structural change in Sweden between 1994 and 2010 and presents the results of
the analysis. Section 5 ends with a conclusion.
2. Theory
How do new regional growth paths emerge? A key finding on this question of the research in the
1980s was that newly emerging industries did not necessarily arise in leading regions, but often
triggered growth and development in quite unexpected places, such as Silicon Valley in the United
States and Bavaria in Germany (e.g. Norton and Rees, 1979; Marshall, 1987; Hall and Preston, 1988;
Scott, 1988; Storper and Walker, 1989). Following this, many case studies have shown that new local
industries are often deeply rooted in related activities in the region (e.g. Bathelt and Boggs, 2003;
Glaeser, 2005; Klepper, 2007). For instance, Boschma and Wenting (2007) found that in the early
development stage of the UK automobile industry, firms had a higher survival rate when their

3
entrepreneurs had previously worked in related industries like bicycle making, coach making or
mechanical engineering, and when their regions featured a strong presence of these related
industries.
Recent studies have tried to identify systematic patterns of the diversification of economies. Hidalgo et
al. (2007) found that countries are more likely to diversify into industries that are closely related to their
existing activities. They contribute this to the fact that it is easier to produce a new product when the
capabilities (e.g. infrastructure, skills, networks, institutions, and so on) needed to produce it are
already present in a country. Using a similar approach as Hidalgo et al. (2007), research by Neffke et
al. (2011) and Boschma et al. (2013) find similar results at the regional level. They show that although
many new industries appear and old industries disappear in regions over time, the coherence of
regions in terms of capabilities hardly changes. Hence, the industrial specialization of regions is
organized around certain capabilities rather than the activities undertaken, which is in line with the
coherence and diversification of the portfolios of plants (e.g. Teece 1986, 1994). Because new
industries arise from related industries in regions through the re-combination of existing capabilities in
new activities at the regional level, structural change is found to be a highly path dependent process.
In this paper, we analyze structural change in terms of changes in the skill cohesion of regions.
Human capital is a prime resource for most firms, and it is used economy-wide, in manufacturing as
well as in service industries. This differs from the existing studies that use output-based measures to
assess inter-industry similarity in capabilities. For instance, Hidalgo et al. (2007) measure industry
relatedness by the extent to which products are exported in tandem by countries across the world,
which they argue indicates that products require similar production resources. Other studies following
Hidalgo et al. (2007) have applied similar output-based measures based on products or patents (e.g.
Neffke et al. 2011; Colombelli et al., 2012; Rigby, 2012; Balland et al. 2013; Essletzbichler, 2013;
Boschma et al., 2013).
We investigate what are the sources of structural change, which is a result of the growth, decline and
exit of pre-existing plants, new activities undertaken by pre-existing plants, and the entrance of new
plants. These sources may change the skill cohesion of regions over time. Most often, entrepreneurial
entries are regarded as sources of novelty as they commercialize on new opportunities (Acs et al.,
2009). As such, they may be vital to regional growth as they may prevent regions from ‘locking-in’ by
infusing them with new activities (Grabher, 1993, Martin and Sunley, 2006). This may especially be
true for new entrants that come from outside a region as they may be less likely to rely on existing
social networks, social conformity, norms, and so on, most of which are bounded at the local level
(e.g. Breschi and Lissoni, 2005)..
3. Methodology
3.1 Data

4
We analyze diversification and structural change in Sweden over a period of 16 years, between 1994
and 2010. We use annual matched employer-employee data that are available from Statistics Sweden
and are registered the 1st of November each year. Of every individual in the labor force (around 4,5
million on average each year), we know at which plant he or she is employed each year (except for
some workers that are assigned to multiple plants – e.g. maintenance workers) and the industry and
municipality of the corresponding plant. Every plant has a specific plant identifier and firm identifier
assigned to it by Statistics Sweden (see Andersson and Arvidsson, 2006), which allows one to follow
the plants over time regardless of changes in ownership or legal status. We know in which year a plant
is set up, when it exits, and whether plants are part of firms that own multiple plants. The industry of a
plant is defined at the 4-digit level based on the Swedish Standard Industrial Classification 1992
(astSNI92), which corresponds to the European NACE Rev. 1 classification. As the astSNI92-
classification changes slightly in 2002 to correspond to the new European NACE Rev. 1.1
classification (about 1% of the industry codes merge into one industry code or split up into multiple
industry codes), we merged some industry codes to obtain one industry classification that is valid
between 1994 and 2010. In total, 753 different 4-digit industries are distinguished.
3.2 Unit of analysis
We analyze diversification and structural change of the economies of municipalities. There are 286
Swedish municipalities in total between 1994 and 2010. They are highly independent as a majority of
the country’s income tax comes from municipality-specific taxes, and a large proportion of government
expenditures is undertaken by municipalities.
3.3 Sources of local industrial diversification
Local industrial diversification is a result of employment changes in local industries over time, which is
caused by the growth and decline of existing plants, the entry of new plants and product switching of
plants. We identify a product switch when the main industry of a plant at the 4-digit level switches
between years t and t + 1. Regarding new plants, we distinguish between entrepreneurial entries (new
plants by new firms) and expanding firm entries (new plants by existing firms). Furthermore, we
distinguish these according to where the founder(s) worked or where the parent firm was located the
year before: local entries (from the same municipality), regional entries (from the same labor market
region) and non-regional entries (from outside the labor market region). The founder of plants set up
by entrepreneurs is/are the person(s) in the new plant whose occupational status is/are identified as
the entrepreneur(s) by the national tax office. We were unable to identify the founder of 40% of
entrepreneurial plant entries, which we classify into a separate category (unknown entrepreneurs).
We focus only on the growth and decline of local industries that are open to competition from
industries elsewhere (outside of municipalities), namely ‘traded industries’ (or ‘export industries’).
These industries characterize the industrial specialization of local economies because they constitute
a region’s inter-regional competitive advantage. Contrary to traded industries, ‘local industries’ and
‘natural resource dependent industries’ are most often located in, and attracted to, municipalities
5
because of local demand (e.g. bakeries / retail shops) or natural resources (e.g. ore mining) – see
Porter (2003). Traded industries are defined as all manufacturing industries (Standard Industrial
Classification, SIC codes 1500-3999), financial intermediation industries (SIC 6500-6999), computed
and related activities (SIC 7200-7399), and other business activities (SIC 7400-7499). Defined as local
industries and natural resource dependent industries are agriculture (SIC 0-1499), electricity, water
supply and construction (SIC 4000-4999), wholesale and retail trade (SIC 5000-5999), transport,
storage and communication (SIC 6200-6419), real estate activities (SIC 7000-7199), and public
administration, education, health services and community services (SIC 7500-9999).
3.4 Inter-industry skill relatedness
We assess the degree of capability similarity between industries based on the extent to which
industries employ similar skills. We use the skill-relatedness measure developed by Neffke and
Henning (2012) and Neffke et al. (2013). The idea behind this measure is that the higher the extent to
which labor flows between two industries are excessive in comparison to a baseline, the more skill-
related those industries are. This is because individuals, to limit the destruction of their human capital
when switching jobs, tend to switch to industries that require similar skills. Hence, we do not rely on
the nested hierarchical structures of existing industrial classifications, such as the Standard Industrial
Classification. Often, the higher the number of initial digits the industries share, the more they are
regarded as being related. This approach is most often used in traditional studies on structural change
that apply some sort of accounting-based shift-and-share analysis of changes in employment or output
shares (e.g. Fabricant, 1942; Maddison, 1952; Herzog and Olsen, 1977; Knudsen, 2000). However,
little theoretical justification exists that such hierarchies necessarily reflect similarities (e.g. scope
economies) between industries.
We define two industries to be related if the labor flow between them is higher than what is expected
by chance whilst controlling for the total inflow and outflow of the industries. To calculate the measure,
we use annual labor flows in Sweden between 1994 and 1999, the beginning of the period
investigated. In this period, about 1,3 million people switched jobs, of whom about 1 million switched to
another industry. Hence, our inter-industry relatedness measure is based on 1 million job switches.
Formally, let 激痛沈珍 be the observed labor flow between industry i and industry j in year t and let
┨痛沈珍 be the fitted labor flow in the regression of 激痛沈珍 on the regressors above. Skill-relatedness from i
to j in year t, 鯨迎痛沈珍, is then defined as:
鯨迎痛沈珍 噺 調禰日乳┨
禰日乳 (1)
A value of 鯨迎痛沈珍 higher than 1 indicates that the labor flow between two industries is larger than what
is predicted from the baseline, which means that those industries are regarded as skill-related. For
instance, the “Medical practice activities” industry (SIC 8512) is found to be highly skill-related to the
“Hospital Activities” industry (SIC 8511). About 1000 people on average switch from the former to the
6
latter industry each year. Because the measure is skewed to the right (values of 0 to 0,99 indicate less
skill-relatedness than predicted, 1 corresponds to the baseline prediction, and 1 to infinity indicate
more skill-relatedness than predicted), we transform it to the interval [-1, 1] :
鯨迎痛沈珍 噺 聴眺禰日乳貸怠聴眺禰日乳袋怠 (2)
For every industry pair, we then calculate the mean of this measure across the years 1994-1999.
Hence, industry i is skill-related to industry j when the mean SR value across those years is higher
than 0. In total, 4,5% of all possible industry combinations are found to be skill-related, which is similar
to Neffke and Henning (2012).
3.5 Local embeddedness and structural change
Knowing the relatedness between all industries, we now calculate for each local traded industry the
amount of related employment in a municipality. Let 継陳沈 be the employment of traded industry i in
municipality m, then related employment is given by: 継陳沈追勅鎮 = デ 荊追勅鎮珍貯沈 岫件┸ 倹岻継陳珍 (3)
where 荊追勅鎮岫件┸ 倹岻is an indicator function that has a value of 1 if industry j is related to industry i. 継陳沈追勅鎮 is
thus the sum of local employment in industries related to industry i. Next, since we are interested in
the industries in which a municipality is specialized, we calculate the location quotient of the related
employment:
詣芸陳沈追勅鎮 噺 帳尿日認賑如【 帳尿帳日┸縄軟曇【帳縄軟曇 (4)
We call this measure local embeddedness, which we measure for every local traded industry
(industry-municipality combination). The higher the value on this measure, the higher the fit between
local traded industry i and the rest of the local economy. As this measure is skewed to the right
(relative underspecialization runs from 0 to 1 and overspecialization runs from 1 to infinity), we
transform it to the interval [-1, 1]: 詣芸 噺 挑町貸怠挑町袋怠 (5)
We are interested in the extent to which the employment gained and lost in the different sources
matches with the industrial portfolio of a municipality. For instance, if an existing firm in Gotenburg sets
up a new car manufacturing plant in Malmö in 1995 with 15 persons, the car manufacturing industry in
Malmö experiences growth in employment of 15 persons between 1994 and 1995 caused by a non-
regional expanding firm. If the car manufacturing industry in Malmö is already highly related to
7
industrial portfolio of Malmö in 1995, which is measured by the local embeddedness indicator of
equation (5), this expansion event likely increases the local industrial specialization.
To measure this, let 継陳沈聴 be the employment change associated with source S in municipality m and
traded industry i, and let 継陳鎚 be the total employment change from source S in municipality m. The
degree to which the employment change of source S matches with the pre-existing industrial portfolio
of municipality m is measured as:
警陳聴┸追勅鎮 = デ 帳尿日縄帳尿濡 詣芸ガ陳沈追勅鎮沈 (6)
The weights 帳尿日縄帳尿濡 in this match measure reflect the local traded industry’s share of the total employment
change induced by source S in municipality m. A Match measure is created for each source in each
municipality, measuring the extent to which industries that are related to the industries in which a
source creates or destroys employment are related to the industrial portfolio of the municipality. In
other words, it measures the ‘degree of newness to the local economy’ of the employment that is
created or destroyed by a source.
We calculate two baseline indices to which the Match measure above can be compared: 警陳墜栂津┸追勅鎮 = デ 帳尿日帳尿 詣芸ガ陳沈追勅鎮沈 (7)
警陳椎追墜椎┸追勅鎮 = デ 帳尿日妊認任妊帳尿妊認任妊 詣芸ガ陳沈追勅鎮沈 (8)
where 継陳沈 denotes employment of municipality m in traded industry i and 継陳沈椎追墜椎= 岾帳尿帳 峇継沈. We refer to
equation (7) as the present-employment-structure baseline. It calculates the match of a municipality’s
present employment structure with itself. In other words, the more a municipality’s employment in
traded industries is related to other industries in which a municipality is overspecialized, the higher the
score on this index. We refer to equation (8) as the proportional-employment-structure baseline. It
calculates the match of a municipality’s present employment structure with a hypothetical employment
structure where the share of each municipality’s industry is equal to the country-wide employment of
the industry, proportional to the total employment size of the municipality. This index can be reflected
as a random distribution of industrial activities across the municipalities.
The Match and baseline values can be interpreted as follows. If the value of the present-employment-
structure baseline of equation (7) is higher than the value of the proportional-employment-structure
baseline of equation (8), the industrial portfolio of a municipality is more specialized than what is
expected by chance. The industrial portfolio is then skill coherent, i.e. organized around a set of skill-
related industries. If the value of the match measures of the different sources (e.g. employment growth
8
caused by local entrepreneurs) as defined in equation (6) is lower than the value of the present-
employment-structure baseline, they induce reduce the industrial specialization of the local economy
as they introduce new activities that require different skills to the municipality. A higher Match value,
on the other hand, means that a source increases the local industrial specialization. For instance, take
a hypothetical industrial portfolio of municipality m in 1994 that is organized around office-machinery-
manufacturing industries. If the new plants set up by local entrepreneurs in municipality m between
1994 and 1995 operate mainly in aircraft-manufacturing industries (which is unrelated to office-
machine-manufacturing), the Match value of these local entrepreneurs with the economy of
municipality m in 1994 is lower than the present-employment-structure baseline of municipality m in
1994, which implies that the local entrepreneurs between 1994 and 1995 have decreased the
industrial specialization of the municipality. If these new aircraft-manufacturing plants are still operating
in 2010, the local entrepreneurs of1994-1995 have induced a long-term effect of decreasing
specialization of the local economy. In municipality m, the Match of the local economy in 1994 with the
employment in 2010 generated by plants set up by the local entrepreneurs between 1994 and 1995
would then still be lower than the present-employment-structure baseline in 1994. Structural change
has then been induced by these local entrepreneurs, which we are able to measure at a very fine-
grained level.
4. Results
4.1 Evolution of the Swedish economy, 1994-2010
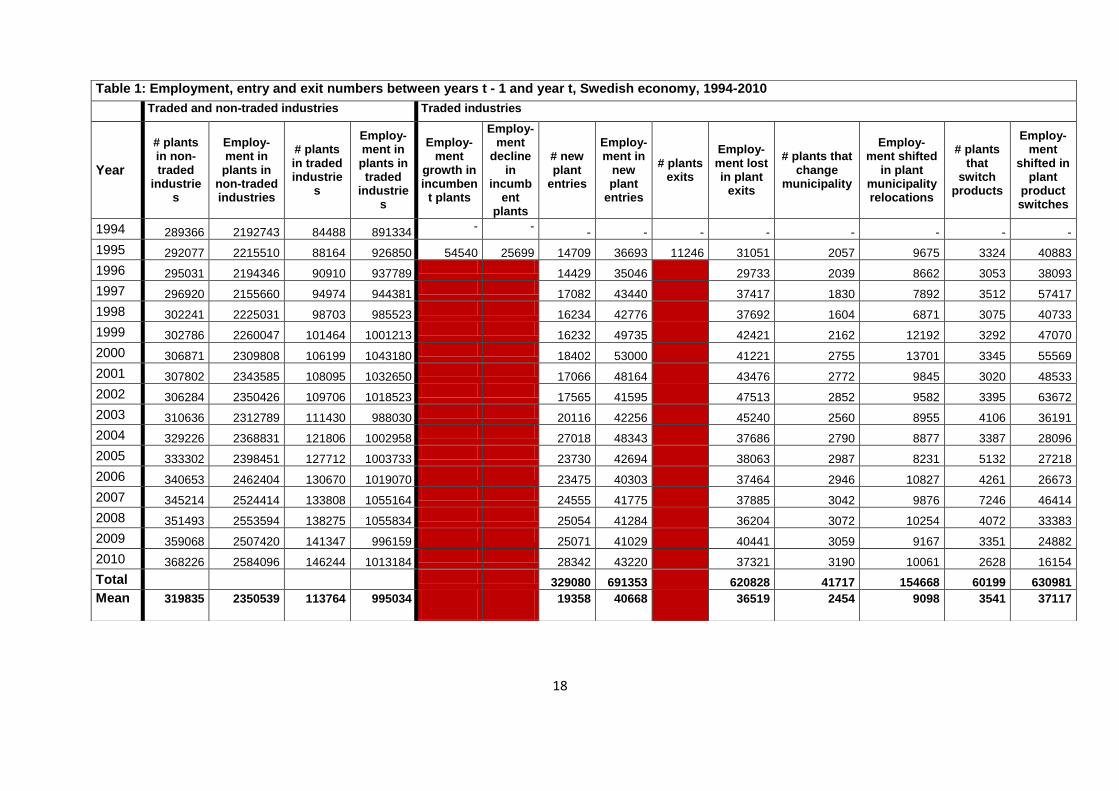
Table 1 shows annual plant and employment entry and exit rates in Sweden between 1994 and 2010.
About 25% of all existing plants each year (about 115.000 plants on average) are classified as plants
in traded industries. These plants employ about 30% of the whole labor force each year (about 1
million people). Regional diversification is a result of the employment that is created and destroyed in
traded industries in local economies each year, which amounts to about 200.000 jobs. Hence, 20% of
all employment in traded industries is re-allocated between plants each year. These are jobs involved
in the growth, decline and exits of incumbent plants, product switching and relocation of incumbent
plants, and the entry of new plants. Of all new jobs created in traded industries annually, about 60% is
created by incumbent plants and 40% by new plants. At the same time, of all jobs lost annually, about
35% is lost through employment decline in incumbent plants and 65% is lost through the exit of plants.
Each year, there are also considerable employment shifts between industries as a result of and
municipality switches (about 2500 plants, 9000 people) and product switches (about 3500 plants,
37000 people). The latter, the amount of employment that is shifted between industries as a result of
product switches of plants, is considerably large: on average, the amount of employment lost in the
original industries is about as high as the employment lost in industries as a result of plant exits, and
the amount of employment gained in the destination industries is almost as high as the employment
created by new plants.

9
<INSERT TABLE 1 ABOUT HERE> To assess the degree of diversification of the economy between 1994 and 2010, we calculate the
cosine similarity of employment shares across all industries between 1994 and subsequent years.
Hence, the reference point in every year is the industrial composition in 1994, the first year of the time
period investigated. The cosine of the angle 肯 is defined as:
ず 噺 デ 聴日┸禰韮日転迭 聴日┸迭纏纏填磐謬デ 聴日┸禰鉄韮日転迭 卑 磐謬デ 聴日┸迭纏纏填鉄韮日転迭 卑 (9)
where 鯨沈┸痛 is industry’s i share of total employment in year t and n is the total number of industries.
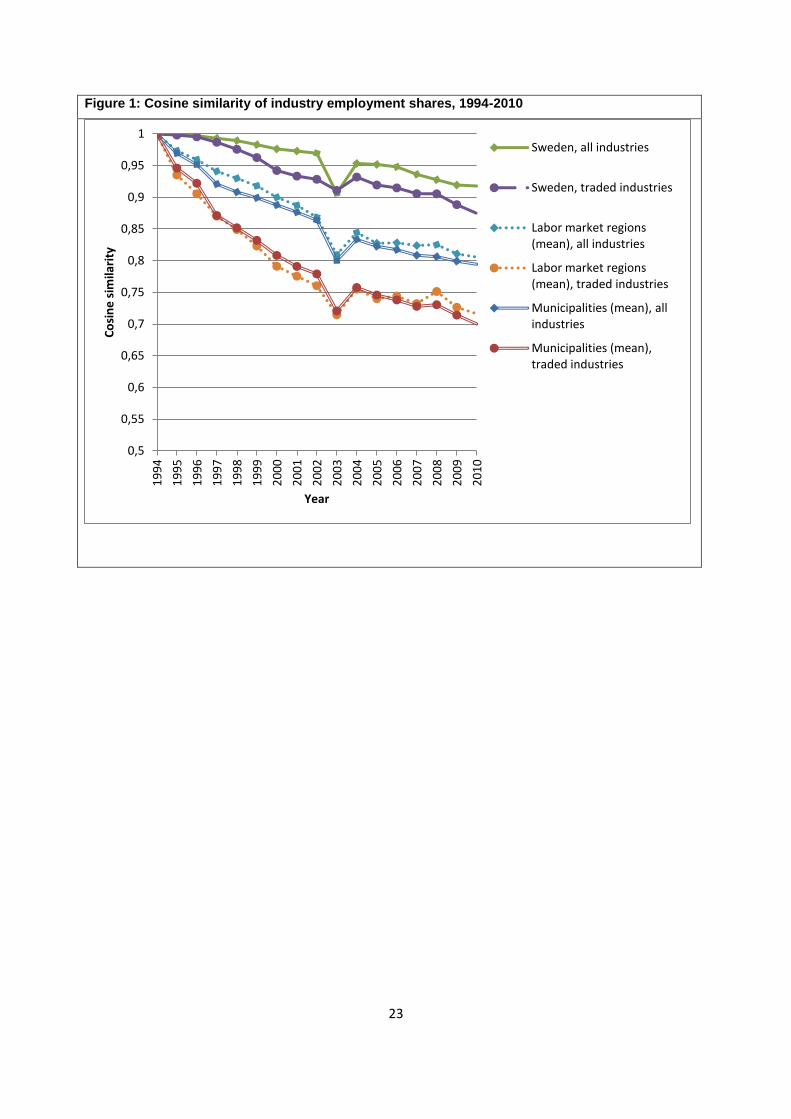
Figure 1 shows the cosine similarity of industry employment shares over time, for all industries as well
as well as for traded industries only. National industry employment shares are used to calculate the
cosine similarity for Sweden as a whole and employment shares of industry-municipality pairs are
used to calculate the cosine similarity for each municipality. For the latter, we calculated the mean
across all municipalities. In almost each subsequent year the industrial composition is more different
from the industrial composition in 1994. A relatively large deviation is visible between 2002 and 2003,
which is likely a result of the much slower GDP growth that Sweden experienced during this time in
comparison to the years before and after. The magnitude of diversification is higher in municipalities
than in the country as a whole: more employment changes take place in local industries than in
national industries.
<INSERT FIGURE 1 ABOUT HERE>
Figure 2 plots the share of local industries in 1994 and 2010 as a percentage of all local industries that
exist in each year, for all industries as well as for traded industries only. A local industry (industry-
municipality combination) ‘exists’ when it has non-zero employment. The industrial portfolio in 2010
consists for 70% of local industries that were already present in 1994. This number is lower for traded
industries, namely 64%. Taking the reverse perspective, 82% of all local industries in 2010 already
existed in 1994, and this number is 75% for traded industries. Hence, the industrial compositions of
the municipalities in terms of industry employment shares have substantially changed over time.
<INSERT FIGURE 2 ABOUT HERE>
Figure 3 shows the extent to which the industrial portfolios of municipalities are organized around
traded industries that are skill-related to the rest of the local economy, reflecting the values of the
baselines of equations (7) and (8). Across all years, the present-employment-structure baseline
(Match 1) lies well above the proportional-employment-shares baseline (Match 2). This implies that the

10
industrial portfolios of the municipalities are highly specialized, skill-coherent. This is reflected in the
red skill coherence line in the graph, which measures the absolute difference between the two
baselines. Regional industrial portfolios remain skill coherent over time: the skill coherence line
roughly follows the same horizontal curve. Hence, despite the sectoral changes that have taken place
in the local economies between 1994 and 2010, the skill coherence of the local economies has hardly
changed.
<INSERT FIGURE 3 ABOUT HERE>
4.2 Sources of diversification and structural change
We now assess the diversification that has been induced by the different sources by measuring the
extent to which they have increased or decreased the industrial specialization of the local economies
in the short run as well as in the long run. We measure the extent to which the employment created
and destroyed by them in local economies matches with the pre-existing industrial portfolio of the local
economies. We select a 5-year cohort of the sources, namely those between 1994 and 1999, and we
analyze their match with the local economies within these years (at the time of entry) as well as until
2010 (up to 16 years after entry).
Short-term impact of different sources on local economies
To determine the short-term impact of the different sources, we calculate the match at the time of entry
and exit of the different sources. This is the match of the local economies in year t with the
employment gained / lost by the different employment sources between years t and t + 1, averaged
across the years 1994-1999. For instance, we calculate the Match of the employment created by local
entrepreneurs between 1994 and 1995 (the 1st of November each year) with the local economy in
1994, then do the same for subsequent years until 1998-1999, and then we calculate the average
Match across those years. In Table 2 we report the average match value of each source and compare
it to the proportional-employment-structure baseline and present-employment-structure baseline. In
Table 3 we compare the Match values to one another. We apply paired t-tests to test whether the
Match values differ significantly from the present-employment-structure baseline (Table 2), which
indicates whether sources increase or decrease local industrial specializations, and whether the Match
values differ significantly from one another (Table 3). To be on the conservative side, we rely on and
report the two-sided p-values of the t-tests.
<INSERT TABLE 2 ABOUT HERE>
<INSERT TABLE 3 ABOUT HERE>
Incumbent plants
Employment changes in incumbent plants, in the short term, increase the existing industrial
specialization of local economies. About 55000 jobs in incumbents are gained through growth each

11
year, which is about the same number that is lost through employment decline and plant exits. The
employment lost through plant employment decline and plant exits is concentrated in local industries
that are mostly unrelated to the local economies. This can be seen from the incumbent decline and
plant exit Matches, which are significantly (p < 0,01) lower than the present-employment-structure
baseline (Table 2). Hence, as it is mostly unrelated employment that is lost through these channels,
these sources increase the specialization of local economies. The effect of plant exits is strongest as
its Match is significantly lower than the Match of incumbent plant decline (Table 3). Incumbent growth
itself decreases the local industrial specialization as its Match is lower than the present-employment-
structure baseline. This match, however, lies much closer to the present-employment-structure
baseline than the employment decline and plant exit matches, and all three matches are significantly
different from one another (Table 3). Hence, overall, the short-term effect of employment gains and
losses in incumbent plants is one of increasing specialization of local economies.
Product-switching plants
What strongly reinforces the specialization of local economies in the short term is the product
switching behaviour of plants. Plants tend to switch their production focus to industries that are much
better related to the industrial portfolio of local economies, to industries that are better related to the
industrial portfolio than the pre-existing portfolio is related to itself. As traded industries make up the
industrial portfolio of the municipalities, especially interesting is what happens in them. We find that
employment is shifted from traded industries that are mostly unrelated in local economies (the tradable
exit Match is significantly lower than the present-employment-structure-baseline) to traded industries
that are much better related in local economies (the tradable entry Match is significantly higher than
the present-employment-structure baseline). These two matches differ significantly from one another
(Table 3). On average, about 1700 plants switch between traded industries each year, with about
30000 jobs overhauled between traded industries as a result. As we noted earlier, this number is
considerably large as it is about as high as the employment that is gained and lost in traded industries
each year through new plant entries and plant exits.
New plants: local, regional and non-regional entrepreneurs and expanding firms
All different types of new entries are found to decrease the industrial specialization of local economies
in the short term. The Match values of local, regional and non-regional expanding firms and
entrepreneurs are all significantly lower than the present-employment-structure baseline (Table 2).
Entrepreneurs set up about 30 times more plants than expanding firms (14279 versus 430 plants on
average respectively) and employ about 5 times as many people as expanding firms each year (30260
versus 6433 people on average). Hence, the plants set up by expanding firms are much larger, but
entrepreneurs set up much more plants. Of all new entries, we find that most change is induced by
regional and non-regional entrepreneurs. Their Match values are significantly lower than the Match
12
values of regional and non-regional expanding firms and local entrepreneurs (Table 3)1. Hence, most
change is induced by entrepreneurial entrants from outside local economies. The amount of change
induced by local, regional and non-regional expanding firms is similar as we find no significant
differences between them.
Long-term impact of different sources on local economies
We now investigate the extent to which the different sources have induced a long-term effect of
increasing or decreasing specialization of local economies, the latter which we define as structural
change. To make claims about structural change, it is necessary to investigate not only the Match of
the employment created by the different sources at the time of entry, between years t and t + 1, but
also the Match of the employment created by them in the long run with the local economies at the time
of entry. For instance, if the employment created by regional entrepreneurs at the time of entry, which
is found to decrease the local industrial specialization, disappears in the long run, the amount of
structural change induced by regional entrepreneurs in the end is zero. Therefore, using the same
1994-1999 cohort of sources, we now analyze the extent to which the employment created by them in
the long term, until 2005 and 2010, matches with the local economies of 1994 . Hence, we now follow
the sources for up to a period of 16 years after entry. Their Match values are compared to the present-
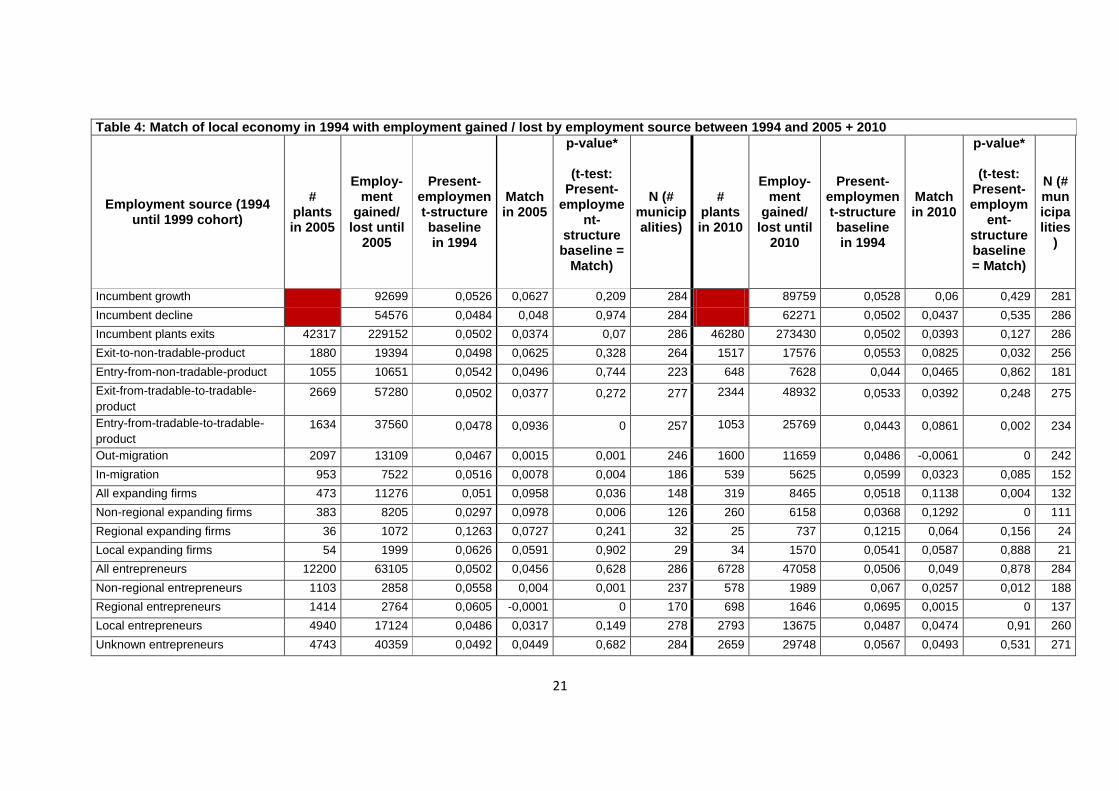
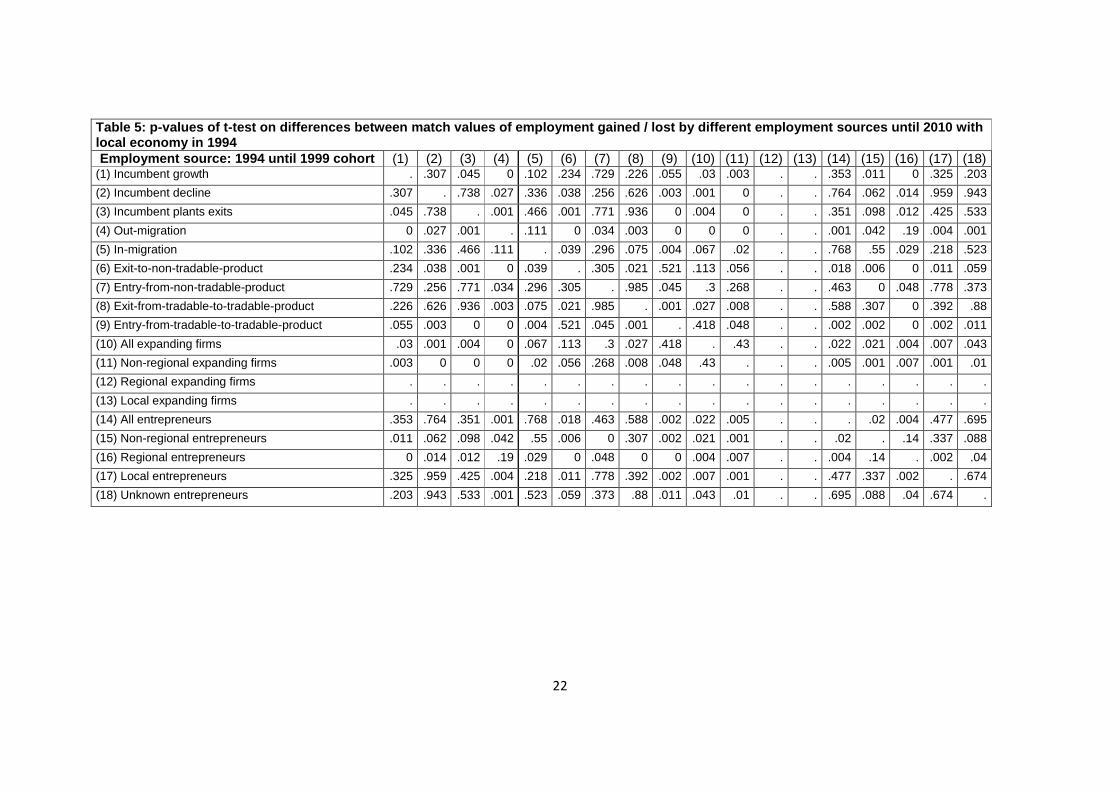
employment-structure baseline of 1994, shown in Table 4. Table 5 compares the Match values to one
another. To conserve space, Table 5 only present the p-values of the t-test that the Match values of
the sources differ from one another. When the number of observations (number of municipalities in
which a source adds or destroys employment) is lower than 30, the test is not carried out.
We find that the long-term effects of most sources, until 2005 as well as until 2010, are similar to the
short-term effects. Only the matches of the employment created by incumbent plants and plants that
switch from non-traded to traded industries are no longer found to be significantly lower than the
present-employment structure baseline. Hence, in the long term, incumbent growth is found to neither
decrease nor increase the industrial specialization of local economies. The employment in 2010 in
plants that switched products between traded industries 11 to 16 years earlier is concentrated in
industries that were highly related to the local economies in 1994. Product switching behavior thus has
a long term effect of strongly increasing the industrial specialization of local economies (the tradable
entry Match in 2005 and 2010 is significantly higher than the present-employment-structure baseline in
1994). It is the only form of local industry entry that has such an effect. As we showed earlier, the local
industry exit sources are the other causes of increasing industrial specialization (the employment lost
as a result of product switching is concentrated industries that are mostly unrelated locally, which
applies as well to the employment lost as a result of incumbent plant decline and exit, and out-
migration of plants).
1 Since we are comparing Match values of different sources to one another, the number of observations (N in Table 3) is much lower as only taken into account are municipality-year combinations in which both expansion events took place (e.g. the N of regional expanding firms versus regional entrepreneurs is 122, which means there were 122 municipality-year combinations that experienced expansion events by both regional expanding firms and regional entrepreneurs).

13
Structural change is induced mainly by non-regional entrepreneurs from outside local economies.
Their Match values in 2005 and 2010 are significantly lower than the present employment structure
baseline in 1994. The employment created by local entrepeneurs until 2005 and 2010 still matches
closely with the existing structure at the time of entry (the Match value is not significantly different from
the present-employment-structure baseline). The same effect is found for local expanding firms in the
long term. Outside entrepreneurs set up more plants, employ more people overall, and are present in
more local economies than non-regional expanding firms. The plants of outside expanding firms are
much larger in terms of people employed and are located in much fewer municipalities.
5. Conclusion
The question of how new regional growth paths emerge receives increasing attention, by policy
makers as well as by scientists. Regional economies are subject to a never-ending process of creative
destruction, which was identified by Joseph Schumpeter as the driving force behind economic
development. In the long run, regions depend on their ability to create new activities in order to offset
decline and destruction in other parts of their economies. In this paper we investigate the different
sources of employment gains and losses that increase the industrial specialization of local economies
on the one hand, and induce structural change on the other hand. We analyze the drivers responsible
for the changes in the industrial composition of all Swedish municipalities between 1994 and 2010.
We find that the industrial portfolios of municipalities are organized around skill-related activities, and
that the rise and fall of local industries between 1994 and 2010 does not really alter the skill cohesion
of the local economies. On the one hand, the skill cohesion of municipalities is reinforced by the exit of
existing plants and product-switching behavior of plants. Employment lost in plant exits is concentrated
in industries that are underembedded in local economies and product-switching plants tend to switch
to industries that are much better embedded in local economies. Decreasing local skill cohesion, in the
short as well as in the long run, is induced mainly by non-local entrepreneurs from outside
municipalities. Much of the employment they generate is concentrated in industries that are under-
embedded in local economies. We do not find evidence of such an effect for local entrepreneurs.

14
References
Acs, Z.J., Braunerhjelm, P., Audretsch, D.B., Carlsson, B. (2009) The knowledge spillover theory of
entrepreneurship. Small Business Economics (32), pp. 15 – 30.
Andersson J. & Arvidson, G. (2006), Företagens och arbetsställenas dynamik (FAD). Memo, Available
from Statistics Sweden.
Balland, P.A., Boschma, R., Kogler, D. (2013), Relatedness and Technological Change: The
Emergence of New Technologies in U.S. Cities from 1981 to 2010. Utrecht Working Paper.
Bathelt, H. and Boggs, J.S. (2003), Towards a Reconceptualization of Regional Development Paths: Is
Leipzig’s Media Cluster a Continuation of or a Rupture with the Past? Economic Geography 79, pp.
265-293.
Bernard, A., Stephen, J.R., Schott, P.K. (2010) Multi-Product Firms and Product Switching. American
Economic Review 100, pp. 70 – 97.
Boschma, R. & Frenken, K. (2011), Technological relatedness and regional branching: In: Bathelt, H.
Feldman, M.P., Kogler D.F. (eds), Dynamic geographies of knowledge creation and innovation.
Routledge: Taylor and Francis.
Boschma, R.A., Iammarino, S. (2009), Related variety, trade linkages and regional growth in Italy.
Economic Geography 85 (3), pp. 299-311.
Boschma, R., Minondo, A., Navarro, M. (2013), The Emergence of New Industries at the Regional
Level in Spain: A Proximity Approach based on Product-Relatedness. Economic Geography 89 (1),
pp. 29 – 51.
Boschma, R.A. & Wenting, R. (2010), The spatial evolution of the British automobile industry: Does
location matter? Industrial and Corporate Change 16 (2), pp. 213 – 238.
Boschma R., Minondo, A. & Navarro, M. (2012), Related variety and regional growth in Spain. Papers
in Regional Science 91 (2), pp. 241 – 256.
Breschi, S. and Lissoni, F. (2005) “Cross-Firm” Inventors and Social Networks: Localized Knowledge
Spillovers Revisited. Annals of Economics and Statistics 79/80, pp. 189-209.
Colombelli, A., Krafft, J. Quatraro, F. (2012), The emergence of new technology-based sectors at the
regional level: a proximity-based analysis of nanotechnology. Papers in Evolutionary Economic

15
Geography 12.11.
Essletzbichler, J. (2013), Relatedness, industrial branching and technological cohesion in U.S.
metropolitan areas. Papers in Evolutionary Economic Geography 13.07.
Fabricant, S. (1942), Employment in Manufacturing, 1899-1939. New York: National Bureau of
Economic Research.
Frenken, K., Van Oort, F.G., Verburg, T. (2007) Related variety, unrelated variety and regional
economic growth. Regional Studies 41 (5), pp. 685-697.
Glaeser, E.L. (2005), Reinventing Boston: 1630-2003. Journal of Economic Geography 5, pp. 119-
153.
Grabher (1993), The weakness of strong ties. The lock-in of regional development in the Ruhr-area.
In: Grabher, G. (Ed) The embedded firm. On the socioeconomics of industrial networks, pp. 255-277.
London: Routledge.
Hall, P.G. and Preston, P. (1988) The carrier wave. New information technology and the geography of
innovation 1846-2003. London: Unwin Hyman.
Hartog, M., Boschma, R. and Sotarauta, M. (2012), The impact of related variety on regional
employment growth in Finland 1993-2006: High-tech versus medium/low-tech. Industry and
Innovation, 19 (6), pp. 459-476.
Herzog, H.W. & Olsen, R.J. (1977), Shift-share analysis revisited: the allocation effect and the stability
of regional structure. Journal of Regional Science 17 (3), pp. 441-454.
Hidalgo, C.A., Klinger, B., Barabási, A.-L., Hausmann, R. (2007), The Product Space Conditions the
Development of Nations. Science 317, pp. 482-487.
Klepper, S. (2007), Disagreements, spinoffs, and the evolution of Detroit as the capital of the U.S.
automobile industry. Management Science 53, pp. 616-631.
Knudsen, D.C. (2010), Shift-share analysis: further examination of models for the description of
economic change. Socio-Economic Planning Sciences 34 (3), pp. 177-198.
Maddison, A. (1952), Productivity in an expanding economy. Economic Journal 62 (247), pp. 584-594.
Malecki, E.J. (1994), Entrepreneurship in regional and local development. International Regional

16
Science Review 16 (1), pp. 119-153.
Marshall, M. (1987) Long waves of regional development. London: McMillan.
Martin, R. and Sunley, P. (2006) Path dependence and regional economic evolution. Journal of
Economics Geography 6, pp. 395-437.
Navarro, L. (2012), Plant level evidence on product mix changes in Chilean manufacturing. The
Journal of International Trade & Economic Development: An International and Comparative Review 21
(2), pp. 165-195.
Neffke, F., Henning, M. and Boschma, R. (2011), How Do Regions Diversify over Time? Industry
Relatedness and the Development of New Growth Paths in Regions. Economic Geography 87,
pp. 237–265.
Neffke F., Henning M. (2012), Skill-relatedness and firm diversification. Strategic Management
Journal, 34, pp. 297-316.
Norton, R.D. and Rees, J. (1979) The product cycle and the spatial decentralization of American
manufacturing. Regional Studies 13, pp. 141-151.
Noseleit, F. (2012), Entrepreneurship, structural change, and economic growth. Journal of
Evolutionary Economic, DOI 10.1007/s00191-012-0291-3.
Porter, M. (2003), The Economic Performance of Regions. Regional Studies, 6-7, pp. 545-546.
Rigby, D. (2012), The Geography of Knowledge Relatedness and Technological Diversification in U.S.
cities. Papers in Evolutionary Economic Geography 12.18.
Schumpeter, J.A. (1939) Business Cycles. A theoretical, historical and statistical analysis of the
capitalist process. New York: McGraw-Hill.
Scott, A.J. (1988) New Industrial Spaces. Flexible Production Organization and Regional Development
in North America and Western Europe. Lion: Pion.
Silva, E.G. and Teixeira, A.A.C. (2008), Surveying structural change: Seminal contributions and
bibliometric account. Structural Change and Economic Dynamics 19 (4), pp. 273-300.
Simmie, J. and Carpenter, J. (2007) Path Dependence and the Evolution of City Regional
Development. Working Paper Series No. 197, Oxford Brookes University, Oxford.

17
Storper, M. and Walker, R. (1989), The Capitalist Imperative. Territory, Technology and Industrial
Growth. New York: Basil Blackwell.
Teece, D.J. (1986) Profiting from technological innovation: Implications for integration, collaboration,
licensing and public policy. Research Policy 15 (6), pp. 285-305.
Teece and Pisano (1994), The Dynamic Capabilities of Firms: An Introduction. Industrial and
Corporate Change 3 (3), pp. 537-556.
18
Table 1: Employment, entry and exit numbers between years t - 1 and year t, Swedish economy, 1994- 2010
Traded and non-traded industries Traded industries
Year
# plants in non -traded
industries
Employ-ment in
plants in non -traded industries
# plants in traded industrie
s
Employ-ment in plants in traded
industries
Employ-ment
growth in incumben
t plants
Employ-ment
decline in
incumbent
plants
# new plant
entries
Employ-ment in
new plant
entries
# plants exits
Employ-ment lost in plant
exits
# plants that change
municipality
Employ-ment shifted
in plant municipality relocations
# plants that
switch products
Employ-ment
shifted in plant
product switches
1994 289366 2192743 84488 891334 - - - - - - - - - -
1995 292077 2215510 88164 926850 54540 25699 14709 36693 11246 31051 2057 9675 3324 40883
1996 295031 2194346 90910 937789 14429 35046
29733 2039 8662 3053 38093
1997 296920 2155660 94974 944381 17082 43440
37417 1830 7892 3512 57417
1998 302241 2225031 98703 985523 16234 42776
37692 1604 6871 3075 40733
1999 302786 2260047 101464 1001213 16232 49735
42421 2162 12192 3292 47070
2000 306871 2309808 106199 1043180 18402 53000
41221 2755 13701 3345 55569
2001 307802 2343585 108095 1032650 17066 48164
43476 2772 9845 3020 48533
2002 306284 2350426 109706 1018523 17565 41595
47513 2852 9582 3395 63672
2003 310636 2312789 111430 988030 20116 42256
45240 2560 8955 4106 36191
2004 329226 2368831 121806 1002958 27018 48343
37686 2790 8877 3387 28096
2005 333302 2398451 127712 1003733 23730 42694
38063 2987 8231 5132 27218
2006 340653 2462404 130670 1019070 23475 40303
37464 2946 10827 4261 26673
2007 345214 2524414 133808 1055164 24555 41775
37885 3042 9876 7246 46414
2008 351493 2553594 138275 1055834 25054 41284
36204 3072 10254 4072 33383
2009 359068 2507420 141347 996159 25071 41029
40441 3059 9167 3351 24882
2010 368226 2584096 146244 1013184 28342 43220
37321 3190 10061 2628 16154
Total
329080 691353
620828 41717 154668 60199 630981 Mean 319835 2350539 113764 995034 19358 40668
36519 2454 9098 3541 37117

19
Table 2: Match of local economy in year t with employment gained / lost by employment source between years t and t + 1, averaged across the years 1994-1999
Employment source
# plants (mean 1994-1999)
Employment gained/lost (1994-1999)
Proportional-employment-
structure baseline
(mean 1994-1999)
Present-employment-
structure baseline
(mean 1994-1999)
Match: mean (mean 1994-
1999)
p-value*
(paired t-test: Present-employment-structure
baseline = Match)
N (# municipal
ity-year combinati
ons)
Incumbent growth
54540 -0,0846 0,0504 0,0418 0,006 1432 Incumbent decline
25699 -0,0846 0,0504 0,0302 0 1432
Incumbent plants exits 11246 31051 -0,0846 0,0504 0,0151 0 1432
Exit-to-non-tradable-product 1157 8846 -0,0786 0,0564 0,032 0 1148
Entry-from-non-tradable-product 1364 7325 -0,0783 0,0631 0,0436 0,001 1210
Exit-from-tradable-to-tradable-product 1729 30738 -0,0795 0,0545 0,0344 0,001 1253
Entry-from-tradable-to-tradable-product 1729 32525 -0,0795 0,0544 0,0666 0,047 1254
Out-migration 1827 8038 -0,0792 0,0553 -0,0101 0 1157
In-migration 1827 8712 -0,0764 0,0538 -0,0043 0 1131
All expanding firms 430 6433 -0,0698 0,0574 0,0317 0,006 613
Non-regional expanding firms 318 3724 -0,0672 0,0508 0,0321 0,07 510
Regional expanding firms 41 944 -0,0602 0,091 0,0431 0,014 125
Local expanding firms 71 1765 -0,052 0,0676 0,04 0,085 144
All entrepreneurs 14279 30260 -0,0844 0,0508 0,0128 0 1431
Non-regional entrepreneurs 1361 1748 -0,0808 0,0545 -0,0103 0 1271
Regional entrepreneurs 1638 1938 -0,0741 0,0587 -0,0071 0 923
Local entrepreneurs 5107 7194 -0,0835 0,052 0,0136 0 1403
Unknown entrepreneurs 6173 19380 -0,0843 0,0509 0,0148 0 1420
20
Table 3: Comparison of Match values between entry and exit sources and between new plant entries, between years t and t + 1 with local economy in year t, averaged across the years 1994-1999
Employment source 1 Employment source 2
Match employment
source 1
Match employment
source 2
p-value*
(paired t-test: Match employment source 1 =
Match employment source 2)
N (# municipal
ity-year combinati
ons)
Incumbent plants exits Incumbent growth 0,0151 0,0418 0,000 1432
Incumbent plant exits Incumbent decline 0,0151 0,0302 0,001 1432
Incumbent decline Incumbent growth 0,0302 0,0418 0,009 1432
Exit-to-non-tradable-product Entry-from-non-tradable-product 0,041 0,0452 0,571 1014
Exit-from-tradable-to-tradable-product Entry-from-tradable-to-tradable-product 0,0344 0,0667 0,000 1253
Out-migration In-migration -0,0016 -0,0018 0,977 968
All expanding firms All entrepreneurs 0,0317 0,0225 0,289 613
Non-regional expanding firms Non-regional entrepreneurs 0,0348 -0,0042 0,000 488
Regional expanding firms Regional entrepreneurs 0,0536 0,0225 0,079 122
Local expanding firms Local entrepreneurs 0,0396 0,0337 0,741 143
Non-regional expanding firms Regional expanding firms 0,0439 0,0561 0,653 63
Non-regional expanding firms Local expanding firms 0,0605 0,0458 0,497 93
Regional expanding firms Local expanding firms 0,0791 0,0748 0,888 32
Non-regional entrepreneurs Regional entrepreneurs -0,0021 -0,0036 0,831 832
Non-regional entrepreneurs Local entrepreneurs -0,0107 0,0131 0,000 1254
Regional entrepreneurs Local entrepreneurs -0,006 0,0182 0,000 909
Unknown entrepreneurs Non-regional entrepreneurs 0,0154 -0,0088 0,000 1263
Unknown entrepreneurs Regional entrepreneurs 0,0126 -0,0060 0,002 917
Unknown entrepreneurs Local entrepreneurs 0,0153 0,0144 0,849 1393
21
Table 4: Match of local economy in 1994 with employment gained / lost by employment source between 1994 and 2005 + 2010
Employment source (1994 until 1999 cohort)
# plants in 2005
Employ-ment
gained/ lost until
2005
Present-employment-structure baseline in 1994
Match in 2005
p-value*
(t-test: Present-
employment-
structure baseline =
Match)
N (# municipalities)
# plants in 2010
Empl oy-ment
gained/ lost until
2010
Present-employment-structure baseline in 1994
Match in 2010
p-value*
(t-test: Present-employm
ent-structure baseline = Match)
N (# municipalities
)
Incumbent growth
92699 0,0526 0,0627 0,209 284 89759 0,0528 0,06 0,429 281
Incumbent decline
54576 0,0484 0,048 0,974 284 62271 0,0502 0,0437 0,535 286
Incumbent plants exits 42317 229152 0,0502 0,0374 0,07 286 46280 273430 0,0502 0,0393 0,127 286
Exit-to-non-tradable-product 1880 19394 0,0498 0,0625 0,328 264 1517 17576 0,0553 0,0825 0,032 256
Entry-from-non-tradable-product 1055 10651 0,0542 0,0496 0,744 223 648 7628 0,044 0,0465 0,862 181
Exit-from-tradable-to-tradable-product
2669 57280 0,0502 0,0377 0,272 277 2344 48932 0,0533 0,0392 0,248 275
Entry-from-tradable-to-tradable-product
1634 37560 0,0478 0,0936 0 257 1053 25769 0,0443 0,0861 0,002 234
Out-migration 2097 13109 0,0467 0,0015 0,001 246 1600 11659 0,0486 -0,0061 0 242
In-migration 953 7522 0,0516 0,0078 0,004 186 539 5625 0,0599 0,0323 0,085 152
All expanding firms 473 11276 0,051 0,0958 0,036 148 319 8465 0,0518 0,1138 0,004 132
Non-regional expanding firms 383 8205 0,0297 0,0978 0,006 126 260 6158 0,0368 0,1292 0 111
Regional expanding firms 36 1072 0,1263 0,0727 0,241 32 25 737 0,1215 0,064 0,156 24
Local expanding firms 54 1999 0,0626 0,0591 0,902 29 34 1570 0,0541 0,0587 0,888 21
All entrepreneurs 12200 63105 0,0502 0,0456 0,628 286 6728 47058 0,0506 0,049 0,878 284
Non-regional entrepreneurs 1103 2858 0,0558 0,004 0,001 237 578 1989 0,067 0,0257 0,012 188
Regional entrepreneurs 1414 2764 0,0605 -0,0001 0 170 698 1646 0,0695 0,0015 0 137
Local entrepreneurs 4940 17124 0,0486 0,0317 0,149 278 2793 13675 0,0487 0,0474 0,91 260
Unknown entrepreneurs 4743 40359 0,0492 0,0449 0,682 284 2659 29748 0,0567 0,0493 0,531 271
22
Table 5: p-values of t-test on differences between match values of employment gained / lost by different employment sou rces until 2010 with local economy in 1994 Employment source: 1994 until 1999 cohort (1) (2) (3) (4) (5) (6) (7) (8) (9) (10) (11) (12) (13) (14) (15) (16) (17) (18)
(1) Incumbent growth . .307 .045 0 .102 .234 .729 .226 .055 .03 .003 . . .353 .011 0 .325 .203
(2) Incumbent decline .307 . .738 .027 .336 .038 .256 .626 .003 .001 0 . . .764 .062 .014 .959 .943
(3) Incumbent plants exits .045 .738 . .001 .466 .001 .771 .936 0 .004 0 . . .351 .098 .012 .425 .533
(4) Out-migration 0 .027 .001 . .111 0 .034 .003 0 0 0 . . .001 .042 .19 .004 .001
(5) In-migration .102 .336 .466 .111 . .039 .296 .075 .004 .067 .02 . . .768 .55 .029 .218 .523
(6) Exit-to-non-tradable-product .234 .038 .001 0 .039 . .305 .021 .521 .113 .056 . . .018 .006 0 .011 .059
(7) Entry-from-non-tradable-product .729 .256 .771 .034 .296 .305 . .985 .045 .3 .268 . . .463 0 .048 .778 .373
(8) Exit-from-tradable-to-tradable-product .226 .626 .936 .003 .075 .021 .985 . .001 .027 .008 . . .588 .307 0 .392 .88
(9) Entry-from-tradable-to-tradable-product .055 .003 0 0 .004 .521 .045 .001 . .418 .048 . . .002 .002 0 .002 .011
(10) All expanding firms .03 .001 .004 0 .067 .113 .3 .027 .418 . .43 . . .022 .021 .004 .007 .043
(11) Non-regional expanding firms .003 0 0 0 .02 .056 .268 .008 .048 .43 . . . .005 .001 .007 .001 .01
(12) Regional expanding firms . . . . . . . . . . . . . . . . . .
(13) Local expanding firms . . . . . . . . . . . . . . . . . .
(14) All entrepreneurs .353 .764 .351 .001 .768 .018 .463 .588 .002 .022 .005 . . . .02 .004 .477 .695
(15) Non-regional entrepreneurs .011 .062 .098 .042 .55 .006 0 .307 .002 .021 .001 . . .02 . .14 .337 .088
(16) Regional entrepreneurs 0 .014 .012 .19 .029 0 .048 0 0 .004 .007 . . .004 .14 . .002 .04
(17) Local entrepreneurs .325 .959 .425 .004 .218 .011 .778 .392 .002 .007 .001 . . .477 .337 .002 . .674
(18) Unknown entrepreneurs .203 .943 .533 .001 .523 .059 .373 .88 .011 .043 .01 . . .695 .088 .04 .674 .
23
Figure 1: Cosine similarity of industry employment shares, 1994-2010
0,5
0,55
0,6
0,65
0,7
0,75
0,8
0,85
0,9
0,95
1
19
94
19
95
19
96
19
97
19
98
19
99
20
00
20
01
20
02
20
03
20
04
20
05
20
06
20
07
20
08
20
09
20
10
Co
sin
e s
imil
ari
ty
Year
Sweden, all industries
Sweden, traded industries
Labor market regions
(mean), all industries
Labor market regions
(mean), traded industries
Municipalities (mean), all
industries
Municipalities (mean),
traded industries

24
Figure 2: Existence of industries in municipalities (local industries), 1994-2010
0
10
20
30
40
50
60
70
80
90
100 1
99
4
19
95
19
96
19
97
19
98
19
99
20
00
20
01
20
02
20
03
20
04
20
05
20
06
20
07
20
08
20
09
20
10
% o
f lo
cal
ind
ust
rie
s
Year
All local industries in 1994
Traded local industries in
1994
All local industries in 2010
Traded local industries in
2010

25
Figure 3: Match of local economies, averaged across all municipalities, 1994- 2010
- Skill coherence is the absolute difference between the present-employment-structure Match (1) and the proportional-employment-structure Match (2). Hence, it represents the match of the local economies with themselves whilst taking into account if the employment shares of industries were distributed across municipalities randomly (i.e. following national shares).
- Matches 1 to 4 are the employment weighted location quotients of employment in related industries (Eqs. 7 and 8), averaged across all municipalities.
-0,2
-0,15
-0,1
-0,05
0
0,05
0,1
0,15
0,2
19
94
19
95
19
96
19
97
19
98
19
99
20
00
20
01
20
02
20
03
20
04
20
05
20
06
20
07
20
08
20
09
20
10
Va
lue
Year
Skill coherence
Match (1): present-
employment-structure in year t,
related employment in year t
Match (2): proportional-
employment-structure in year t,
related employment in year t
Match (3): present employment
structure in year t, related
employment in 1994
Match (4): related employment
in year t, present employment
structure in 1994
![Evolution Extragalactic Radio Sources [2nd piece]](https://static.fdocuments.net/doc/165x107/577d36561a28ab3a6b92ca79/evolution-extragalactic-radio-sources-2nd-piece.jpg)


![Evolution Extragalactic Radio Sources [5th piece]](https://static.fdocuments.net/doc/165x107/577d36561a28ab3a6b92ca64/evolution-extragalactic-radio-sources-5th-piece.jpg)