Sources of funding and categories of spending for the ...
37
University of South Florida Scholar Commons College of Business Publications College of Business 1-1-2007 Sources of funding and categories of spending for the school district of Hillsborough County : an analysis performed by Center for Economic Development Research, College of Business Administration, University of South Florida University of South Florida. Center for Economic Development Research Follow this and additional works at: hp://scholarcommons.usf.edu/business_pub Part of the Business Commons is Article is brought to you for free and open access by the College of Business at Scholar Commons. It has been accepted for inclusion in College of Business Publications by an authorized administrator of Scholar Commons. For more information, please contact [email protected]. Scholar Commons Citation University of South Florida. Center for Economic Development Research, "Sources of funding and categories of spending for the school district of Hillsborough County : an analysis performed by Center for Economic Development Research, College of Business Administration, University of South Florida" (2007). College of Business Publications. Paper 56. hp://scholarcommons.usf.edu/business_pub/56
Transcript of Sources of funding and categories of spending for the ...
University of South FloridaScholar Commons
College of Business Publications College of Business
1-1-2007
Sources of funding and categories of spending forthe school district of Hillsborough County : ananalysis performed by Center for EconomicDevelopment Research, College of BusinessAdministration, University of South FloridaUniversity of South Florida. Center for Economic Development Research
Follow this and additional works at: http://scholarcommons.usf.edu/business_pubPart of the Business Commons
This Article is brought to you for free and open access by the College of Business at Scholar Commons. It has been accepted for inclusion in College ofBusiness Publications by an authorized administrator of Scholar Commons. For more information, please contact [email protected].
Scholar Commons CitationUniversity of South Florida. Center for Economic Development Research, "Sources of funding and categories of spending for theschool district of Hillsborough County : an analysis performed by Center for Economic Development Research, College of BusinessAdministration, University of South Florida" (2007). College of Business Publications. Paper 56.http://scholarcommons.usf.edu/business_pub/56

Sources of Funding and Categories of Spending for the
School District of Hillsborough County
An Analysis Performed by
CENTER FOR ECONOMIC DEVELOPMENT RESEARCH
College of Business Administration
1101 Channelside Dr., 2nd Floor N., Tampa, Florida 33602
Office: (813) 905-5854 or Fax: (813) 905-5856
January 2007

i
Preface
This study was commissioned by the Tampa Bay Builders Association and performed by
the Center for Economic Development Research, College of Business Administration, University
of South Florida. The purpose of the study is to analyze the Sources of Funding and the
Categories of Spending for the School District of Hillsborough County over a period of 10 years.
The Center for Economic Development Research provides information and conducts research
on issues related to economic growth and development in the Nation, in the state of Florida, and
particularly in the central Florida region. The Center serves the faculty, staff, and students of
the College of Business Administration, the University, and individuals and organizations in the
Tampa Bay region and statewide. Activities of the Center for Economic Development Research
are designed to further the objectives of the University and specifically the objectives of the
College of Business Administration.
Robert Forsythe, Dean, College of Business Administration (COBA), USF
Dennis G. Colie, Director, Center for Economic Development Research (CEDR), COBA, USF,
Economist and Principal Investigator
Carol Sumner, Research Assistant, CEDR, COBA, USF

ii
Table of Contents
Preface ................................................................................................................................. i
Table of Contents ..............................................................................................................ii
EXECUTIVE SUMMARY..............................................................................................iii
I. Introduction. .............................................................................................................. 1
II. Sources of Revenue. ................................................................................................... 4
III. Categories of Spending............................................................................................ 12
IV. Summary and Conclusions. .................................................................................... 25
Appendix A
List of Schools in Hillsborough County ........................................................................ 27

iii
EXECUTIVE SUMMARY
The purpose of this research is to analyze the revenue and expenditures of the
School District of Hillsborough County (SDHC). For this study, the Center for Economic
Development Research (CEDR) used data from the Florida Statistical Abstracts, which
are published by the Bureau of Economic and Business Research (BEBR) at the
University of Florida. In addition, we requested and received specific data from the
Office of Funding and Financial Reporting and from Education Information and
Accountability Services at the Florida Department of Education.
For financial accounting, school districts in Florida follow a manual with a
uniform chart of accounts. The manual is incorporated by reference in Rule 6A-1.001,
Florida Administrative Code, pursuant to the requirements of Sections 237.01 and 237.02
of the Florida Statutes. Important for this analysis is an understanding that the accounting
principles “require the use of the modified accrual basis of accounting.” This means that
revenues are recognized when they become both measurable and available to finance
expenditures of the fiscal period. Expenditures are generally recognized when the related
fund liability is incurred, if measurable.” The result of using this accounting principle is
that a school district’s Total Revenue exceeds Current Expenditures in a fiscal period and
there is a carry-forward balance from one fiscal year to the next.
From school year 1993 – 1994 through school year 2004 – 2005 the SDHC’s
funding from the Federal government has increased each year, but State funding declined
three times from the previous year. Local revenue consistently increased year-over-year
from 1993 – 1994 through 2002 – 2003, but then experienced a decrease in 2003 – 2004.
Total Revenue also declined from the previous year in 2003 – 2004 after steadily
increasing over the earlier years. The State of Florida has consistently provided more
than one-half of the funding for the SDHC. And, on average, local revenue has
contributed about one-third of the revenue share and the Federal government’s share has
averaged just under 12% per year.
While total expenditures have averaged 6.0% annual compound growth, total
revenue has increased at an average rate of only 2.8% over the same time period. Only in
school year 1999 – 2000 did total revenue exceed total expenditures. Over the period
from 1993 – 1994 to 2003 – 2004 debt service per full-time equivalent (FTE) student had
the highest compound mean growth rate of 12.4%. Mean growth in current expenditures
and capital outlay rose at 3.4% and 8.6%, respectively, over the same period. Most of the
year-over-year increase in current expenditures per FTE student has been due to inflation.
While current expenditures per FTE increased at a mean annual compound growth rate
of 3.4%, the increase in real terms has been a much smaller 0.9% rate.
The SDHC’s annual carry-forward balance has been steadily increasing from
$74.9 million in 1993 – 1994 to $299.5 million in 2003 – 2004. Presumably, the annual
carry-forward could be applied to capital outlay and debt service. However, we found
that in all school years except one (1999 – 2000), the amount of carry-forward would be
insufficient to pay for capital spending and payments on debt in that year.

1
I. Introduction.
The purpose of this research is to analyze the revenue and expenditures of the
School District of Hillsborough County (SDHC). The SDHC is countywide and consists
of a total of 197 schools.1 There are 130 Elementary schools, 3 K-8 schools, 41 Middle
schools, and 23 High schools. As of school year 2005-2006 the total capacity for
Elementary schools is 91,997 with a projected enrollment of 81,938, total capacity for
Middle schools is 40,440 with a projected enrollment of 37,055, and the total capacity for
High schools is 47,896 with a projected enrollment of 47,915.2 In addition, there are 73
centers such as Charter schools, Early Childhood and Exceptional Student Education. A
list of Hillsborough County schools is in Appendix A.
The mission of the School District of Hillsborough County (SDHC) is to “provide
all students the knowledge and skills necessary to reach their highest potential.”3 The
Hillsborough County school board is responsible for the organization and control of
Hillsborough County public schools. The school board is empowered to determine the
policies necessary for the effective operation and the general improvement of the
district’s school system. The school board is a public corporate entity.4 The
administrative offices of the SDHC are located 901 East Kennedy Boulevard, Tampa,
Florida. The School District is divided into the following divisions:
• Administration division, which is responsible for pupil placement and support,
school safety and security, emergency management, and documents such as
policy manuals, student records requests, and student handbooks.
• Division of Business that is responsible for the financial operations of the
district, which include budget and federal finance, payroll, accounts payable,
student nutrition accounting, and general accounting. Student Nutrition
Services, which offers many nutrition programs to schools and the
community, is part of the Business Division.
• Curriculum and Instruction division is responsible for the curricula of all
schools as well as Academically Gifted Education, Exceptional Student
Education, English for Speakers of Other Languages, Athletics, Technical and
Adult training, Alternative Education, FCAT, and Magnet Programs.
• Facilities division is separated into Maintenance, Planning and Construction,
Resource Management, Growth Management, and Relocatable Facilities
departments.
• Human Resources division has many responsibilities. Some of these are
Teacher Recruitment, Vacancies/Jobs, Employee Benefits, Substitutes,
Certification, and Safety and Health.
1 Reference http://www.sdhc.k12.fl.us/info/ accessed on 7/31/2006.
2 Reference http://publicaffairs.mysdhc.org/files/capacityenrollment.pdf accessed on 7/31/2006.
3 Reference http://apps.sdhc.k12.fl.us/sdhc/plan/ accessed 8/1/2006. 4 Reference http://www.sdhc.k12.fl.us/board/general.asp accessed 8/1/2006.

2
• Information and Technology looks after Technology Support Services,
Assessment and Accountability, and Transportation (School Buses).
• The Student Services and Federal Programs division oversees Parent/Family
Community Involvement, Student Support Services, Migrant Education,
School Readiness (PreK, Head Start), Grants and Research.
For this study, the Center for Economic Development Research (CEDR) used data
from the Florida Statistical Abstracts, which are published by the Bureau of Economic
and Business Research (BEBR) at the University of Florida. In addition, we requested
and received specific data from the Office of Funding and Financial Reporting and from
Education Information and Accountability Services at the Florida Department of
Education. 5
An excellent guide to school finances is Aud (2006). 6 For financial accounting,
school districts in Florida follow a manual with a uniform chart of accounts. The manual
is incorporated by reference in Rule 6A-1.001, Florida Administrative Code, pursuant to
the requirements of Sections 237.01 and 237.02 of the Florida Statutes.7 Important for
this analysis is an understanding that the accounting principles “require the use of the
modified accrual basis of accounting.” This means that revenues are recognized when
they become both measurable and available to finance expenditures of the fiscal period.
Expenditures are generally recognized when the related fund liability is incurred, if
measurable.8 The result of using this accounting principle is that a school district’s Total
Revenue exceeds Current Expenditures in a fiscal period and there is a carry-forward
balance from one fiscal year to the next. Aud (2006) points out that currently in Florida
there is an aggregate “fund balance left over from previous years of nearly $7 billion.”9
A School Year for fiscal reporting runs from July 1 through June 30 of the
following year. The SDHC receives revenue from Federal, State and local sources. Aud
(2006) describes Federal revenue as a source of funding for public schools. “… the
federal government provides funds for low-income students mainly through the national
school lunch program and Title I, which recently has been tied to increased oversight of
school performance under the No Child Left Behind Act… The federal government also
provides funds for special-needs students through the Individuals with Disabilities in
Education Act… School districts also receive federal funding for Federal Impact Aid,
5 Contacts at Florida DOE, Office of Funding and Financial Reporting are Gloria Cowart
[email protected] and Charlene Neel, Education Policy Consultant [email protected]
Contact at Florida DOE, Education Information and Accountability Services is Ed Croft, Senior
Educational Program Director [email protected] 6 Reference Aud, Susan Dr., “Florida’s Public Education Spending,” a study jointly released by the Milton
and Rose D. Friedman Foundation, The James Madison Institute and the Collins Center for Public Policy,
January 2006. 7 Reference Financial and Program Cost Accounting and Reporting for Florida Schools (Redbook 2001)
from Florida Department of Education, Office of Funding and Financial Reporting located at
http://www.firn.edu/doe/fefp/pdf/red1.pdf accessed 8/1/2006. 8 Ibid. 9 Aud (2006), op. cit., p. 14.

3
Medicaid and other programs… Nearly all of the federal funds for public education are
considered ‘operating revenue.’ This means they are intended to be spent for the
provision of education, not on buildings or debt.” (emphasis added)10
Federal revenue is total dollars received from federal sources and includes
Federal Direct revenue, which is received by the district directly from the federal
government without the state as a distributing agency. Also included in federal revenue is
Federal Through State revenue, which is federal funding distributed through the state to
the district.
Aud (2006) also describes State revenue as a source of funding for public schools.
“Most of Florida’s state education funding is provided through the Florida Education
Finance Program (FEFP) … some state funds are distributed for capital outlays and debt
service… Each district receives state revenue based on its number of students, weighted
by student characteristics such as grade level or special-needs status. This formula
produces weighted enrollment figures for each district, which are called Weighted Full
Time Equivalents.”11 The Full Time Equivalent (FTE) differs from actual enrollment,
which is determined by head counts conducted by school personnel at the start of school
in August.
Local revenue is total dollars received from local sources. Local revenue includes
taxes levied by a school system on the assessed valuation of real and personal property
located in the district; interest earnings from amounts held in daily balances, savings
accounts, time deposits, or investments; and student fees which are authorized by statute
and established by the school board.
The remainder of this report is organized as follows. In Sections II and III
respectively, we report on the Sources of Revenue and Categories of Spending. In section
IV we provide a Summary and Conclusions.
10 Aud (2006), op. cit., p.14. 11 Aud (2006), op. cit., p.17.

4
II. Sources of Revenue.
Table 1 reports the Sources of Revenue for the SDHC for school years 1993 –
1994 through 2003 – 2004. Funding from the Federal government and local sources has
increased every year, but yearly changes in State funding have been less consistent. In
two of the school years covered in Table 1, State funding actually decreased.
Notwithstanding these decreases in State revenue, total revenue continued to increase
year-over-year. The highest mean compound growth rate was 8.5% per year in Federal
funding. Total revenue increased by an average rate of 2.8% per year over the same
period.
More recent data for school year 2004 – 2005 are available from Florida
Department of Education’s Return on Investment/School Efficiency Measure website12.
We also show this data in Table 1; however, we note that the method for compiling this
data is not consistent with that reported for 1993 – 1994 through 2003 - 2004. Thus, a
comparison of annual percentage changes between the data is inappropriate.
12 Reference http://roi.fldoe.org/ accessed on 8/15/2006.
Table 1
Sources of Revenue
School District of Hillsborough County
School
Year
Federal
Revenue
Annual
%
Change
State
Revenue
Annual
%
Change
Local
Revenue
Annual
%
Change Total Revenue
Annual
%
Change
1993-1994 $79,436,000 $455,171,000 $267,734,000 $802,341,000
1994-1995 $82,846,000 4.3% $496,803,000 9.1% $297,179,000 11.0% $876,828,000 9.3%
1995-1996 $84,199,000 1.6% $491,095,000 -1.1% $301,544,000 1.5% $876,838,000 0.0%
1996-1997 $90,527,000 7.5% $540,067,000 10.0% $313,872,000 4.1% $944,465,000 7.7%
1997-1998 $98,002,000 8.3% $604,772,000 12.0% $342,252,000 9.0% $1,045,026,000 10.6%
1998-1999 $117,485,000 19.9% $638,421,000 5.6% $374,248,000 9.3% $1,130,154,000 8.1%
1999-2000 $138,201,000 17.6% $685,543,000 7.4% $397,953,000 6.3% $1,221,697,000 8.1%
2000-2001 $153,313,000 10.9% $691,323,000 0.8% $416,752,000 4.7% $1,261,388,000 3.2%
2001-2002 $170,246,000 11.0% $663,797,000 -4.0% $447,407,000 7.4% $1,281,450,000 1.6%
2002-2003 $194,689,000 14.4% $702,745,000 5.9% $477,018,000 6.6% $1,374,452,000 7.3%
2003-2004 $209,240,000 7.5% $842,093,000 19.8% $502,637,000 5.4% $1,553,970,000 13.1%
Mean 8.5% 6.3% 5.8% 2.8%
2004-2005 $222,900,741 $734,034,457 $395,919,818 $1,352,855,016
Source: CEDR based on Florida Statistical Abstract, Table 20.63 Elementary and Secondary Schools:
All Funds Revenue by Major Source in the State and Counties of Florida, Florida Department of
Education, Office of Funding and Financial Reporting http://www.firn.edu/doe/fefp/profile.htm
and Florida Department of Education, Return on Investment/School Efficiency Measure
http://roi.fldoe.org/

5
Chart 1 provides a picture of the trend in increasing revenue sources. However,
the volatile nature of state funding is apparent from the chart.
Chart 1
Sources of Revenue
$0
$100,000,000
$200,000,000
$300,000,000
$400,000,000
$500,000,000
$600,000,000
$700,000,000
$800,000,000
$900,000,000
1993-1994
1994-1995
1995-1996
1996-1997
1997-1998
1998-1999
1999-2000
2000-2001
2001-2002
2002-2003
2003-2004
School Year
Revenue
Federal Revenue State Revenue Local Revenue

6
Table 1A reports Revenue per Full-Time Equivalent (FTE) student.13 FTE
students are determined by surveys that are conducted four times per school year starting
in August of each year and including the Summer-school period. The Revenue per FTE
student in Table 1A excludes revenue applied to adult education programs conducted by
the SDHC. In order to estimate the Implied # of FTE students, we adjusted Total
Revenue (reported in Table 1) to compensate for revenues applied to adult education
programs.14 Revenue per FTE student declined from the previous year in three of the
years considered in Table 1A. However, the mean annual rate of change was a positive
4.6%.
While Revenue per FTE student rose from $5,434 (1993 – 1994) to $8,506 (2003
– 2004) or an approximate 56.5%, the number of FTE students implied by this revenue
amount increased from 147,465 to 182,460 or 23.7%.
13 Revenue per FTE student is not based on school enrollment. Actual enrollment is determined by head-
counts at the start of school in August. 14 According to Florida Department of Education, Office of Funding and Financial Reporting, 2002-2003
Profile Page 81, accessed on July 31, 2006 at http://www.firn.edu/doe/fefp/pdf/0203profiles.pdf adult
revenue was $1,735,595 or 0.126% of Total Revenue in school year 2002 –2003. To calculate Adjusted
Total Revenue, we reduced Total Revenue in each year by 0.126%. Total Revenue for SY 2004 – 2005 as
reported by the Florida Department of Education, Return on Investment/School Efficiency Measure report,
does not included Adult Revenue; therefore, Adjusted Total Revenue in Table 1A is the same as Total
Revenue for that school year.
Table 1A
Total Revenue per Full-time Equivalent Student
School District of Hillsborough County
School Year
Adjusted Total
Revenue
Revenue per FTE
student
Annual %
Change
Implied # FTE
Students
1993-1994 $801,326,560 $5,434 147,465
1994-1995 $875,719,382 $5,860 7.8% 149,440
1995-1996 $875,729,369 $5,771 -1.5% 151,747
1996-1997 $943,270,865 $5,999 4.0% 157,238
1997-1998 $1,043,704,721 $6,464 7.8% 161,464
1998-1999 $1,128,725,089 $6,989 8.1% 161,500
1999-2000 $1,220,152,346 $7,681 9.9% 158,853
2000-2001 $1,259,793,163 $7,656 -0.3% 164,550
2001-2002 $1,279,829,798 $7,486 -2.2% 170,963
2002-2003 $1,372,716,405 $7,777 3.9% 176,510
2003-2004 $1,552,005,237 $8,506 9.4% 182,460
Mean 4.6%
2004-2005 $1,352,855,016 $8,378 161,477
Source: CEDR based on Florida Statistical Abstract, Table 20.63 Elementary
and Secondary Schools: All Funds Revenue by Major Source in the State
and Counties of Florida, Florida Department of Education, Office of Funding
Funding and Financial Reporting http://www.firn.edu/doe/fefp/profile.htm
and Florida Department of Education, Return on Investment/School Efficiency
Measure http://roi.fldoe.org/

7
In Table 1B we report the Federal, State, and local revenues per FTE student.
Over the consecutive eight years of available data, the compound mean growth rates in
Federal and State revenue per FTE were 8.8% and 4.1%, respectively. Mean growth in
local revenue per FTE was 3.7%.
Table 1B
Sources of Revenue per Implied FTE
School District of Hillsborough County
School Year
Federal
Revenue
per FTE
Annual %
Change
State
Revenue
per FTE
Annual %
Change
Local
Revenue
per FTE
Annual %
Change
1993-1994 $538 $3,082 $1,813
1994-1995 NA NA NA
1995-1996 NA NA NA
1996-1997 $575 $3,430 $1,994
1997-1998 $606 5.4% $3,741 9.1% $2,117 6.2%
1998-1999 $745 22.9% $3,870 3.4% $2,374 12.1%
1999-2000 $891 19.6% $4,225 9.2% $2,565 8.0%
2000-2001 $955 7.2% $4,106 -2.8% $2,595 1.2%
2001-2002 $1,011 5.9% $3,807 -7.3% $2,668 2.8%
2002-2003 $1,122 11.0% $3,906 2.6% $2,749 3.0%
2003-2004 $1,163 3.7% $4,549 16.5% $2,795 1.7%
Mean 8.8% 4.1% 3.7%
2004-2005 $1,205 $3,968 $2,140
Source: CEDR based on Florida Department of Education, Office of Funding and Financial
Reporting http://www.firn.edu/doe/fefp/profile.htm and Florida Department of Education,
Return on Investment/School Efficiency Measure http://roi.fldoe.org
NA = Not available

8
Table 2 shows the difference between the Implied # of FTE students reported in
Table 1A and student Enrollment. Enrollment is published by the Florida Department of
Education, Education Information and Accountability Services and based upon actual
head counts. The difference between the two methods of counting students has narrowed
in more recent years.
Table 3
Table 2
Implied FTE versus Enrollment
School District of Hillsborough County
School Year
Implied #
FTE
Students Enrollment Difference
1993-1994 147,465 135,056 12,409
1994-1995 149,440 138,575 10,865
1995-1996 151,747 143,409 8,338
1996-1997 157,238 147,897 9,341
1997-1998 161,464 152,759 8,705
1998-1999 161,500 156,425 5,075
1999-2000 158,853 159,358 -505
2000-2001 164,550 164,294 256
2001-2002 170,963 169,948 1,015
2002-2003 176,510 175,343 1,167
2003-2004 182,460 181,776 684
2004-2005 161,477 184,642 -23,165
Source: CEDR based on Florida Department of Education, Education
Information and Accountability Services,
http://www.firn.edu/doe/eias/eiaspubs/profiles.htm
and Florida Deparment of Education, Return on Investment/
School Efficiency Measure http://roi.fldoe.org/

9
Table 3 compares Total Revenue per FTE with Total Revenue per Enrolled
Student. Both dollar amounts are fairly close, particularly in the later years when the
number of FTE students and enrolled students are not very different. By either
measurement of total revenue per student, the compound rate of growth of this revenue
has been about 3% to 4%.
Table 3
Total Revenue per FTE versus Total Revenue per Enrolled Student
School District of Hillsborough County
School Year
Total
Revenue per
FTE
Annual %
Change
Total Revenue
per Enrolled
Student
Annual %
Change
1993-1994 $5,434 $5,941
1994-1995 $5,860 7.8% $6,327 6.5%
1995-1996 $5,771 -1.5% $6,114 -3.4%
1996-1997 $5,999 4.0% $6,386 4.4%
1997-1998 $6,464 7.8% $6,841 7.1%
1998-1999 $6,989 8.1% $7,225 5.6%
1999-2000 $7,681 9.9% $7,666 6.1%
2000-2001 $7,656 -0.3% $7,678 0.1%
2001-2002 $7,486 -2.2% $7,540 -1.8%
2002-2003 $7,777 3.9% $7,839 4.0%
2003-2004 $8,506 9.4% $8,549 9.1%
Mean 4.6% 3.7%
2004-2005 $8,378 $7,327
Source: CEDR based on Florida Statistical Abstract, Table 20.63 Elementary and
Secondary Schools: All Funds Revenue by Major Source in the State and
Counties of Florida, Florida Department of Education, Office of Funding and
Financial Reporting http://www.firn.edu/doe/fefp/profile.htm
and Florida Department of Education, Return on Investment/School Efficiency Measure
http://roi.fldoe.org/
10
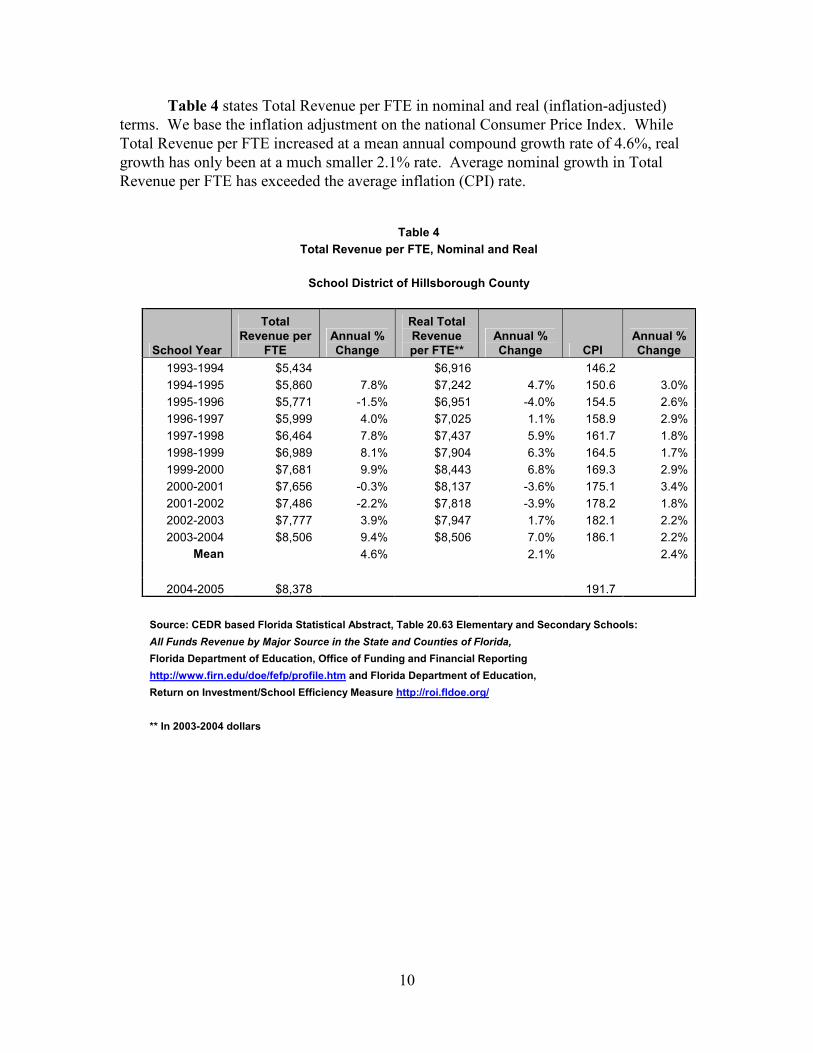
Table 4 states Total Revenue per FTE in nominal and real (inflation-adjusted)
terms. We base the inflation adjustment on the national Consumer Price Index. While
Total Revenue per FTE increased at a mean annual compound growth rate of 4.6%, real
growth has only been at a much smaller 2.1% rate. Average nominal growth in Total
Revenue per FTE has exceeded the average inflation (CPI) rate.
Table 4
Total Revenue per FTE, Nominal and Real
School District of Hillsborough County
School Year
Total
Revenue per
FTE
Annual %
Change
Real Total
Revenue
per FTE**
Annual %
Change CPI
Annual %
Change
1993-1994 $5,434 $6,916 146.2
1994-1995 $5,860 7.8% $7,242 4.7% 150.6 3.0%
1995-1996 $5,771 -1.5% $6,951 -4.0% 154.5 2.6%
1996-1997 $5,999 4.0% $7,025 1.1% 158.9 2.9%
1997-1998 $6,464 7.8% $7,437 5.9% 161.7 1.8%
1998-1999 $6,989 8.1% $7,904 6.3% 164.5 1.7%
1999-2000 $7,681 9.9% $8,443 6.8% 169.3 2.9%
2000-2001 $7,656 -0.3% $8,137 -3.6% 175.1 3.4%
2001-2002 $7,486 -2.2% $7,818 -3.9% 178.2 1.8%
2002-2003 $7,777 3.9% $7,947 1.7% 182.1 2.2%
2003-2004 $8,506 9.4% $8,506 7.0% 186.1 2.2%
Mean 4.6% 2.1% 2.4%
2004-2005 $8,378 191.7
Source: CEDR based Florida Statistical Abstract, Table 20.63 Elementary and Secondary Schools:
All Funds Revenue by Major Source in the State and Counties of Florida,
Florida Department of Education, Office of Funding and Financial Reporting
http://www.firn.edu/doe/fefp/profile.htm and Florida Department of Education,
Return on Investment/School Efficiency Measure http://roi.fldoe.org/
** In 2003-2004 dollars

11
Table 5 reports revenue shares by source. The State of Florida has consistently
provided more than one-half of the funding for the SDHC. And, on average, local
revenue has contributed about one-third of the revenue share and the Federal
government’s share has averaged just under 12% per year. We note that the Federal
government’s share has been steadily increasing from 9.9% in school year 1993 – 1994 to
16.5% in 2004 – 2005. State and local revenues as a share of total revenue have declined
somewhat.
In summary, from school year 1993 – 1994 through school year 2004 – 2005 the
SDHC’s funding from the Federal government has increased each year, but State funding
declined three times from the previous year. Local revenue consistently increased year-
over-year from 1993 – 1994 through 2002 – 2003, but then experienced a decrease in
2003 – 2004. Total Revenue also declined from the previous year in 2003 – 2004 after
steadily increasing over the earlier years. The State of Florida has consistently provided
more than one-half of the funding for the SDHC. And, on average local revenue has
contributed about one-third of the revenue share and the Federal government’s share has
averaged just under 12% per year.
Table 5
Revenue Shares (%) by Source
School District of Hillsborough County
School
Year
Federal
Revenue
% of
Total
Revenue
State
Revenue
% of
Total
Revenue
Local
Revenue
% of
Total
Revenue Total Revenue
1993-1994 $79,436,000 9.9% $455,171,000 56.7% $267,734,000 33.4% $802,341,000
1994-1995 $82,846,000 9.4% $496,803,000 56.7% $297,179,000 33.9% $876,828,000
1995-1996 $84,199,000 9.6% $491,095,000 56.0% $301,544,000 34.4% $876,838,000
1996-1997 $90,527,000 9.6% $540,067,000 57.2% $313,872,000 33.2% $944,465,000
1997-1998 $98,002,000 9.4% $604,772,000 57.9% $342,252,000 32.8% $1,045,026,000
1998-1999 $117,485,000 10.4% $638,421,000 56.5% $374,248,000 33.1% $1,130,154,000
1999-2000 $138,201,000 11.3% $685,543,000 56.1% $397,953,000 32.6% $1,221,697,000
2000-2001 $153,313,000 12.2% $691,323,000 54.8% $416,752,000 33.0% $1,261,388,000
2001-2002 $170,246,000 13.3% $663,797,000 51.8% $447,407,000 34.9% $1,281,450,000
2002-2003 $194,689,000 14.2% $702,745,000 51.1% $477,018,000 34.7% $1,374,452,000
2003-2004 $207,326,485 16.5% $686,728,601 54.7% $361,456,639 28.8% $1,255,511,725
2004-2005 $222,900,741 16.5% $734,034,457 54.3% $395,919,818 29.3% $1,352,855,016
Average 11.9% 55.3% 32.8%
Source: CEDR based on Florida Statistical Abstract, Table 20.63 Elementary and Secondary Schools: All Funds
Revenue by Major Source in the State and Counties of Florida, Florida Department of Education, Office of
Funding and Financial Reporting http://www.firn.edu/doe/fefp/profile.htm and Florida Department of Education,
Return on Investment/School Efficiency Measure http://roi.fldoe.org

12
III. Categories of Spending.
Table 6 reports the Categories of Spending for the SDHC for school years 1993 –
1994 through 2003 – 2004. Current Expenditures are the total amount expended by the
school district for everyday operation and maintenance of schools. This includes food
service and community service expenditures, but excludes debt service and all capital
outlay. Capital Outlay is the amount expended in the acquisition or replacement of fixed
assets including land, land improvements, buildings, fixed equipment, remodeling,
furniture, fixtures, equipment, motor vehicles, and audio-visual materials. Debt Service
is the amount expended for redemption of principal and interest on serial bonds and
loans, along with expenditures for dues, fees and other miscellaneous expenditures.
Current Expenditures have increased every year at a 4.2% mean compound
growth rate. The mean rate of increase for Capital Outlay is a +10.9%, but year-over-year
changes were not always positive. Similarly, annual spending on Debt Service grew at a
+14.8% rate over the period, but declined in 2002 - 2003.
Overall, Total Expenditures show a steady increase averaging 6.0% per year.
While total expenditures have averaged 6.0% annual compound growth, total revenue
(see Table 1) has increased at an average rate of only 2.8% over the same time period.
Only in school year 1999 – 2000 did total revenue exceed total expenditures.
Table 6
Uses of Funds
School District of Hillsborough County
School
Year
Current
Expenditures
Annual
%
Change Capital Outlay
Annual
%
Change Debt Service
Annual
%
Change
Total Expenditure
all funds
Annual
%
Change
1993-1994 $727,456,000 $101,449,000 $20,406,000 $849,312,000
1994-1995 $782,382,000 7.6% $133,451,000 31.5% $26,635,000 30.5% $942,467,000 11.0%
1995-1996 $784,602,000 0.3% $140,792,000 5.5% $39,524,000 48.4% $964,918,000 2.4%
1996-1997 $810,952,000 3.4% $152,324,000 8.2% $41,105,000 4.0% $1,004,381,000 4.1%
1997-1998 $883,457,000 8.9% $143,923,000 -5.5% $50,831,000 23.7% $1,078,211,000 7.4%
1998-1999 $967,931,000 9.6% $111,566,000 -22.5% $56,682,000 11.5% $1,136,179,000 5.4%
1999-2000 $989,610,000 2.2% $162,498,000 45.7% $56,957,000 0.5% $1,209,065,000 6.4%
2000-2001 $1,061,829,000 7.3% $218,625,000 34.5% $88,752,000 55.8% $1,369,205,000 13.2%
2001-2002 $1,100,014,000 3.6% $260,862,000 19.3% $82,398,000 -7.2% $1,443,274,000 5.4%
2002-2003 $1,168,663,000 6.2% $258,659,000 -0.8% $76,586,000 -7.1% $1,503,908,000 4.2%
2003-2004 $1,254,477,000 7.3% $286,065,000 10.6% $81,265,000 6.1% $1,621,807,000 7.8%
Mean 4.2% 10.9% 14.8% 6.0%
2004-2005 $1,295,754,101 $262,050,077 $84,309,204 $1,642,113,382
Source: CEDR based on Florida Statistical Abstract, Table 20.65 Elementary and Secondary Schools: All Funds Expenditure
by Major Type in the State and Counties of Florida, Florida Department of Education, Office of Funding and Financial
Reporting http://www.firn.edu/doe/fefp/profile.htm and Florida Department of Education, Return on Investment/School
Efficiency Measure http://roi.fldoe.org/
13
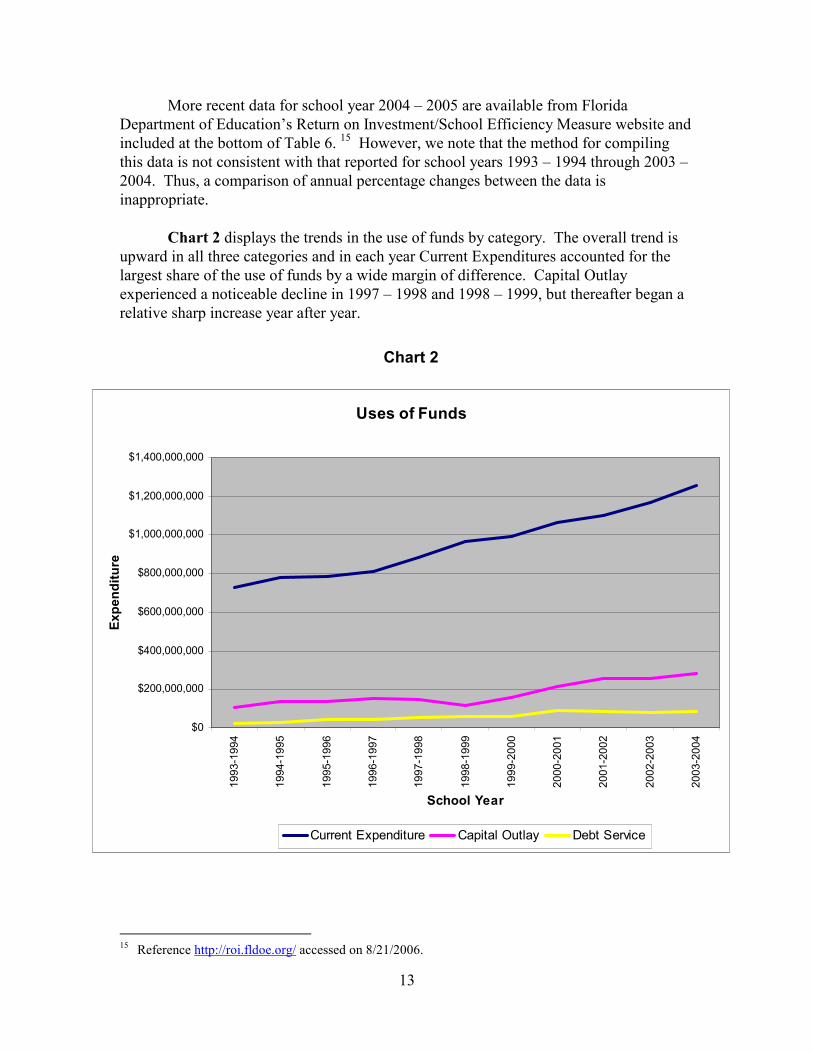
More recent data for school year 2004 – 2005 are available from Florida
Department of Education’s Return on Investment/School Efficiency Measure website and
included at the bottom of Table 6. 15 However, we note that the method for compiling
this data is not consistent with that reported for school years 1993 – 1994 through 2003 –
2004. Thus, a comparison of annual percentage changes between the data is
inappropriate.
Chart 2 displays the trends in the use of funds by category. The overall trend is
upward in all three categories and in each year Current Expenditures accounted for the
largest share of the use of funds by a wide margin of difference. Capital Outlay
experienced a noticeable decline in 1997 – 1998 and 1998 – 1999, but thereafter began a
relative sharp increase year after year.
15 Reference http://roi.fldoe.org/ accessed on 8/21/2006.
Chart 2
Uses of Funds
$0
$200,000,000
$400,000,000
$600,000,000
$800,000,000
$1,000,000,000
$1,200,000,000
$1,400,000,000
1993-1994
1994-1995
1995-1996
1996-1997
1997-1998
1998-1999
1999-2000
2000-2001
2001-2002
2002-2003
2003-2004
School Year
Expenditure
Current Expenditure Capital Outlay Debt Service

14
Table 6A reports annual Current Expenditures per FTE student and the Implied #
of FTE students based on the Current Expenditures. Current Expenditures per FTE
student have increased by a mean annual compound rate of growth equal to 3.4%. While
Current Expenditures per FTE student rose from $4,926 (1993 – 1994) to $6,851 (2003 –
2004) or an approximate 39.1%, the number of FTE students implied by this spending
amount increased from 147,677 to 183,109 or about 24.0%.
Table 6A
Total Current Expenditures per Full-time Equivalent Student
School District of Hillsborough County
School
Year
Current
Expenditures
Current
Expenditures
per FTE
Annual
%
Change
Implied #
FTE
Students
1993-1994 $727,456,000 $4,926 147,677
1994-1995 $782,382,000 $5,229 6.2% 149,624
1995-1996 $784,602,000 $5,164 -1.2% 151,937
1996-1997 $810,952,000 $5,151 -0.3% 157,436
1997-1998 $883,457,000 $5,464 6.1% 161,687
1998-1999 $967,931,000 $5,932 8.6% 163,171
1999-2000 $989,610,000 $6,161 3.9% 160,625
2000-2001 $1,061,829,000 $6,403 3.9% 165,833
2001-2002 $1,100,014,000 $6,418 0.2% 171,395
2002-2003 $1,168,663,000 $6,595 2.8% 177,204
2003-2004 $1,254,477,000 $6,851 3.9% 183,109
Mean 3.4%
2004-2005 $1,295,754,101 $7,005 184,976
Source: CEDR based on Florida Statistical Abstract, Table 20.65 Elementary
and Secondary Schools: All Funds Expenditure by Major Type in the State
and Counties of Florida, Florida Department of Education, Office of Funding
and Financial Reporting http://www.firn.edu/doe/fefp/profile.htm
and Florida Department of Education, Return on Investment/School
Efficiency Measure http://roi.fldoe.org/
15
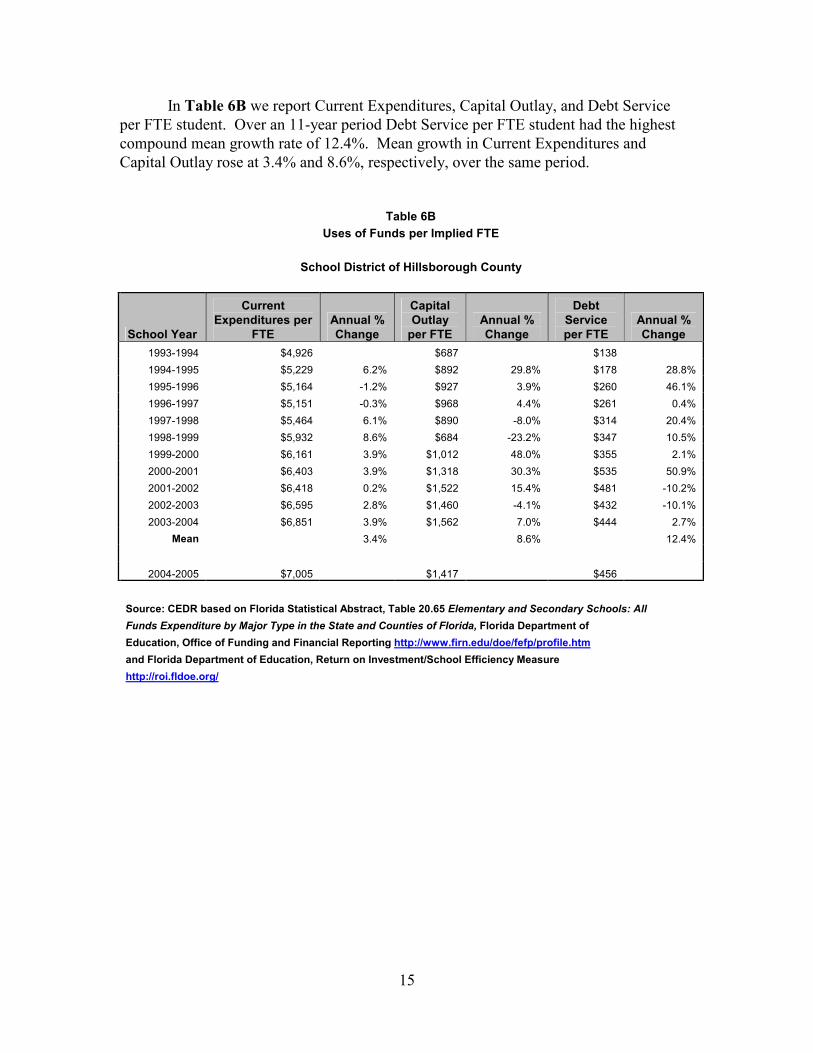
In Table 6B we report Current Expenditures, Capital Outlay, and Debt Service
per FTE student. Over an 11-year period Debt Service per FTE student had the highest
compound mean growth rate of 12.4%. Mean growth in Current Expenditures and
Capital Outlay rose at 3.4% and 8.6%, respectively, over the same period.
Table 6B
Uses of Funds per Implied FTE
School District of Hillsborough County
School Year
Current
Expenditures per
FTE
Annual %
Change
Capital
Outlay
per FTE
Annual %
Change
Debt
Service
per FTE
Annual %
Change
1993-1994 $4,926 $687 $138
1994-1995 $5,229 6.2% $892 29.8% $178 28.8%
1995-1996 $5,164 -1.2% $927 3.9% $260 46.1%
1996-1997 $5,151 -0.3% $968 4.4% $261 0.4%
1997-1998 $5,464 6.1% $890 -8.0% $314 20.4%
1998-1999 $5,932 8.6% $684 -23.2% $347 10.5%
1999-2000 $6,161 3.9% $1,012 48.0% $355 2.1%
2000-2001 $6,403 3.9% $1,318 30.3% $535 50.9%
2001-2002 $6,418 0.2% $1,522 15.4% $481 -10.2%
2002-2003 $6,595 2.8% $1,460 -4.1% $432 -10.1%
2003-2004 $6,851 3.9% $1,562 7.0% $444 2.7%
Mean 3.4% 8.6% 12.4%
2004-2005 $7,005 $1,417 $456
Source: CEDR based on Florida Statistical Abstract, Table 20.65 Elementary and Secondary Schools: All
Funds Expenditure by Major Type in the State and Counties of Florida, Florida Department of
Education, Office of Funding and Financial Reporting http://www.firn.edu/doe/fefp/profile.htm
and Florida Department of Education, Return on Investment/School Efficiency Measure
http://roi.fldoe.org/
16
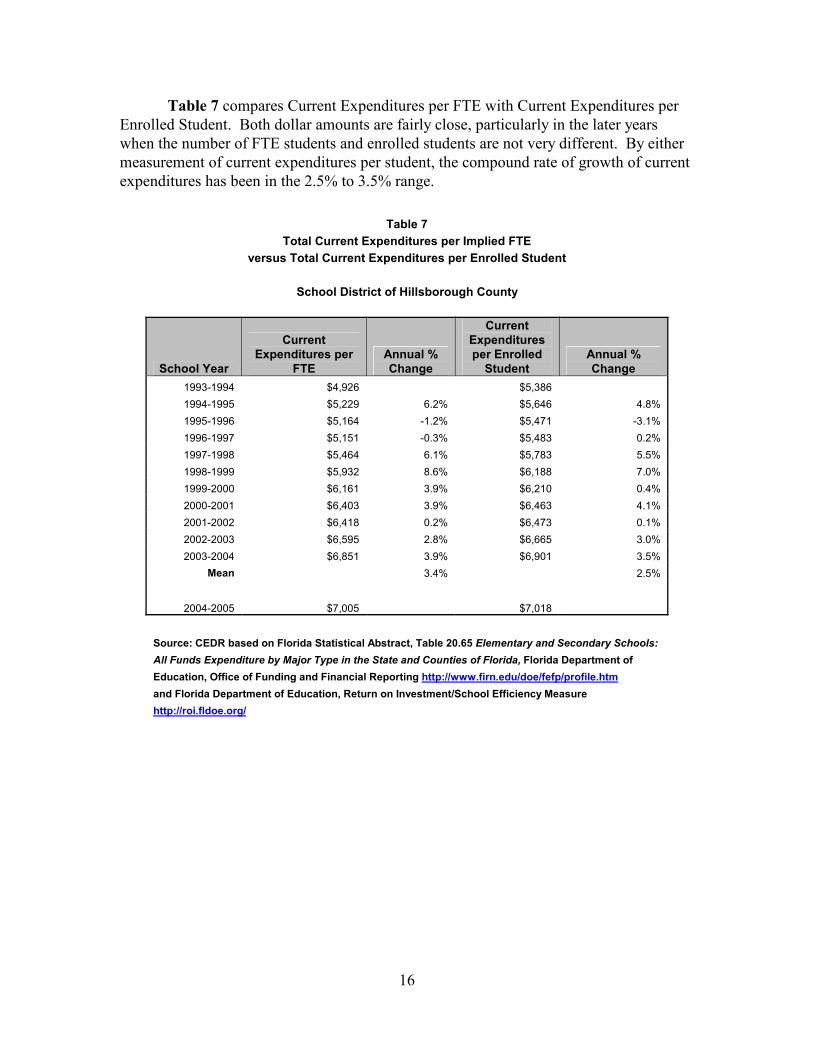
Table 7 compares Current Expenditures per FTE with Current Expenditures per
Enrolled Student. Both dollar amounts are fairly close, particularly in the later years
when the number of FTE students and enrolled students are not very different. By either
measurement of current expenditures per student, the compound rate of growth of current
expenditures has been in the 2.5% to 3.5% range.
Table 7
Total Current Expenditures per Implied FTE
versus Total Current Expenditures per Enrolled Student
School District of Hillsborough County
School Year
Current
Expenditures per
FTE
Annual %
Change
Current
Expenditures
per Enrolled
Student
Annual %
Change
1993-1994 $4,926 $5,386
1994-1995 $5,229 6.2% $5,646 4.8%
1995-1996 $5,164 -1.2% $5,471 -3.1%
1996-1997 $5,151 -0.3% $5,483 0.2%
1997-1998 $5,464 6.1% $5,783 5.5%
1998-1999 $5,932 8.6% $6,188 7.0%
1999-2000 $6,161 3.9% $6,210 0.4%
2000-2001 $6,403 3.9% $6,463 4.1%
2001-2002 $6,418 0.2% $6,473 0.1%
2002-2003 $6,595 2.8% $6,665 3.0%
2003-2004 $6,851 3.9% $6,901 3.5%
Mean 3.4% 2.5%
2004-2005 $7,005 $7,018
Source: CEDR based on Florida Statistical Abstract, Table 20.65 Elementary and Secondary Schools:
All Funds Expenditure by Major Type in the State and Counties of Florida, Florida Department of
Education, Office of Funding and Financial Reporting http://www.firn.edu/doe/fefp/profile.htm
and Florida Department of Education, Return on Investment/School Efficiency Measure
http://roi.fldoe.org/

17
Consistently, salaries make up over one-half (in the years reported between 55.1%
and 58.4%) of Current Expenditures. In Table 7.1 we report Salaries paid by the SDHC
for school years 1997 – 1998 through 2003 – 2004. We also report the annual increase in
Salaries as well as Salaries as a percent of Current Expenditures. The Florida Department
of Education, Office of Funding and Financial Reporting, refers to the amounts reported
in the table as Government Funds Salaries and provides the definition: “All gross salary
amounts expended to employees of the school district who are considered to be in a
position of a permanent nature or hired temporarily, including personnel substituting for
those in permanent positions.”
Table 7.1
Salaries
School District of Hillsborough County
School Year Salaries
Annual
Change
% of Current
Expenditure
s
1993-1994 na
1994-1995 na
1995-1996 na
1996-1997 na
1997-1998 $500,849,960 56.7%
1998-1999 $544,056,747 $43,206,787 56.2%
1999-2000 $573,458,678 $29,401,931 57.9%
2000-2001 $620,200,795 $46,742,117 58.4%
2001-2002 $624,329,269 $4,128,474 56.8%
2002-2003 $643,901,124 $19,571,855 55.1%
2003-2004 $690,862,746 $46,961,622 55.1%
Source: Florida Department of Education, Office of Funding and
and Financial Reporting http://www.firn.edu/doe/fefp/profile.htm
na = not available
18
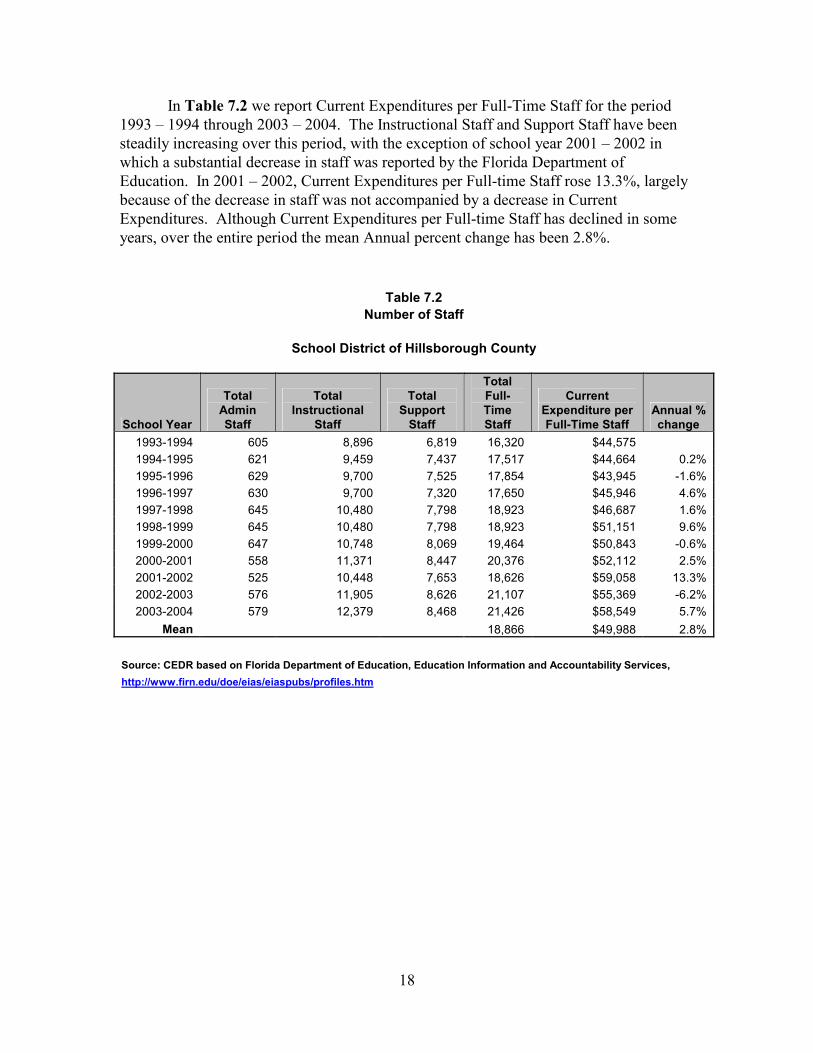
In Table 7.2 we report Current Expenditures per Full-Time Staff for the period
1993 – 1994 through 2003 – 2004. The Instructional Staff and Support Staff have been
steadily increasing over this period, with the exception of school year 2001 – 2002 in
which a substantial decrease in staff was reported by the Florida Department of
Education. In 2001 – 2002, Current Expenditures per Full-time Staff rose 13.3%, largely
because of the decrease in staff was not accompanied by a decrease in Current
Expenditures. Although Current Expenditures per Full-time Staff has declined in some
years, over the entire period the mean Annual percent change has been 2.8%.
Table 7.2
Number of Staff
School District of Hillsborough County
School Year
Total
Admin
Staff
Total
Instructional
Staff
Total
Support
Staff
Total
Full-
Time
Staff
Current
Expenditure per
Full-Time Staff
Annual %
change
1993-1994 605 8,896 6,819 16,320 $44,575
1994-1995 621 9,459 7,437 17,517 $44,664 0.2%
1995-1996 629 9,700 7,525 17,854 $43,945 -1.6%
1996-1997 630 9,700 7,320 17,650 $45,946 4.6%
1997-1998 645 10,480 7,798 18,923 $46,687 1.6%
1998-1999 645 10,480 7,798 18,923 $51,151 9.6%
1999-2000 647 10,748 8,069 19,464 $50,843 -0.6%
2000-2001 558 11,371 8,447 20,376 $52,112 2.5%
2001-2002 525 10,448 7,653 18,626 $59,058 13.3%
2002-2003 576 11,905 8,626 21,107 $55,369 -6.2%
2003-2004 579 12,379 8,468 21,426 $58,549 5.7%
Mean 18,866 $49,988 2.8%
Source: CEDR based on Florida Department of Education, Education Information and Accountability Services,
http://www.firn.edu/doe/eias/eiaspubs/profiles.htm

19
Table 8 states Current Expenditures per FTE in nominal and real (inflation-
adjusted based on the national Consumer Price Index) terms. Most of the year-over-year
increase in Current Expenditures per FTE has been due to inflation. While Current
Expenditures per FTE increased at a mean annual compound growth rate of 3.4%, the
increase in real terms has been a much smaller 0.9% rate.
Table 8
Total Current Expenditures per Implied FTE, Nominal and Real
School District of Hillsborough County
School
Year
Current
Expenditures
per FTE
Annual %
Change
Real Current
Expenditures
per FTE**
Annual %
Change CPI
Annual %
Change
1993-1994 $4,926 $6,270 146.2
1994-1995 $5,229 6.2% $6,655 6.2% 150.6 3.0%
1995-1996 $5,164 -1.2% $6,220 -6.5% 154.5 2.6%
1996-1997 $5,151 -0.3% $6,032 -3.0% 158.9 2.9%
1997-1998 $5,464 6.1% $6,287 4.2% 161.7 1.8%
1998-1999 $5,932 8.6% $6,709 6.7% 164.5 1.7%
1999-2000 $6,161 3.9% $6,773 0.9% 169.3 2.9%
2000-2001 $6,403 3.9% $6,806 0.5% 175.1 3.4%
2001-2002 $6,418 0.2% $6,703 -1.5% 178.2 1.8%
2002-2003 $6,595 2.8% $6,740 0.5% 182.1 2.2%
2003-2004 $6,851 3.9% $6,851 1.7% 186.1 2.2%
Mean 3.4% 0.9% 2.4%
2004-2005 $7,005 191.7
Source: CEDR based on Florida Statistical Abstract, Table 20.65 Elementary and Secondary Schools: All
Funds Expenditure by Major Type in the State and Counties of Florida, Florida Department of
Education, Office of Funding and Financial Reporting http://www.firn.edu/doe/fefp/profile.htm
and Florida Department of Education, Return on Investment/School Efficiency Measure
http://roi.fldoe.org/
** In 2003-2004 dollars

20
As explained in Section I of this report, school districts throughout Florida use a
modified accrual basis of accounting. The result is that a district’s Total Revenue
generally exceeds its Current Expenditures in a fiscal period. Therefore, there is a carry-
forward balance from one fiscal year to the next. Table 9 shows the annual Carry-
forward for the SDHC. The SDHC’s Annual Carry-forward has been steadily increasing.
Table 9
The Carry Forward
School District of Hillsborough County
School Year Total Revenue Current Expenditures Carry Forward
1993-1994 $802,341,000 $727,456,000 $74,885,000
1994-1995 $876,828,000 $782,382,000 $94,446,000
1995-1996 $876,838,000 $784,602,000 $92,236,000
1996-1997 $944,465,000 $810,952,000 $133,513,000
1997-1998 $1,045,026,000 $883,457,000 $161,569,000
1998-1999 $1,130,154,000 $967,931,000 $162,223,000
1999-2000 $1,221,697,000 $989,610,000 $232,087,000
2000-2001 $1,261,388,000 $1,061,829,000 $199,559,000
2001-2002 $1,281,450,000 $1,100,014,000 $181,436,000
2002-2003 $1,374,452,000 $1,168,663,000 $205,789,000
2003-2004 $1,553,970,000 $1,254,477,000 $299,493,000
Source: CEDR based on Florida Statistical Abstract, Table 20.63 Elementary and Secondary
Schools: All Funds Revenue by Major Source in the State and Counties of Florida, Table 20.65
Elementary and Secondary Schools: All Funds Expenditure by Major Type in the State
and Counties of Florida, and Florida Department of Education, Office of Funding and
and Financial Reporting http://www.firn.edu/doe/fefp/profile.htm
21
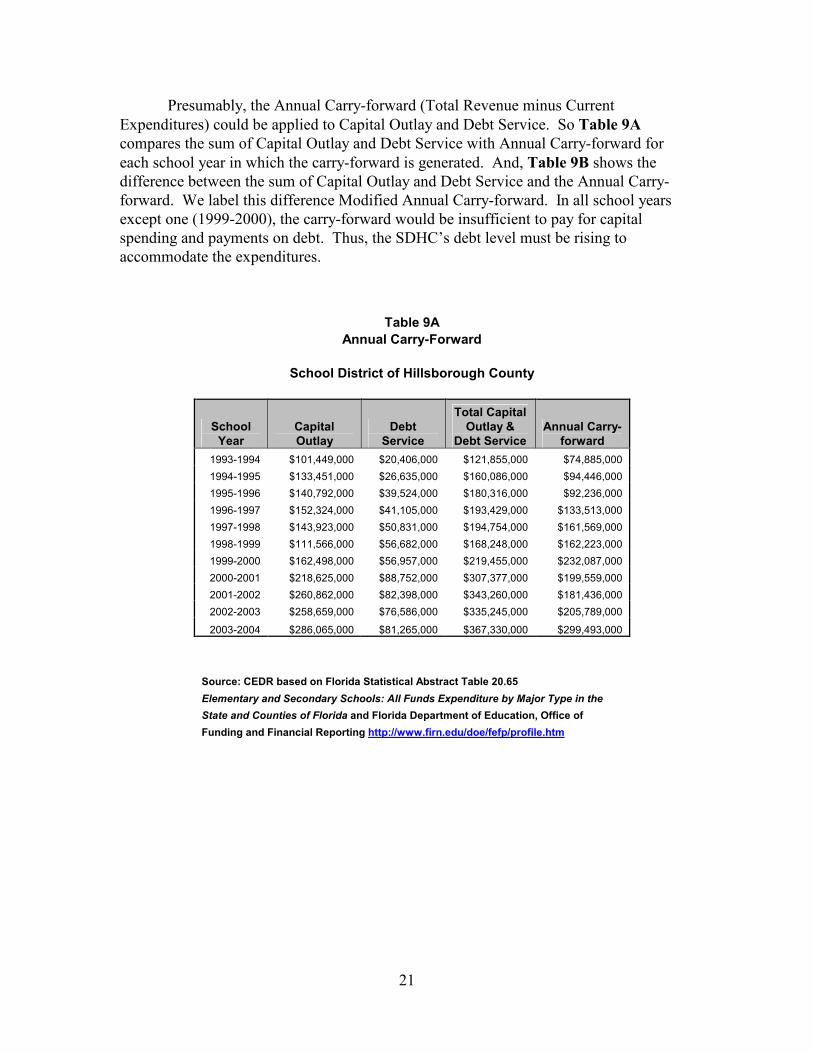
Presumably, the Annual Carry-forward (Total Revenue minus Current
Expenditures) could be applied to Capital Outlay and Debt Service. So Table 9A
compares the sum of Capital Outlay and Debt Service with Annual Carry-forward for
each school year in which the carry-forward is generated. And, Table 9B shows the
difference between the sum of Capital Outlay and Debt Service and the Annual Carry-
forward. We label this difference Modified Annual Carry-forward. In all school years
except one (1999-2000), the carry-forward would be insufficient to pay for capital
spending and payments on debt. Thus, the SDHC’s debt level must be rising to
accommodate the expenditures.
Table 9A
Annual Carry-Forward
School District of Hillsborough County
School
Year
Capital
Outlay
Debt
Service
Total Capital
Outlay &
Debt Service
Annual Carry-
forward
1993-1994 $101,449,000 $20,406,000 $121,855,000 $74,885,000
1994-1995 $133,451,000 $26,635,000 $160,086,000 $94,446,000
1995-1996 $140,792,000 $39,524,000 $180,316,000 $92,236,000
1996-1997 $152,324,000 $41,105,000 $193,429,000 $133,513,000
1997-1998 $143,923,000 $50,831,000 $194,754,000 $161,569,000
1998-1999 $111,566,000 $56,682,000 $168,248,000 $162,223,000
1999-2000 $162,498,000 $56,957,000 $219,455,000 $232,087,000
2000-2001 $218,625,000 $88,752,000 $307,377,000 $199,559,000
2001-2002 $260,862,000 $82,398,000 $343,260,000 $181,436,000
2002-2003 $258,659,000 $76,586,000 $335,245,000 $205,789,000
2003-2004 $286,065,000 $81,265,000 $367,330,000 $299,493,000
Source: CEDR based on Florida Statistical Abstract Table 20.65
Elementary and Secondary Schools: All Funds Expenditure by Major Type in the
State and Counties of Florida and Florida Department of Education, Office of
Funding and Financial Reporting http://www.firn.edu/doe/fefp/profile.htm

22
Table 9B
Modified Annual Carry-Forward
School District of Hillsborough County
School
Year
Annual Carry-
forward
Total Capital
Outlay & Debt
Service
Modified
Annual Carry-
Forward
1993-1994 $74,885,000 $121,855,000 -$46,970,000
1994-1995 $94,446,000 $160,086,000 -$65,640,000
1995-1996 $92,236,000 $180,316,000 -$88,080,000
1996-1997 $133,513,000 $193,429,000 -$59,916,000
1997-1998 $161,569,000 $194,754,000 -$33,185,000
1998-1999 $162,223,000 $168,248,000 -$6,025,000
1999-2000 $232,087,000 $219,455,000 $12,632,000
2000-2001 $199,559,000 $307,377,000 -$107,818,000
2001-2002 $181,436,000 $343,260,000 -$161,824,000
2002-2003 $205,789,000 $335,245,000 -$129,456,000
2003-2004 $299,493,000 $367,330,000 -$67,837,000
Source: CEDR based on Table 20.65 Elementary and Secondary
Schools: All Funds Expenditure by Major Type in the State and
Counties of Florida and Florida Department of Education, Office of
Funding and Financial Reporting
http://www.firn.edu/doe/fefp/profile.htm

23
Table 10 provides available data on the SDHC’s Total Debt and reports Debt
Service payments as a percent of Total Debt. On average, Debt Service payments are
about 7.9% of Total Debt, which has been steadily increasing. The latest data available,
which is for school year 2004 – 2005, indicates that Debt Service cost $84.3 million.
In summary, total expenditures have shown a steady increase averaging 6.0% per
year. While total expenditures have averaged 6.0% annual compound growth, total
revenue has increased at an average rate of only 2.8% over the same time period. Only in
school year 1999 – 2000 did total revenue exceed total expenditures. Over the period
from 1993 – 1994 to 2003 – 2004 debt service per FTE student had the highest compound
mean growth rate of 12.4%. Mean growth in current expenditures and capital outlay rose
at 3.4% and 8.6%, respectively, over the same period. Most of the year-over-year
increase in current expenditures per FTE student has been due to inflation. While current
expenditures per FTE increased at a mean annual compound growth rate of 3.4%, the
increase in real terms has been a much smaller 0.9% rate.
Table 10
Debt and Debt Service
School District of Hillsborough County
School
Year Total Debt Debt Service
Debt
Service as
a % of Total
Debt
1993-1994 NA $20,406,000
1994-1995 NA $26,635,000
1995-1996 NA $39,524,000
1996-1997 NA $41,105,000
1997-1998 $685,239,296 $50,831,000 7.4%
1998-1999 $674,944,333 $56,682,000 8.4%
1999-2000 $775,034,784 $56,957,000 7.3%
2000-2001 $787,723,059 $88,752,000 11.3%
2001-2002 $1,071,243,863 $82,398,000 7.7%
2002-2003 $1,096,352,855 $76,586,000 7.0%
2003-2004 $1,187,649,823 $81,265,000 6.8%
Mean 7.9%
2004-2005 NA $84,309,204
Source: CEDR based on Florida Department of Education, Office of
Funding and Financial Reporting http://www.firn.edu/doe/fefp/profile.htm
and Florida Department of Education, Return on Investment/School
Efficiency Measure http://roi.fldoe.org/
NA = Not Available
24
School districts throughout Florida use a modified accrual basis of accounting.
The result is that a district’s total revenue generally exceeds its current expenditures in a
fiscal period. Therefore, there is a carry-forward balance from one fiscal year to the next.
The SDHC’s annual carry-forward has been steadily increasing from $74.9 million in
1993 – 1994 to $299.5 million in 2003 – 2004. Presumably, the annual carry-forward
could be applied to capital outlay and debt service. However, we found that in all school
years except one (1999 – 2000), the amount of carry-forward would be insufficient to pay
for capital spending and payments on debt.

25
IV. Summary and Conclusions.
The purpose of this research is to analyze the sources of revenue and categories of
spending of the School District of Hillsborough County (SDHC).
Total Expenditures have shown a steady increase averaging 6.0% per year. While
total expenditures have averaged 6.0% annual compound growth, total revenue has
increased at an average rate of only 2.8% over the same time period. Only in school year
1999 – 2000 did total revenue exceed total expenditures. Over the period from 1993 –
1994 to 2003 – 2004 debt service per FTE student had the highest compound mean
growth rate of 12.4%. Mean growth in current expenditures and capital outlay rose at
3.4% and 8.6%, respectively, over the same period. Most of the year-over-year increase
in current expenditures per FTE student has been due to inflation. While current
expenditures per FTE increased at a mean annual compound growth rate of 3.4%, the
increase in real terms has been a much smaller 0.9% rate.
School districts throughout Florida use a modified accrual basis of accounting. The
result is that a district’s total revenue generally exceeds its current expenditures in a fiscal
period. Therefore, there is a carry-forward balance from one fiscal year to the next. The
SDHC’s annual carry-forward has been steadily increasing from $74.9 million in 1993 –
1994 to $299.5 million in 2003 – 2004. Presumably, the annual carry-forward could be
applied to capital outlay and debt service. However, we conclude that in all school years
except one (1999 – 2000), the amount of carry-forward would be insufficient to pay for
capital spending and payments on debt.
From school year 1993 – 1994 through school year 2004 – 2005 the SDHC’s funding
from the Federal government has increased each year, but State funding declined three
times from the previous year. Local revenue consistently increased year-over-year from
1993 – 1994 through 2002 – 2003, but then experienced a decrease in 2003 – 2004. Total
Revenue also declined from the previous year in 2003 – 2004 after steadily increasing
over the earlier years. The State of Florida has consistently provided more than one-half
of the funding for the SDHC. And, on average local revenue has contributed about one-
third of the revenue share and the Federal government’s share has averaged just under
12% per year.
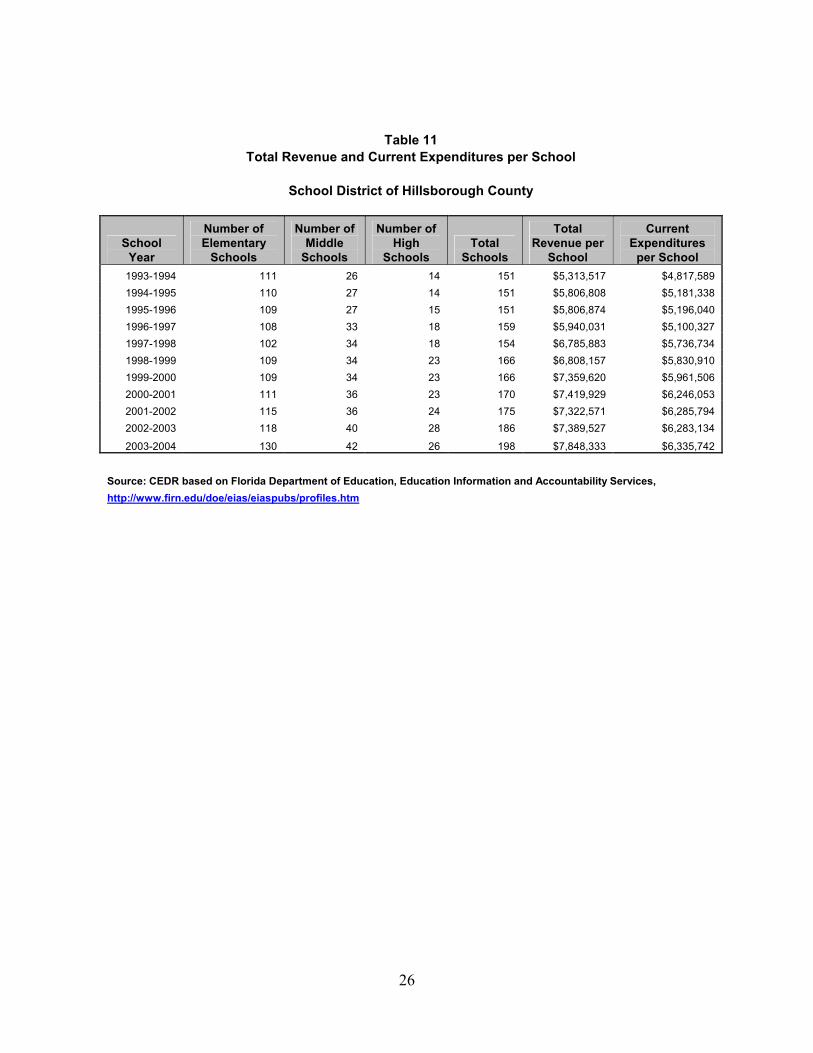
Table 11 sums up the annual Total Revenue per School and Current Expenditures per
School from 1993 – 1994 through 2003 – 2004. Current Expenditures do not include
capital spending or payments on debt. During this period the number of SDHC schools
increased from 151 to 198 (here we only consider elementary, middle, and high schools).
See Table A1 in Appendix A for a comprehensive list of all schools operated by the
SDHC. Revenue per school went up from $5,313,517 to $7,848,333 or a 47.7% increase.
At the same time, current expenditures per school rose from $4,817,589 to $6,335,742,
or a 31.5% jump.
26
Table 11
Total Revenue and Current Expenditures per School
School District of Hillsborough County
School
Year
Number of
Elementary
Schools
Number of
Middle
Schools
Number of
High
Schools
Total
Schools
Total
Revenue per
School
Current
Expenditures
per School
1993-1994 111 26 14 151 $5,313,517 $4,817,589
1994-1995 110 27 14 151 $5,806,808 $5,181,338
1995-1996 109 27 15 151 $5,806,874 $5,196,040
1996-1997 108 33 18 159 $5,940,031 $5,100,327
1997-1998 102 34 18 154 $6,785,883 $5,736,734
1998-1999 109 34 23 166 $6,808,157 $5,830,910
1999-2000 109 34 23 166 $7,359,620 $5,961,506
2000-2001 111 36 23 170 $7,419,929 $6,246,053
2001-2002 115 36 24 175 $7,322,571 $6,285,794
2002-2003 118 40 28 186 $7,389,527 $6,283,134
2003-2004 130 42 26 198 $7,848,333 $6,335,742
Source: CEDR based on Florida Department of Education, Education Information and Accountability Services,
http://www.firn.edu/doe/eias/eiaspubs/profiles.htm

27
Appendix A
List of Schools in Hillsborough County
School/Center Grade Address
Adams 6-8 10201 N. Boulevard Tampa, 33612
Alafia K-5 3535 Culbreath Road Valrico 33594
Alexander K-5 5602 N. Lois Avenue Tampa, 33614
Alonso 9-12 8302 Montague Street, Tampa, 33635
Alternative Ed. (Non DJJ) 1009 North Parsons Avenue, Seffner, 33584
Anderson K-5 3910 Fair Oaks Av. Tampa 33611
Aparicio/Levy Adult Technical 10119 East Ellicott Street, Tampa 33610
Apollo Beach K-5 501 Apollo Beach Blvd. Apollo Beach, 33572
Armwood 9-12 12000 U. S. Hwy. 92 Seffner, 33584
Ballast Point K-5 2802 Ballast Point Blvd. Tampa, 33611
Bartels 6-8 9020 Imperial Oak Blvd., Tampa 33647
Bay Crest K-5 4925 Webb Road, Tampa 33615
Bellamy K-5 9720 Wilsky Blvd., Tampa 33615
Benito 6-8 10101 Cross Creek Blvd., Tampa 33647
Bevis K-5 5720 Osprey Ridge Drive, Lithia 33547
Bing, E.L. K-5 6409 36th Av., S., Tampa 33619
Blake High 9-12 1701 North Boulevard, Tampa, 33607
Bloomingdale 9-12 1700 E. Bloomingdale Av. Valrico, 33594
Bowers/Whitley Career 13609 N. 22nd Street, Tampa, 33613
Boyette Springs K-5 10141 Sedgebrook Dr. Riverview 33569
Brandon 9-12 1101 Victoria Street, Brandon 33510
Brewster Tech Center Adult 2222 N. Tampa St., Tampa 33602
Brooker K-5 812 DeWolf Road , Brandon 33511
Broward K-5 400 W. Osborne Av., Tampa, 33603
Bryan, PC K-5 2006 W. Oak Avenue, Plant City, 33563
Bryant Elem. K-5 13910 Nine Eagles Road, Tampa 33626
Buchanan 6-8 1001 W. Bearss Av., Tampa, 33613
Buckhorn K-5 2420 Buckhorn School Court, Valrico, 33594
Burnett 6-8 1010 Kingsway Rd, N. Seffner, 33584
Burney K-5 901 S. Evers Street, Plant City, FL 33566
Burns 6-8 615 Brooker Road, Brandon, 33511
Cahoon K-5 2312 E. Yukon, Tampa 33604
Caminiti ECE 2600 W. Humphrey, Tampa 33614
Cannella K-5 10707 Nixon Road, Tampa 33624
Carrollwood K-5 3516 McFarland Road Tampa, 33618
Carver Center 6-12 2934 E. Hillsborough Avenue, Tampa 33610
Chamberlain 9-12 9401 N. Boulevard, Tampa 33612
Chiaramonte K-5 6001 S. Himes Av., Tampa 33611

28
School/Center Grade Address
Chiles K-5 16541 Tampa Palms Blvd W, Tampa 33647
Cimino K-5 4329 Culbreath Road, Valrico 33594
Citrus Park K-5 7700 Gunn Highway, Tampa 33625
Clair Mel K-5 1025 S. 78th Street, Tampa 33619
Clark K-5 19002 Wood Sage Drive, Tampa 33647
Claywell K-5 4500 Northdale Blvd., Tampa 33624
Cleveland K-5 723 E. Hamilton Av., Tampa 33604
Coleman 6-8 1724 S. Manhattan, Tampa 33629
Collins K-5 12424 Summerfield Blvd., Riverview 33569
Colson K-5 1520 Lakeview Av., Seffner, 33584
Cork K-5 3501 N. Cork Road, Plant City, 33565
Corr K-5 13020 Kings Lake Drive, Gibsonton, 33534
Crestwood K-5 7824 Manhattan Av., N, Tampa, 33614
Cypress Creek K-5 4040 19th Av., N.E., Ruskin, 33573
Davidsen 6-8 10501 Montague Street, Tampa 33626
Davis K-5 10907 Memorial Highway, Tampa 33615
Deer Park K-5 7700 Gunn Highway, Tampa 33625
DeSoto K-5 2618 Corrine Street, Tampa 33605
Dickenson K-5 4720 Kelly Road, Tampa 33615
Doby K-5 6720 Covington Garden Drive, Apollo Beach 33572
Dover K-5 3035 Nelson Avenue, Dover 33527
Dowdell 6-8 1208 Wishing Well Way Tampa, 33619
Dunbar Magnet K-5 1730 Union Street, Tampa 33607
Durant 9-12 4748 Cougar Path, Plant City, 33567
East Bay 9-12 7710 Old Big Bend Road, Gibsonton, 33534
Edison K-5 1607 E. Curtis Street, Tampa 33610
Egypt Lake K-5 6707 N. Glen Avenue, Tampa 33614
Eisenhower 6-8 7620 Old Big Bend Road, Gibsonton, 33534
Erwin Tech Ctr Adult 2010 E. Hillsborough Avenue, Tampa, 33610
Essrig K-5 13131 Lynn Road, Tampa 33624
Farnell 6-8 13912 Nine Eagles Road, Tampa, FL 33626
Ferrell Middle Magnet 6-8 4302 24th Street, Tampa 33610
FishHawk Creek K-5 16815 Dorman Road, Lithia, 33547
Folsom K-5 9855 Harney Road Thonotosassa, 33592
Forest Hills K-5 10112 Ola Avenue, Tampa 33612
Foster K-5 2014 E. Diana Street Tampa 33610
Franklin 6-8 3915 21st Avenue, Tampa 33605
Freedom 9-12 17410 Commerce Park Blvd, Tampa, 33647
Frost K-5 3950 Falkenburg Road, Riverview 33569
Gaither 9-12 16200 N. Dale Mabry Hwy, Tampa 33618
Gary Adult Adult 5101 North 40th St., Tampa 33610
Gibsonton K-5 7723 Gibsonton Drive, Gibsonton 33534
Giunta 6-8 4202 Falkenburg Road, Riverview 33569

29
School/Center Grade Address
Gorrie K-5 705 DeLeon, Tampa 33606
Grady K-5 3910 Morrison Avenue, Tampa, 33629
Graham K-5 2915 Massachusetts Avenue, Tampa 33602
Greco 6-8 6925 E. Fowler Avenue, Temple Terrace 33617
Heritage K-5 18201 East Meadows Road, Tampa 33647
Hill 6-8 5200 Ehrlich Road, Tampa 33624
Hillsborough 9-12 5000 Central Avenue, Tampa 33603
Hunter's Green K-5 9202 Highland Oak Drive, Tampa 33647
Ippolito K-5 6874 S. Faulkenburg Road, Riverview, FL 33569
Jackson K-5 502 E. Gilchrist, Plant City 33566
James K-8 4302 E. Ellicott Street, Tampa 33610
Jefferson 9-12 4401 Cypress Street, Tampa 33607
Jennings 6-8 8799 Williams Road, Seffner 33584
Just K-5 1315 Spruce Street, Tampa, 33607
Kenly K-5 2909 66th Street, Tampa 33619
King 9-12 6815 N. 56th Street, Tampa 33610
Kingswood K-5 3102 S. Kings Avenue, Brandon, 33511
Knights K-5 4815 N. Keene Road, Plant City 33565
Lake Magdalene K-5 2002 Pine Lake Drive, Tampa 33612
Lanier K-5 4704 Montgomery Avenue, Tampa, 33616
LaVoy Ungr. 4410 W. Main Street, Tampa 33607
Learey Tech Ctr Adult 5410 N. 20th Street, Tampa 33610
Lee K-5 305 E. Columbus Drive, Tampa 33602
Lennard 9-11 2002 E. Shell Point Road, Ruskin 33570
Leto 9-12 4409 W. Sligh Avenue, Tampa 33614
Lewis K-5 6700 Whiteway Drive, Temple Terrace, 33617
Liberty 6-8 17400 Commerce Park Blvd., Tampa 33647
Limona K-5 1115 Telfair, Brandon, 33510
Lincoln Magnet K-5 1207 E. Renfro Street, Plant City, 33566
Lithia Springs K-5 4332 Lynx Paw Trail, Valrico, 33594
Lockhart K-5 3719 North 17th Street, Tampa 33610
Lomax K-5 4207 26th Street, Tampa 33610
Lopez K-5 200 N. Kingsway Road, Seffner 33584
Lopez ESE ESE 200 N. Kingsway Road, Seffner 33584
Lowry K-5 11505 Country Hollow Drive, Tampa 33635
Lutz K-5 202 5th Avenue, SE, Lutz 33549
Mabry K-5 4201 Estrella Street, Tampa 33629
MacFarlane Park K-5 1721 N. MacDill Avenue, Tampa 33607
Madison 6-8 4444 Bay Vista Avenue, Tampa 33611
Mango K-5 4220 Hwy 579, Seffner 33584
Maniscalco K-5 939 DeBuel Road, Lutz 33549
Mann 6-8 409 E. Jersey Avenue, Brandon 33510
Marshall 6-8 18 S. Maryland Avenue, Plant City 33566

30
School/Center Grade Address
Martinez 6-8 5601 Lutz Lake Fern Road, Lutz, FL 33558
McDonald K-5 501 W. Pruitt Road, Seffner 33584
McKitrick K-5 5503 Lutz Lake Fern Road, Lutz 33558
McLane 6-8 306 N. Knights Avenue Brandon, 33510
Memorial 6-8 4702 N. Central Avenue, Tampa 33603
Mendenhall K-5 5202 Mendenhall Drive, Tampa 33603
Mendez Center Ungr. 5707 N. 22nd Street, Tampa 33610
Middleton 9-12 4801 North 22nd Street, Tampa, 33610
Miles K-5 317 E. 124th Av., Tampa 33612
Mintz K-5 1510 Heather Lakes Blvd. Brandon, 33511
Mitchell K-5 205 Bungalow Park, Tampa 33609
Monroe 6-8 4716 Montgomery Av., Tampa 33616
Morgan Woods K-5 7001 Armand Drive , Tampa 33634
Mort K-5 1806 Bearss Av., E, Tampa 33613
Muller K-5 13615 N. 22nd Street, Tampa 33613
Mulrennan 6-8 4215 Durant Road, Valrico 33594
Nature’s Clsrm 6 13100 Verges Road, Thonotosassa 33592
Nelson K-5 5413 Durant Road, Dover 33527
Newsome 9-12 16550 Fishhawk Boulevard, Lithia 33547
Northwest K-5 16438 Hutchison Rd., Tampa 33625
Oak Grove K-5 6315 North Armenia Avenue Tampa, 33604
Oak Park K-5 4322 E. Ellicott St, Tampa 33610.
Orange Grove Magnet 6-8 3415 16th Street, Tampa 33605
Palm River K-5 805 Maydell Drive, Tampa 33619
Pierce 6-8 5511 N. Hesperides Street, Tampa 33614
Pinecrest K-5 7950 LithiaPinecrest, Lithia 33547
Pizzo K-5 11701 Bull Run, Tampa 33617
Plant 9-12 2415 S. Himes Avenue, Tampa 33629
Plant City 9-12 One Raider Place, Plant City 33563
Potter K-5 3224 E. Cayuga, Tampa 33610
Pride K-5 10310 Lions Den Drive, Tampa 33647
Progress Village 6-8 8113 Zinnia Drive, Tampa 33619
Rampello Downtown K-8 802 E. Washington Street, Tampa, FL 33602
Randall 6-8 16510 Fishhawk Boulevard, Lithia 33547
Riverhills K-5 405 Riverhills Drive, Temple Terrace 33617
Riverview K-5 10809 Hannaway Road, Riverview 33569
Riverview Hi. 9-12 11311 Boyette Road, Riverview 33569
Robinson Elem K-5 4801 S. Turkey Creek Road , Plant City, 33567
Robinson High 9-12 6311 S. Lois Av., Tampa 33616
Robles K-5 4405 E. Sligh Avenue, Tampa 33610
Rodgers 6-8 11910 Tucker Road, Riverview 33569
Roland Park K-8 1510 N. Manhattan Avenue,Tampa, 33607
Roosevelt K-5 3205 Ferdinand Av., Tampa 33629

31
School/Center Grade Address
Ruskin K-5 101 E. College Avenue, Ruskin 33570
Schmidt K-5 1250 Williams Road, Brandon, 33510
Schwarzkopf K-5 18333 Calusa Trace Blvd. Lutz, 33549
Seffner K-5 109 Cactus Road, Seffner 33584
Seminole K-5 6201 Central Avenue, Tampa 33604
Sessums K-5 11525 Ramble Creek Drive, Riverview 33569
Shaw K-5 11311 N. 15th Street, Tampa 33612
Sheehy K-5 6402 North 40th Street, Tampa 33610
Shields 6-8 3908 19th Avenue, NE, Ruskin, 33573
Shore K-5 1908 2nd Avenue, Tampa 33605
Sickles 9-12 7950 Gunn Highway, Tampa 33626
Simmons Career 1202 Grant Street, Plant City 33563
Sligh 6-8 2011 E. Sligh Avenue, Tampa 33610
South County Career Center 4646 S. Highway 41, Ruskin, 33570
Spoto 9-11 8538 Eagle Palm Drive, Riverview 33569
Springhead K-5 3208 Nesmith Road, Plant City 33566
Stewart 6-8 1125 Spruce Street Tampa 33607
Sulphur Springs K-5 8412 13th Street, Tampa 33604
Summerfield K-5 11990 Big Bend Road, Riverview 33569
Symmes K-5 6280 Watson Road Riverview, FL 33569
Tampa Bay Boulevard K-5 3111 Tampa Bay Blvd. Tampa, 33607
Tampa Bay Technical 9-12 6410 Orient Road, Tampa 33610
Tampa Palms K-5 6100 Tampa Palms Blvd., Tampa 33647
Temple Terrace K-5 124 Flotto Avenue, Temple Terrace 33617
Thomas Ungr 3215 Nundy Road, Tampa 33618
Thonotosassa K-5 10050 Skew Lee Road, Thonotosassa 33592
Tinker K-5 8207 Tinker Street, MacDill AFB 33621
Tomlin 6-8 501 Woodrow Wilson, Plant City, 33567
Town & Country K-5 6025 Hanley Road, Tampa 33634
Trapnell K-5 1605 W. Trapnell, Plant City 33567
Turkey Creek 6-8 5005 S. Turkey Creek Rd. Plant City, 33567
Turner K-5 9190 Imperial Oak Blvd., Tampa 33647
Twin Lakes K-5 8507 N. Habana Avenue, Tampa 33614
Valrico K-5 609 S. Miller Road, Valrico 33594
Van Buren 6-8 8715 N. 22nd Street, Tampa 33604
Walden Lake K-5 2800 Turkey Creek Rd., Plant City, 33566
Walker 6-8 8282 N. Mobley Road, Odessa 33556
Washington, B.T. K-5 1407 Estelle Street, Tampa 33605
Waters Career Center 2704 N. Highland Avenue, Tampa 33602
Webb 6-8 6035 Hanley Road, Tampa, 33634
West Shore K-5 7110 S. West Shore Blvd. Tampa, 33616
West Tampa K-5 2700 Cherry Street, Tampa 33607
Westchase K-5 9517 W. Linebaugh Avenue, Tampa 33626

32
School/Center Grade Address
Wharton 9-12 20150 Bruce B. Downs, Tampa 33647
Williams 6-8 5020 North 47th Street, Tampa 33610
Willis Peters ESE Ungr 2919 Nelson Avenue, Dover, 33527
Wilson Elem. K-5 702 English Street, Plant City 33566
Wilson Middle 6-8 1005 Swann Avenue, Tampa 33606
Wimauma K-5 5709 Hickman, Wimauma 33598
Witter K-5 10801 N. 22nd Street, Tampa 33612
Woodbridge K-5 8301 Woodbridge Blvd., Tampa 33615
Yates K-5 301 N. Kingsway, Brandon 33510
Young Magnet 6-8 1807 E. Dr. Martin Luther King Blvd, Tampa 33610
Youth Services (DJJ Prog.) 13706 N. 23rd Street, Tampa 33613
Source: School District of Hillsborough County, http://publicaffairs.mysdhc.org/files/schools.pdf accessed
7/31/2006.
Table A1
Number of Schools
School District of Hillsborough County
School
Year
Elementary
Schools
Middle
Schools
High
Schools
Exceptional
Schools
Vocational
Schools
Other
Types
of
School
s
Charter
School
s
Dept. of
Juvenil
e
Schools
Total
Schools
Net
Chang
e
1993-1994 111 26 14 11 4 27 193
1994-1995 110 27 14 9 4 23 187 -6
1995-1996 109 27 15 8 4 23 186 -1
1996-1997 108 33 18 9 4 26 198 12
1997-1998 102 34 18 9 4 31 198 0
1998-1999 109 34 23 8 4 35 213 15
1999-2000 109 34 23 9 3 29 10 14 231 18
2000-2001 111 36 23 9 3 26 15 17 240 9
2001-2002 115 36 24 9 3 25 15 15 242 2
2002-2003 118 40 28 9 3 23 16 15 252 10
2003-2004 130 42 26 11 3 31 20 12 275 23
Source: CEDR based on Florida Department of Education, Education Information and Accountability Services,
http://www.firn.edu/doe/eias/eiaspubs/profiles.htm