Sources and Transport of Urban and Biomass Burning Aerosol ...
14
Sources and Transport of Urban and Biomass Burning Aerosol Black Carbon at the South–West Atlantic Coast H. Evangelista & J. Maldonado & R. H. M. Godoi & E. B. Pereira & D. Koch & K. Tanizaki-Fonseca & R. Van Grieken & M. Sampaio & A. Setzer & A. Alencar & S. C. Gonçalves Received: 4 May 2006 / Accepted: 30 October 2006 # Springer Science + Business Media B.V. 2006 J Atmos Chem DOI 10.1007/s10874-006-9052-8 H. Evangelista (*) : K. Tanizaki-Fonseca : A. Alencar : S. C. Gonçalves Department of Biophysics and Biometry, Rio de Janeiro State University, LARAMG/UERJ. Pavilhão H.L.C. Subsolo. R. São Francisco Xavier, 524. Maracanã, Rio de Janeiro, RJ, Brazil 20550-013 e-mail: [email protected] J. Maldonado Departamento de Geoquímica, Instituto de Química, Universidade Federal Fluminense, Outeiro São João Batista, Niterói, RJ, Brazil e-mail: [email protected] R. H. M. Godoi Graduate Program in Environmental Management, Centro Universitário Positivo – UnicenP, R. Prof. Pedro Viriato Parigot de Souza, 5300, Campo Comprido, Curitiba, PR, Brazil 81280-330 e-mail: [email protected] E. B. Pereira : A. Setzer INPE – CPTEC, Brazilian National Space Institute (INPE), Center for Numerical Weather Forecast and Climate Studies, Cx. Postal 515, São José dos Campos, SP, Brazil 12245-970 E. B. Pereira e-mail: [email protected] A. Setzer e-mail: [email protected] D. Koch Center for Climate Systems Research, Columbia University and NASA-GISS, New York, NY, USA e-mail: [email protected] R. Van Grieken Department of Chemistry, Micro and Trace Analysis Centre, University of Antwerp, 2610 Antwerp, Belgium e-mail: [email protected] M. Sampaio Brazilian National Space Institute – INPE, Av. Astronautas 1758, Cx. Postal 515, São José dos Campos, SP, Brazil 12245-970 e-mail: [email protected]
Transcript of Sources and Transport of Urban and Biomass Burning Aerosol ...
Sources and Transport of Urban and Biomass BurningAerosol Black Carbon at the South–West Atlantic Coast
H. Evangelista & J. Maldonado & R. H. M. Godoi & E. B. Pereira &
D. Koch & K. Tanizaki-Fonseca & R. Van Grieken & M. Sampaio &
A. Setzer & A. Alencar & S. C. Gonçalves
Received: 4 May 2006 /Accepted: 30 October 2006# Springer Science + Business Media B.V. 2006
J Atmos ChemDOI 10.1007/s10874-006-9052-8
H. Evangelista (*) : K. Tanizaki-Fonseca : A. Alencar : S. C. GonçalvesDepartment of Biophysics and Biometry, Rio de Janeiro State University, LARAMG/UERJ. PavilhãoH.L.C. Subsolo. R. São Francisco Xavier, 524. Maracanã, Rio de Janeiro, RJ, Brazil 20550-013e-mail: [email protected]
J. MaldonadoDepartamento de Geoquímica, Instituto de Química, Universidade Federal Fluminense,Outeiro São João Batista, Niterói, RJ, Brazile-mail: [email protected]
R. H. M. GodoiGraduate Program in Environmental Management, Centro Universitário Positivo – UnicenP,R. Prof. Pedro Viriato Parigot de Souza, 5300, Campo Comprido, Curitiba, PR, Brazil 81280-330e-mail: [email protected]
E. B. Pereira : A. SetzerINPE – CPTEC, Brazilian National Space Institute (INPE),Center for Numerical Weather Forecast and Climate Studies, Cx. Postal 515,São José dos Campos, SP, Brazil 12245-970
E. B. Pereirae-mail: [email protected]
A. Setzere-mail: [email protected]
D. KochCenter for Climate Systems Research, Columbia University and NASA-GISS, New York, NY, USAe-mail: [email protected]
R. Van GriekenDepartment of Chemistry, Micro and Trace Analysis Centre,University of Antwerp, 2610 Antwerp, Belgiume-mail: [email protected]
M. SampaioBrazilian National Space Institute – INPE, Av. Astronautas 1758, Cx. Postal 515,São José dos Campos, SP, Brazil 12245-970e-mail: [email protected]
Abstract The total extent of the atmospheric impacts associated to the aerosol black carbon(BC) emissions from South America is not completed described. This work presents results ofBC monitored during three scientific expeditions (2002, 2003 and 2004) on board of a Brazilianoceanographic vessel Ary Rongel that covered the South–West Atlantic coast between 22–62°S.This latitudinal band encloses major urban regions of South America and the outflow region ofthe SACZ (South Atlantic Convergent Zone), which is an important mechanism of advectivetransport of heat, moisture, minor gases and aerosols from the South America continental land tothe Southern Atlantic Ocean. Our results showed that aerosol BC enhanced concentrations fromurban/industrial origin can be transported to the South–West Atlantic Ocean due to the migrationof sub-polar fronts that frequently reach tropical/subtropical regions. Despite the decrease ofaerosol BC concentrations southwards (from ∼1,200 ng m−3 at latitude 22°S to ∼10 ng m−3 atlatitude 62°S), several observed peak events were attributed to regional urban activities. Mostof such events could be explained by the use of air mass back trajectories analysis. In addition,a global model simulation is presented (Goddard Institute for Space Studies – GISS GCM BCsimulation) to explore the origins of aerosol BC in the South–West Atlantic. The modelallowed isolating the biomass emissions from South America and Africa and industrial (non-biomass) pollution from other regions of the globe. This model suggests that the apportionmentof about half of the aerosol BC at the South–West Atlantic may derive from South Americanbiomass burning.
Key words black carbon . South–WestAtlantic . AntarcticPeninsula . back trajectories . GCM
1 Introduction
The Intergovernmental Panel for Climate Change (IPCC 2001) estimates that aerosol blackcarbon (BC) contributes with +0.8±0.4 W m−2 to the global atmospheric temperatureincreases, which is comparable to the methane contribution. Due to the shorter lifetime ofaerosol BC in the atmosphere, while methane is globally distributed, it is more associated toclimate effects at the regional scale than at the global scale (Wang 2004). This is consistentwith the findings of Menon et al. (2002), based on a GISS climate computer model andaerosol data from 46 ground stations in China. They reported that intensified flooding anddroughts over the northern and southern regions of China during the summer season couldbe linked to significant amounts of aerosol BC inputs into the low troposphere from highpolluted regions of Asia. According to that study, the aerosol BC heats the air, changes theregional atmospheric stability and vertical motions, resulting in alterations of the hydrologiccycle with significant regional climate effects. Their model also indicates that, besides theregional impacts, teleconnection processes can be expected resulting in changes of rainfalland surface temperature patterns in other parts of the world.
For the South American continent, especially Brazil, both source-terms of aerosol BC (fossilfuel and biomass burning) are expected to have significantly raised during the last decades, as aresult of growing urbanization and increased deforestation of Amazon, “Cerrado” and theCoastal Atlantic forest. In general, the inter-annual behavior of the continental atmospheric BCemissions present a minimum during the summer season (December, January and February)due to the boundary layer elevation and a predominant rainy regime, mainly at the (sub)tropicaldomain. The maximum concentrations in the southeastern coastal areas show a bi-modalpattern due to two different sources. The first one predominates during July and August, theaustral winter season, when aerosol BC emitted from urban/industrial sites tends to concentrate
J Atmos Chem
at surface levels due to the boundary layer lowering in a stable troposphere (Castanho andArtaxo 2001). This represents the major process of aerosol BC atmospheric increase in thecoastal West Atlantic atmosphere that encloses the largest urban regions of Brazil, Uruguayand Argentina, in the latitudinal band of 22–35°S. From August on, the aerosol BCatmospheric concentrations start a steady reduction at urban domains (Castanho and Artaxo2001). The second source-term is triggered during the austral late winter and in the springseason (August–November) being characterized by drier weather at Central South America,when most of the biomass burning events occur (Kaufman et al. 1998). Some of the largescale biomass burning events may export aerosol BC to the West-Atlantic coast and theeffectiveness of that process depends on the intensity and positioning of the SACZ (SouthAtlantic Convergent Zone), Freitas et al. 1996. The SACZ is an anti-cyclonic air current flowregime that drives air from the central, northern and southeastern regions of Brazil, to thesouth, at the West-Atlantic coast. Its occurrence is related to the South Atlantic Subtropical High(SASH) circulation. The center of the SASH tends to move seasonally to the east over theAtlantic Ocean in the summer and to the west toward the continent in the winter, when the SASHridge increases from the center to the border, with easterly winds on the eastern, central, andnorthern regions (Nobre et al. 1998). According to (Nobre et al. 1998) by the end of August,convection starts to migrate in the Amazon basin toward its western position, at the border ofBrazil and Peru, and keeps its southward migration to the end of September. By that time,moderate convection is also observed over southeastern Brazil. At the end of September thetwo systems merge and a well defined band of convection oriented NW–SE is established.
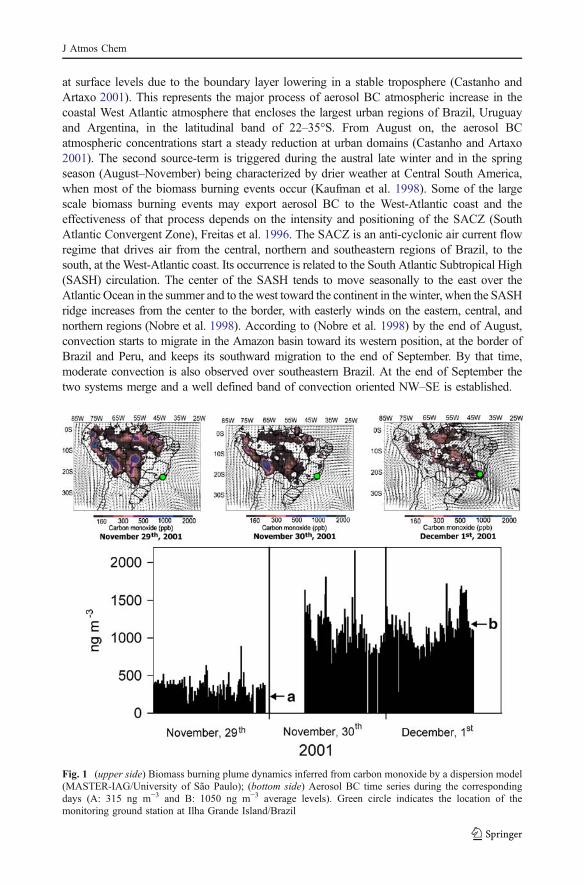
Fig. 1 (upper side) Biomass burning plume dynamics inferred from carbon monoxide by a dispersion model(MASTER-IAG/University of São Paulo); (bottom side) Aerosol BC time series during the correspondingdays (A: 315 ng m−3 and B: 1050 ng m−3 average levels). Green circle indicates the location of themonitoring ground station at Ilha Grande Island/Brazil
J Atmos Chem
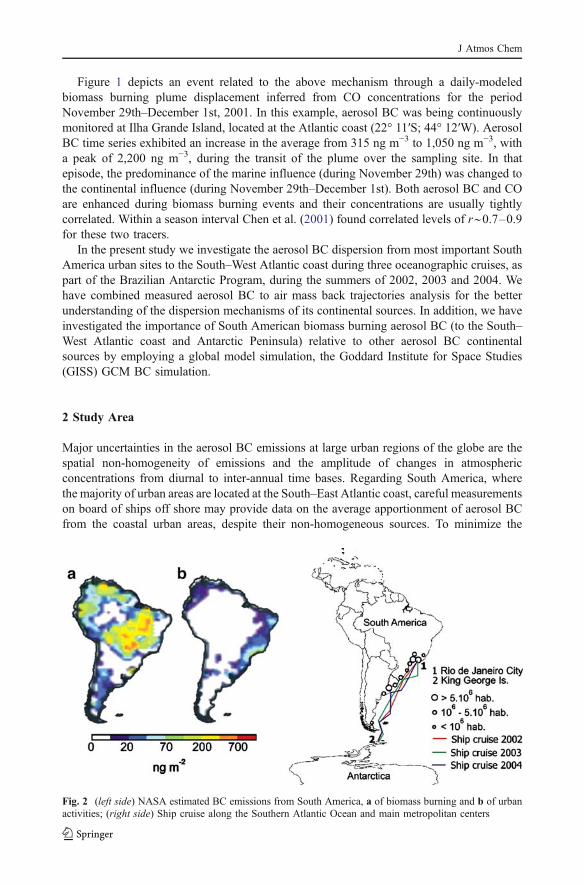
Figure 1 depicts an event related to the above mechanism through a daily-modeledbiomass burning plume displacement inferred from CO concentrations for the periodNovember 29th–December 1st, 2001. In this example, aerosol BC was being continuouslymonitored at Ilha Grande Island, located at the Atlantic coast (22° 11′S; 44° 12′W). AerosolBC time series exhibited an increase in the average from 315 ng m−3 to 1,050 ng m−3, witha peak of 2,200 ng m−3, during the transit of the plume over the sampling site. In thatepisode, the predominance of the marine influence (during November 29th) was changed tothe continental influence (during November 29th–December 1st). Both aerosol BC and COare enhanced during biomass burning events and their concentrations are usually tightlycorrelated. Within a season interval Chen et al. (2001) found correlated levels of r∼0.7–0.9for these two tracers.
In the present study we investigate the aerosol BC dispersion from most important SouthAmerica urban sites to the South–West Atlantic coast during three oceanographic cruises, aspart of the Brazilian Antarctic Program, during the summers of 2002, 2003 and 2004. Wehave combined measured aerosol BC to air mass back trajectories analysis for the betterunderstanding of the dispersion mechanisms of its continental sources. In addition, we haveinvestigated the importance of South American biomass burning aerosol BC (to the South–West Atlantic coast and Antarctic Peninsula) relative to other aerosol BC continentalsources by employing a global model simulation, the Goddard Institute for Space Studies(GISS) GCM BC simulation.
2 Study Area
Major uncertainties in the aerosol BC emissions at large urban regions of the globe are thespatial non-homogeneity of emissions and the amplitude of changes in atmosphericconcentrations from diurnal to inter-annual time bases. Regarding South America, wherethe majority of urban areas are located at the South–East Atlantic coast, careful measurementson board of ships off shore may provide data on the average apportionment of aerosol BCfrom the coastal urban areas, despite their non-homogeneous sources. To minimize the
Fig. 2 (left side) NASA estimated BC emissions from South America, a of biomass burning and b of urbanactivities; (right side) Ship cruise along the Southern Atlantic Ocean and main metropolitan centers
J Atmos Chem

influence of particular meteorological conditions during a ship cruise mission, we haveconducted aerosol BC measurements during three field campaigns. The cruises were fromRio de Janeiro (22° 54′S; 43° 10′W) to the Brazilian Antarctic Station Comandante Ferraz(62° 05′S; 058° 24′W) at King George Island/Antarctic Peninsula. Their duration was 18 daysfor 2002 (October 29th–November 16th), 18 days for 2003 (October 29th–November 16th),and 22 days for 2004 (February 14th–March 6th). Figure 2 (right part) depicts the ship cruisetrajectories between Rio de Janeiro city and King George Island, indicating the positioningof the most important urban sites at the coastal region; its left part shows NASA estimatedaerosol BC emission for South America, where (a) is related to the biomass burningcomponent and (b) to urban/industrial sources. Taking into account that our database wasobtained for the period November–February, during the 3 years of observation, we haveconsidered that a relatively predominance of the urban component would exist, compared to thebiomass burning component that predominates in the months of August–November.
3 Material and Methods
Aerosol BC was monitored by an aethalometer (Magee Scientific, model Ae-10) (MageeScientifics, Hansen and Schnell 1991) installed aboard the Brazilian Navy oceanographicresearch vessel Ary Rongel. Specific attenuation cross-section for the aerosol black carbondeposit is 19 m2/g, considering the quartz micro-fiber filter used (as recommended by
Fig. 3 South–West Atlantic aerosol BC average profiles and fitted trends. (▪) Average value (8.7 ng m−3)obtained at King George Island/Antarctic Peninsula (Pereira et al., 2006)
J Atmos Chem

Magee). An inlet was employed to prevent marine sea salt spray admission in the filterholders, due to storms and the ship movements. It was designed to provide a cut off size of10 μm. It was positioned at the top of the ship (∼10 m above sea level). Acquisition of datawas maintained at a constant airflow rate of 15 slpm and the equipment was programmedfor continuous 10 min-acquisition periods. Back trajectories were obtained from the HybridSingle-Particle Lagrangian Integrated Trajectory (HYSPLIT) Model, in the most pro-nounced peaks of aerosol BC observed at the time series (model source: http://www.arl.noaa.gov). The aerosol BC monitoring system was connected to an electric–mechanicaldevice coupled to a wind anemometer in the ship to control the sampling and preventcontamination by the ship stack’s emissions. Sampling was interrupted any time the plumeentered a sector of 45° having the intake at its origin, and maintaining about one additionalminute when the contaminated sector was cleared.
4 Results and Discussions
The average profiles obtained from the on-board aerosol BC monitoring for years 2002,2003 and 2004 depicted an almost constant decreasing trend from the tropical to sub-polar
Fig. 4 Aerosol BC concentrations at different latitudinal bands. Arrows identify selected peaks (a, b, ..., f)
J Atmos Chem
latitudes, Fig. 3. The basic feature of the decrease of atmospheric concentrations withrespect to latitude could be described by logarithm fittings as presented by Eqs. 1, 2 and 3:
log Cbc;2002 ng m�3� � ¼ 14:06� 2:76 log x; r2 ¼ 0:56 ð1Þ
log Cbc;2003 ng m�3� � ¼ 15:93� 3:19 log x; r2 ¼ 0:90 ð2Þ
log Cbc;2004 ng m�3� � ¼ 15:59� 2:95 log x; r2 ¼ 0:83 ð3Þ
where “x” refers to the latitude. Kruskal–Wallis non-parametric analysis indicated that asignificant statistical difference exists among the results of the three cruises (p<0.05). AerosolBC concentrations tended to be higher for successive cruises. The most pronounceddifferences occurred at the latitude band of 30–50°S. Maximum values were found around
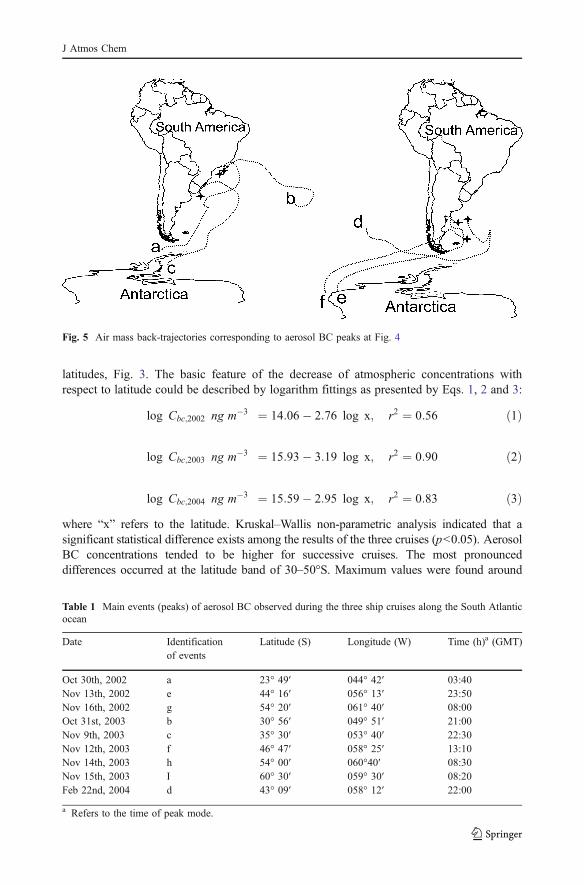
Fig. 5 Air mass back-trajectories corresponding to aerosol BC peaks at Fig. 4
Table 1 Main events (peaks) of aerosol BC observed during the three ship cruises along the South Atlanticocean
Date Identificationof events
Latitude (S) Longitude (W) Time (h)a (GMT)
Oct 30th, 2002 a 23° 49′ 044° 42′ 03:40Nov 13th, 2002 e 44° 16′ 056° 13′ 23:50Nov 16th, 2002 g 54° 20′ 061° 40′ 08:00Oct 31st, 2003 b 30° 56′ 049° 51′ 21:00Nov 9th, 2003 c 35° 30′ 053° 40′ 22:30Nov 12th, 2003 f 46° 47′ 058° 25′ 13:10Nov 14th, 2003 h 54° 00′ 060°40′ 08:30Nov 15th, 2003 I 60° 30′ 059° 30′ 08:20Feb 22nd, 2004 d 43° 09′ 058° 12′ 22:00
a Refers to the time of peak mode.
J Atmos Chem
latitude 25°S what suggests a large input of aerosol BC from the “urban complex” composedby the cities of Rio de Janeiro and São Paulo, which at the resolution of Fig. 2, represent anunique source-term. A second peak (deviation from the trend) was observed just belowlatitude 35°S and may represent the influence of Argentine urban activities. Concentrationvalues between 40 and 62°S decreased steadily to a minimum level as those observed in theAntarctic Peninsula since the 1990s (Penner et al. 1993; Evangelista 1998; Wolff and Cachier1998; Pereira et al. 2006). The two fit curves at Fig. 3 represent the effects due to BC sourcesin Brazil (I) and with the accretion of Argentine and Uruguay sources (II). Despite this non-continuous behavior, results of the three campaigns are related to the aerosol BC long-termaverage observed at the Brazilian Antarctic Station Comandante Ferraz at King George Island(8.7 ng m−3), Pereira et al. 2006.
4.1 Case studies
Figures 4 and 6 depicts the position of the peaks presented at Table 1, with their respectivereferences at the coast line. Legends in the figure represent the states of Brazil located at theAtlantic coast (RJ: Rio de Janeiro, SP: São Paulo, PR: Paraná, SC: Santa Catarina, RS: RioGrande do Sul). Figures 5 and 6 shows back trajectory for the selected peaks, obtained fromthe HYSPLIT transport and dispersion model (http://www.arl.noaa.gov/ready.html). Theywere calculated to match the ship coordinates at the dates and approximate time of interestfor the BC peaks at sea level.
The Fig. 4 presents an exponential-like decrease of concentrations by the time the shipleft Rio de Janeiro city, which is characteristic of the typical behavior of a distance-to-source pollutant dispersion pattern. Event “a” represents a pulse concentration within thisdecrease trend. The corresponding air mass back trajectory at Fig. 5 shows the occurrenceof a sub-polar air mass originated at the West Antarctic Peninsula before the event. The sub-
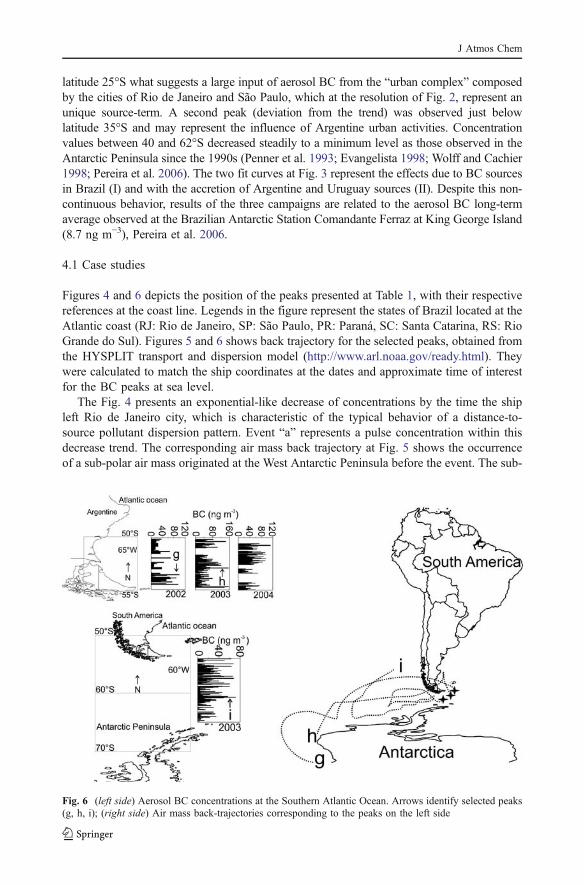
Fig. 6 (left side) Aerosol BC concentrations at the Southern Atlantic Ocean. Arrows identify selected peaks(g, h, i); (right side) Air mass back-trajectories corresponding to the peaks on the left side
J Atmos Chem
polar front moved northeast over the Atlantic Ocean, up to the tropical South Americacoast, reaching Brazil. At the vicinity of Uruguay it started to develop an anti-cyclonicmotion striking the coastal region of Southeast Brazil just at its urban area. The peak ofaerosol BC was observed in the latitudes corresponding to the frontier between São Pauloand Paraná State. Event “a” can be identified as a typical example of advective transport ofaerosols from the Brazilian urban sites to the West–South Atlantic. Differently from theprevious one, the event “b” is influenced by an air mass derived from the middle SouthAtlantic Ocean, driven to the coast by the SASH circulation. The air mass developed azonal motion in the east-to-west direction reaching the continental region of Brazil. Itflowed initially through the coastline, probably induced by the topography of the Serra doMar mountain ridge, and also through the large urban areas of Brazil, before reaching theship coordinates. Aerosol BC at event “b” has the same source-terms of event “a”. Bothevents “a” and “b” were characterized by their well-defined shape and their short duration,which correspond to rapid advective transport due to strong winds associated to the abovemeteorological systems. Event “c” also presented similar characteristics of event “a”, this is,influenced by the advection of sub-polar frontal systems. The air mass, originated at theAntarctic Peninsula, moved northwards through the Atlantic Ocean and around the latitude50°S it developed an anti-cyclonic motion affecting the South of Brazil and Uruguay. Afterthen, it reached the ship coordinates. These two regions can be the source-terms of theaerosol BC peak. Although event “c” is identified in the time series at Fig. 4 (significantlyhigh compared to the background line base), it does not have a comparable markedresolution as those observed during events “a” and “b”. Conditions of atmospheric stabilityduring the event “c” and/or the associated less significant urban source-terms at thecontinental region may be the causes of the broad-like peak shape observed. Event “d” wascharacterized by its very short duration. Corresponding back trajectories analyses pointedout to a source-term localized at the Ocean Pacific most southwestern region, the drakePassage, what is not reasonable. Therefore such type of event may represent the ship’scontamination. Events “e”, “f”, “g” and “h” are all characterized by only small increases inBC concentrations compared to the background base line and also by the migration of sub-Antarctic polar air through non significant urban sources at South America. Figure 2(left)aindicates that from latitude 35°S to Terra del Fuego in Chile, aerosol BC emissions arecontrolled more to biomass burning process than to urban/industrial activities. Although oflesser intensity (mostly associated to agriculture practices and house heating) biomassburning can be, potentially, the source-terms of aerosol BC corresponding to the aboveevents. Event “i” (Fig. 6) is associated to an air mass which origin is related to the SouthAmerica. Its anti-cyclonic motion at the Drake Passage, parallelal to the AntarcticPeninsula, would probably transport the aerosol BC to the ship coordinates.
5 South America Biomass Burning Dispersion: Model Simulations
In order to investigate the importance of South American biomass burning aerosol BCrelative to other BC sources, we have used a global model simulation, the Goddard Institutefor Space Studies (GISS) GCM BC simulation (Koch and Hansen, 2005; Koch et al. 2006;in press). Koch and Hansen (2005) used this model to isolate various source regions toexamine the origins of aerosol BC in the Arctic. Koch et al. (2006; in press) investigated theorigins of aerosols in other regions, including the southern hemisphere. To do this, theyperformed multiple simulations isolating (industrial) sources from Asia, North America,and Europe and biomass sources from Africa and South America, relative to a full-
J Atmos Chem

simulation including all emissions. Here we use these simulations to look at the dispersal ofSouth American biomass burning aerosol BC.
The model includes mass transport of all aerosol species, although we only consideraerosol BC here. For a full model description we refer to Koch and Hansen (2005) andKoch et al. (2006; in press). Industrial (here includes residential sources) BC is assumed tobe emitted as insoluble and becomes soluble as it ages (with e-fold age of approximately1 day). Biomass aerosol BC is assumed to be emitted along with soluble components and isassigned a solubility of 50%.
Industrial aerosol BC emissions are from Bond et al. (2004). Biomass burning emissionsare based on the Global Fire Emissions Database (GFED) model estimates for the years1997–2001 (van der Werf et al. 2003; 2004). According to these inventories, 8.2 Tg BC isemitted annually, 3.7 Tg BC from biomass burning and the rest from industrial sources.South America emits 1.2 g (about one third of global) biomass BC and about 0.2 Tg BCfrom other sources. Thus, according to these estimates, about 84% of South American BCis from biomass burning.
Fig. 7 (upper side) Percent contributions to aerosol BC surface concentrations coming from South Americanbiomass burning (a), African biomass burning (b) and South Asian industry and residential sources (c);(lower side) GISS model results for aerosol BC surface concentration (ng m−3)
J Atmos Chem

The upper part of Fig. 7 shows the percent contribution to aerosol BC surfaceconcentrations coming from 3 sources: (a) South American biomass burning, (b) Africanbiomass burning and (c) Indian industrial and residential sources. In the South Atlanticabout half of the aerosol BC comes from South American biomass burning, with this sourcedominating in the central east region. Further north, African biomass burning dominates.Further south various sources contribute, although the South American source is the largest.Thus we see that 10–30% of the aerosol BC in the southern oceans each comes fromAfrican biomass and Indian sources. Pollution in these regions is lofted high into theatmosphere, advected poleward in the general circulation and descends in the polar vortex(Koch et al. in press).
In Fig. 7 (bottom part) we show the annual mean aerosol BC surface concentration forthe model simulation (including all sources). In the southern hemisphere most of the aerosolBC comes from biomass burning in South America and Africa, and this aerosol BC tends tobe advected westward from these continents. The model experiments that isolate thebiomass pollution from South America and Africa and industrial (non-biomass) pollutionfrom other regions allow us to discern the sources of South Atlantic aerosol BC.
A comparison between the coastal Atlantic aerosol BC estimated by the GISS model andthe averaged aerosol BC measured during the three ship cruises exhibited a significantdiscrepancy. Measured values are higher compared to modeled values. Main differences areobserved within two latitudinal bands: between latitudes 26 and 42°S, a factor of 1.2 to 2.1is present; and between latitudes 42 and 62°S a factor ranging from 5.2 to 8.8 exists. Figure 8shows the correlation between model predicted values and measured aerosol BC at theAtlantic coast. In the figure, letters (a, b, ..., i) indicate latitudinal bands: a (26–30°S; 45–49°W); b (30–34°S; 49–52°W); c (34–38°S; 52–53°W); d (38–42°S; 53–57°W); e(42–46°S; 57–58°W); f (46–50°S; 58–60°W); g (50–54°S; 60–61°W); h (54–58°S; 61–59°W) and i (58–62°S; 59–58°W).
Biomass burning products apportionment in the Atlantic coast is dependent on thecontinental wind regime, which must be favorable to the atmospheric transport from the
0 50 100 150 200Coastal BC (measured) ng m
0
50
100
150
200
Coa
stal
BC
(G
ISS
) ng
m
Y = 0.62 X - 14.6
r = +0.91
-3
-3
a
bcd
e
fghi
Fig. 8 Predicted aerosol BC val-ues from GISS model and mea-sured values along the coastalSouth America. Letters indicatelatitudinal bands (see text)
J Atmos Chem

mainland to the coast line; on the intensity and frequency of fire spots; and on the climateregime concerning the accumulated precipitation level. During favorable atmospherictransport conditions, as the example depicted in Fig. 1, the migration of biomass burningplumes towards the Atlantic coast was responsible for increases of aerosol BC to a factor of3.3 higher than the regional background from industrial sources. Here the GISS modelconsiders a database of emissions enclosing the period 1997–2001, which corresponded toa period of relative low fire spot incidence. In contrast to the period of atmosphericmonitoring from 2002 to 2004, when fire spot frequency was ∼ 50% higher (1997–2001:mean annual fire spots was 113,782 and 2002–2004: mean annual fire spots was 225,987;http://www.dpi.inpe.br/proarco/bdqueimadas). Although the database presented here corre-sponded to the initial descending period of the biomass burning season (Table 1), its effectsover the South American continent may still remains. If we consider that the dominateoutflow positioning of the SACZ at the Atlantic coast occurs between latitudes 15 and 45°S,the discrepancy between model and measured values at the latitudinal band of 26 and 42°Scan be better explained. In addition, we have also to consider the contributions of industrialsources, which were pointed out by the HYSPLIT Model (air mass backtrajectories “a”, “b”and “c” at Fig. 5). Higher discrepancies observed for the latitudinal band 42–62°S probablycan not be merely deduced from the uncertainties on inventories of biomass burning andindustrial emissions. Liousse et al. (1993) reported that specific attenuation cross-sectionfor the aerosol black carbon (σBC) may change from 20 m2/g for Savana biomass burning to5 m2/g for aerosol BC at remote regions of the globe. The optical attenuation techniqueemployed to the measurement of BC using the aethalometer makes use of an algorithm inwhich the concentrations are inversely proportional to σBC. Therefore if the differencesbetween model and measurements (from Patagonia to Antarctic Peninsula) were due toinstrumentation, we would expect a higher discrepancy between them. Besides reduction inemissions inventories uncertainties, for the mid and high latitudes at the Southern Atlantic,improvements in model characteristics and measuring techniques are still required.
6 Conclusions
We have measured and analyzed aerosol black carbon (BC) dispersion over the South–WestAtlantic coast up to the northern Antarctic Peninsula. The dispersion at the South–WestAtlantic was attributed to mixed coastal industrial sources and biomass burning sourcesrevealed by the results obtained during three scientific cruises in 2002, 2003 and 2004. Inaddition, the geographically aerosol BC biomass burning dispersion between SouthAmerica and Antarctic Peninsula was inferred from a global model simulation, theGoddard Institute for Space Studies (GISS) GCM BC simulation.
The oceanic monitoring at the latitudinal band 22–62°S, permitted to investigate theaerosol BC plume dispersion from identified urban emission sources at South America andto observe the effect of main synoptic scale systems associated to them. In addition to thewell known effect of the SACZ that transports aerosol BC (and other biomass burningbyproducts) from central Brazil to the South–West Atlantic coast, we have observed thatsub-polar front trajectories along the Atlantic is responsible for the dispersion of aerosol BCfrom the urban sources towards the South–West Atlantic atmosphere. Aerosol BC averageconcentrations obtained from the long-term monitoring at the north of the AntarcticPeninsula could be explained by the average trend obtained at the South Atlantic. Despitethe decreases of aerosol BC concentrations southwards (from ∼1,200 ng m−3 at latitude 22°S
J Atmos Chem
to ∼10 ng m−3 at latitude 62°S), peak events could be associated to air mass backtrajectories analysis which described the air mass enrichment by aerosol BC as it migratesthrough the source regions.
The use of a global model simulation, the Goddard Institute for Space Studies (GISS)GCM BC simulation, allowed isolating the biomass pollution from South America andAfrica and industrial (non-biomass) pollution from other regions of the globe. It permittedto conclude that the apportionment of about half of the aerosol BC at the South–WestAtlantic may derive from South American biomass burning.
Acknowledgments This work was supported by the Brazilian Antarctic Program (PROANTAR-CNPq)/MMA grant (Project 55.0353/2002-0: Ice-atmosphere relationship). We kindly thank to the Ary RongelOceanographyc Ship staff for technical support during the north–south expeditions to Antarctica. The authorsgratefully acknowledge the NOAA Air Resources Laboratory (ARL) for the provision of the HYSPLITtransport and dispersion model and/or READY website (http://www.arl.noaa.gov/ready.html) used in thispublication; and Mr. Heber R. Passos from INPE/CPTEC for the control wind system to avoid sampling ofthe ship's smoke.
References
Bond, T.C., Streets, D.G., Yarber, K.F., Nelson, S.M., Woo, J., Klimont, Z.: A technology-based globalinventory of black and organic carbon emissions from combustion. J. Geophys. Res. 109, D14203(2004), doi:10.1029/JD003697, (2003)
Castanho, A.D.A., Artaxo, P.: Wintertime and summertime São Paulo aerosol apportionment study. Atmos.Environ. 35, 4889–4902 (2001)
Chen, L.W.A., Doddridge, B.G., Dickerson, R.R.: Observation of carbonaceous aerosols and carbonmonoxide at a suburban site: Implication for an emission inventory. International Emission InventoryConference, “One Atmosphere, One Inventory, Many Challenges.” Denver, CO, April 30 (2001)
Evangelista, H.: Emprego do Radônio na caracterização de Fenômenos de Transporte e Impacto Ambientalatmosféricos na Ilha Rei George (Antártica). Tese de Doutorado UERJ, Rio de Janeiro, (1998)
Freitas, S.R., Longo, K.M., Dias, M.A.F.S., Artaxo, P.: Numerical modeling of air mass trajectories from thebiomass burning areas of the Amazon basin. An. Acad. Bras. Ciênc. (Regional Conference on GlobalChange) 68, 193–206 (1996)
Hansen, D.A., Schnell, R.C.: The Aethalometer. Magge Scientific Company, Berkeley, CA (1991)IPCC: Report of working group I of the intergovernmental panel on climate change, summary for
policymakers (2001)Kaufman, Y.J., Hobbs, P.V., Artaxo, P., Remer, L.A., Holben, B.N., King, M.D., Ward, D.E., Prins, E.M.,
Longo, K.M., Mattos, L.F., Nobre, C.A., Spinhirne, J.D., Ji, Q., Thompson, A.M., Gleason, J.F.,Christopher, S.A., Tsay, S.-C.: Smoke, clouds, and radiation – Brazil (SCAR-B) experiment. J. Geophys.Res. 103(D24), 31783–31808 (1998)
Koch, D., Hansen, J.: Distant origins of Arctic Black Carbon: A GISS ModelE experiment, J. Geophys. Res.110(D04204), (2005), doi:10.1029/JD005296, 2005
Koch, D., Schmidt, G.A., Field, C.: Sulfur, sea-salt and radionuclide aerosols in GISS modelE. J. Geophys.Res. 111(D06206), (2006)
Koch, D., Streets, D., Bond, T., Hansen, J., Bell, N., van der Werf, G.: Regional and sectoral attributions ofpresent-day aerosols, submitted to J. Geophys. Res. in press (2006)
Liousse, C., Cachier, H., Jennings, S.G.: Optical and thermal measurements of black carbon aerosol contentin different environments: Variation of the specific attenuation cross-section, sigma (σ). Atmos. Environ.27, 1203–1211 (1993)
Menon, S., Hansen, J., Nazarenko, L., Luo, Y.: Climate effects of black carbon in China and India. Science297, 2250–2253 (2002)
Nobre, C.A., Mattos, L.F., Dereczynski, C.P., Tarasova, T.A., Trosnikov, I.: Overview of atmosphericconditions during the Smoke, Clouds and Radiation-Brazil (SCAR-B) field experiment. J. Geophys. Res.103(D24), 31809–31820 (1998), December 27
Penner, J.E., Eddleman, H., Novakov, T.: Towards the development of a global inventory for carbonoelementar emissions. Atmos. Environ. 27A, 1277–1295 (1993)
J Atmos Chem

Pereira, E.B., Evangelista, H., Pereira, K.C.D., Cavalcanti, I.F.A., Setzer, A.W.: Apportionment of blackcarbon in the South Shetland Islands, Antarctic Peninsula. J. Geophys. Res. 111 (2006), DO3303.doi:10.1029/2005JD006086
van der Werf, G.R., Randerson, J.T., Collatz, G.J., Giglio, L.: Carbon emissions from fires in tropical andsubtropical ecosystems. Glob. Chang. Biol. 9, 547–562 (2003)
van der Werf, G.R., Randerson, J.T., Collatz, G.J., Giglio, L., Kasibhatla, P.S., Arellano, A.F., Olsen, S.C.,Kasischke, E.S.: Continental-scale partitioning of fire emissions during the 1997 to 2001 El Nino/LaNina period. Science 303, 73–76 (2004)
Wang, C.: A modeling study on the climate impacts of black carbon aerosols. J. Geophys. Res. 109 (2004),DO3 106. doi:10.1029/2003JD004084
Wolff, W.E., Cachier, H.: Concentration and seasonal cycle of black carbon in at a coastal Antarctic Station.J Geophys. Res. 103, D9, 11033–11041 (1998)
J Atmos Chem