Solving Systems of Equations. Graphing There are three methods to solving systems of equations by...
30
Solving Systems of Equations
-
Upload
alexis-burke -
Category
Documents
-
view
219 -
download
0
Transcript of Solving Systems of Equations. Graphing There are three methods to solving systems of equations by...
Solving Systems of Equations
GraphingThere are three methods to solving
systems of equations by graphing:
1) Write both equations in slope – intercept form and graph
2) Write both equations in slope-intercept form and graph using the calculator
3) Solve for the x and y intercepts of each equation
Graphing
Solve the following system of equations by graphing:
-6x +3y = -15
-4x +y = -11
Graphing – Method 1
Write both equations in slope – intercept form and graph. To do this, solve each equation for y
-6x +3y = -15
-4x +y = -11
Graphing – Method 1
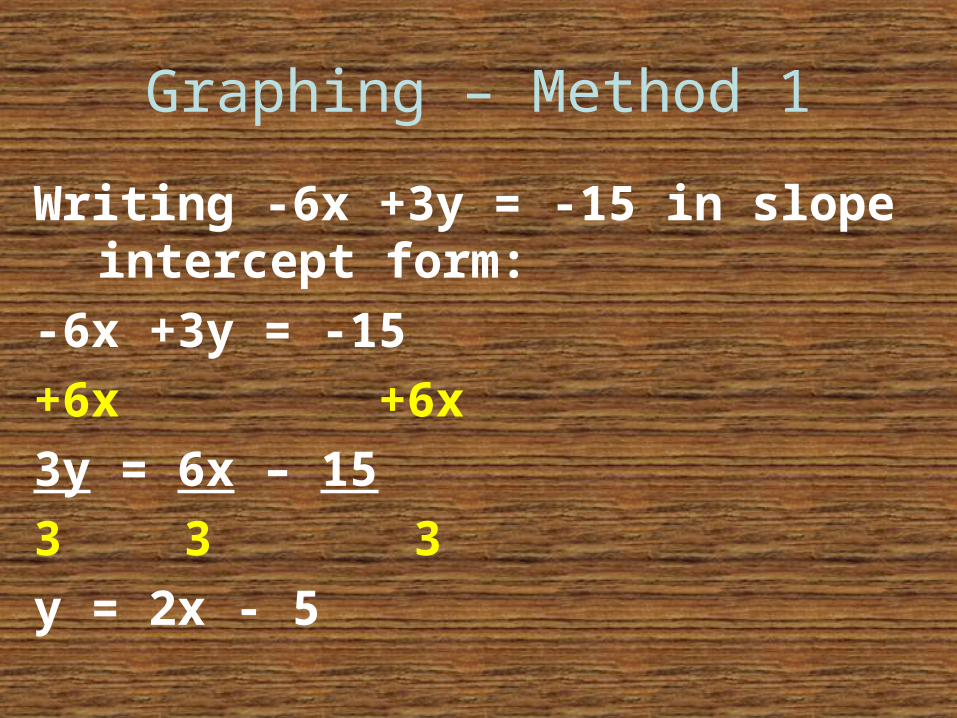
Writing -6x +3y = -15 in slope intercept form:
-6x +3y = -15
+6x +6x
3y = 6x – 15
3 3 3
y = 2x - 5

Graphing – Method 1
Writing -4x + y = -11 in slope intercept form:
-4x + y = -11
+4x +4x
y = 4x - 11
Graphing – Method 1
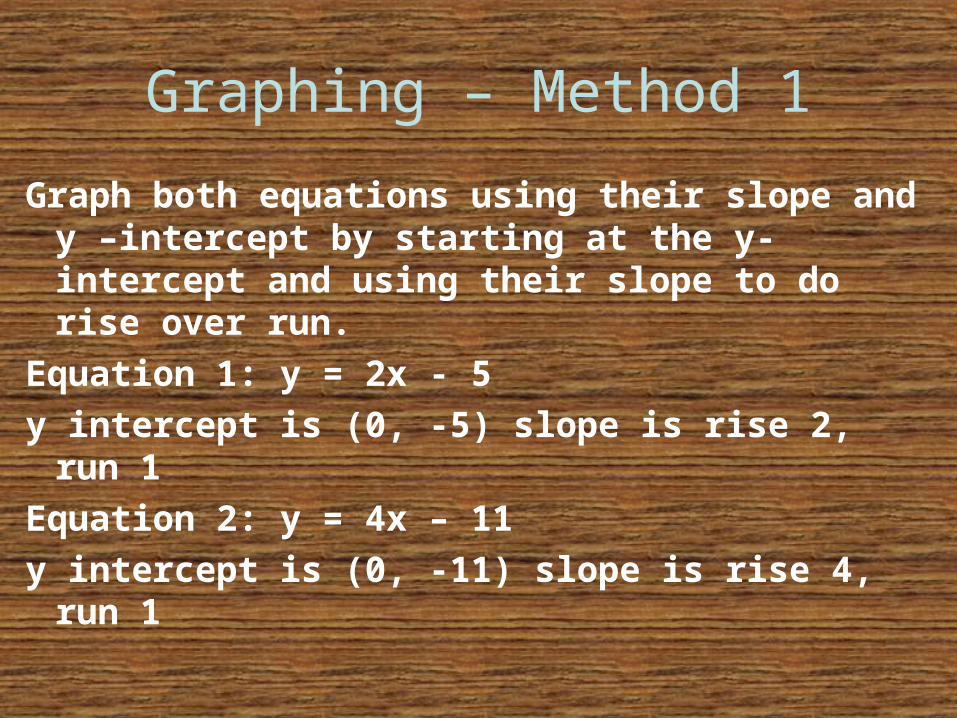
Graph both equations using their slope and y –intercept by starting at the y-intercept and using their slope to do rise over run.
Equation 1: y = 2x - 5
y intercept is (0, -5) slope is rise 2, run 1
Equation 2: y = 4x – 11
y intercept is (0, -11) slope is rise 4, run 1
Graphing – Method 1
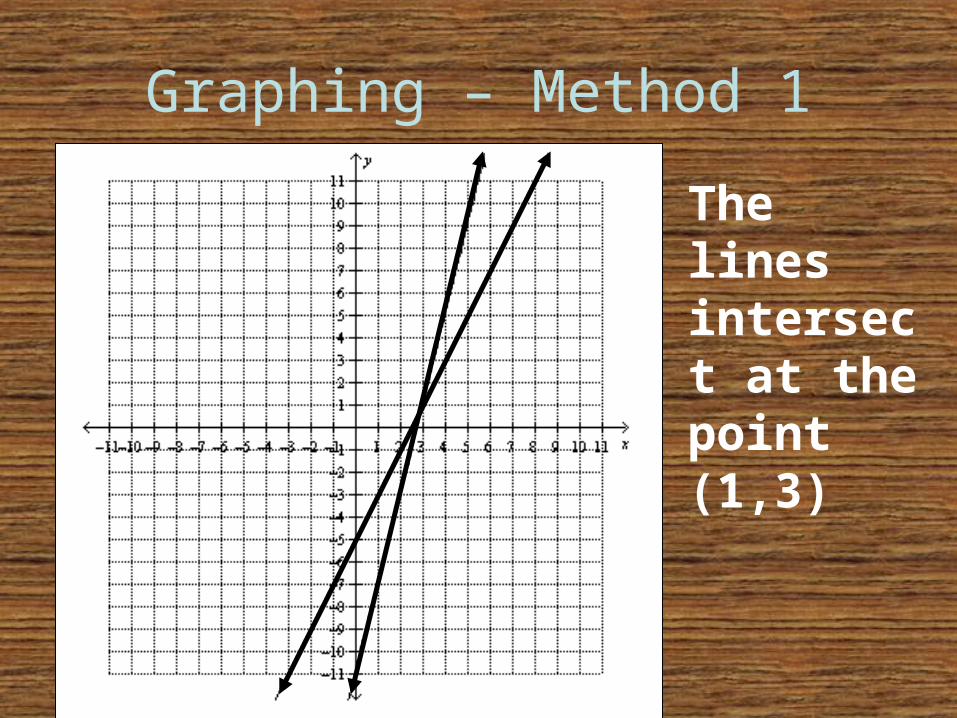
The lines intersect at the point (1,3)
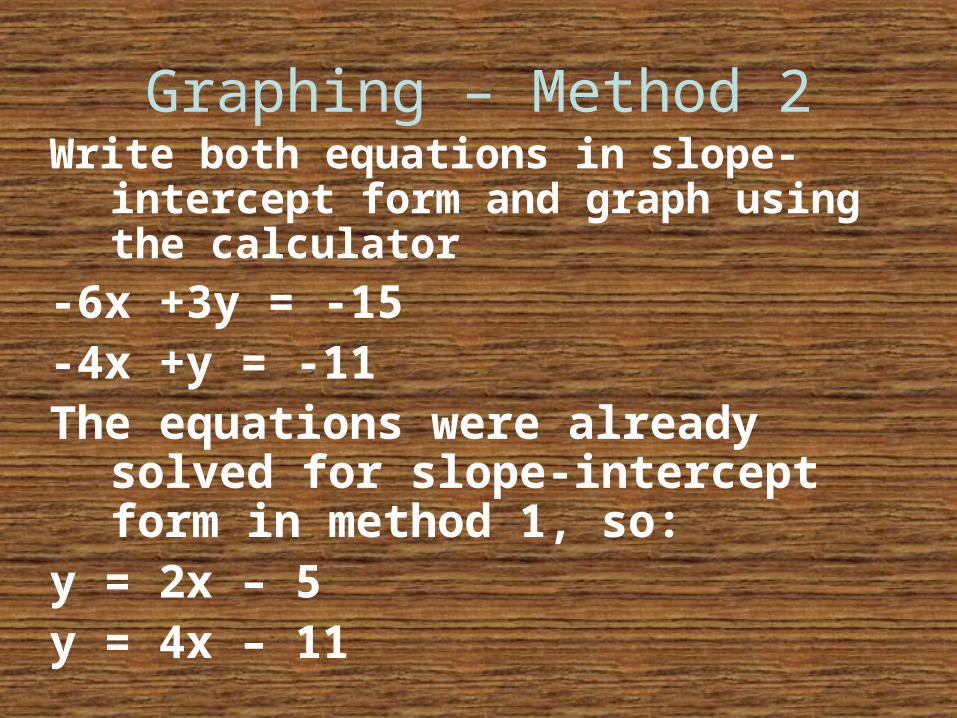
Graphing – Method 2Write both equations in slope-intercept
form and graph using the calculator
-6x +3y = -15-4x +y = -11The equations were already solved for
slope-intercept form in method 1, so:
y = 2x – 5y = 4x – 11
Graphing – Method 2 (TI-84+)
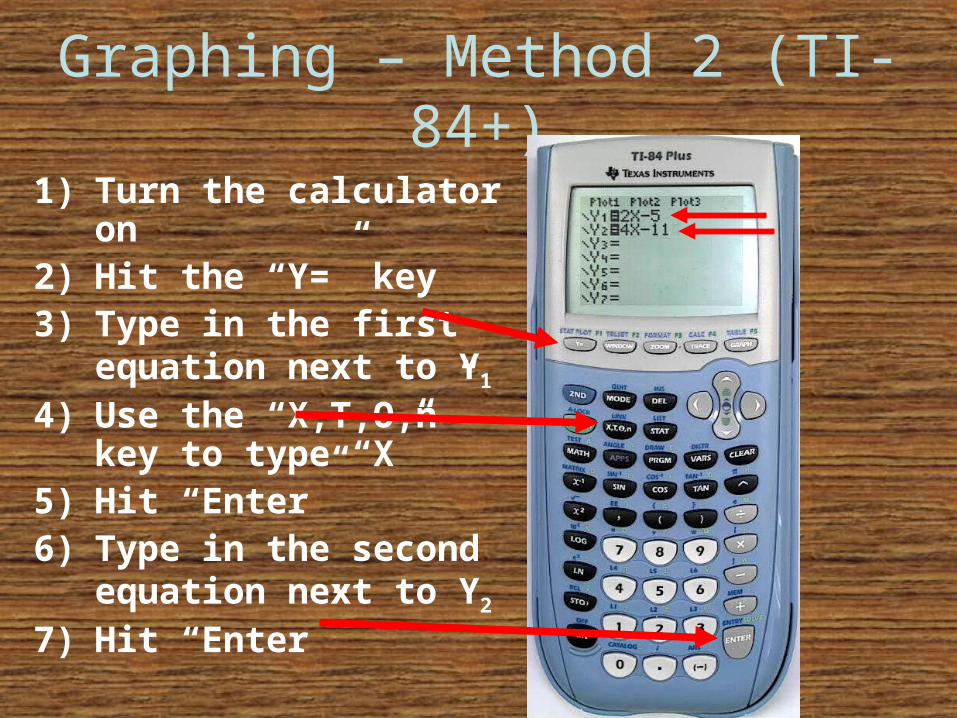
1) Turn the calculator on2) Hit the “Y=” key3) Type in the first
equation next to Y1
4) Use the “X,T,O,n” key to type “X”
5) Hit “Enter”6) Type in the second
equation next to Y2
7) Hit “Enter”
Graphing – Method 2 (TI-84+)
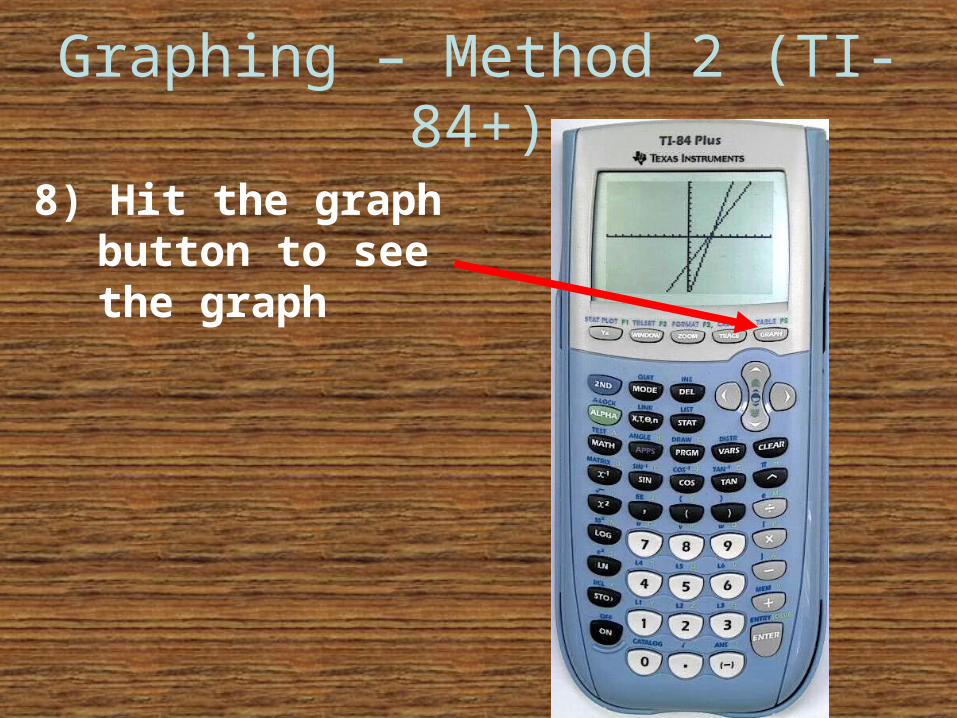
8) Hit the graph button to see the graph
Graphing – Method 2 (TI-84+)
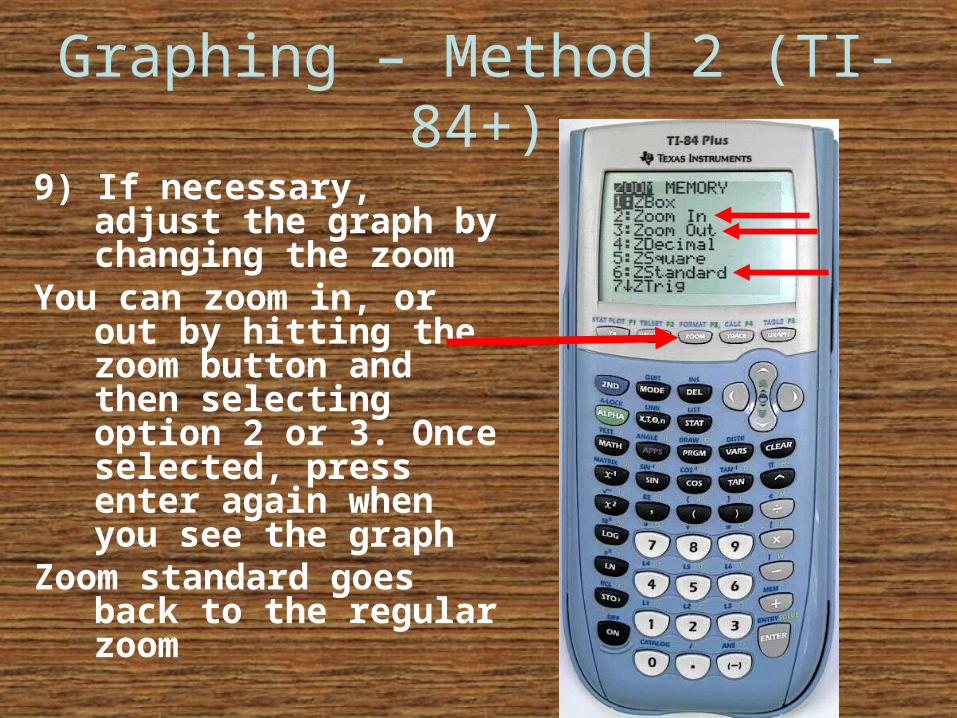
9) If necessary, adjust the graph by changing the zoom
You can zoom in, or out by hitting the zoom button and then selecting option 2 or 3. Once selected, press enter again when you see the graph
Zoom standard goes back to the regular zoom

Graphing – Method 2 (TI-84+)10) When looking at the
graph hit the “CALC” button. Do this by hitting the “2ND” key followed by the “TRACE” key
11) Move down to choice five and select “intersect”
12) Press “Enter” and the calculator will return to the graph.

Graphing – Method 2 (TI-84+)
13) The calculator will prompt you to select the first curve. Use the arrows to put the blinking cursor on one of the lines
14) Hit “Enter”
Graphing – Method 2 (TI-84+)
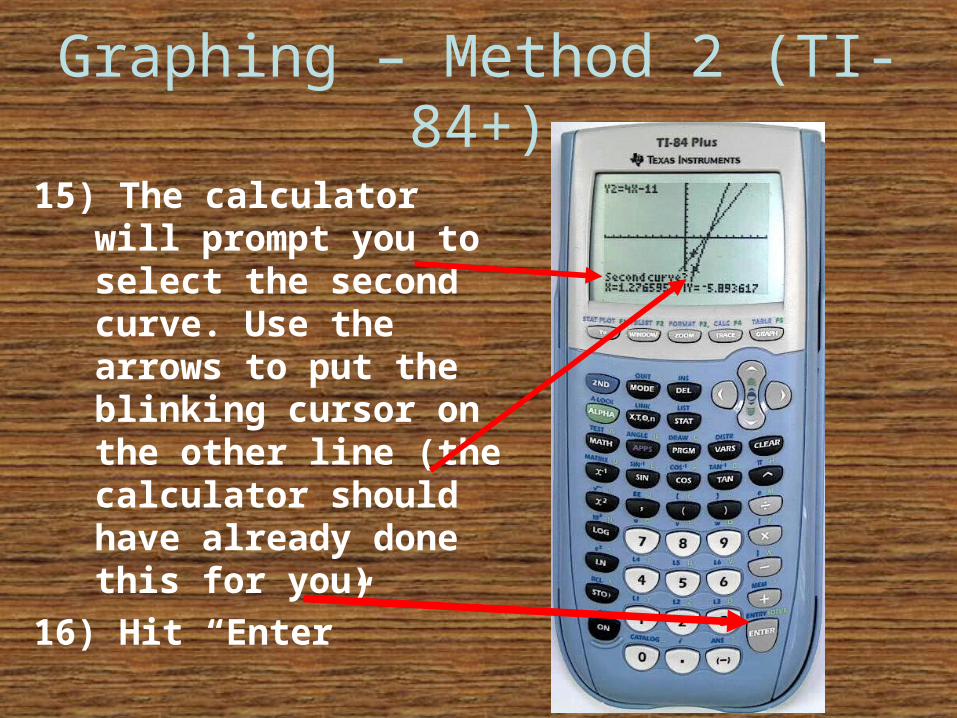
15) The calculator will prompt you to select the second curve. Use the arrows to put the blinking cursor on the other line (the calculator should have already done this for you)
16) Hit “Enter”
Graphing – Method 2 (TI-84+)
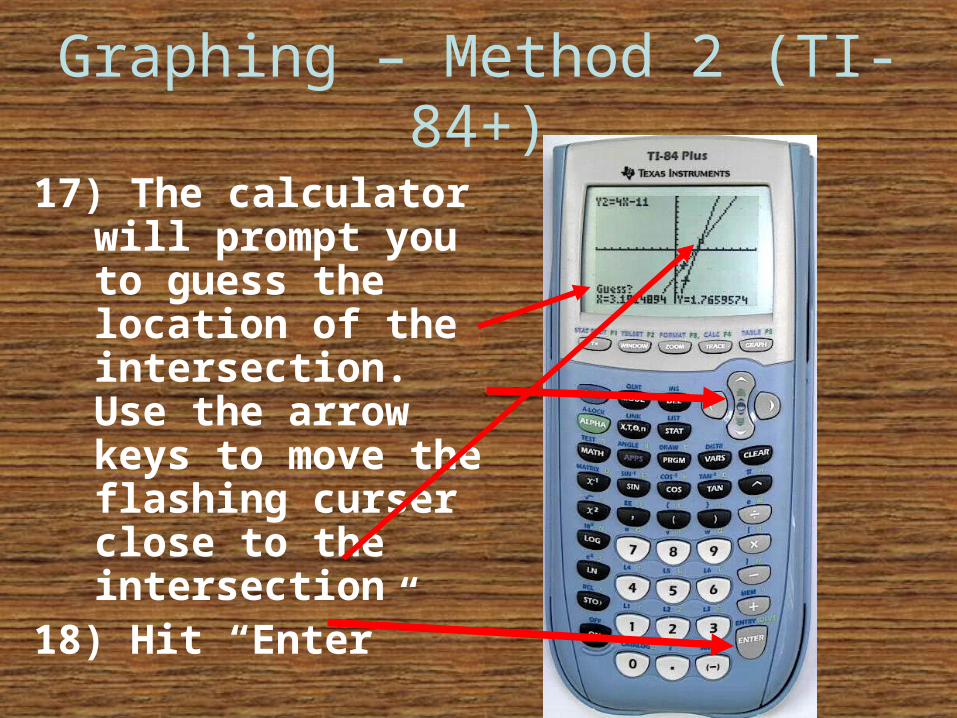
17) The calculator will prompt you to guess the location of the intersection. Use the arrow keys to move the flashing curser close to the intersection
18) Hit “Enter”
Graphing – Method 2 (TI-84+)
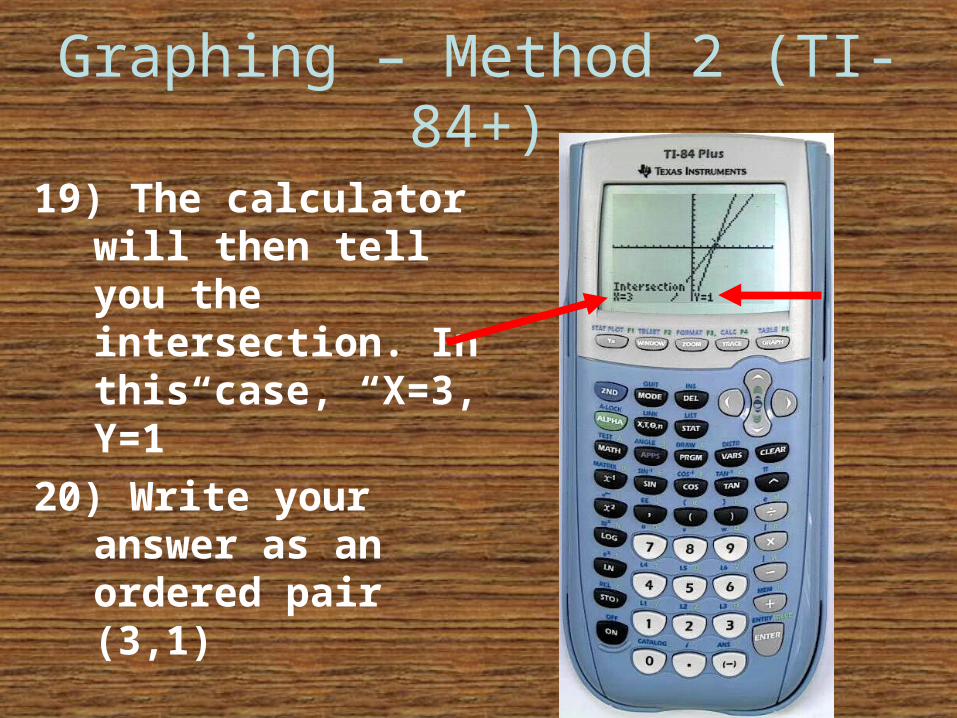
19) The calculator will then tell you the intersection. In this case, “X=3, Y=1”
20) Write your answer as an ordered pair (3,1)
Graphing – Method 2 (TI-89)
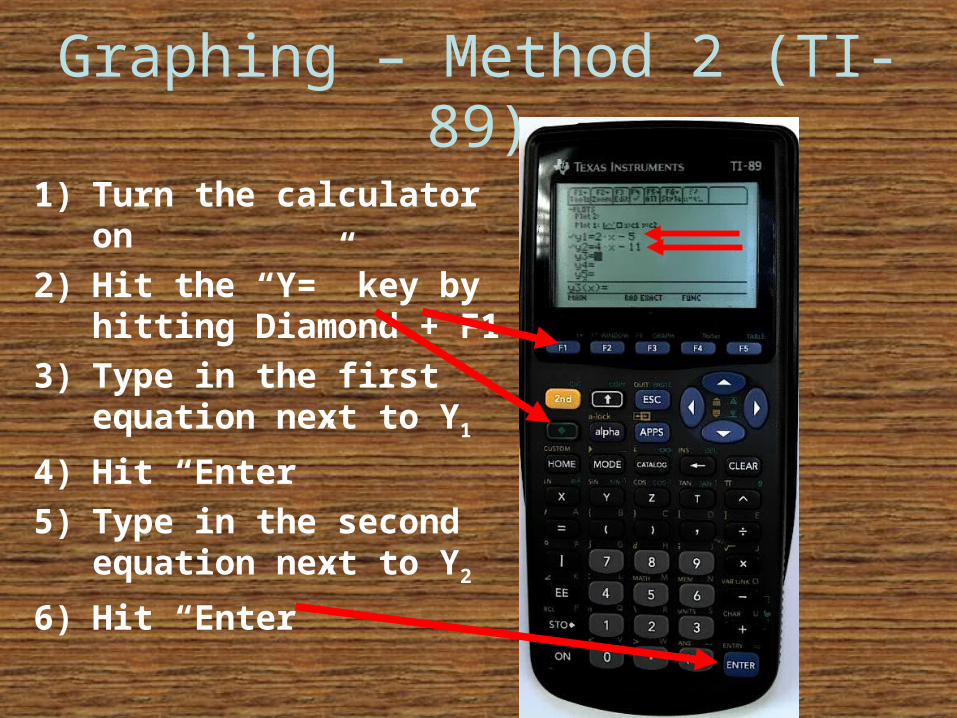
1) Turn the calculator on
2) Hit the “Y=” key by hitting Diamond + F1
3) Type in the first equation next to Y1
4) Hit “Enter”
5) Type in the second equation next to Y2
6) Hit “Enter”
Graphing – Method 2 (TI-89)
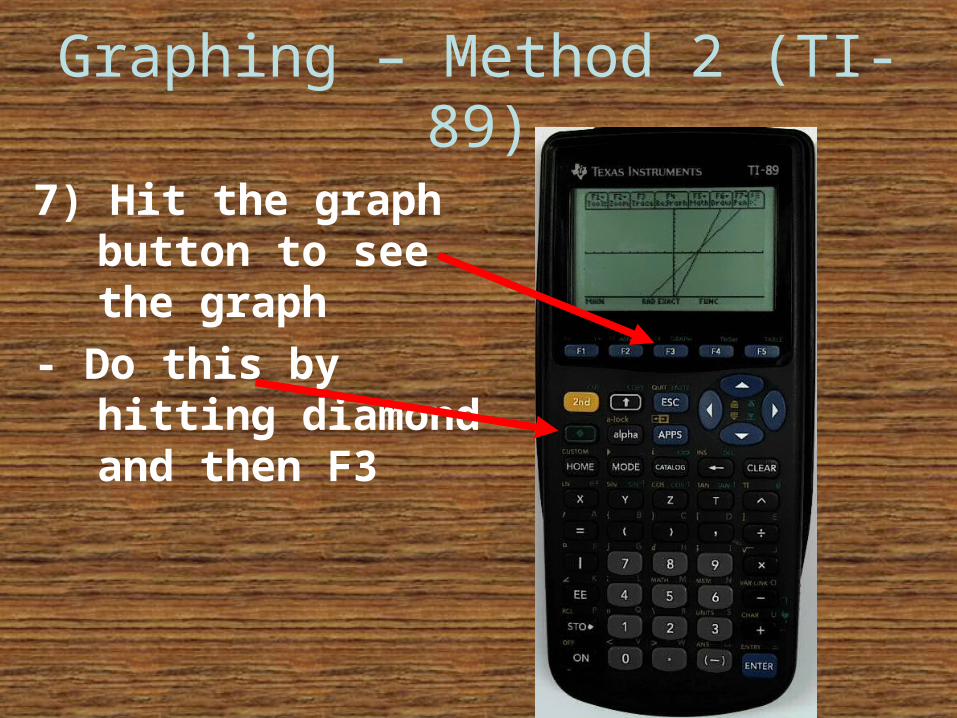
7) Hit the graph button to see the graph
- Do this by hitting diamond and then F3
Graphing – Method 2 (TI-89)
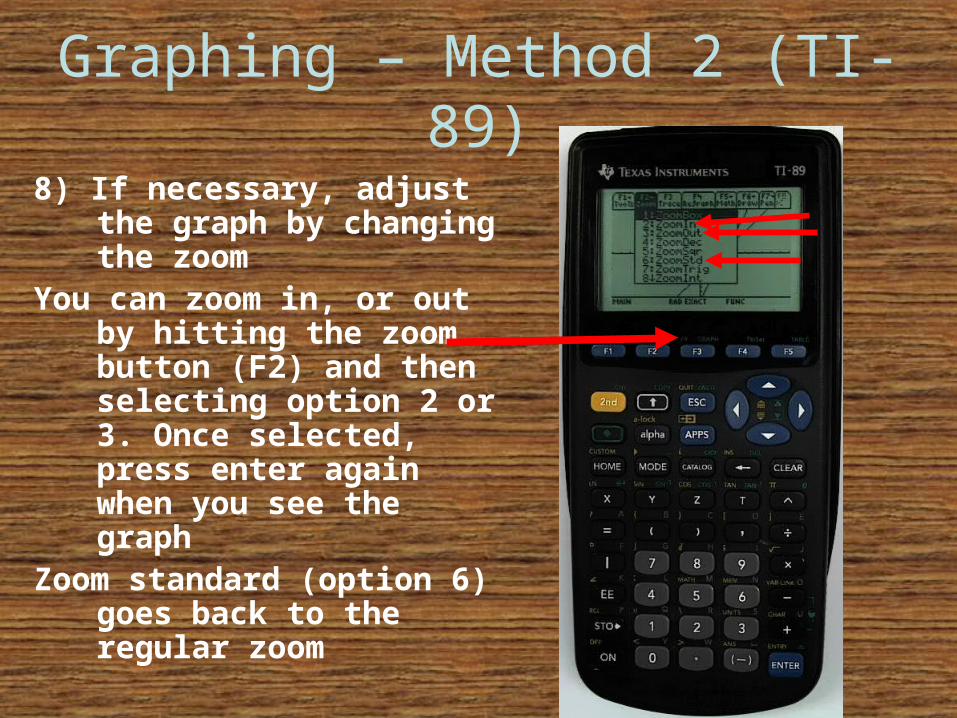
8) If necessary, adjust the graph by changing the zoom
You can zoom in, or out by hitting the zoom button (F2) and then selecting option 2 or 3. Once selected, press enter again when you see the graph
Zoom standard (option 6) goes back to the regular zoom
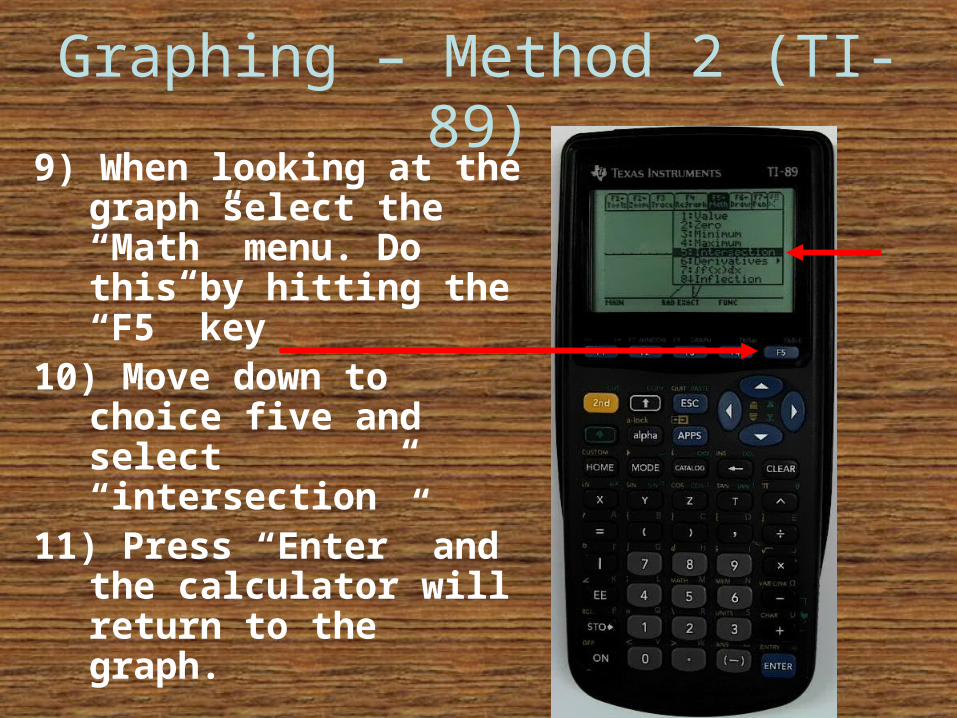
Graphing – Method 2 (TI-89)9) When looking at the
graph select the “Math” menu. Do this by hitting the “F5” key
10) Move down to choice five and select “intersection”
11) Press “Enter” and the calculator will return to the graph.

Graphing – Method 2 (TI-89)
12) The calculator will prompt you to select the first curve. Use the arrows to put the blinking cursor on one of the lines
13) Hit “Enter”

Graphing – Method 2 (TI-89)
14) The calculator will prompt you to select the second curve. Use the arrows to put the blinking cursor on the other line (the calculator should have already done this for you)
15) Hit “Enter”
Graphing – Method 2 (TI-89)
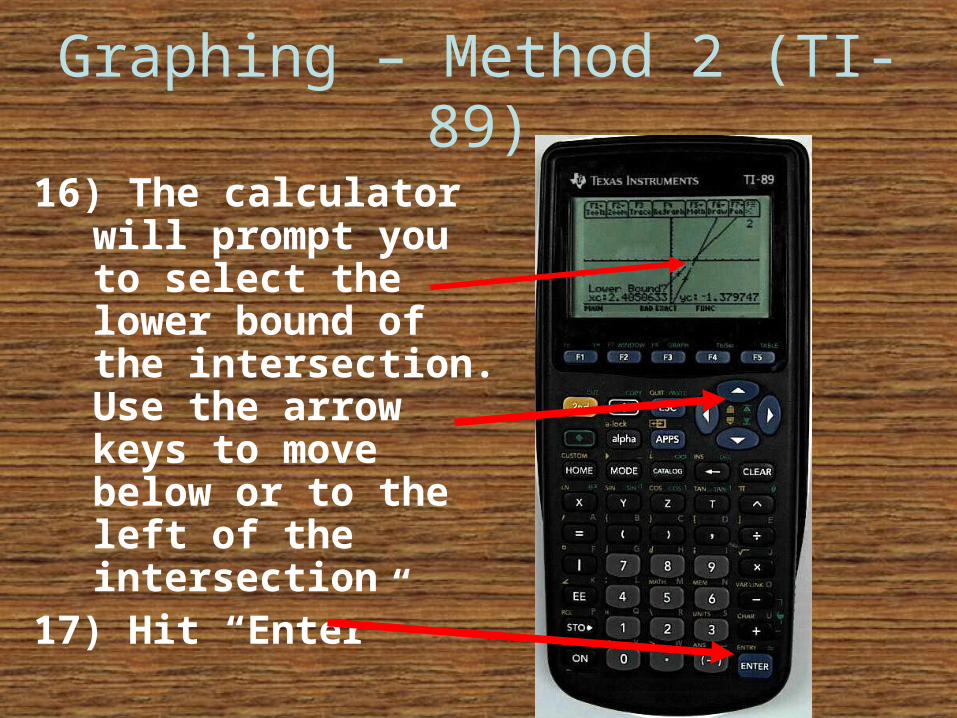
16) The calculator will prompt you to select the lower bound of the intersection. Use the arrow keys to move below or to the left of the intersection
17) Hit “Enter”
Graphing – Method 2 (TI-89)
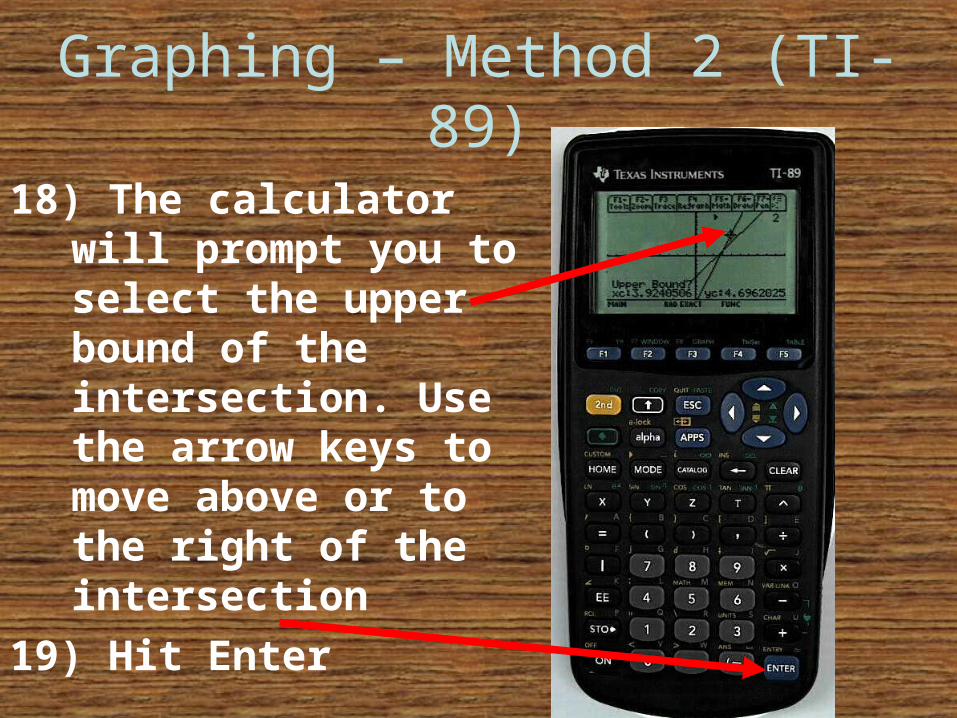
18) The calculator will prompt you to select the upper bound of the intersection. Use the arrow keys to move above or to the right of the intersection
19) Hit Enter
Graphing – Method 2 (TI-89)
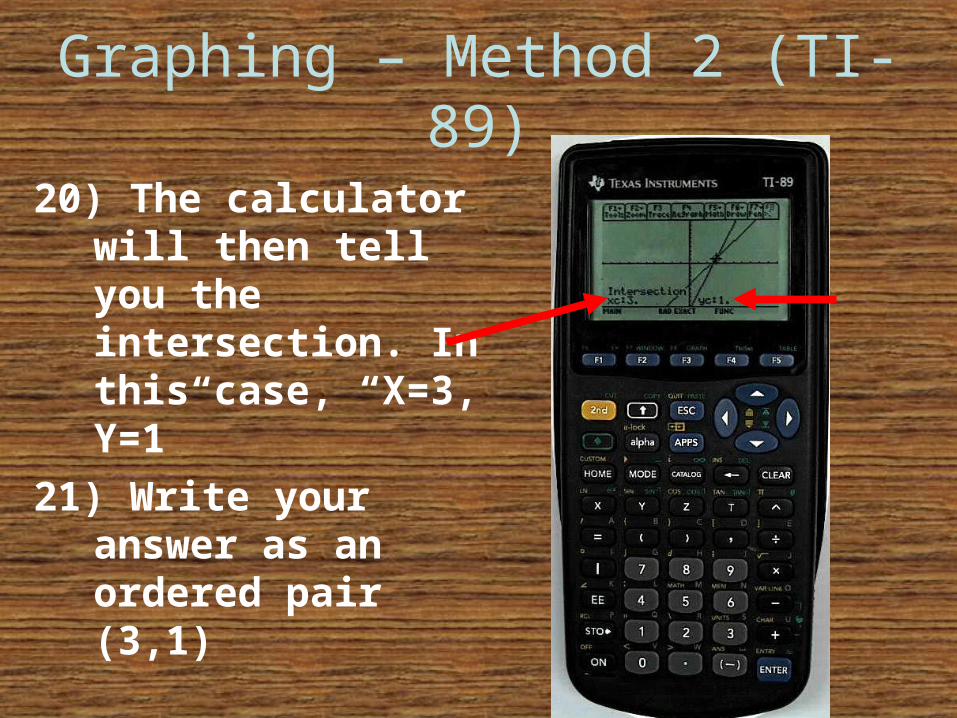
20) The calculator will then tell you the intersection. In this case, “X=3, Y=1”
21) Write your answer as an ordered pair (3,1)
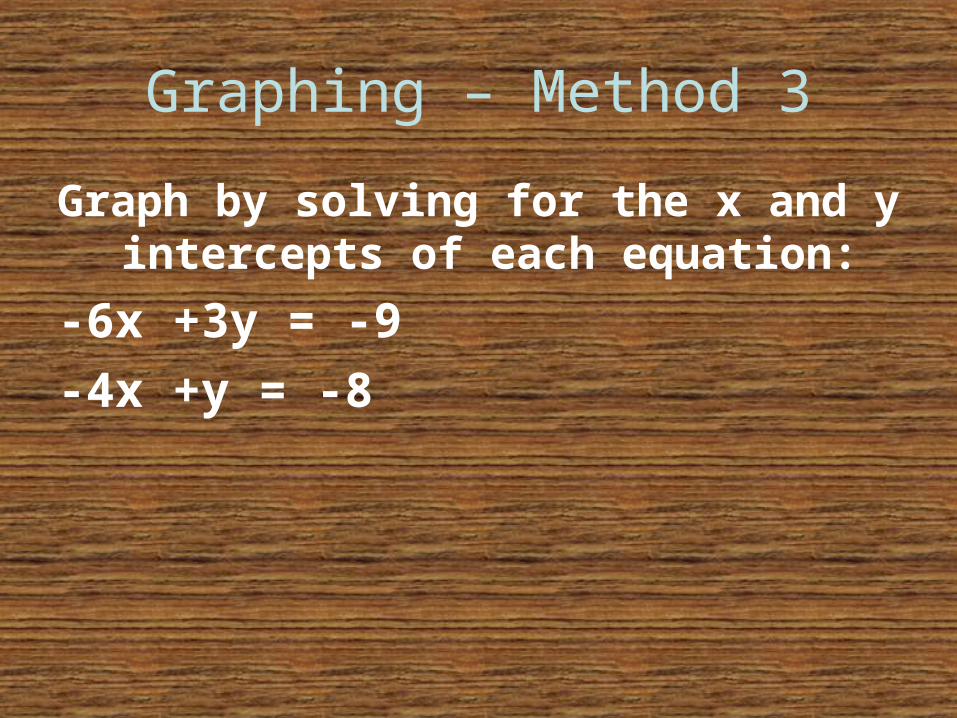
Graphing – Method 3
Graph by solving for the x and y intercepts of each equation:
-6x +3y = -9
-4x +y = -8
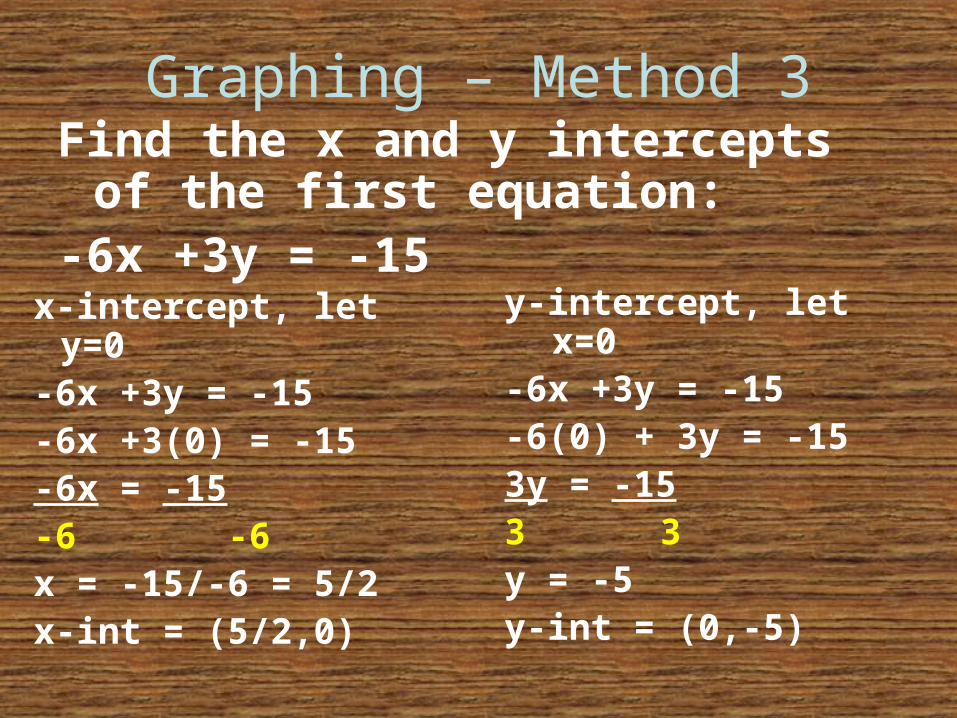
Graphing – Method 3Find the x and y intercepts of the
first equation:-6x +3y = -15
x-intercept, let y=0-6x +3y = -15-6x +3(0) = -15-6x = -15-6 -6x = -15/-6 = 5/2x-int = (5/2,0)
y-intercept, let x=0-6x +3y = -15-6(0) + 3y = -153y = -153 3y = -5y-int = (0,-5)
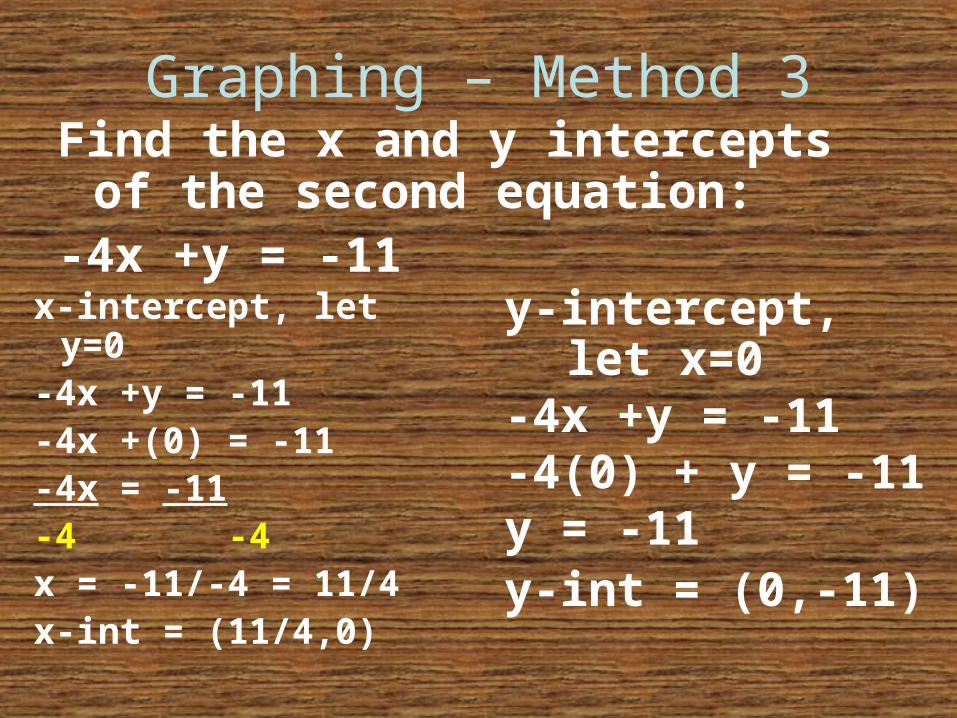
Graphing – Method 3Find the x and y intercepts of the
second equation:-4x +y = -11
x-intercept, let y=0-4x +y = -11-4x +(0) = -11-4x = -11-4 -4x = -11/-4 = 11/4x-int = (11/4,0)
y-intercept, let x=0-4x +y = -11 -4(0) + y = -11y = -11y-int = (0,-11)
Graphing – Method 3
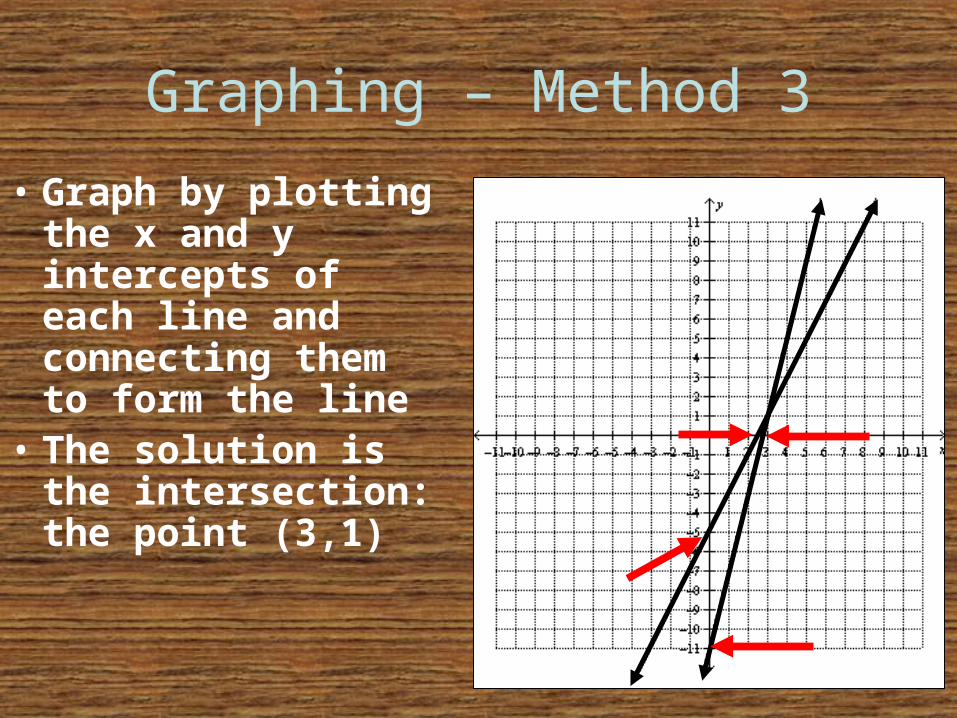
• Graph by plotting the x and y intercepts of each line and connecting them to form the line
• The solution is the intersection: the point (3,1)