Solutions for intelligent nutrition - VTT research
106
VTT RESEARCH NOTES 2514 Emilia Selinheimo, Maria Saarela, Minna Halonen, Raija Koivisto, Aimo Tiilikainen, Marika Lyly, Jarno Mikkonen, Pekka Lehtinen, Mirja Mokkila, Anu Kaukovirta-Norja & Kaisa Poutanen Solutions for intelligent nutrition Nutritech roadmap
Transcript of Solutions for intelligent nutrition - VTT research
VTT RESEARCH NOTES 2514
Emilia Selinheimo, Maria Saarela, Minna Halonen, Raija Koivisto, Aimo Tiilikainen, Marika Lyly, Jarno Mikkonen, Pekka Lehtinen, Mirja Mokkila, Anu Kaukovirta-Norja & Kaisa Poutanen
Solutions for intelligent nutritionNutritech roadmap


VTT TIEDOTTEITA – RESEARCH NOTES 2514
Solutions for intelligent nutrition Nutritech roadmap
Emilia Selinheimo, Maria Saarela, Minna Halonen, Raija Koivisto, Aimo Tiilikainen, Marika Lyly, Jarno Mikkonen, Pekka Lehtinen,
Mirja Mokkila, Anu Kaukovirta-Norja & Kaisa Poutanen

2
ISBN 978-951-38-7542-8 (soft back ed.) ISSN 1235-0605 (soft back ed.)
ISBN 978-951-38-7543-5 (URL: http://www.vtt.fi/publications/index.jsp) ISSN 1455-0865 (URL: http://www.vtt.fi/publications/index.jsp)
Copyright © VTT 2009
JULKAISIJA – UTGIVARE – PUBLISHER
VTT, Vuorimiehentie 5, PL 1000, 02044 VTT puh. vaihde 020 722 111, faksi 020 722 4374
VTT, Bergsmansvägen 5, PB 1000, 02044 VTT tel. växel 020 722 111, fax 020 722 4374
VTT Technical Research Centre of Finland, Vuorimiehentie 5, P.O. Box 1000, FI-02044 VTT, Finland phone internat. +358 20 722 111, fax +358 20 722 4374
Technical editing Mirjami Pullinen Edita Prima Oy, Helsinki 2009

3
Emilia Selinheimo, Maria Saarela, Minna Halonen, Raija Koivisto, Aimo Tiilikainen, Marika Lyly, Jarno Mikkonen, Pekka Lehtinen, Mirja Mokkila, Anu Kaukovirta-Norja & Kaisa Poutanen. Solutions for intelligent nutrition. Nutritech roadmap. Espoo 2009. VTT Tiedotteita – Research Notes 2514. 99 p. + app. 1 p.
Keywords food, nutrition, health, well-being, consumer, service
Abstract The objective of this roadmap was to feature the drivers, needs and future poten-tial for various actors involved in the food production and distribution chain, but also for actors developing services offering communication and motivation tools for consumers who wish to improve their nutrition. The roadmap was divided in two parts: 1) background part, which gives readers a review of the state of art, and 2) the actual roadmap part. In the roadmap process, seven general drivers influencing the challenges and needs of various stakeholders in the area of foods, nutrition and eating patterns were first identified: healthcare costs, sustainability, ubiquitous ICT, information flow, ageing, cultural mixing and individualism. Then five themes, 1) Convenience, 2) Values and communality, 3) Physiologi-cal functionality, 4) Communication and 5) Personification, were identified in multidisciplinary workshops. The themes were discussed one by one in a view of nutrition and eating habits in thematic sub-roadmaps, with following outcome.
Convenience includes saving of time, but also saving of psychological energy and effort. Need of convenience is linked to availability and delivery of healthy foods, easiness of understanding and monitoring the impact of food on health. Values and communality guide consumers’ food choices and eating habits. The importance of collective and protective values will increase, although food price and taste are still the most important determinants of buying decisions. Genera-tion of new communities will continuously increase fragmentation, and the new consumer sectors will be based more on lifestyle factors than on traditional demographics. Understanding physiological functionality of food is the template of the roadmap, since diet has a major effect on health and quality of life. Based on the new information about health effects of foods, development of functional foods tailored for certain risk groups will continue. Personal risk scores will be utilised in the future to facilitate dietary guidance. Communication is today that

4
consumers use various communication channels, but they are critical to reliability of communication. Personal and entertaining communication not restricted to the place or devices will increase. Personification means that healthy diets are based on personal taste and health needs, as well as on culture and values. Personal guid-ance solutions direct food choices according to personal risks and physiology.
During the roadmap process, various fields in which there is place and need for new innovations to improve food supply and to facilitate healthy eating were identified. Technologies for the development of the intrinsic properties of the food product itself are the core of the system. Modern bioprocessing, i.e. the exploitation of intrinsic or added enzymes and microbial fermentation, offers plenty of opportunities to design specific product properties, and also for boost-ing of energy and raw material efficiency. Revealing of the physiological re-sponses in humans and subsequent health effects is facilitated by the rapid de-velopments of nutritional systems biology. Both control and design of the pro-duction chain and the research in the area of health effects produce plenty of interesting and relevant information to the consumer. Capitalizing on this infor-mation, as well as design of convenient and experience-giving packaging and delivery systems, is another large opportunity. Development of new packaging materials and ubiquitous ICT offer potential for new innovations in this respect. Another opportunity of ICT is to educate the consumer to realise the benefits of healthy eating by diagnostic and monitoring tools.
Taking the visions of the different subareas together, the vision for the whole roadmap was formulated as “Well-being through eating”. Individual foods make up one’s diet, and the diet is the basis of nutrition. Intelligent nutrition is based on choices of foods and meals which bring multiple values to the consumer – pleasure for the senses and for fulfilling one’s values, as well as long-term health benefits through minimising risks of diseases. In the modern society, offering intelligent nutrition solutions means, in addition to development of the food production systems, also development of the delivery, communication and per-sonalization services matching the needs of urban consumers. This opens up a range of new business opportunities.
This roadmap will serve as a starting point for the VTT Innovation Pro-gramme “Solutions for Intelligent Nutrition”, where the aim will be to develop technologies and services enabling to achieve well-being through eating.

5
Preface Food production and distribution makes a link between the agricultural and health sectors. Climate change and demand for sustainable energy management are important drivers in raw material production and food processing. On the other hand, maintenance of human health and well-being is a major challenge globally. Availability of food is a prerequisite of life, but balanced nutrition is also an input to health maintenance and quality of life. Because of rapid changes in dietary and lifestyle patterns, diet-related diseases including obesity, diabetes mellitus and cardiovascular disease are increasingly significant causes of disabil-ity and premature death, and a burden to the healthcare. Food sector is facing new challenges to assist consumers in their new needs.
VTT had in 2007–2009 a collaborative research programme with University of Kuopio for the development of expertise in the area of healthy nutrition. During that period, a roadmap process was initiated in order to feature the drivers, chal-lenges and research strategies for development of new technologies and concepts for promotion of well-being by nutritional means. Three workshops were held with experts from different fields in food and nutrition research and food processing, and the preliminary roadmap was discussed in an open seminar in January 2009.
The objective of this roadmap is to feature the drivers, needs and future potential for various actors involved in the food production and distribution chain, but also for actors developing services offering communication and motivation tools for consumers who wish to improve their nutrition. The roadmap is divided in two parts: 1) “Background of eating and well-being” which gives readers a review of the state of art and 2) “Roadmap to health and well-being through eating” which is the actual roadmap part. This roadmap will serve as a starting point for the VTT Innovation Programme “Solutions for Intelligent Nutrition”, where the aim will be to develop technologies and services enabling to achieve well-being through eating.
Espoo, 27 November 2009
The authors

6
Contents
Abstract ................................................................................................................. 3
Preface.................................................................................................................. 5
Background of eating and well-being.................................................................... 9
1. Significance of food in health ........................................................................ 11 1.1 Diet, nutrition and eating habits ........................................................................................ 11 1.2 Diet and health.................................................................................................................. 13 1.3 Food allergies ................................................................................................................... 17 1.4 Increasing healthcare costs .............................................................................................. 18
2. Lifestyle and food.......................................................................................... 20
3. Strategies towards healthier eating .............................................................. 23 3.1 Dietary recommendations ................................................................................................. 23 3.2 Health claims .................................................................................................................... 26 3.3 Collaboration platforms and research policies.................................................................. 31
4. Food sector ................................................................................................... 35 4.1 Global food and drinks industry ........................................................................................ 35 4.2 European food and drinks industry ................................................................................... 36 4.3 Finnish food and drinks industry ....................................................................................... 37 4.4 Functional foods and ingredients markets ........................................................................ 38 4.5 Convenience food and drinks markets ............................................................................. 41 4.6 Future food and drinks packaging..................................................................................... 42 4.7 Food distribution and retail market.................................................................................... 45
5. Nutrition-related businesses ......................................................................... 50
Roadmap to health and well-being through eating ............................................. 55
6. Nutritech roadmap process........................................................................... 57 6.1 Nutritech roadmap – an integrated approach to health and well-being through eating .... 57 6.2 Structure of the Nutritech meta-roadmap ......................................................................... 61

7
7. General drivers ............................................................................................. 63
8. Nutritech trends and vision – growing the Nutritech tree from five perspectives ........................................................................................................ 66
8.1 Convenience ..................................................................................................................... 68 8.2 Values and communality................................................................................................... 71 8.3 Physiological functionality ................................................................................................. 74 8.4 Communication ................................................................................................................. 78 8.5 Personification .................................................................................................................. 81
9. Summary and conclusions............................................................................ 84
Acknowledgements ............................................................................................. 92
References.......................................................................................................... 93
Appendices
Appendix A: Picture of the Nutritech roadmap tree

8

9
Background of eating and well-being

10

1. Significance of food in health
11
1. Significance of food in health
1.1 Diet, nutrition and eating habits
According to WHO (WHO Technical Report series 916, 2003), rapid changes in diets and lifestyles have occurred with industrialisation, urbanisation, economic development and market globalization. Food and food products have become commodities produced and traded in a market that has expanded from an essen-tially local base to an increasingly global one. Changes in the world food econ-omy are reflected in shifting dietary patterns, for example, increased consump-tion of energy-dense diets high in fat, and low in unrefined carbohydrates. These patterns are combined with a decline in energy expenditure that is associated with a sedentary lifestyle.
The growth in food consumption has been accompanied by significant struc-tural changes and a shift in diet away from staples such as roots and tubers to-wards more animal products and vegetable oils. Similar trends are evident for protein availability; this has increased in both developing and industrialized countries but decreased in the transition countries. Although the global supply of protein has been increasing, the distribution of the increase in the protein supply is unequal, especially regarding animal protein, which is consumed much more in industrialized countries compared to developing countries.
Consumption of fruits and vegetables plays a vital role in providing a diversi-fied and nutritious diet. At present, only a small and negligible minority of the world’s population consumes the generally recommended high average intake of fruits and vegetables. Increasing urbanization will distance more people from primary food production, and have a negative impact on both the availability of a varied and nutritious diet with enough fruits and vegetables, and the access of especially the urban poor to such a diet.

1. Significance of food in health
12
In Finland, The National FINDIET Surveys (FINDIET 2002, 2003; FINDIET 2007, 2008) conducted by The National Public Health Institute have followed the dietary habits and nutrient intake of the adult population since 1982. Accord-ing to the FINDIET 2007 Survey of about 2000 persons, an adult working age Finnish person had, on average, six eating occasions per day. In this group, about 60% of the daily energy was derived from the main meals, which means that snacks contributed more than one-third to the daily energy intake. Working day lunch contributed about 30% of the total daily energy.
The survey showed that one-third of the daily food energy was derived from cereal and bakery products, and another one-third from meat and dairy products. The same food groups were also the main source of protein, especially meat which provided one-third of the daily protein intake. Cereal and bakery products contributed to around half of the carbohydrate intake, and over a half of the fibre intake. The main source of fibre was rye bread. The main sources of fat (over 50% of the intake) were meat, cereal and bakery products, and fat spreads and oils. Most of the salt in the diet came from bread and other cereal products, and meat. One third of men and half of women took food supplements. Vitamin and mineral intakes from food supplements were significant being several times more than the dietary intake. The use of food supplements was poorly targeted; those who took supplements already had a higher intake of vitamins and miner-als from food than the ones that didn’t. Moreover, on average, the dietary intake of most vitamins and minerals was sufficient, and food supplementation was unnecessary in most cases (FINDIET 2007, 2008).
The FINDIET 2007 Study concluded that the dietary habits of the adult Fin-nish population had generally improved. However, for example, the intake of salt and saturated fat and sucrose are too high, and the intakes of folate, vitamin D and dietary fibre are too low. Diets favouring more unrefined cereals, fish, vegetables, fruit, and berries, and containing less food with high levels of sugar and unsaturated fats, should be further encouraged.
Children and young people are important groups in terms of eating habits, and due to the increasing concern of the eating quality, a few studies have been con-ducted recently. It was observed that the quality of the children’s diet started to decline after the age of one year when the children started to partake in family meals (Kyttälä et al. 2008). The diet was closer to recommendations on week-days than on weekends, and especially children nursed at home consumed more sugar and saturated fat and less fruit and vegetables than recommended.

1. Significance of food in health
13
In another study (Hoppu et al. 2008) of 700 pupils of 7th and 8th grade from 12 secondary schools located in three different towns, 40% of the girls and 28% of the boys consumed fresh vegetables daily, and less than half the pupils’ homes had a supply of fresh vegetables available daily. Around 40% of daily energy intake among the pupils was derived from snacks. The most commonly con-sumed snacks during school time were sweets or chocolates, bread, cereal bars, fruit and sugary soft drinks. The proportion of energy derived from sugar was higher, and the intake of fibre lower than proposed by the Finnish Nutrition Recommendations. The intakes of vitamin A, vitamin D, folate and iron fell below the recommended levels.
On the other hand, the increasing number of elderly is another challenge for nutrition. According to the PhD Thesis of Merja Suominen (2007), malnutrition was common among the studied elderly residents and patients living in nursing homes and hospitals in Finland. Using the Mini Nutritional Assessment method, 11–57% of the studied elderly nursing home residents and long-term care pa-tients in Finland suffered from malnutrition, and 40–89% were at risk of malnu-trition, whereas only 0–16% had a good nutritional status.
It may be concluded that the urban quick rhythm of life is connected to many lifestyle factors influencing and interacting with the eating habits. Stress, lack of sleep and physical activity all influence eating habits and physiological re-sponses to foods, but they also pose new challenges to the food supply chain in order to fulfil the general requirements for a healthy diet, and in order to develop special foods for various subgroups. It is also important that foods fulfil the mul-tiple demands of the consumer, as the nutritional and health effects are only one on the food choice criteria. In the abundance of food offering, only those healthy foods which are available, affordable and appealing at the point of consumption will become part of the diet of an individual.
1.2 Diet and health
Diet and nutrition are important factors assisting in promotion and maintenance of good health from early childhood and throughout the whole life. The rapid global increase of chronic diseases (non-communicable diseases, NCD), is due to large changes in dietary habits and physical activity. Diabetes, coronary heart disease, cancers and osteoporosis cause about 60% of death cases and comprise almost half (47%) of all diseases worldwide. The role of nutrition in prevention of chronic

1. Significance of food in health
14
NCDs is well established. As obesity is a major risk factor in many of the chronic diseases, weight maintenance has become a major issue of most nations.
Energy-dense diets high in saturated fat and low in foods of plant origin, to-gether with a sedentary lifestyle are the major cause of the epidemic of obesity and overweight, linked with increased risks of non-communicable disease. The facts that obesity, especially abdominal obesity, is a low-grade inflammatory state, and that the adipose tissue is an active endocrine organ, are currently widely studied as contributing factors to the deterioration of the healthy homeo-stasis. Along with an increased risk of cardiovascular disease, diabetes, and sev-eral cancers, obesity is associated with increased risk of physical and cognitive disability. WHO’s latest projections in 2005 indicated that globally estimated 1.6 billion adults (age 15+) and at least 20 million children under the age of 5 years were overweight, and at least 400 million adults were obese. Prediction is that by 2015, approximately 2.3 billion adults would be overweight and more than 700 million obese. Moreover, overweight and obesity are noticeably on the rise in low- and middle-income countries, particularly in urban settings (WHO medi-acentre, 2009).
In Finland, cardiovascular risk factors have been studied with population-based health surveys at five year-intervals since 1972, and from 1992 the sur-veys have been called The National FINRISK Study. Obesity has been increas-ing steadily in Finland, the most pronounced increase observed in the group of young adults. Only 33% of men and 48% of women remain normal weight, and the amount of obese (Body Mass Index BMI > 30) is over 20% both in men and in women (Peltonen et al. 2008, Lahti-Koski et al. 2009, Figure 1). Those having highest education have the smallest BMI. Obesity, as well as alcohol intake, is explaining factors for the stop of the decline in hypertension in Finland (Pelto-nen et al. 2008).

1. Significance of food in health
15
Figure 1. Prevalence of obesity (body mass > 30) in Finland in the mini-Finland Survey 1978–1980 and in the Health 2000 Survey 2000–2001 (Lahti-Koski et al. 2009).
The metabolic syndrome is a clustering of the metabolic abnormalities related to obesity: insulin resistance, glucose intolerance, dyslipidemia and elevated blood pressure. Lifestyle factors, including diet and physical activity, are crucial in realising the risk factors generated by genetic background. Metabolic syndrome can lead to type 2 diabetes and cardiovascular diseases, but can be reversed if addressed early enough. In a recently reported cross-sectional survey over 50% of men and about 40% of women had metabolic syndrome in Finland, which is high in international comparison (Hu et al. 2008).
Type 2 diabetes mellitus (T2DM) is a progressive disorder caused by a com-bination of insulin resistance and beta cell dysfunction. It is becoming more prevalent all over the world, unfortunately increasingly also in younger popula-tions. WHO estimates that diabetes causes about 5% of all deaths globally each year, and that 80% of people with diabetes live in low and middle income coun-tries. Most people with diabetes in low and middle income countries are middle-aged (45–64). Without urgent actions, diabetes deaths are likely to increase by more than 50% in the next 10 years (WHO diabetes, 2009). Overweight is the largest risk factor for type 2 diabetes. Poor glucose level balance, obesity, in-creased blood pressure and disturbances in fat metabolism are risk factors for cardiovascular diseases.

1. Significance of food in health
16
In Finland almost 10% of the population already are diabetic. There are about 40 000 people with type 1 diabetes and about 250 000 people with type 2 diabe-tes, and the number of undiagnosed cases of type 2 diabetes is estimated at 200 000 (Winell & Reunanen, 2005). The Finnish Diabetes Study (DPS) is one of the globally recognised studies showing that type 2 diabetes can be prevented by changes in lifestyle (Lindström et al. 2006a; Tuomilehto et al. 2001). The results indicate that even after adjustment for other risk factors, dietary fat and fibre intake are significant predictors of sustained weight reduction and progression to type two diabetes in high-risk subjects (Lindström et al. 2006b).
The Development Programme for the Prevention and Care of Diabetes (DEHKO 2000–2010) is Finland’s national diabetes programme (Aarne 2008). It aims to prevent type 2 diabetes and diabetes-related complications to improve the quality of diabetes care and to support the self-care of people with diabetes. In the prevention program FIN-D2D, three strategies were taken for the prevention of type 2 diabetes:
1. Population strategy: prevention of obesity and type 2 diabetes at population level.
2. High-risk strategy: screening of people with elevated risk and manage-ment of risk factors by lifestyle counselling early diagnosis and treatment strategy.
3. Prevention of complications among newly diagnosed people with type 2 diabetes by bringing them within the sphere of appropriate treatment.
Cancer is one leading cause of death worldwide accounting for 7.9 million deaths (around 13% of all deaths) in 2007 (WHO cancer, 2009). Dietary factors are also important in prevention on cancer, and are estimated to be involved in about 30% of cancers in industrialised countries, especially colon and stomach cancer. In addition to smoking, high intakes of red meat, fat and alcohol have been con-sidered risk factors of colon cancer, and the risk may be alleviated by high intake of fruit and vegetables. (WHO Technical Report series 916, 2003; Chao et al. 2005) In Finland, colon cancer was in 2007 the third most common cancer in men and the second most common in women with over 1500 new cases (Finnish Cancer Registry 2007).
Diet and nutrition play a role also in osteoporosis, influencing millions of people around the world. Osteoporotic fractures are a major cause of morbidity and disability in the elderly, and their prevalence is thus increasing with the age-

1. Significance of food in health
17
ing population. In case of hip fractures, osteoporosis can lead to premature death. Osteoporotic fractures also impose a considerable economic load on health services, costing many billions of dollars each year. There is some evi-dence relating osteoporosis to diet and nutrition. Calcium and vitamin D have been shown to strengthen bone structures, and suggestions also for positive ef-fects of phosphorous, magnesium and protein have been made (Prentice, 2004).
1.3 Food allergies
Allergic diseases are the most common chronic disorders of children and adoles-cents. The prevalence of allergic diseases in Finland and in other western coun-tries is high and it has steadily increased (except excema) for decades. Sensitiza-tion rates to common allergens are approaching 50% in adults. It is estimated that 5–10% and 2–5% of children and adults, respectively, suffer from food al-lergies (adverse reaction, with an immunological mechanism, to foods) in Finland (Haahtela et al. 2008). Most adverse reactions to foods are, however, not allergenic in nature. An adverse reaction may also reflect a toxic property of the food, or food intolerance (non-immunological reaction to food). In a meta-analysis by Rona et al. (2007) the prevalence of food allergy ranged from 1 to 11% – up to 3% for milk and 1.7% for egg. Peanut allergy is present in about 1.5% of children. It seems that majority of children with milk allergy outgrow their disease, whereas individuals with peanut or tree nut allergies are less likely to outgrow the allergy (Kumar 2008). Food ingredients such as milk, eggs, fish or several nut species are known to trigger allergic reactions more often than other foods (Bush & Hefle 1996). Allergens in foods are mainly proteins, mostly of high molecular weight and stability. Although almost any food protein can elicit an immune reaction, only eight foods account for 90% of allergies and most patients are sensitive to only few foods. The most common allergens in children are cow’s milk, eggs, peanuts, soy, wheat, tree nuts (e.g. almonds, wal-nuts, hazelnuts, cashews, pecans), and fish, whereas in adults they are shellfish, peanuts, tree nuts, and fish (Hare et al. 2008). Sensitivities to food additives are rare. The prevalence of different types of food allergies varies among population groups based on their eating habits (Taylor et al. 1999). Food allergy symptoms typically start within minutes to a few hours after the ingestion, and the skin is the most common target area, along with the GI tract and respiratory tract (Hare & Fasano, 2008).

1. Significance of food in health
18
Food allergy is probably a product of gene-environment interactions. Since genetic influences can’t explain the rapid emergence/increase of food allergies, environmental factors (e.g. early life factors such as immunological stimuli, infant and maternal diet, medication, presence of comorbid eczema) likely play a significant role. According to hygiene hypothesis early life immunological stim-uli interact with the immune system to promote induction of a tolerant pheno-type. Thus infants who don’t get these normal stimuli (e.g. those delivered by cesarean section) might be at a higher risk of developing food (or other) allergies (Kumar 2008). Many authors underline the importance of normal gut microbiota and other antigenic stimuli for an adequate full maturation of intestinal immune system. According to one hypothesis differences in macro- and micronutrients of the diet in different geographical locations could explain the differences in the prevalence of allergies and asthma. Nutrients such as dietary fat source, antioxi-dants, or vitamin D have been suggested to play a role here (Lack 2008). Due to the increased prevalence of allergies and evidence that allergen avoidance alone doesn’t prevent the development of allergic disease, it is nowadays considered that instead of allergen avoidance, tolerance to allergens in population must be improved. The entity ‘food allergy’ comprises much imagined allergy which leads into unnecessary avoidance of various foods. This may endanger the child’s nutrition and distorts the child’s notion of food and diet in general. (Haahtela et al. 2008).
1.4 Increasing healthcare costs
Problems associated with inappropriate eating patterns give rise to large costs both at individual and public economy levels. Obesity has already almost ten years ago estimated to cost some health services about 7% of their total health care budget (WHO European Region 2000–2005). Around one third of cardio-vascular disease is related to unbalanced nutrition, and 30–40% of cancers could be prevented through better diet. It has been estimated that healthcare costs of nutrition related diseases may account for as much as 30% of all healthcare costs in Europe. If nutrition could be improved to decrease the disease prevalence by 10%, the economic benefit would be the same as increasing the GDP (gross domestic product) by 5% (Robertson 2002).
Health-care costs are in many countries growing faster than the GDP. Eco-nomic welfare can only be ensured by efficient management of the health of the population. New concepts combating lifestyle diseases provide opportunities for

1. Significance of food in health
19
international business, since the countries in Europe and other continents with quick economic growth rate share the same trend of rapidly increasing non-communicable disease risk.
A recent report (Kiiskinen et al. 2008) identified the major public health problems in Finland to be cardiovascular diseases, type 2 diabetes, home and leisure accident injuries and fractures. By examining the effectiveness and cost-effectiveness of different health promotion actions, they concluded that many measures affecting lifestyle are effective and that their cost-effectiveness ratio is advantageous.
In Finland the additional healthcare costs of diabetes were 875.5 M€ in 2007 (28% of the costs were medicinal costs). It has been estimated that over 12% of Finland’s health care expenditure is spent for diabetes patients (Kangas 2002). About 90% of the costs caused by diabetes are due to treatment of complica-tions. The total costs of pharmaceuticals for diabetes and its complications were estimated to be 3.5 times greater than the costs for a nondiabetic control group (Reunanen et al. 2000). Diabetes is thus an expensive disease and the current rapid increase in its incidence will dramatically increase the health-care costs.
The cost-efficiency of dietary prevention has in most of the studies made shown to be good, as reviewed by Ottelin (2004). Dietary prevention has many targets, and is very efficient e.g. in treatment of metabolic syndrome (Uusitupa 2001). Both physical activity and a healthy diet have favourable effects on al-most all disturbances linked with metabolic syndrome, whereas in medical treatment the combination of different drugs is needed.

2. Lifestyle and food
20
2. Lifestyle and food Continuously and rapidly changing environment cause changes in consumers’ lifestyles. Lifestyle can be defined as an intervening cognitive construct that mediates person’s values and environment. Human values are assumed to be stable and their change to be slow. In contrast, consumers’ perception of the environment is situation-specific and changing. Examples of environmental fac-tors affecting consumers’ food-related lifestyles include time scarcity, changes in working environment, work load, economics, and health issues, changes in family structures and family roles, ubiquitous and even conflicting information, and increasing knowledge of ecological and ethical issues. The lifestyle is an attempt to behave in a way the person is able to achieve his/hers basic values even when the environment is changing (Grunert 2006, Grunert et al. 2001).
Brunsø & Grunert (1998) have proposed that food-related lifestyle has five elements: quality aspects, consumption situations, and the way of shopping, cooking methods and purchasing motives (Figure 2). Quality relates to product’s benefits like health or taste. Consumption situation refers to social eating habits like sharing a meal. Way of shopping refers the way consumers do shopping; organized, enjoying shopping situation etc. Cooking methods relate to the time when making meal; is meal preparation for example a social event. Purchasing motives refer to consequences of food consumption (de Boer et al. 2004). In a changing environment related to nutrition and eating, consumers make changes in these five elements with an attempt to better fulfil and follow their personal values.

2. Lifestyle and food
21
Figure 2.Values, food-related lifestyles and behaviour (adapted from Brunsø & Grunert 1998).
An example of busy and health oriented consumers, is that they may want to eat healthily and exercise sports even when having time scarcity. These two “oppo-site” purposes may conflict. The conflict makes consumers to seek for new life-styles, for example to find low-caloric convenience foods, with an attempt to balance better behaviour and values. The changing environment creates new needs and opportunities for food product and service development.
Consumers’ ageing, health and well-being in western societies, and especially the linkage of ageing and well-being, are major factors in terms of lifestyle changes in future. Nesse (2005) proposes an interesting modern consumers’ well-being dilemma; in spite of the growth in wealth over recent decades in western countries, the average level of well-being has not increased. This is, consumers are wealthier all the time but not feeling better. Changes in working life and load, stress level in society, changing eating patterns, missing informa-

2. Lifestyle and food
22
tion and food availability have lead to health problems. Obesity, for example, has become one of the world’s major causes to serious diseases. Other example, as already stated above, is ageing. The awareness of healthy foods is growing among older people. However, while health benefits are becoming more and more important, the traditional attributes, like food taste, are often still most meaningful for food choice. Consumers living longer are spending more time actively to halt or slow down the ageing process by investing in personal care products.
In Finland, the collaborative MIRHAMI 2030 Study (Kirveennummi et al. 2008) explored during 2006–2008 food consumption habits, and created four future scenarios based on different major driving forces: the abundance of food supply, ecological choices, scarcity and shortage of food and technology based life. The purpose of the scenarios was to visualise food consumption in the year 2030, and thus help to visualise various possibilities of future food supply.
Putting the information together, food product development opportunities are arising from changing environment which leads to changes in consumer life-styles and food related behaviour. Also seen from consumers’ lifestyles point of view, health, well-being and convenience can be named as the major opportuni-ties for future food solutions.

3. Strategies towards healthier eating
23
3. Strategies towards healthier eating
3.1 Dietary recommendations
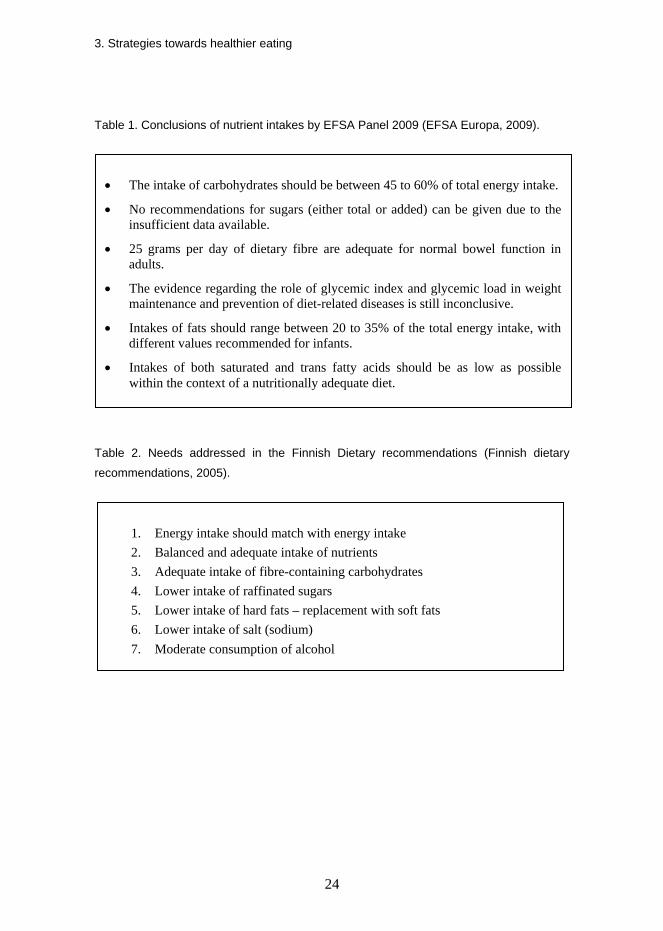
Dietary recommendations have in most countries been made nationally to advice people about adequate macro- and micronutrient intake. The Finnish national recommendations were last updated in 2005 (Finnish dietary recommendations, 2005) and are in line with the Nordic nutrition recommendations 2004 (currently being updated) (Becker et al. 2004). They, as well as those of the United States (USDA 2005), emphasize the importance of having exercise and nutrient intake in balance. “Good food is tasty, varied and colourful. In a good diet the amount of food is just right so that the energy intake corresponds to the energy expendi-ture.” The European Food Safety Authority EFSA is currently (autumn 2009) finalising its recommendations for the daily intakes of carbohydrates, sugars, dietary fibre, and fats (EFSA Europa, 2009). The conclusions of the EFSA Panel are shown in Table 1. The EFSA Panel also provided advice regarding the set-ting of DRVs (Dietary Reference Values) for mono- and polyunsaturated fatty acids as well as cholesterol. The Panel also provided advice regarding the setting of DRVs for mono- and polyunsaturated fatty acids as well as cholesterol.
Target of the Finnish dietary recommendations in terms of reaching a bal-anced diet are shown in Table 2, and instructions for composing of the diet in Table 3. It is recommended that most of the energy should be derived from car-bohydrates (50–60%), followed by fat (25–35%) and protein (10–20%). Purified sugar intake should not be more than 10% of energy, especially when the energy consumption is not high. The recommended intake of dietary fibre is 25–35 grams per day. The majority of the fat should be consumed as mono and polyun-saturated fats.
3. Strategies towards healthier eating
24
Table 1. Conclusions of nutrient intakes by EFSA Panel 2009 (EFSA Europa, 2009).
Table 2. Needs addressed in the Finnish Dietary recommendations (Finnish dietary
recommendations, 2005).
• The intake of carbohydrates should be between 45 to 60% of total energy intake.
• No recommendations for sugars (either total or added) can be given due to the insufficient data available.
• 25 grams per day of dietary fibre are adequate for normal bowel function in adults.
• The evidence regarding the role of glycemic index and glycemic load in weight maintenance and prevention of diet-related diseases is still inconclusive.
• Intakes of fats should range between 20 to 35% of the total energy intake, with different values recommended for infants.
• Intakes of both saturated and trans fatty acids should be as low as possible within the context of a nutritionally adequate diet.
1. Energy intake should match with energy intake 2. Balanced and adequate intake of nutrients 3. Adequate intake of fibre-containing carbohydrates 4. Lower intake of raffinated sugars 5. Lower intake of hard fats – replacement with soft fats 6. Lower intake of salt (sodium) 7. Moderate consumption of alcohol

3. Strategies towards healthier eating
25
Table 3. Instructions for composing the diet (Finnish dietary recommendations, 2005).
In Finland special dietary recommendations have been given for various target groups and eating situations, as listed in Table 4. In these recommendations, children and elderly have been in special focus.
1. Everyday choices are critical for a healthy diet – rarely consumed foods are
less important.
2. “Plate model”: Fill half of the plate with vegetables; fill fourth of the plate with potatoes/rice/pasta and one fourth with meat/fish/egg dishes.
3. Consume at least 400 g/d vegetables (potatoes not included), berries and fruits.
4. Eat whole grain low salt bread and other foods (e.g. porridge, muesli).
5. Drink either fat free / low fat milk or sour milk; be aware that many low fat fermented dairy products (yoghurt, sour milk products) can contain a lot of sugar; eat low fat and low salt cheeses.
6. Eat fish at least twice a week.
7. Eat low fat meat (avoid high fat and high salt cold cuts).
8. Eat moderately vegetable oils and soft fats (avoid hard fats).
9. Avoid food with high amounts of sugar.
10. Remember to have regular eating habits.
11. Drink at least one litre of liquids (but not too much coffee).
12. If you are in special dietary regime it may be necessary to use supplements (e.g. calcium).

3. Strategies towards healthier eating
26
Table 4. Special Finnish dietary recommendations and reports.
Name in Finnish Name in English
Suomalaiset ravitsemussuositukset –ravinto ja liikunta tasapainoon 2005 (Valtion ravitsemusneuvottelukunta)
Finnish dietary recommendations 2005 – food and nutrition into balance
Lapsi, perhe ja ruoka. Imeväis- ja leikki-ikäisten lasten, odottavien ja imettävien äitien ravitsemussuositus Sosiaali- ja terveysministeriö 2004
Child, family and food. Dietary recom-mendations for weaning and preschool children and mothers during pregnancy and during breast feeding
Kouluruokailusuositus 2008 (Valtion ravitsemusneuvottelukunta)
Recommendations for eating in schools
Juomat ravitsemuksessa 2008 (Valtion ravitsemusneuvottelukunta)
Drinks in nutrition
Ikäihmisen ravitsemusopas 2005 Turun yliopiston täydennyskoulutuskeskus ja Vanhustyön keskusliitto
Dietary advice for the elderly
3.2 Health claims
A health claim is any statement used on labels, in marketing or in advertising that health benefits can result from consuming a given food or from one of its constituents, e.g. statements that a food can help reinforce the body’s natural defences or enhance learning ability. Examples also include claims on the reduc-tion of disease risk or on nutrients and other substances that may improve or modify the normal functions of the body, e.g. “Omega-3 fatty acids can help reduce cholesterol levels, a risk factor in the development of coronary heart dis-ease” or “Calcium may help improve bone density”. Instead, nutrition claim only states that a food has particular nutritional properties (low fat, high in fibre…). (EFSA, FAQ, 2009).
EU regulation 1924/2006 on nutrition and health claims applies to all nutrition and health claims made in commercial communications (e.g. advertising) (EU regulation 1924/2006). It does not apply to claims made in non-commercial communications, e.g. dietary guidelines. Non-beneficial claims are not covered and beverages containing more than 1.2% alcohol can not bear health claims. It is also important that claims on foods can be understood by the consumer. Fur-

3. Strategies towards healthier eating
27
thermore, claims shall not: be false, ambiguous or misleading; give rise to doubt about the safety and /or the nutritional adequacy of other foods; encourage or con-done excess consumption of the food; state, suggest or imply that a balanced and varied diet cannot provide appropriate quantities of nutrients in general; and refer to changes in bodily functions which could give rise to or exploit fear in the consumer.
The following claims are not allowed: claims which suggest that health could be affected by not consuming the food; claims which make reference to the rate or amount of weight loss; and claims which make reference to recommendations by individual health professionals.
European Food Safety Authority (EFSA)
European Food Safety Authority (EFSA) panel on dietetic products, nutrition and allergies (NDA panel) evaluates the scientific substantiation of health claims covered by different articles of the regulation:
Reduction of disease risk claims and claims on children’s development and health (Article 14)
A case-by-case authorisation is required.
Function claims (Article 13.1): growth, development and functions of the body; psychological and behavioural functions; slimming and weight control / list of permitted function claims.
Function claims when they are
• based on generally accepted scientific evidence
• well understood by the general consumer
• member states have provided the commission with lists of suggested claims in 2008
• consultation of EFSA (NDA panel and external experts) → EFSA has in autumn 2009 given opinions of the lists
• commission will adopt a community list of permitted function claims by 31 January 2010.
Only function health claims which are listed in the Community Register can be used on food and only if the product meets the indicated criteria.
3. Strategies towards healthier eating
28
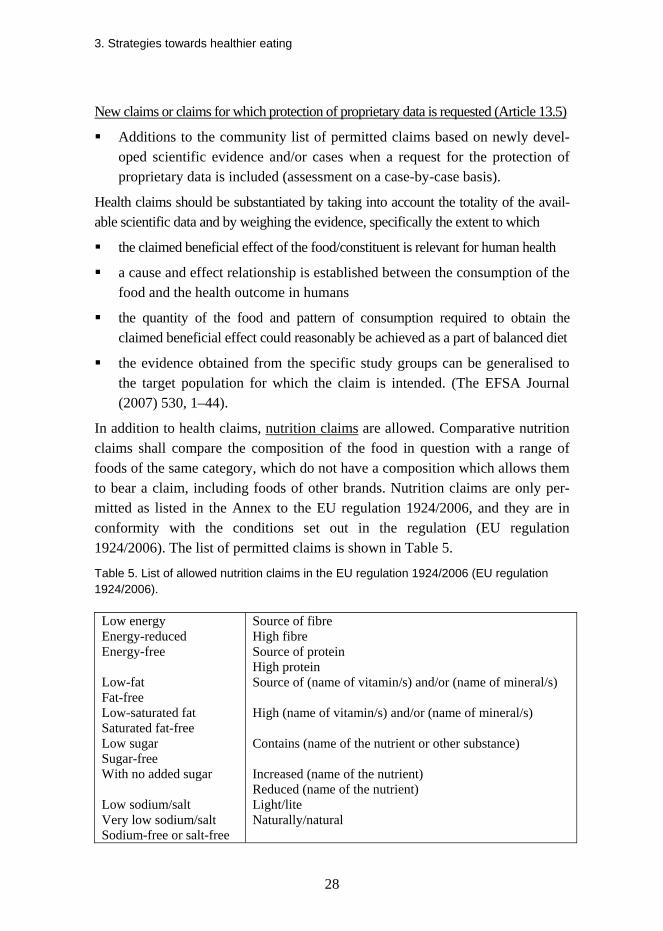
New claims or claims for which protection of proprietary data is requested (Article 13.5)
Additions to the community list of permitted claims based on newly devel-oped scientific evidence and/or cases when a request for the protection of proprietary data is included (assessment on a case-by-case basis).
Health claims should be substantiated by taking into account the totality of the avail-able scientific data and by weighing the evidence, specifically the extent to which
the claimed beneficial effect of the food/constituent is relevant for human health
a cause and effect relationship is established between the consumption of the food and the health outcome in humans
the quantity of the food and pattern of consumption required to obtain the claimed beneficial effect could reasonably be achieved as a part of balanced diet
the evidence obtained from the specific study groups can be generalised to the target population for which the claim is intended. (The EFSA Journal (2007) 530, 1–44).
In addition to health claims, nutrition claims are allowed. Comparative nutrition claims shall compare the composition of the food in question with a range of foods of the same category, which do not have a composition which allows them to bear a claim, including foods of other brands. Nutrition claims are only per-mitted as listed in the Annex to the EU regulation 1924/2006, and they are in conformity with the conditions set out in the regulation (EU regulation 1924/2006). The list of permitted claims is shown in Table 5.
Table 5. List of allowed nutrition claims in the EU regulation 1924/2006 (EU regulation 1924/2006).
Low energy Energy-reduced Energy-free Low-fat Fat-free Low-saturated fat Saturated fat-free Low sugar Sugar-free With no added sugar Low sodium/salt Very low sodium/salt Sodium-free or salt-free
Source of fibre High fibre Source of protein High protein Source of (name of vitamin/s) and/or (name of mineral/s) High (name of vitamin/s) and/or (name of mineral/s) Contains (name of the nutrient or other substance) Increased (name of the nutrient) Reduced (name of the nutrient) Light/lite Naturally/natural

3. Strategies towards healthier eating
29
The Japanese FOSHU system
In Japan the regulation regarding health claims is quite similar to that in EU. The Japanese regulatory system allows the division of health claims into three cate-gories: 1) nutrient functional claims (referring to the physiological role of a nu-trient in its relationship to growth, development and normal body function); 2) enhanced functional claims or structure/function claims (specific beneficial ef-fects of nutrients and non-nutrients on physiological, psychological functions or biological activities beyond their established role in growth, development and other normal functions of the body); and 3) disease risk reduction claims.
The Japanese FOSHU system (”Foods for Specified Health Claims”) was launched in 1991. FOSHU claims are similar to enhanced function claims and structure/function claims. FOSHU’s goal is to evaluate the physiological func-tionality of foods and to provide, when appropriate, FOSHU approval for product specific health claims. The allowed health claims are of the following types:
maintains or improves a marker determined by self-diagnosis or health check-up (e.g. this product helps to maintain normal blood pressure)
maintains or improves physiological function and organ function on the body (e.g. this product enhances the absorption of calcium)
causes short-term changes in body condition, but not long-term changes (e.g. this product is good for or helps people who feel fatigue).
FOSHU also permits claims of improving effects on the preliminary stage of a disease or a borderline condition of an at-risk group due to an unbalanced nutri-tional state. However, similarly to EU, claiming of improving disease symptoms in general terms is not acceptable. (Shimizu 2003).
The U.S. Food and Drug Administration (FDA)
FDA has their own nuances for the definitions on the health claims (FDA, 2003). According to FDA, claims that can be used on food and dietary supplement labels fall also into three categories: 1) health claims, 2) nutrient content claims, and 3) structure/function claims. FDA describes the three claim categories as follows:
Health Claims: Health claims describe a relationship between a food, food component, or dietary supplement ingredient, and reducing risk of a disease or health-related condition. A “health claim” by definition has two essential

3. Strategies towards healthier eating
30
components: (1) a substance (whether a food, food component, or dietary in-gredient) and (2) a disease or health-related condition. A statement lacking either one of these mentioned components does not meet the regulatory defi-nition of a health claim. FDA provides three categories of which manufactur-ers are able to apply the health claims, depending on the amount and ade-quacy of scientific evidence. Theses three health claim groups include: 1) NLEA Authorized Health Claims (based on adequate scientific evidence), 2) Health Claims Based on Authoritative Statements (based on “authoritative statement” from a scientific body of the U.S. Government or the National Academy of Sciences) and 3) Qualified Health Claims (based on emerging scientific evidence).
Nutrient Content Claims: The Nutrition Labeling and Education Act of 1990 (NLEA) permits the use of label claims that characterize the level of a nutri-ent in a food (i.e., nutrient content claims) made in accordance with FDA’s authorizing regulations. Nutrient content claims describe the level of a nutri-ent or dietary substance in the product, using terms such as free, high, and low, or they compare the level of a nutrient in a food to that of another food, using terms such as more, reduced, and lite. Most nutrient content claim regulations apply only to those nutrients or dietary substances that have an established daily value.
Structure/Function Claims: Structure/function claims describe the role of a nutrient or dietary ingredient intended to affect normal structure or function in humans, for example, “calcium builds strong bones.” In addition, they may characterize the means by which a nutrient or dietary ingredient acts to main-tain such structure or function, for example, “fibre maintains bowel regular-ity,” or “antioxidants maintain cell integrity,” or they may describe general well-being from consumption of a nutrient or dietary ingredient. Struc-ture/function claims may also describe a benefit related to a nutrient defi-ciency disease (like vitamin C and scurvy), as long as the statement also tells how widespread such a disease is in the U.S. Unlike health claims, dietary guidance statements and structure/function claims are not subject to FDA re-view and authorization.
3. Strategies towards healthier eating
31
3.3 Collaboration platforms and research policies
The Commission of European Communities published in 2005 a green paper “Promoting healthy diets and physical activity: a European dimension for the prevention of overweight, obesity and chronic disease” (Europa Legislation, 2005). Due to the considerable economic burden created by the life-style related diseases, the aim was to consider joint actions at Community level to reduce health risks and health care spending. In order to establish a common forum for action the European Platform for Action on Diet, Physical Activity and Health was launched in March 2005 and is still active (http://ec.europa.eu/health/ph_ determinants/life_style/nutrition/platform/platform_en.htm).
The objective of the Platform is to catalyse voluntary action across the EU by business, civil society and the public sector. Members of the Platform include the key EU-level representatives of the food, retail, catering, and advertising industries, consumer organisations and health NGOs. Furthermore, a network on Nutrition and Physical Activity composed of experts nominated by the Member States, the WHO and consumer and health NGOs has been established in 2003 to advise the Commission on the development of Community activities to im-prove nutrition, to reduce and prevent diet-related diseases, to promote physical activity and to fight overweight and obesity. The importance of nutrition, physi-cal activity and obesity was also reflected in the Public Health Action Pro-gramme (http://ec.europa.eu/health/ph_programme/programme_en.htm) in 2003–2008, based on three general objectives: health information, rapid reaction to health threats and health promotion through addressing health determinants.
European Technology Platform Food for Life (ETP Food for Life) is one of the economic sectors that are related to strategic collaboration platforms through which The European Commission is promoting innovation in Europe. These platforms aim to bring together stakeholders in key economic sectors to develop a long term vision and a strategy for delivery, and to establish a man-agement structure to ensure maximum impact. ETP Food for Life was created in 2005 under the auspices of the Confederation of the Food and Drink Industries of the EU (CIAA). The vision of the ETP Food for Life (ETP Food for Life, CIAA 2005), published in July 2005, aims at an effective integration of strategi-cally-focussed, trans-national and concerted research in the nutritional-, food- and consumer sciences and food chain management so as to deliver innovative, novel and improved food products for, and to, national, regional and global mar-kets in line with consumer needs and expectations. According to vision, these

3. Strategies towards healthier eating
32
products, together with recommended changes in dietary regimes and lifestyles, will have a positive impact on public health and overall quality of life (‘adding life to years’).
The research challenges for the food sector were defined in the Strategic re-search Agenda of ETP Food for Life in 2007 (ETP Food for Life, CIAA 2007) (Figure 3), and they include
1. ensuring that the healthy choice is the easy choice for consumers 2. delivering a healthier diet 3. developing quality food products 4. assuring safe foods that consumer can trust 5. achieving sustainable food production 6. managing the food chain.
Figure 3. Schematic presentation of the research areas required to reach the vision of the ETP Food for Life (ETP Food for Life, CIAA 2005).
The ETP Food for Life strategy was further discussed and prioritised in the im-plementation plan (ETP Food for Life, CIAA 2008) presenting the three key thrusts of the food sector The Key Thrusts, 1) Improving health, well-being and longevity, 2) Building consumer trust in the food chain and 3) Supporting sus-tainable and ethical production, meet all of the criteria required to stimulate inno-vation, create new markets and meet important social and environmental goals.

3. Strategies towards healthier eating
33
To discuss, focus and implement the European food research strategy, ETP Food for Life Finland was established in 2009 under the auspices of Finnish Food and Drink Industries’ Federation (ETL). One of the main goals of ETP Food for Life Finland is to deliver research trends and results to industry and activate innovations among Finnish food chain (www.foodforlife.fi).
European Food Safety Authority (EFSA) Panel on Dietetic Products, Nutri-tion and Allergies has provided advice on Dietary Reference Values (DRVs) for the European population for carbohydrates (including sugars), dietary fibre, and fats. EFSA’s scientific advice on nutrient intakes is in response to a request from the European Commission and will support EU policy makers in their decision-making process in the field of nutrition. This work will be finalised in 2009 (EFSA recommendations, 2009).
In Finland, The National Institute for Health and Welfare THL (www.thl.fi) is a research and development institute under the Finnish Ministry of Social Af-fairs and Health. THL works to promote the well-being and health of the popula-tion, prevent diseases and social problems, and develop social and health services. The Food Safety Authority EVIRA (www.evira.fi) acts in the administrative sector of the Ministry of Agriculture and Forestry and focuses on ensuring the safety of food, promoting the health and welfare of animals and providing the required preconditions for plant and animal production as well as plant health. The National Nutrition Council (http://www.evira.fi/portal/vrn/en/) is an expert body under the Ministry of Agriculture and Forestry, with the aims to observe and im-prove the nutritional situation in Finland by making nutrition recommendations, giving action programmes and observing how action programmes are fulfilled and what the effects on the nutritional situation. Council’s objectives include
observing the results from nutritional risk monitoring and submit proposals and statements based on them
submitting proposals, reports and issue statements concerning the nutritional and health situation in Finland and taking into account the food chain as a whole
co-ordinating and observing the action plan concerning nutrition in the Gov-ernment resolution for promoting healthy diet and physical activity
observing the development of nutrition policy in Europe and to promote the Councils information services.
The Finnish National Fund for Research and Development, Sitra, ran the Food and Nutrition Programme, ERA in 2005–2008. The motivation was, on one hand,

3. Strategies towards healthier eating
34
the increasingly common lifestyle diseases partly caused by inappropriate diet and, on the other hand, the impact of changes on the global operating environment on the competitive strength of the Finnish food industry. The ERA programme was launched with a strategy process that sought to identify the areas where shared re-sources should be invested in order to enhance global competitiveness. The vision of the programme was set as: Finland – a competitive forerunner in healthy nutri-tion. It was based on the view that the demand for well-being will grow strongly. The food and nutrition sector will answer this demand by developing foods that enable consumers to make choices that promote health and well-being from a wider and more diverse range of products. The development is supported by improved online services, which people increasingly use to search for information on health and well-being and the ways to promote them. People’s awareness of their own health is also continually increasing, thanks to the rapid progress in medicine and diagnostics. Sitra used the term “Smart food” as a concept covering healthy food and sensible eating habits. According to Sitra smart food is ethical, safe, traceable and based on reliable scientific evidence and product development (Sitra Era report 2006). As part of the Sitra ERA programme, also three mini-clusters were formed to promote production and marketing of foods for celiac patients, to seek models for turning the Finnish berry know-how into high value-added products for interna-tional markets, and to facilitate export to Russian markets.
In June 2006, the Science and Technology Policy Council (Research and In-novation Council) of Finland decided to establish in Finland strategic centres (SHOK) in fields that are important to the future of Finnish society and business and industry. Strategic Centre of Health and Well-being was one of the five centres established, and is organised as SalWE Ltd (www.salwe.fi) since 2009. Its mission is to improve health and well-being of an individual to foster related Finnish business. The goal is to develop products, services and practices to pre-vent and treat diseases with major public health and economic impact, and com-prehensively maintain and improve the functional capabilities of an individual. The diseases and conditions selected for focus are 1) microbial infections and inflammation, 2) metabolic syndrome, 3) neurodegenerative and psychiatric diseases as well as a healthy brain under stress and 4) malignant diseases, espe-cially solid tumors. The share holders are 16 companies and 12 universities and research institutes, including VTT. The selected programmes and development areas currently being planned are 1) brain health and functionality, 2) intelligent monitoring of health and well-being, 3) vitality through personal life style solu-tions, 4) structural development and 5) computational methods and data.
4. Food sector
35
4. Food sector
4.1 Global food and drinks industry
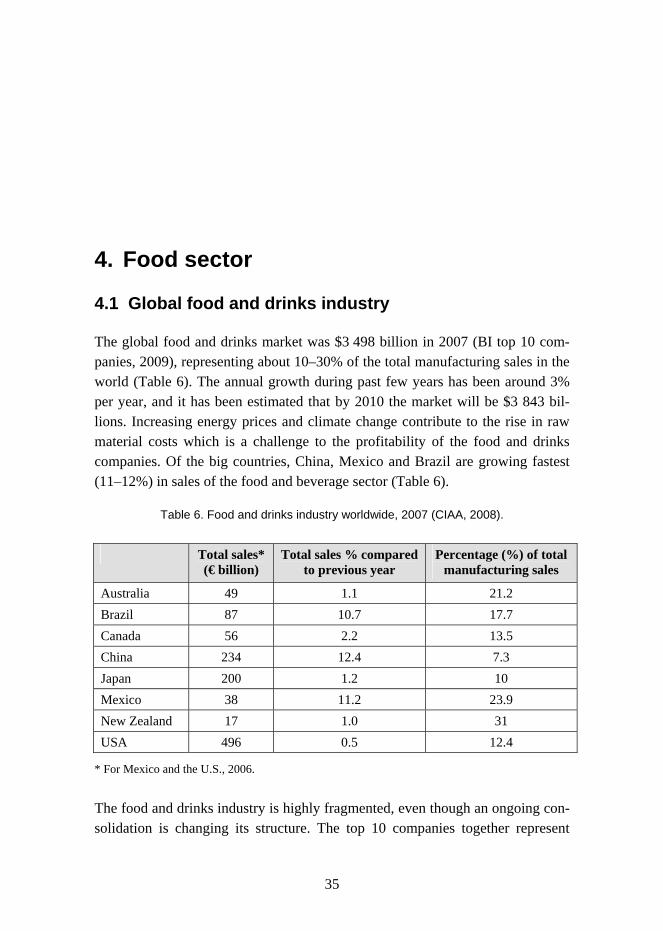
The global food and drinks market was $3 498 billion in 2007 (BI top 10 com-panies, 2009), representing about 10–30% of the total manufacturing sales in the world (Table 6). The annual growth during past few years has been around 3% per year, and it has been estimated that by 2010 the market will be $3 843 bil-lions. Increasing energy prices and climate change contribute to the rise in raw material costs which is a challenge to the profitability of the food and drinks companies. Of the big countries, China, Mexico and Brazil are growing fastest (11–12%) in sales of the food and beverage sector (Table 6).
Table 6. Food and drinks industry worldwide, 2007 (CIAA, 2008).
Total sales* (€ billion)
Total sales % compared to previous year
Percentage (%) of total manufacturing sales
Australia 49 1.1 21.2 Brazil 87 10.7 17.7 Canada 56 2.2 13.5 China 234 12.4 7.3 Japan 200 1.2 10 Mexico 38 11.2 23.9 New Zealand 17 1.0 31 USA 496 0.5 12.4
* For Mexico and the U.S., 2006.
The food and drinks industry is highly fragmented, even though an ongoing con-solidation is changing its structure. The top 10 companies together represent

4. Food sector
36
12.9% of the global market share. Nestlé and Cargill are the global leaders with 2.6 and 2.5% market shares in 2007, respectively (Table 7) (BI top 10 compa-nies, 2009).
Table 7. Top 10 food and drinks companies turnover ($ million), 2003–07 (BI top 10 com-panies, 2009).
Rank Company Turnover 2007 ($ billion)
Market share (%)
1 Nestlé 89.7 2.6 2 Cargill 88.3 2.5 3 Unilever 55.1 1.6 4 PepsiCo 39.5 1.1 5 Kraft Foods 37.2 1.1 6 InBev 36.5 1.0 7 Mars 30.4 0.9 8 Coca-Cola 28.9 0.8 9 Tyson 26.9 0.8
10 SABMiller 18.6 0.5
According to the CIAA Reports (CIAA 2007; CIAA 2008), the R&D in the food and drinks sector has been significantly lower (~ 1% of the total R&D invest-ment) than in the R&D intensive sectors (~ 45% of the total R&D investment). When dividing the innovation of the food and drinks sector in five categories: pleasure, health, fitness, convenience and ethics, in 2007 the pleasure-driven innovation appeared dominant in Europe (43%). The health category was second largest (22.5%) leaving behind the convenience category. At European and also at world level, healthiness-driven innovations had the largest increase. Among the most innovating sectors, dairy sector was leading in 2007, followed by soft drinks and frozen products (CIAA 2007; CIAA 2008).
4.2 European food and drinks industry
In 2007 the food and drinks industry was the largest manufacturing sector in the EU in terms of turnover, value added and employment and the second largest manufacturing sector in terms of number of companies, leaving behind for ex-ample, automobile, chemicals and machinery industries. In addition, the share of

4. Food sector
37
the food and drinks industry in the manufacturing sector continues to grow in terms of turnover, value added and employment. In 2006, European households spent on average 12.8% of their expenditure on food and non-alcoholic bever-ages (CIAA 2007; CIAA 2008).
The food and drinks sector in EU includes 309 700 companies (in 2007), and it is composed of a diverse range of companies from SMEs to large companies. SMEs make up 99.1% of the food and drinks enterprises, but they produce only 48.1% of food and drinks turnover, leaving thus a large turnover share for the small amount of large companies. The EU is the world’s largest exporter and the number two importer of food and drinks products worldwide (excluding intra-EU trade). However, due to the growth of exporters such Brazil and China, the EU market share of global export market in food and drinks products has been shrinking over the last ten years (from 24.2 to 20.8%) (CIAA 2007; CIAA 2008).
Although the food industry is in the lower part of the innovation performance ranking, in EU the food industry shows relatively good performance when counting the companies applying public subsidies to innovate, that innovate in-house, and that use trademarks to protect innovation. The top three innovative EU countries in food products are Belgium, Sweden and France. Finland is at position 18 (CIAA 2007; CIAA 2008).
4.3 Finnish food and drinks industry
The food industry in Finland is the fourth largest branch of industry, after metal and engineering, forest and chemical industries. Gross value of production is €10.5 billion and value added €2.2 billion (in 2008). Growth of turnover in 2000–2008 has been 25%. The main sectors in food industry are meat process-ing, dairy, bakery, brewing and soft drinks industry. Viable and efficient agricul-ture is a prerequisite for strong food industry, since the Finnish food industry relies on domestic raw materials and domestic retailing markets: the market share of Finnish food products in Finland is 85% (in 2006). The value of food exports has grown from €1.0 billion to €1.4 billion in 2000–2008, and in the same period the value of food imports has grown from €2 to €3.3 billion. Ac-cording to international estimates, approximately 5 per cent of food is exported. Finnish food corporations have established themselves in Russia and the Baltic region. In 2004, the net sales of these companies (€1.3 billion) exceeded the value of food exports (ETL tilastot, 2008; Sitra ERA report, 2006).

4. Food sector
38
Primary production, the food industry and investments in them comprise 10 to 15% of Finland’s GDP. This is supplemented by catering and distribution ser-vices. The food chain employs approximately 300 000 people, which is 13% of the employed labour force. The food industry with on average 2000 companies is the third largest employer in Finland with 34 585 people (in 2008). In 2007, Finnish households spent on average 12.5% of their expenditure on foods. (ETL tilastot, 2008; Sitra ERA report, 2006).
Investments in food and nutrition research in Finland have remained at the same level in the past ten years, and as well as in the rest of the world, the fig-ures are low compared to most other Finnish industries. However, the food in-dustry’s research and development investments are at the top EU level in per capita terms (Daily Consumer Goods, 2005–2006).
4.4 Functional foods and ingredients markets
As consumer attitudes have become more health-oriented, the emphasis on food ingredients has grown, creating an increasingly sophisticated and diverse food industry. Key consumer drivers for functional food (including nutraceuticals) business include the individualization of responsibility for one’s own health, the increased availability of information about the influence of diet on your health, the ageing of the population and attendant increases on diseases like diabetes, cancers, dementia, stress, and anxiety.
Due to growth of demand for healthy food and drinks by consumers the de-mand of healthy ingredients for food and drink production is constantly increas-ing. Ingredients for weight management are in a major category since emerging obesity problem is a growing concern of public and health policy. Functional ingredients are another major category of ingredients manufacturers, and it was expected to grow by 18% in Europe and the US during 2005–2008. Personalized nutrition is a newer emerging area for ingredients companies. In 2006, Kerry Group (Kerry) was one of the world’s leading companies in the ingredients business, followed by Tate & Lyle and DSM (Table 8). (BI Top 10 Ingredients Companies, 2007).

4. Food sector
39
Table 8. Top 10 food and drink companies according to ingredients revenue, 2006 (BI Top 10 Ingredients Companies, 2007).
Rank Company Ingredients revenue ($ billions) 1 Kerry 3.76 2 Tate & Lyle 3.55 3 DSM 3.18 4 CSM 2.98 5 Corn Products International 2.36 6 Ajinomoto 2.26 7 Danisco 2.16 9 Südzucker 2.18 8 BASF 2.16
10 Archer Daniels Midland Company 2.13
During the recent years, digestive health has been the primary focus of food products marketed around the world for an added health benefit. Data on new food and beverage launches between 2005 and 2009 tell a total of 2 861 new products claiming to promote digestive health. This is over 163% more than the next most popular category – cardiovascular health – which saw 1 089 new product launches in the period. The countries included in the analysis include the U.S. and Japan, as well as a range of European countries. In contrast to all other markets tracked, the U.S. was the only country not to list digestive health as the top product claim. However, it did come a close second to the top health cate-gory in this market, which was cardiovascular health (NutraIngredients-USA.com, 2009). The top ten health claims made on global food and beverage launches since 2005 were as follows (NutraIngredients-USA.com, 2009):
digestive health (2 861 products) cardiovascular health (1 089) immune system (807) vitamin/mineral fortified (692) bone health (456) reduced cholesterol (426) added calcium (321) added fibre (314) brain and nervous system (308) beauty benefits (206).

4. Food sector
40
In 2006 the US functional food and drinks market value was 21 billion dollars, and the leading food categories were soft drinks, dairy products, and bakery and cereals (Table 9). The growth of the US market was between 2001 and 2006 annually 6.5% and growth is expected to be 5% between 2006 and 2011. Dairy, bakery and cereals, and soft drinks are estimated to be the leading growing cate-gories (annual growth rate over 5.5%) (Table 10).
Table 9. US functional food and drinks market value, ($ million), by category, 2001–2011 (Gruenwald, 2008).
2001 2006 2011 Growth rate 06–11 Dairy 4 279 5 911 7 852 5.8% Soft drinks 4 036 6 016 7 844 5.5% Bakery and cereals 2 923 4 127 5 435 5.7% Confectionery 1 134 1 530 1 899 4.4% Savory snacks 470 508 543 1.4% Others 2 728 3 206 3 605 2.4% Overall 15 570 21 298 27 179 5.0%
The functional food market size in Europe is calculated to be less than 40% of the size of the US markets totalling value of 8 billion dollars in 2006 (Table 10), with an estimated growth of 5% from 2006 to 2011. Leading functional food categories were the same as in the US in 2006: soft drinks, dairy products, and bakery and cereals. The only larger difference is in the relative size of soft drink sector. In Europe soft drinks covered 45% of total functional food markets value when in US it covered 28%. Biggest growth is estimated to be in confectionary and salty snacks categories in Europe with annual growth rate of 7–8% (Gruenwald, 2008).
Table 10. Europe functional food and drink market value, ($ million), by category, 2001–2011 (Gruenwald, 2008).
2001 2006 2011 Growth rate 06–11 Dairy 661 883 1 098 4.4% Soft drinks 2 796 3 615 4 327 3.7% Bakery and cereals 616 834 1 052 4.7% Confectionery 590 983 1 446 8.0% Savory snacks 435 666 922 6.7% Others 767 1 032 1 318 5.0% Overall 5 865 8 013 10 163 4.9%

4. Food sector
41
The major functional foods markets in Europe are UK and Germany with market size of about 2 billion dollars. The fastest growing markets are in Italy (estimate 6.5% in 2006–2011) and Sweden (estimate 6.6% in 2006–2011) (Gruenwald, 2008). The global functional foods market is estimated to be the fastest growing category in health and wellness markets and its value is predicted by Euromoni-tor to be worth of €175 billion by 2012. This is 25% higher than in 2007 (120 billion €).
4.5 Convenience food and drinks markets
Convenience foods include canned, chilled, dried and frozen food (including ready meals and soups), sauces, dressings and condiments, i.e. foods that are easy and quick to use in modern everyday life. Among with fresh and on-the-go convenience, health is expected to remain the dominant consumer and marketing trend of convenient products over the next five years. Skilled young singles are regarded as a key target market for future convenience development. However, children and families are also viewed by industry as one the most important groups. In May 2008 shares of innovative convenient products launches were 61.7% for formulation, 19.1% for packaging benefit, 7.7% for positioning, 4.7% for technology, 5.7% for merchandising and 1.0% for new market 1.0% (BI future convenience, 2008).
The combined European and US convenient food and drinks market was val-ued at $348 billion in 2007. The growth of the European convenience food market is estimated to be 3.1%, in USA the growth rate being slower, 2.1% (Table 11). Faster growth is anticipated in other regions than in Europe and USA since the trend towards convenience becomes increasingly global, with the $158 billion market in Asia-Pacific growing at a compound annual rate (CAGR) of 3.9% from 2007 to 2011. Latin America and Middle East and Africa are believed to grow at even a faster rate, but these regions hold a low share (< 13%) of global sales (BI future convenience, 2008).

4. Food sector
42
Table 11. Convenient food* market value ($ million) in Europe and the U.S. during 2007–2011 (BI future convenience, 2008).
2007 2009 2011 Annual Growth Rate 07–11 United Kingdom 30 149 32 289 34 463 3.4% Germany 26 506 27 529 28 591 1.9% France 23 987 25 083 26 315 2.3% Italy 21 823 22 962 24 138 2.6% Spain 18 844 20 526 22 200 4.2% Netherlands 8 126 8 481 8 844 2.1% Sweden 6 354 6 676 7 019 2.5% Rest of Europe 86 714 93 075 99 680 3.5% Europe overall 222 501 236 621 251 251 3.1% the U.S. 125 029 130 383 135 844 2.1% Total Europe & U.S. 347 530 367 003 387 096 2.7%
* Includes canned food, chilled food, dried food, frozen food (includes ready meals and soups), sauces, dressings and condiments.
In Europe and North America there is an ongoing shift towards chilled and fro-zen convenient foods and it is expected to continue. However, ambient markets (dried, canned/wet foods and sauces) are believed to still grow to some extent. Sales of dried products are greatly leaning towards Asia-Pacific with close to 50% of global demand. North America remains the dominant region for new convenient products, taking a growing 51% share of launches in 2008.
4.6 Future food and drinks packaging
The packaging material and machinery industry is globally estimated to be worth $500 billion per year. Presently the average annual growth rate of packaging industry is nearly 3.5%, which is expected to touch $597 billion by 2014 (Global Packaging Industry Report, 2003). An estimated 100 000 packaging manufactur-ing companies employ in excess of 5 million people and, in principle, serve all business sectors manufacturing and/or trading physical products (Packaging Research, 2007).

4. Food sector
43
In Finland, the value of the entire packaging industry’s production is about €2 billion (Forest industry, 2009). Many segments of the packaging sector have experienced strong growth, reaching figures of 2–6% per year. In Finland, fibre- and wood-based products account for 2/3 of the overall amount of packaging brought to market, and it has a value of €1.1 billion annually and provides em-ployment for 5 600 people.
According to WPO (2005) packaging is very important as a value-adding function, not only for customers but also for manufacturer. In addition to pro-tecting the product it contains, packaging provides an effective tool for logistics and brand management (Forest industry, 2009). The added value from packaging can be divided into product value and service value (WPO, 2005). The service value is closely linked to the logistics demands on packaging, and relates mainly to cost savings and economic efficiency in the supply chain. The user demands and marketing aspects of packaging are closely related to the product value. Consumer values typically involve the assessment of the product’s capacity for functional performance, its capacity to arouse feelings and satisfy curiosity, and its capacity to provoke enjoyment or pleasure. The package is an interface be-tween the product and the user and can to create consumer value in all those dimensions (WPO, 2005).
Particularly for fast moving consumer goods, including food products, the packaging is one of the key product components that can provide a commercial advantage over competing products. Modern packaging technology aims to meet a vast range of requirements ranging from providing food safety, low cost stor-age and distribution, self-selling marketing, convenient consumer use to respon-sible waste management practices (WPO, 2005).
The food industry consumes about half of all packaging (Forest industry, 2009). The biggest food and drink packaging market is the U.S., fuelled particu-larly by demand for canned drinks (Felicity, 2008). The average American con-sumes 400 cans a year compared with just 73 cans a year for the average Euro-pean. In general, the beverage packaging represents some 20% of global con-sumer packaging consumption. Growth segments such as bottled water, fruit juices, functional/health drinks (partly boosted by demography/older consumers) are plentiful, and there is general growth in emerging markets, such as soft drinks and beer (WPO, 2005).
As in food industry, social and demographic changes open up new possibili-ties but also create different demands for future packaging industry. With age, people change physically, mentally and psychologically. For most people, these

4. Food sector
44
changes involve minor impairments in eyesight, hearing, mobility and memory. An ageing population in China, Japan, the U.S. and Europe is driving demand for products suited to older consumers, including easy grip and easy open pack-aging, as well as smaller portion sizes for elderly consumers with smaller appe-tites (Felicity, 2008). Taken collectively, these impairments have significant implications for design of all kinds and for packaging design in particular.
With the increasing global customer base, food retailing is transforming. However, with the move toward globalization, food packaging requires longer shelf life, along with monitoring food safety and quality based upon interna-tional standards. To address these needs, nanotechnology is one of the enabling technologies in food and beverage packaging sector (Nano-packaging, 2009). According to Innovative Research and Products (iRAP), 2009, the total nano-enabled food and beverage packaging market in the year 2008 was $4.13 billion, which is expected to grow in 2009 to $4.21 billion and forecasted to grow to $7.30 billion by 2014 (iRAP, 2009). Applications in nano-enabled packaging include, for example, development of improved colour, flavour, texture and con-sistency of foodstuffs, increased absorption and bio-availability of nutrients and health supplements, new food packaging materials with improved mechanical, barrier and antimicrobial properties, and nano-sensors for traceability and moni-toring the condition of food during transport and storage. Among active tech-nologies, oxygen scavenger, moisture absorbers and barrier packaging represent more than 80% of the market. Time/temperature indicators are a major share of intelligent packaging, and with radio frequency identification data tags they are proposed to show the strongest growth in this category in the future.
Convenience consumption will continue to be one of the strongest drivers of global packaging innovation in the future (Felicity, 2008). On-the-go lifestyles increasingly demand for more portable packaging formats. This in turn prompts manufacturers to move away from more traditional packaging materials and to experiment with other packaging substrates. Convenient preparation has seen a high level of innovation with numerous new ‘heat and eat’ technologies being brought to market.
One of the most significant trends to impact on food and drinks packaging has been the sustainability/green trend. This has encouraged innovation in sustain-able packaging materials including the introduction of materials made from natural polymers. Reduced weight packaging is a key opportunity for packaging manufacturers, not only because it delivers reduced material waste, but also be-cause brings supply chain efficiencies in terms of energy reduction. In general,

4. Food sector
45
ethical concerns have transferred from small interest groups into the mainstream social conscience. The word “sustainability” has become very fashionable and will have a large impact for packaging industry in future (Felicity, 2008).
4.7 Food distribution and retail market
Food distribution
The food distribution system has undergone a revolution in Europe and globally after the II World War. Today our food is supplied by a complicated distribution system. The responsibility for feeding has changed while families no longer grow their own foodstuffs. In addition, radical improvements in the consumer living standards has occurred (FAO Report, 2002). FAO Report (2002) has listed five main contributors to the developments in the food distribution systems: 1) In European households, the increase in disposable income has encouraged the purchase of larger quantities of food, household appliances (refrigerators and freezers) and motorcars, 2) the increasing number of urban population and 3) the growing number of people, especially women at work has influenced food con-sumption and purchasing habits, 4) expenditure on food as a proportion of total expenditure has decreased, and 5) consumer mobility and household appliances, i.e. increasing use of motorcars, refrigerators and freezers has encouraged shop-ping in places far from home or workplace. In addition to this, public commer-cial policy and transport and communications infrastructure have a strong influ-ence in food distribution and retail system (Figure 4).
Retail system
Public commercial policy
Degree of urbanization
Consumption habits
Cultural influences and consumption habits
Sectoral competition
Socio-economic conditions
Transport and communi-cations infrastructure
Capital availability
Labour market
Figure 4. Factors affecting food retail system (adapted from FAO Report, 2002).

4. Food sector
46
The supply chain is fundamental for of the food sector. The supply chain is a kind of route “from farm to fork”: from the agriculture, throughout the agricul-tural products trading and transformation, up to the distribution (wholesaling or retailing). With regards to food products, the logistics activities are carried out by different operators (manufacturers, distributors, service suppliers, consum-ers), and could be grouped in seven categories: 1) order management, 2) man-agement and stock control, 3) warehousing, 4) shipment, 5) packaging, 6) deliv-ery, and 7) sales returns management and waste disposal. Today the challenge for the food chain in many cases is the lack of coordination in carrying out these activities (Mariani, 2007).
To face the growing requirement for the improvement of sustainability in the food chain, a re-design of the whole food supply chain is needed and several important aspects need re-thinking: Could logistics represent a tool to modify, in a more sustainable way, the interactions between food production and food con-sumption? Could a shorter food supply chain contribute to the creation of new, healthy and sustainable consumption patterns? Could an improved knowledge about the relation between food and environment modify food consumption habits, towards the consumption of less processed food and changing the present food production trends (i.e. increasing production of functional food)? Which role could (or must) have Public Authorities, who buy each day hundreds thou-sands of meals for school catering, in influencing the above mentioned choices? (Mariani, 2007).
Food retail market
In Europe the food retail market was $1041 billion in 2005 and by 2010 the market value is expected to reach $1208 billion. Non-specialised food and drink retailers accounted for €800 million and restaurant, bars, canteens, catering ac-counted for €279 million (In 2005) (Table 12). France had the largest market of $224 billion (in 2005), whereas the UK has a stronger growth rate (3.2%) than France (1.3%). UK is expected to take the lead of the market by 2010 with a value of $250 billion (CIAA, 2007; CIAA, 2008).
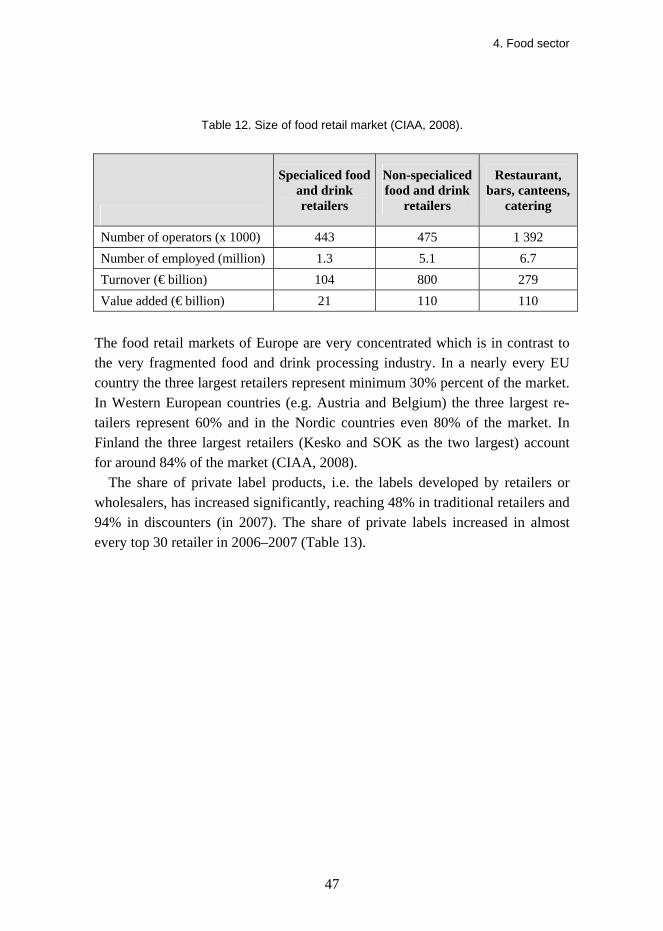
4. Food sector
47
Table 12. Size of food retail market (CIAA, 2008).
Specialiced food and drink retailers
Non-specialiced food and drink
retailers
Restaurant, bars, canteens,
catering
Number of operators (x 1000) 443 475 1 392 Number of employed (million) 1.3 5.1 6.7 Turnover (€ billion) 104 800 279 Value added (€ billion) 21 110 110
The food retail markets of Europe are very concentrated which is in contrast to the very fragmented food and drink processing industry. In a nearly every EU country the three largest retailers represent minimum 30% percent of the market. In Western European countries (e.g. Austria and Belgium) the three largest re-tailers represent 60% and in the Nordic countries even 80% of the market. In Finland the three largest retailers (Kesko and SOK as the two largest) account for around 84% of the market (CIAA, 2008).
The share of private label products, i.e. the labels developed by retailers or wholesalers, has increased significantly, reaching 48% in traditional retailers and 94% in discounters (in 2007). The share of private labels increased in almost every top 30 retailer in 2006–2007 (Table 13).

4. Food sector
48
Table 13. Major operators in the food retail market (CIAA, 2008).
Rank Company Estimated private label share % in 2007 (growth (↑) during 2006–2007)
1 Wal-Mart 38 (↑) 2 Carrefour 35 (↑) 3 Metro Group 17 (↑) 4 Tesco 48 (↑) 5 Ahold 24 (↑) 6 Seven & I * 28 (↑) 7 Costco 16 (↑) 8 Sears 42 (-) 9 Kroger 25 (-)
10 Target 17 (↑) 11 Rewe 27 (↑) 12 Schwarz Group 61 (↑) 13 Auchan 25 (↑) 14 Casino 32 (↑) 15 AEON 21 (↑) 16 Walgreens 12 (-) 17 Aldi 94 (-) 18 CVS 13 (-) 19 Edeka 14 (↑) 20 Leclerc 32 (↑) 21 Safeway (USA) 25 (-) 22 SuperValu 18 (↑) 23 Best Buy 8 (-) 24 ITM (Intermarché) 37 (↑) 25 Sainsbury 46 (↑) 26 Woolworths (AUS) 13 (↑) 27 Tengelmann 35 (↑) 28 Coles Gropu 15 (↑) 29 Rite Aid 13 (-) 30 El Corte Inglés 23 (↑)
* Includes consolidated operations only.

4. Food sector
49
In addition to the private labels, the amount of services to guide customers for healthy eating habits provided by the retailer is increasing. Examples of internet-based offering by the retailers are shown in Table 14 (Ottelin et al. 2006).
Table 14. Nutrition-related offering of European retailers in internet, examples (Ottelin et al. 2006).
Retailer and the web pages Contents of the service
Tesco (the U.K.) www.tesco.com www.tesco.com/ clubcard/healthyliving www.tescodiets.com/
Healthy living category contains information about nutrition and physical exercise. Possibility to ask questions. Possibility to join Healthy living club, which provides you with a magazine about nutri-tion and physical exercise, and cut-price coupons for healthy products and exercise services. Tesco eDiets category contains free survey of diet and exercise habits, after which you may buy a package of per-sonal guidance for special diets, including 24 h help desk service.
Asda (th U.K.) www.asda.co.uk
Healthy Living category contains information about healthy nutrition and healthy food choice, recipes, BMI calculator, and 7 days diet planning service. Possibility to ask questions Big Healthy Eat category is for children, teachers and parents. It contains interactive games about nutrition. ASDA publishes free “Good for you!” magazine, which contains info of health and healthy eating.
Edeka (Germany) www.edeka.de
Essen & wohlfühlen category contains recipes and a test for defining your own specific diet. Possibility to ask questions.
Sainsbury’s (the U.K.) www.sainsburys.co.uk
Healthy Living category contains information about nutrition, physical exercise, health and presentation of Sainsbury’s own healthy products. Recipe search.
Waitrose (the U.K.) www.waitrose.com
Nutrition channel category contains information about healthy nutrition, special diets and presentation of Waitroses’s own healthy products. Possibility to ask questions. Healthy eating for children category parents are provided with information about children nutrition and meal planning for different age groups. Interactive games for children.
Ahold (Netherlands) www.ahold.com
Nutrition and healthy leaving category contains information about healthy diet.
Casino (France) www.produis-casino.fr
Le Guide nutrition category contains information on healthy diet and food preparation.
Real (Germany) http://www.real.de
Food & fitness category contains recipes and BMI calculator
Kesko (Finland) www.ravintokoodi.fi
Ravintokoodi.fi is a free service K-food stores offer to their K-Plussa cardholder customers. The service is to monitor how healthy your family’s groceries are. Ravintokoodi.fi provides advice on how to eat more healthily.

5. Nutrition-related businesses
50
5. Nutrition-related businesses Closely with food industry, there exist various food and nutrition related busi-ness sectors, such dietary supplements, diagnostic tools (POC), diet guidance via nutrigenetics, and internet services and counselling tools for healthy eating.
Dietary supplements
Business sector related to dietary (or food or nutrient) supplements is large. Based on Tallon (2007) during 2002–2006, 57% of consumers have taken vita-min or mineral supplements because of specific medical conditions, and almost three quarters of adults believe that vitamins and minerals are effective in the prevention of certain diseases. In addition, analysis carried out by various Na-tional Health Interview Surveys show that 10–19% of the US population use herbs to help treat a disease (Tallon, 2007).
Plenty of vitamins, proteins, minerals, fibres and fatty acid supplements are available in the market. The largest sector of dietary supplements is vitamins (34%), ant it’s followed by herbs and botanicals (19%), sports nutrition (11%), meal replacements (10%) and minerals (8%) (Supplement Business Report, 2009). Supplements are sold through traditional retailing channels like in phar-macies and food markets, but also sold and marketed in a growing number of internet channels.
The dietary supplement category accounts for over $60 billion globally (in 2006). The market between dietary supplements and pharmaceutical synergy is still unexploited, and it is evaluated to have the potential of over $122 billion. The U.S. market is the largest supplements market globally with total sales of $20.1 billion (in 2006). The US supplements industry grew at a compound an-nual growth rate of 5.3% in 2002–2006. Although Japan has the worlds largest functional food market, the size of the dietary supplement segment is signifi-cantly smaller and currently worth $9.8 billion (Tallon, 2007).

5. Nutrition-related businesses
51
Diagnostic tools
Pharmacy companies, in addition to developing diagnostic tools for the health care professionals, target their products directly at consumers. These tools offer con-sumers the possibility to measure and monitor their health related status at home. Blood pressure testers for home use are already widely available, but also devices for urine analysis, diabetes and virus and bacteria detection are in the market.
POC (Point of Care) testing has emerged from the need to have more rapid-test results to improve the patient care process, and especially the test systems designed specifically for use by patients at home have increased in the market. In 2005 the market for POC test products was about €12.0 billion and it is fore-casted to grow 7.8% until 2010 (Marchant, 2006). The largest sector is self-testing of whole-blood glucose and it continues to grow. The major growth areas for POC testing are seen to be cardiac markers and microbial identification. Dur-ing development of new POC tests specifically for home-use, there are criteria that manufacturers need to meet:
Devices must be lightweight, small and simple to use
Results of home tests need to be recorded by patients in a simple online format
Inbuilt mechanisms to assure quality control will overcome concerns re-lating to device maintenance
Devices must be user-friendly and suitable for non-laboratory users, without complex sample preparation and reagents
Instructions for use must be clear and address language requirements of the user
Tests need to be affordable, especially in the consumer market where the end-user pays for the product out of their own pocket. (Marchant, 2006.)
Diet guidance via nutrigenetics
Development of personalized diets and tailored diet guides for healthy eating habits via nutrigenomics is an emerging area in the nutrition related business sector. The number of companies marketing “Food for your genes” has been increasing particularly in the U.S. (Table 15). The basis of this industry is to offer gene testing to evaluate the vulnerability of individual to get a specific

5. Nutrition-related businesses
52
disease, and subsequently to offer food products, nutrition supplements and diet guidance to prevent the disease (Poutanen et al. 2007).
Table 15. Example of companies utilizing nutrigenetics (in the U.S.) (Poutanen et al. 2007).
Company Products AlphaGenics www.alpha-genics.com
Lifestyle products based on genetic testing, e.g. drinks that will be automatically mixed by the drink machines for each individual based on their genetic information.
DNA Diet www.thednadiet.com
Gene testing, nutrition and diet guidance
Genelex www.genelex.com
Gene testing, nutrition and lifestyle guidance
Interleukin Genetics www.ilgenetics.com
Gene testing, especially for the gene interleukin 1 (in-flammation) and nutrition supplements for the persons detected for the gene
Metagenetics www.metagenics.com/technology/nutrigenomics.asp
Nutrition supplements
NutraGenomics www.nutragenomics.com
Diagnostic tests and research services
Salugen www.salugen.com
Gene testing and nutrition supplements tailored accord-ingly
Sciona www.sciona.com
Gene testing, assessment of diet and lifestyle and guid-ance accordingly
WellGen www.wellgen.com
Screening of bioactive compounds of natural products by gene technology; development of nutrition supplements and functional foods
Internet services and counselling tools
Several Internet services containing counselling tools for healthy eating and weight loss are offered for consumers to be used online (Table 16). Many different types of services are available starting from simple and free testes of own health status by answering some questions to broad services requesting subscription. One type of the channels are those where consumer share their own experiences to other consumers, so called social media type of platforms. And in contrast, retailers and food producers provide online services to consumers.

5. Nutrition-related businesses
53
Table 16. Examples of Finnish counselling tools in the Internet.
Category Basis Example Calculators Provide information on
weight status, estimates energy requirements and daily total calories etc.
http://www.verkkoklinikka.fi/laskurit/ http://kalorilaskuri.fi/
Tests and questionnaires
Testing of own diet for various nutrients or own risk for various diseases
http://www.diabetes.fi/testit/riskitesti/index.php http://www.leipatiedotus.fi/default.aspx?path=4;177;314
Online or mobile counselling tools
Food diaries, calorie and exercise counters, fol-low-up graphics, food analysis tools, discussion forums and contacts with experts, tailored meal suggestions and other services
Kalorilaskuri / www.kalorilaskuri.fi Keventäjät / www.keventajat.fi Kiloklubi / www.kiloklubi.fi Nutris / www.nutris.fi Pudottajat.fi /www.pudottajat.fi http://research.nokia.com/research/projects/WellnessDiary/
Tools and information for children
Advises on healthy eating and exercising provided for children and adolescents
http://www.hyvavalipala.fi/ http://www.wellou.fi/lapset/ http://ec.europa.eu/agriculture/tasty-bunch/
Tools at food stores
Tools provided for consumers at the food stores to improve their knowledge about the health status of their food purchases or gain variety for the eating
https://www.ravintokoodi.fi/nv/nc_loginfi.asp http://www.reetta.net/uutiset.html
Services offered by food companies
Many food companies offer information about their products but also online services about eating to their customers
http://www.valio.fi/profeel/ http://www.tiesydameen.fi/ http://www.becel.fi/Consumer/Home.aspx
Social media Consumers share their experiences relating to food and nutrition thought online channels
http://www.kotikokki.net/ http://keskustelu.suomi24.fi/debate/4
Commercial counselling services have the same idea than in the process of per-sonal counselling and the membership often provides a virtual visit to a dieti-cian. A personalised nutrition plan based on their own goals is provided for the

5. Nutrition-related businesses
54
members. The tools include services like food diaries, calorie and exercise counters, follow-up graphics, food analysis tools, discussion forums and contacts with experts, tailored meal suggestions.
Few examples of international fitness and nutrition counselling tools are listed below:
Dossia: http://www.dossia.org/consumers
GoogleHealth: http://www.google.com/intl/fi/health/about/index.html
ICW Lifesensor: https://www.lifesensor.com/en/us/
Intel: http://www.intel.com/healthcare/index.htm?iid=health+lhn_home
Mayo Health Manager: https://healthmanager.mayoclinic.com/Default.aspx
Microsoft HealthVault: http://www.healthvault.com/
MiLife: http://www.milife.com/
My HealtheVet: https://www.myhealth.va.gov/
Partners Healthcare, Connected Health: http://telemedicine.partners.org/Telemedicine/default.aspx?PageID=6.

5. Nutrition-related businesses
55
Roadmap to health and well-being through eating

5. Nutrition-related businesses
56

6. Nutritech roadmap process
57
6. Nutritech roadmap process
6.1 Nutritech roadmap – an integrated approach to health and well-being through eating
Nutritech started as a joint research programme of VTT Technical Research Centre of Finland and the University of Kuopio aiming at new concepts for pro-motion of consumer well-being. Since 2010 the programme will continue as an innovation programme of VTT. Its objective is to develop and apply innovative technologies regarding food and eating as a stepping stone to health enhancing products and services.
As an eye-opening foresight exercise for the whole Nutritech programme, a roadmap process was conducted at VTT. The aim of the process was to develop a roadmap addressing the future research for promotion of consumer well-being. For this purpose, drivers, needs, enabling technologies and solutions concerning the future of eating and well-being were identified and elaborated in the road-map.
The roadmap process consisted of three workshops (Figure 5), a seminar and back-office work of the core team to identify the future consumer and public needs, enabling technologies and finally the innovations needed. In addition synergies were searched between the Nutritech roadmap and another ongoing VTT roadmap project on service business (published by Vähä et al. 2009). The participants of the first and second Nutritech workshops were invited to answer an online questionnaire of the service business roadmap project aiming at identi-fication of drivers effecting the development of services in biotechnology, food and pharmaceutical industry.

6. Nutritech roadmap process
58
Figure 5. Nutritech workshop process structure.
The aim of the first Nutritech roadmap workshop was to brainstorm about future eating habits and related nutritional challenges. The workshop gathered nutrition and consumer researchers from VTT and National Consumer Research Centre of Finland. The main question was to identify for which needs of future consumers new innovations should be developed. The workshop was opened using a cus-tomised Potential Problem Analysis method. Each participant was given a form and asked to write at least three things related to the consumer needs. Then forms were cycled to the next person in order to trigger new ideas when reading the previous proposals. The forms were cycled until the saturation of the ideas. After a short break a general discussion on the findings was held. The key results of the workshop were documented in a mindmap by a scribe during the general discussion and were grouped in following eight categories:
1. values related to eating, communality (children, elderly, specific groups), functional food, price
2. easiness of eating, busyness, working life
3. responsibility and opportunities of HORECA, the role of information and technologies in the supply of food enhancing health and well-being
4. increasing and disseminating nutritional information

6. Nutritech roadmap process
59
5. awareness raising on combined effects of medicines and nutrition
6. customised/healthy nutrition solutions, food and physical well-being
7. sustainable development and climate change
8. emotional eating and mental well-being.
The detailed mindmap formed a fruitful ground for the other workshops, which started by completing the future consumers’ needs presented in the mindmap.
The second workshop dealt with future business opportunities in the food chain emerging from the consumers’ growing desire for well-being. The participants were representatives of Finnish food industry and VTT researchers. The aim of the workshop was to ideate new solutions responding to the future eating habits and nutritional challenges related to these habits. The workshop started with two warming up exercises, focused on the completion of the mindmap on the con-sumer needs (1) and drivers effecting the development of services in biotechnol-ogy, food and pharmaceutical industry (2). Then two brainstorming sessions were held. The first aimed at ideating new food solutions and the second opened the ideation towards industrial boundaries. Brainstorming was done in groups of four to five people. The industries identified as important for obtaining health and well-being through eating are primary production, food industry (which represents the core of the system), HORECA, trade and delivery, packaging, health care, phar-maceutical industry, and ICT and electronics (Figure 6).
Figure 6. Industrial boundaries related to the Nutritech roadmap.

6. Nutritech roadmap process
60
The third workshop continued on exploring new business opportunities emerg-ing from the industrial boundaries. The participants were VTT researchers com-ing from diverse research fields fortified by two representatives of HORECA sector. After revisiting once again the mindmap on consumers’ needs, two brain-storming sessions were run on the basis of an “opportunity wheel” (Figure 7). In two groups participants brainstormed first about what new technologies have to offer on eating and well-being (enablers) and thereafter about products and ser-vices (solutions) improving health and well-being through eating.
Figure 7. Nutritech opportunity wheel.
Diversified set of ideas regarding potential enabling technologies and innovative solutions for obtaining health and well-being through eating were generated in the second and third workshop.
The background and results of the roadmap work were presented in a seminar at VTT on 22 January, 2009. The seminar targeted to arouse discussions how the changes in society are reflected to the needs of eating and nutrition, and oppor-tunities of business development. The seminar gathered together around 140 experts from Finnish food chain representing food and packaging industry, re-search and development, HORECA, trade, education, media, as well as food and nutrition-related communication services. Valuable perspectives came up from discussions to complete the roadmap work.

6. Nutritech roadmap process
61
6.2 Structure of the Nutritech meta-roadmap
The results of the three workshops (see previous chapter) were grouped in five thematic sub-roadmaps. Each of the thematic sub-roadmaps consists of four layers of examination: general drivers, consumer’s needs, solutions and enabling technologies (Figure 8). This report presents the key findings synthesised in a meta-roadmap that gathers the thematic sub-roadmaps together. The meta-roadmap presents the main development trends as the project group sees them on the basis of the work done in the workshops.
Figure 8. The elements of the Nutritech roadmap framework.
The Nutritech meta-roadmap is visualised in the form of a tree. General drivers (the topmost layer of the framework) are the roots of the tree. The vision forms the body of the tree. The thematic sub-roadmaps are represented by the main branches and consumers’ needs by minor branches of the tree (Figure 9). The sprigs illustrate enabling technologies and other enabling measures and finally the fruits of the tree hold the solutions.

6. Nutritech roadmap process
62
Figure 9. Nutritech meta-roadmap visualised in the form of a tree.

7. General drivers
63
7. General drivers General drivers affecting eating and well-being were identified by the project group on the basis of the workshops’ results. Selected key drivers are healthcare costs, ageing, sustainability, information flow, ubiquitous information and com-munication technology (ICT), cultural mixing and individualism (Figure 10). Seven key drivers are shortly described below.
Aging Healthcare costsSustainability Cultural mixingUbiquitous ICT
Information flow Individualism
Figure 10. Seven key drivers of the Nutritech meta-roadmap.

7. General drivers
64
Healthcare costs
The healthcare costs are increasing along the new treatments, elder and sicker population ageing in general. For examples, the total healthcare costs in Finland (Statistics Finland, 2009) were €7 341 millions in year 1995, €9 249 millions in year 2000 and €13 616 millions in year 2006, respectively.
Ageing
The wholesome nutrition and developments in medicine have improved the health care and extended the expected life time. The improvements in occupa-tional safety and working conditions have supported this development. For ex-ample, according to the Statistics Finland, the expected life time in Finland was 70.9 years for men and 75.9 years for women in 1990, but 78.9 and 82.9 years in 2007, respectively. The share of 65 years old in the Finnish population is as-sessed to rise from current 17% to 27% until the year 2040, and to 29% until the year 2060 (Koponen and Aromaa 2005). In EU, the expected life time is even higher in several countries like Italy, France, Spain and Sweden (Jagger et al. 2008). One of the most important causes for death in Finland still is the cardio vascular diseases (Koponen and Aromaa 2005). And although Finnish healthcare system is ranked one of the best in Europe, Finnish people evaluate their health status clearly below the average among the EU members (Anderson et al. 2009).
Sustainability
The climate change already is a fact caused by traffic, energy production and efficient farming, among other things. The globe is not able to produce the west-ern countries’ standard of living in the development countries. The same implies also to the food production; the way of eating meat in EU and US is not sustain-able for all people in the world.
Information flow
The modern ICT technology enables the information retrieval and delivery for all citizens all the time. In addition to allow the information changes the com-munication technology offers a powerful means for manipulation of attitudes, opinions and values of citizens.

7. General drivers
65
Ubiquitous ICT
The modern ICT enables people and equipment to be integrated in the global information network. As a consequence, there is a big demand for greater effi-ciency in a wide variety of applications from food safety to more efficient supply chains and logistics.
Cultural mixing
Globalization and the opening of borders as well as the global communication enable the transfer of people, goods and information around the world. For ex-ample, the amount of people travelling from Finland to abroad or from abroad to Finland grows 3 to 5% every year. In 2007, 26 029 persons moved into Finland. The amount of refugees was 15 476 in 1997 and 29 550 in 2007, respectively.
Individualism
The values, habits and attitudes are traditionally inherited from the childhood home and family. I the modern society, mothers are working and children are taken care by kindergartens and schools. TV, Internet and social networks offer alternative ways of thinking and influence the values. Citizens become world citizens and individualists adopting influences from the entire world already as child. The individualist –phenomenon can be seen in statistics: ever more people live in cities and in single households. For example, in Finland, the share of sin-gle households has increased from 30% to 40% of all households during the past 20 years (Statistics Finland).

8. Nutritech trends and vision – growing the Nutritech tree from five perspectives
66
8. Nutritech trends and vision – growing the Nutritech tree from five perspectives The body of the Nutritech tree is formed by the overall vision of the metaroad-map. The vision is to achieve Health and well-being through eating. This slo-gan-like expression embodies the vision of a future offering equal opportunities for individuals to enhance their health and well-being by eating tasteful food produced in a sustainable way, prepared and consumed in opportune modes and times according to the future consumers’ changing needs.
The vision can be approached through five perspectives or sub-roadmaps rec-ognised in the workshops. The sub-roadmaps are presented by the five main branches of the Nutritech tree, which are named Convenience, Values and com-munality, Physiological functionality, Communication and Personification (Fig-ure 11). Each of the main branches grows further to needs (secondary branches), enablers (sprigs) and solutions (apples) proper to the approach in question (see examples in Appendix A).
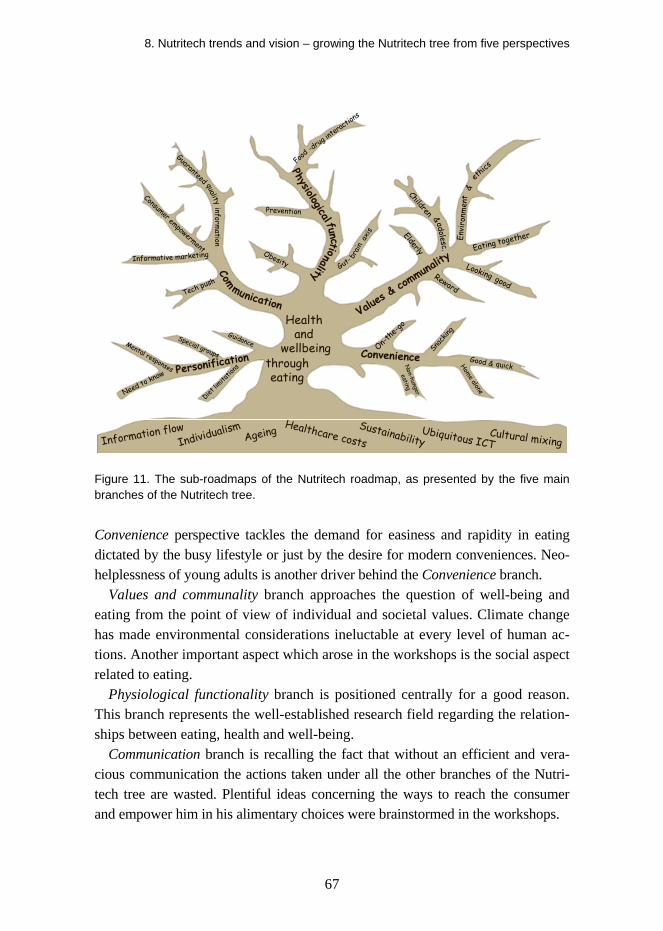
8. Nutritech trends and vision – growing the Nutritech tree from five perspectives
67
Personification
Com
Convenience
Values
& com
munality
nicationmu
Physiological functionality
Personification
Com
Convenience
Values
& com
munality
nicationmu
Physiological functionality
AgeingHealthcare costs
SustainabilityCultural mixing
Ubiquitous ICTInformation flowIndividualism
Health and
wellbeingthrougheating
Envi
ronm
ent
&
ethics
Eating togetherElderlyChildren
adolesc.&
Looking goodReward
Snack
ing
On-the
-go
Good & quickHome alone
Non-hunger
eatingObesity Gut-
brain
axis
Prevention
Food-drug
intera
ctions
Need to know
Special groups
Diet lim
itatio
ns
GuidanceMental responses
Guaranteed qualityinform
ation
Tech push
Consumer empowermentInformative marketing
Figure 11. The sub-roadmaps of the Nutritech roadmap, as presented by the five main branches of the Nutritech tree.
Convenience perspective tackles the demand for easiness and rapidity in eating dictated by the busy lifestyle or just by the desire for modern conveniences. Neo-helplessness of young adults is another driver behind the Convenience branch.
Values and communality branch approaches the question of well-being and eating from the point of view of individual and societal values. Climate change has made environmental considerations ineluctable at every level of human ac-tions. Another important aspect which arose in the workshops is the social aspect related to eating.
Physiological functionality branch is positioned centrally for a good reason. This branch represents the well-established research field regarding the relation-ships between eating, health and well-being.
Communication branch is recalling the fact that without an efficient and vera-cious communication the actions taken under all the other branches of the Nutri-tech tree are wasted. Plentiful ideas concerning the ways to reach the consumer and empower him in his alimentary choices were brainstormed in the workshops.

8. Nutritech trends and vision – growing the Nutritech tree from five perspectives
68
Personification perspective addresses the demand for personal solutions re-garding for example diet limitations due to physiological malfunctions or life-style choices implicating specific dietary habits.
8.1 Convenience
Vision
The importance of convenience in food products is increasing. Convenience is, however, much more than just ready-made meals or eating out. It includes sav-ing of time, but also saving of psychological energy and effort. Need of conven-ience is also linked to monitoring food healthiness and personal health, the availability and delivery of healthy foods, easiness of understanding of food quality for your health, and effortless comparison of different options. Food- and eating-related products and services making consumers’ life easier are increas-ingly demanded.
Figure 12. Convenience branch in the Nutritech tree.

8. Nutritech trends and vision – growing the Nutritech tree from five perspectives
69
Needs
The current busy lifestyle creates a growing demand for convenient on-the-go food products and services, also including increasing requirements for new health-ier options. Eating on-the-go, ecological and healthy snacking, tasty and quick food, easy and quick preparation of meals, getting the day’s fresh food delivered at one’s door are examples of application areas of convenience. (Figure 12) .
Snacking as an eating behaviour is replacing the traditional meal pattern in some consumer segments. Also the so called non-hunger eating either alone or in social situations is common. There is a high demand for high quality and quick meal options suitable for the families and singles who don’t want or who don’t have time to spend their time on cooking during the week. The increasing num-ber of consumers eating alone at home daily, e.g. the elderly, singles and chil-dren, need products, services and solutions targeted to their special requirements.
When grocery shopping in the supermarket or grabbing on-the-go options, consumers wish to have easy and quick access to product information to enable comparison of products. This applies multiple types of information, including sustainability, origin and healthiness. Convenience in communication means the use of many communication channels and technologies in varying occasions. Also monitoring of health in a convenient and illustrative way is interesting for consumers both with the goal to prevent health problems and when treating ex-isting physiological problems.
Convenience answering ecological needs includes sustainable packaging with less packaging material, and the use of materials that are easily recycled also on-the-go. Hopes for healthy eating, and getting pleasure of eating even when eat-ing in an non-traditional situation, like home alone, are all also examples of needs of convenience.
Enablers
Understanding consumer behaviour is prerequisite for identifying opportunities to make consumers’ life easier. Enablers based on modern technology, such as new packaging and food technologies, logistic and ICT solutions, and technologies that allow processing at a point of action, make several new convenience product and service solutions possible. New service and delivery concepts, applied snack food processing technologies, such as extrusion, may be used to develop convenient on-the-go solutions. In situ-processing technologies and hybrid technologies enable to

8. Nutritech trends and vision – growing the Nutritech tree from five perspectives
70
shorten food preparation time at home. Ubiquitous ICT offers possibilities for the convenient solutions in the delivery chain and communication.
Solutions
Solutions for convenient food products and food related activities can be divided in four categories: 1) food solutions, 2) delivery solutions, 3) packaging solu-tions and 4) information solutions.
In the food category, solutions include, for example, semi-moist food products suitable for on-the-go, new types of healthy and tasty snacks and pastry prod-ucts, healthy ‘emotional’ foods, as well as modification of unhealthy foods, e.g. by adding low-calorie fillers, as well as optimally pre-processed raw materials for meals. Examples of the delivery solutions include fresh food taxi, new deliv-ery systems for specific food types and self service street kitchens.
Packaging solutions differ largely depending on the needs of the user. We can develop new packaging options, such as minimum waste or deposit packages, easy to open and select packages, on-line scaling of package size, and options that are easy to recycle on-the-go. Packages can be designed for safe fast food with fresh-ness indicators, containing indicators for food stability, reminders for eating.
Information solutions consists of various web, printed intelligence, mobile and database solutions with an attempt to inform about healthy and local food, reci-pes, as well as intelligent food ordering systems. The information solutions may also include easy-to use devices (POC = Point of Care) and services.
Case example
FUTPACK-CON (Future food package – consumer driven research and development process for new packaging concepts) -project is motivated by the need to create new concepts for future food packages as well as business opportunities for companies in the field. The new packaging concepts could contribute to for example sustainable development and changes in eating habits. The problem is how to select solutions which are likely to succeed in the markets and create concepts which consumers find the packages attrac-tive and useful. In this project, a consumer driven development and research process is developed. The work proceeds iteratively using expert workshops and consumers studies to create and further develop concept ideas. Futu-pack-CON is a 2-years (2009–2010) TEKES funded project and it is part of TEKES funded collaboration network Futupack (TEKES-Futupack).

8. Nutritech trends and vision – growing the Nutritech tree from five perspectives
71
8.2 Values and communality
Vision
The importance of collective and protective values, such as the protection of envi-ronment due to climate change, will increase, and these will be strong factors in-fluencing consumers’ food-related behaviour. Self-centred values like hedonism will continue to have a significant role, guiding thus the choice of major part of food products or services. To the vast majority of consumers food price and taste are still the most important determinants of buying decisions. However, there are an increasing number of people who are willing to pay a premium price for food which fulfils their values and special needs. Generation of novel types of commu-nities among consumers will continuously increase fragmentation of consumer population. The new consumer segments will more and more be based on value-based lifestyle factors and not on traditional demographics.
Figure 13. Values and communality branch in the Nutritech tree.

8. Nutritech trends and vision – growing the Nutritech tree from five perspectives
72
Needs
Values consist of beliefs, concepts and guiding principles of life which represent interests of individual’s person and his/her social groups. These interests are motivational in the orientation of humans: the values direct the behaviour and they are considered to be cognitive in their nature. Consumers tend and also wish to act according to their values, which affects, for example, their purchas-ing behaviour. (Figure 13)
Many people need to share the values and to express their values in their choices. In relation to food choice and eating habits, values typically comprise issues such as ethics of the food production chain (e.g. animal welfare, environ-mentally friendly and sustainable food production, potentially near the place of the consumption) and communal and personal values related to food consump-tion. The values can be largely shared between consumers (e.g. issues related to production animal welfare), whereas others can be very personal and even con-tradicting between different consumer groups (e.g. people consuming specific diets based on their personal ethical values).
Eating together is a fundamental need, and therefore, the family meals beyond the traditional family concept and other shared meals are socially, psychologically and nutritionally very important. Specific age groups (children, adolescent and elderly) have their own specific demands for communality and values related to eating environments and food choice. With children and adolescent, home and school eating provide important routines and education that guide the eating hab-its. Communal eating is also important for elderly people who might encounter difficulties in e.g. shopping and preparing the foods. Among elderly traditionalism is often the value that tends to guide the eating habits and food choice.
Important aspect related to communality is the social pressure coming from communities. Communal values direct people to eat the right foods in a way that people feel to belong to the community (specific diets) and look good (weight control products, ‘beauty yoghurt’).
Taste and price of foods most often overcome the individual values. Majority of humans select tasty and cheap products. However, there is a growing number of peo-ple who are ready to pay a higher price for a food product which fulfils their special needs related to the origin, way of production, healthiness, etc. On the other hand, sometimes people seek reward and gratification from foods and in this situation instant hedonistic needs can momentarily overpower the typical eating habits (e.g. person eating healthy diet foods can reward himself/herself by eating chocolate).
8. Nutritech trends and vision – growing the Nutritech tree from five perspectives
73
Enablers
For enabling the visions and needs, research of individual and community val-ues, communication and information technologies, food and packaging solu-tions, biotechnology, and utilisation of food side streams are in focus. For exam-ple, food and packaging technology as well biotechnology can provide solutions to more sustainable food production and consumption (including natural and minimal processing). Innovative food technologies enable utilisation of high-value side-streams in the production of healthy and environmentally friendly foods.
Better understanding of consumers’ and communities’ attitudes and values re-lated to food choices is a prerequisite. The multidisciplinary approach (e.g. com-bining behavioural sciences and technology etc.) enables shifting the focus of food innovation to the individual, social and ethical values of eating. Develop-ment of education systems can influence consumers’ and communities’ food-related values, and subsequently guide people to healthier eating habits. This can be accomplished via utilising the possibilities of internet and social media (target groups especially adolescents).
Solutions
Understanding of the values that guide consumers’ food choice is a necessity in developing new value- and community-based nutrition and eating solutions. Understanding consumer segmentation based on values instead of traditional demographics enables also development of solutions for novel types of con-sumer groups. Solutions for answering consumers’ values and communality –related needs include web and mobile technologies for utilisation of social media and even for creating new ways for communal eating situations. More sustain-able food production, e.g. innovations in novel of vegetable foods replacing meat options and exploitation of high-value side-streams in the production of healthy and environmentally friendly foods are examples of solutions. For spe-cial consumer groups a way to combine healthy leisure time activities with eat-ing answers to the need of eating together. An obvious solution is to develop food experiences instead of food supplies.
For example, eating at school could be made more appealing by increasing the comfort of the lunch break, by offering foods which are tasty as well as healthy, and by motivating adolescents to eat at school with information that appeals

8. Nutritech trends and vision – growing the Nutritech tree from five perspectives
74
especially to young people. Solutions for elderly include combining healthiness to the social aspects of eating and combining leisure time activities with eating together. Branding of certain food (e.g. water, wine and coffee) could appeal to elitist consumer groups.
Case example
CONDOR: In an EU-funded project CONDOR (Consumer decision-making on organic products; 2003–2005) the processes involved in consumer deci-sion-making on the purchase and consumption of processed and fresh organic foods were studied and consumer choice of organic foods based on attitudes, values, affective and moral concerns over eight EU member states were mod-elled. The results showed that the same type of reasoning influences the choice of organic foods across the different countries and for both processed and fresh organic foods. The major differences between organic consumers and non-organic consumers were what they think and feel about organic foods and the belief in the benefits that these foods provide, rather than demographic variables such as age, gender, education and income. Additionally, organic consumers believe that by following their organic purchasing habits they are doing the right thing, and are seen to be doing so by friends, family and neighbours. The more people thought that organic was healthier, was better for the environment and tasted better, the more positive they felt about buying it. Negative beliefs towards buying organic food, overall, were less important. Atti-tudes towards fresh as well as processed organic foods were mostly positive.
8.3 Physiological functionality
Vision
Diet has a major effect on health and quality of life. Both healthiness and spe-cific physiological functionality of foods play an important role in the future diet. Each consumer has his/her own genetic background which has an impact on the outcome of nutritional interventions. Therefore it is likely that personal risk scores will be utilised in the future to facilitate dietary guidance. Development of specific foods tailored for certain risk groups will continue. As well as for risk-reducing foods physiological functionality will also be substantiated for health-

8. Nutritech trends and vision – growing the Nutritech tree from five perspectives
75
maintaining foods. Furthermore, personalized nutrition will also mean healthy foods tailored for individual sensory preferences.
Prevention
Obesity
Food
-drug
interactions
Gut-
brain
axis
functio
Physiologicalnality
Nutrigenomics& metabolomics
Foodtech
Diagnostics (lab)
Controlleddelivery
Host-diet-microbiota
interactions
Target search
Func.ingredi-ents
Func.ingredi-ents
Tailored
diets with
medicatio
nTailored
diets with
medicatio
n
Nutr.POC diag.
tools
Nutr.POC diag.
tools
Personal
recommend-
ations
Personal
recommend-
ations
Riskfactors
Multidisc. research
Figure 14. Physiological functionality branch in the Nutritech tree.
Needs
When the WHO (World Health Organisation) was established the text of its con-stitution defined health as “a state of complete physical, mental and social well
being and not merely the absence of disease or infirmity.” This idealistic defini-tion has turned out to be quite problematic in practice. If we think about general, healthy (or in this case normally functioning) population very few individuals would actually fulfil these criteria. Most people tend to occasionally suffer from minor ailments and still they would consider themselves to be generally healthy. Defining a general (healthy) population has turned out to be quite a stumbling block e.g. for approval of Function claims (Article 13.1 of EU regulation 1924/2006) in EFSA (European Food Safety Authority, http://www.efsa.europa.eu). A failure to show a health benefit to “general population” has lead into situation where sev-

8. Nutritech trends and vision – growing the Nutritech tree from five perspectives
76
eral proposed health claims have been rejected by EFSA on the basis that the target population for the functional food is not the “general population” but in-stead quite sick people. Since functional foods are aimed to provide increased well-being, and reduction of some risk factors and concomitant prevention of disease, we need a practical and applicable definition of healthy homeostasis. This means that we need to identify a range of healthy phenotypes. Important targets for functional foods are large intestine, immune system, insulin resis-tance, lipid metabolism, bone and joint health, brain function, and prevention of allergies. For some of these (e.g. gut microbiota and its activities) there is no definition of healthy homeostasis. Since it is known that gut microbiota impacts systemic host metabolism defining the range of “healthy” or “normal” gut mi-crobiota and its activities is important. Unlike for many other parameters it can be anticipated that considerable inter-individual variation will occur in “healthy” microbiota and therefore defining the limits of “healthy” microbiota becomes even more important.
Another important issue besides defining the range of health is understanding why some people, in spite of having disease risk factors like obesity, stay healthy, and why, on the other hand, people who lead a healthy lifestyle can get metabolic diseases. We need to understand personal risk factors, not only risk factors at the population level. Understanding the interplay between diet, host factors (genetics, epigenetics (information heritable during cell division other than the DNA sequence itself)) and environment plays a crucial role here. It is well-known that an individual’s genetic make-up plays an important role in the development of many diseases. The role of epigenetics in disease development is currently a less well-known area and a target of very active research. Epigenetic abnormalities involve e.g. changes in the DNA methylation, incorrect histone modification, and altered distribution or function of chromatin-modifying pro-teins that, in turn, lead to aberrant gene expression (Feinberg 2007). There is mounting evidence that defects in the epigenome are causative factors in several diseases including cancer. Since epigenetic regulatory processes may be suscep-tible to changes by environmental factors such as diet, they offer potential mechanistic explanations for how constituents in food and dietary supplements may modify cancer risk. Furthermore, epigenetic changes can be heritable and therefore acquired “marks” can be passed from parents to children (Bird 2007, Ross et al. 2008).
This knowledge about personal risk factors (genetical, epigenetical and envi-ronmental) is vital when we aim to develop functional foods for specific target

8. Nutritech trends and vision – growing the Nutritech tree from five perspectives
77
populations. In the future the synergy and interplay between medical and dietary treatments will become more important. Medicines and functional foods can have common metabolic targets and thus synergy effects in prevention and treatment of chronic diseases. (Figure 14)
Enablers
To further elucidate the effect of diet on (personal) physiological functionality multidisciplinary research enables defining the targets and mechanisms. This means involvement of wide variety of expertises e.g. nutritionists, physicians, geneticists, biochemists, immunologists, microbiologists and bioinformatics. Identification of genetic and epigenetic risk factors and early identification of risk factors enables identification of sub-populations for more efficient preven-tion of diet-related diseases. Outcomes of large-scale human metabolomic stud-ies should enable the identification of biomarkers for disease development at an early stage. Food technological and biotechnical solutions e.g. for optimal deliv-ery, stability and activity of functional ingredients can be developed.
Solutions
Development of “early” disease-risk (bio)markers enabling preventative measures.
Personal recommendations for diet, lifestyle and prevention of disease based on the “early” markers and aided by (POC) diagnostics of risks and dietary status.
Development of functional ingredients that facilitate disease-prevention/disease–control in targeted risk populations. To optimise the functionality of the ingredients controlled delivery systems may be applied. Functional ingredients will have synergistic effects with medicines and, if possible, potentiate and intensify the efficacy of drug treatments.
Case example
A study of factors behind type 1 diabetes: “Dysregulation of lipid and amino acid metabolism precedes islet autoimmunity in children who later progress to type 1 diabetes” (Oresic et al. 2008). The work was a col-laborative study between VTT, University of Turku, University of Oulu,

8. Nutritech trends and vision – growing the Nutritech tree from five perspectives
78
University of Tampere, University of Kuopio, University of Helsinki, Tam-pere University Hospital, and Turku Centre for Biotechnology. The background for the study was the fact that the risk determinants of type 1 diabetes, initiators of autoimmune response, mechanisms regulating pro-gress toward β cell failure, and factors determining time of presentation of clinical diabetes are poorly understood. Changes in the serum metabolome were prospectively investigated in children who later progressed to type 1 diabetes. Serum metabolite profiles were compared between sample series drawn from 56 children who progressed to type 1 diabetes and 73 controls and who remained nondiabetic and permanently autoantibody negative. In-dividuals who developed diabetes had reduced serum levels of succinic acid and phosphatidylcholine (PC) at birth, reduced levels of triglycerides and an-tioxidant ether phospholipids throughout the follow up, and increased levels of proinflammatory lysoPCs several months before seroconversion to autoantibody positivity. The lipid changes were not attributable to HLA-associated genetic risk. The appearance of insulin and glutamic acid decar-boxylase autoantibodies was preceded by diminished ketoleucine and ele-vated glutamic acid. The metabolic profile was partially normalized after the seroconversion. Autoimmunity may thus be a relatively late response to the early metabolic disturbances. Recognition of these preautoimmune altera-tions may aid in studies of disease pathogenesis and may open a time win-dow for novel type 1 diabetes prevention strategies (Oresic et al. 2008).
8.4 Communication
Vision
Consumers use various communication channels depending on their personal needs and interests. Commercial mass media will adapt from push mode to in-teractive and collaborative format. Consumers are critical to reliability of com-munication and validate information from several sources. They demand per-sonal and entertaining communication which is not restricted to the place or devices. These changes will have an effect on food related consumer behaviour, especially regarding to value-added foods.

8. Nutritech trends and vision – growing the Nutritech tree from five perspectives
79
Figure 15. Communication branch in the Nutritech tree.
Needs
There is a growing consumers’ interest for information and knowledge content of food products to assist product and dietary choices. Consumers need also motivation to make healthy and sustainable food choices. They want to know the health effects of foods in a reliable, easy and entertaining way. Some consumers want to share their product usage experiences with other consumers and organi-zations, and participate in various kinds of food or diet related social communi-ties in new communication channels. (Figure 15.)
Enablers
The major technologies enabling the above mentioned vision and needs are web and mobile communication technologies, semantic web, internet games, intelli-gent packaging solutions and social media communities.

8. Nutritech trends and vision – growing the Nutritech tree from five perspectives
80
Solutions
The most relevant solutions for value added food related communication are motivational, personal, social and entertaining web and mobile services. Virtual games and social communities are examples of motivational tools. These tools can in an entertaining way motivate and advice consumers to behave in a health-oriented way. Another example is semantic web technologies which can be used to develop personally tailored food related web services to specific consumer groups. Intelligent packaging solutions and kitchen equipment integrated with mobile and web applications will offer consumers relevant nutrition information both at home and on-the-go.
Case examples
HyperFit internet service (www.vtt.fi/hyperfit) was developed in the Hy-perFit project (Hybridmedia for personal management of nutrition and exer-cise) during 2005–2007. The aim of the project was to develop communica-tions tools for personal management of nutrition and exercise. HyperFit is an internet service for personal management of nutrition and exercise, de-signed to 18–30 year old persons. It provides tools for promoting healthy diet and physical activity. The principle of the service is to imitate the proc-ess of personal nutrition counselling. The service contains self evaluation tools for testing and goal definition, food and exercise diaries, analysis tools, and feedback and encouragement given by a virtual trainer. The service is used both with a mobile phone and PC.
Wellness Diary. By Nokia’s mobile Wellness Diary service http://research. nokia.com/research/projects/WellnessDiary/ user can record personal weight or exercise data to system which generates graphs accordingly to weekly ex-ercises. Nokia has been developing this mobile version of wellness theme with the support of VTT. The Wellness Diary is a tool by which one can up-load and analyze wellness related every day data via mobile phones and get various analysis, reports and graphics from data. The service makes possible to monitor and analyze data on weight, exercises, steps, blood pressure, fat percent etc.

8. Nutritech trends and vision – growing the Nutritech tree from five perspectives
81
8.5 Personification
Vision
Modern lifestyle management calls for personalized solutions for healthy diets which are based both on personal taste and health preferences. Such personal guidance solutions direct food choices according to personal risks (e.g. meta-bolic syndrome, diabetes and genetic background), but also take into account culture and values of the individual. In addition, personalized solutions should be attractive and easy to use from industry and individual point of view. They also allow personal tuning of fresh food portions in shops and on-the-go.
Figure 16. Personification branch in the Nutritech tree.
Needs
Information on an individual’s genetic and environmental background is a ne-cessity for personalized diet solutions. The individual should be aware of his or her personal nutrition needs in order to fulfil them and at the same time the in-dustry should know what to offer. Furthermore, personal food-related prefer-ences linked to the eating experience should be taken into account. For example,

8. Nutritech trends and vision – growing the Nutritech tree from five perspectives
82
a healthy diet would be easier to follow, if it was tailored to your taste and con-sumption preferences as well as nutritional needs. (Figure 16).
Eating is more than food and nutrients. It is usually a social event that may also fulfil ethical, environmental and cultural needs. Furthermore, different die-tary schools, allergies, and diseases require special attention since the number of acceptable nutrients is limited. On the other hand emotional eating treats adverse feelings with food. Means to get acquainted with oneself and to identify, recog-nize, and accept the feelings and their effects on eating behaviour are warranted as well as personalized diet solutions that would keep emotional eating healthy. In order to make good choices people need personalized advice and education, but this is not enough. People need to have an inner will and motivation to make the choices.
Enablers
Understanding human physiology is the key to enable personification of diets. With increased understanding of physiological effects of different nutrients, their synergy and modification in vitro and within the human metabolism can help us identify the inter-individual differences in metabolic pathways and the ways how these modifications alter physiological responses including special groups like children, elderly, and allergic people. Such detailed analyses of physiological effects allow identification of groups of nutrients, metabolites, and people which respond to different dietary solutions. This information should be the basis for the choice of healthy nutrients. Thus, the personalized healthy diet also demands personalized monitoring devices. In fact, diseases and allergies require this monitoring in order to guarantee food safety. In essence, self-monitoring de-vices, and analyses of nutrition by health care system should be linked to allow more efficient preventive health care. Traceability and food safety diagnostics are also important in industrial processes.
Mobile technology and social media are good examples of modern communi-cation pathways that could be used to enable personification of diets. Availabil-ity of reliable nutrition information with easy-to-use ICT or personalized psy-chological support would provide support for consumers adjusting their diets. Covering all these aspects of personification, understanding of consumers’ views, needs and attitudes is essential.

8. Nutritech trends and vision – growing the Nutritech tree from five perspectives
83
Solutions
Personification can be achieved by analyses and tailoring of the physiological effects of different nutrients. Data mining and ICT tools are required to extract knowledge from the physiological data. When these tools are applied also in the food industry, personalized food products can be prepared in situ to match cus-tomers’ needs. For example, fresh low GI, lactose free, or HDL cholesterol products could be prepared in the shop on-the-go the same way spice mixes are prepared today.
Printed intelligence applications would offer a cost efficient way to provide the shop and the consumer information regarding the products: ingredients, manufac-turing date, “best-before” date, manufacturing location etc. Edutainment could be included in the packages or mobile tags for children and adolescents. Mobile solutions and in-shop readers would also benefit other special groups’ needs. Emotional eating could be expanded into mood foods of conscious choice. Se-lected portals and wikis with recipes, targeted commercials to mobile phones, and mobile solutions to involve healthcare experts in food selection processes would provide further added value for the personalized consumer solutions.
Case example
HyperFit internet service (www.vtt.fi/hyperfit) was developed in the Hy-perFit project (Hybridmedia for personal management of nutrition and exer-cise) during 2005–2007. The aim of the project was to develop communica-tions tools for personal management of nutrition and exercise. HyperFit is an internet service for personal management of nutrition and exercise, de-signed to 18–30 year old persons. It provides tools for promoting healthy diet and physical activity. The principle of the service is to imitate the proc-ess of personal nutrition counselling. The service contains self evaluation tools for testing and goal definition, food and exercise diaries, analysis tools, and feedback and encouragement given by a virtual trainer. The service is used both with a mobile phone and PC.

9. Summary and conclusions
84
9. Summary and conclusions Food has many roles for the consumer. Eating is in the modern society often rather a reward than merely an answer to hunger. Nutrition has a key role in counteracting the increasing prevalence of chronic diseases. Eating should give experiences while maintaining healthy metabolism. Food supplies should make people’s living easier, and take into account personal needs.
Industrialization, urbanization, economic growth and globalization are all the time changing the eating patterns. The changing environment necessitates continuous development of the food production and distribution, but also a rethinking of the nutrition. All this brings about new needs for food offering and ways of eating among different stakeholders, such as government, consumers and business:
Government
Increase of chronic diseases should be stopped.
Inappropriate eating patterns give rise to large costs both at individual and public economy levels. It has been estimated that healthcare costs of nutri-tion related diseases may account for as much as 30% of all healthcare costs in Europe.
Food safety and sustainability of food production must be ensured.
Consumers
Consumers search for convenience, experiences and collective values. Consumers eat for pleasure, food as reward. There is a care about oneself; consumers have real interest in well-being.

9. Summary and conclusions
85
Business
In the food sector, most of the value added is expected from combining healthiness with convenience, sustainability and pleasure.
Communication and personalisation are requested in delivering product in-formation and experiences.
Need for convenience is reflected in food delivery systems.
Food industry has potential at interphases with other sectors, such as pharma and ICT.
The Nutritech roadmap process was initiated in order to feature the drivers, challenges and research strategies for development of new technologies and concepts for promotion of well-being by nutritional means. The main objective of the roadmap was to characterise the drivers, needs and future potential for various actors involved in the food production and distribution chain, but also for actors developing services offering communication and motivation tools for consumers who wish to improve their nutrition.
In the first phase of the roadmap process, seven general drivers influencing the challenges and needs of various stakeholders in the area of foods, nutrition and eating patterns were identified: healthcare costs, sustainability, ubiquitous ICT, information flow, ageing, cultural mixing and individualism. Ageing and cul-tural mixing are demographic changes influencing the consumer goods market. Increasing healthcare costs and fighting against climate change are major chal-lenges for the society. ICT represent an enabling technology to change the eve-ryday life practices. The presence of an expanding information flow and ten-dency to individualism are also examples of factors influencing everyday life and also attitudes and practices of eating.
During the roadmap process, five themes were identified, and they were dis-cussed one by one in thematic sub-roadmaps: 1) Convenience, 2) Values and communality, 3) Physiological functionality, 4) Communication and 5) Per-sonification. A summary of their visions is presented below.
Convenience
The importance of convenience in food products is increasing. It includes saving of time, but also saving of psychological energy and effort.

9. Summary and conclusions
86
Need of convenience is linked to availability and delivery of healthy foods, easiness of understanding the impact of food quality on health, effortless comparison of different options, and monitoring food healthiness and per-sonal health.
Food- and eating-related products and services making consumers’ life eas-ier are increasingly demanded.
Values and communality
The importance of collective and protective values, such as the protection of environment due to climate change, will increase.
Self-centred values like hedonism will continue to have a significant role.
To the vast majority of consumers, food price and taste are still the most important determinants of buying decisions.
An increasing number of people are willing to pay a premium price for a food which fulfils their special needs.
Generation of novel types of communities among consumers will continu-ously increase fragmentation of consumer population.
The new consumer sectors will more and more be based on lifestyle factors and not on traditional demographics.
Physiological functionality
Diet has a major effect on health and quality of life.
Substantiation of health maintenance – biomarkers for healthy homeostasis – is needed to substantiate effects of healthy diets.
Development of functional foods tailored for certain risk groups continues based on increased understanding of pathogenesis of chronic diseases.
Personal risk scores will be utilised in the future to facilitate dietary guidance.
Personalized nutrition also means choice of healthy foods tailored to meet consumer’s sensory expectations and personal health responses.
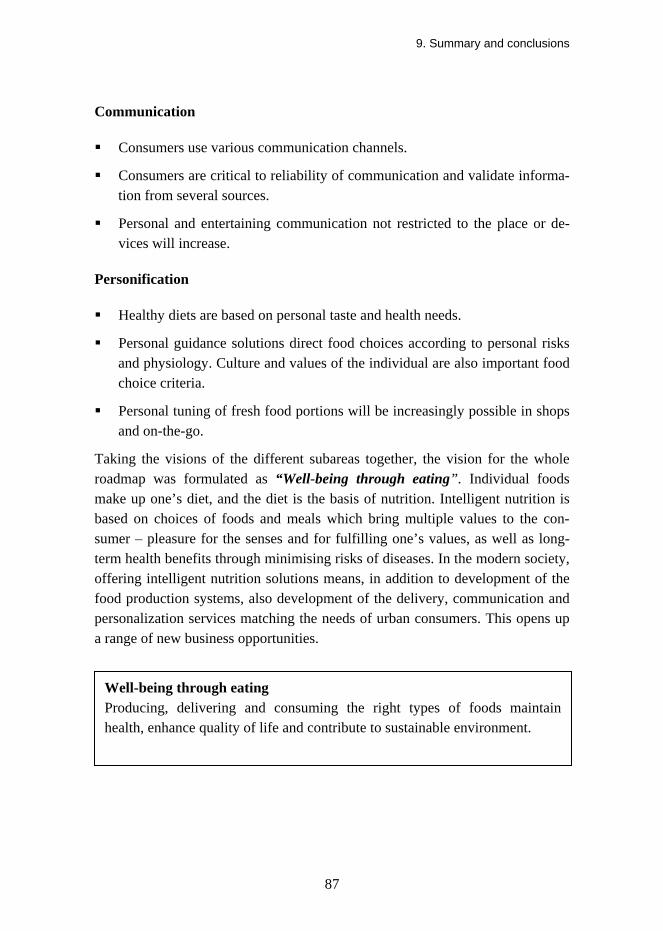
9. Summary and conclusions
87
Communication
Consumers use various communication channels.
Consumers are critical to reliability of communication and validate informa-tion from several sources.
Personal and entertaining communication not restricted to the place or de-vices will increase.
Personification
Healthy diets are based on personal taste and health needs.
Personal guidance solutions direct food choices according to personal risks and physiology. Culture and values of the individual are also important food choice criteria.
Personal tuning of fresh food portions will be increasingly possible in shops and on-the-go.
Taking the visions of the different subareas together, the vision for the whole roadmap was formulated as “Well-being through eating”. Individual foods make up one’s diet, and the diet is the basis of nutrition. Intelligent nutrition is based on choices of foods and meals which bring multiple values to the con-sumer – pleasure for the senses and for fulfilling one’s values, as well as long-term health benefits through minimising risks of diseases. In the modern society, offering intelligent nutrition solutions means, in addition to development of the food production systems, also development of the delivery, communication and personalization services matching the needs of urban consumers. This opens up a range of new business opportunities.
Well-being through eating Producing, delivering and consuming the right types of foods maintain health, enhance quality of life and contribute to sustainable environment.

10. Opportunities
88
10. Opportunities During the roadmap process, various fields were identified in which there is place and need for new innovations to improve food supply and to facilitate healthy eating. The rationale behind the elements of intelligent nutrition systems, enabling development of various applications, is shown in Figure 17.
ICT
COMMUNICATIONSERVICES
PACKAGE &DELIVERY
Packagingtechniques
+
HealtheffectsHealtheffects
+FOOD
Sensoryquality
INTELLIGENTNUTRITIONSYSTEMS
=
Sustaina-bility
Sustaina-bility
Product related informationProduct related information
Nutritionalquality
Figure 17. Rationale and elements for intelligent nutrition systems.
Technologies for the development of the intrinsic properties of the food product itself are the core of the system, starting from high quality raw materials, under-standing process-induced transformations and their relation to product quality, such as sensory and nutritional quality. Modern bioprocessing, i.e. the exploita-tion of intrinsic or added enzymes and microbial fermentation, offers plenty of opportunities to design specific product properties, and also for boosting of en-ergy and raw material efficiency. Revealing of the physiological responses in humans and subsequent health effects is facilitated by the rapid developments of nutritional systems biology. The health phenotype of a human being is defined by the genetic background and its interaction with the dietary signals, which may be revealed by transciptomic and metabolomic analyses.

10. Opportunities
89
Both control and design of the production chain and the research in the area of health effects produce plenty of interesting and relevant information to the con-sumer. Capitalizing on this information, as well as design of convenient and experience-giving packaging and delivery systems, is another large opportunity. Development of new packaging materials and ubiquitous ICT offer potential for new innovations in this respect. Another opportunity of ICT is to educate the con-sumer to realise the benefits of healthy eating by diagnostic and monitoring tools.
These opportunities have led VTT to start the Nutritech innovation pro-gramme in 2010. It builds on the three-year programme with University of Ku-opio (starting from January 1st 2010 as a University of Eastern Finland). The Nutritech programme will also in the future benefit from strategic partnership with University of Eastern Finland in the area of human nutrition and nutrition physiology.
The Nutritech innovation programme consists of three research themes (Figure 18). The enabling theme “Health effects” explores the health effects and physio-logical mechanisms of foods and diets, with the aim to understand food digesti-bility, gastrointestinal bioconversions and their effects at various levels of physi-ology. The skills in VTT Systems biology (http://sysbio.vtt.fi/) offer a good plat-form for these studies, as well as the gastrointestinal in vitro models and meth-odology for detection of gastrointestinal microbiota dynamics. A separate VTT Systems Biology Roadmap has been made about the applications of systems biology. The “Health effects” theme interacts with the two other themes “Food solutions” and “Consumer behaviour” which translate the know-how about health effects to foods and ingredients, or to services, packages and diagnostic tools facilitating choice of foods improving well-being.

10. Opportunities
90
Health & well-being through eating
FOOD SOLUTIONS
Enzyme and microbial technologies
Hybrid processesIngredient functionality Structure and flavour
engineering
CONSUMERBEHAVIOUR
Food choice patternsPrinted intelligence
eNutritionPersonalized nutrition
servicesHEALTH EFFECTS
Clinical interventionsNutritional systems biology
Nutrient signalling Digestibility and
bioavailability
Figure 18. The three research themes of the Nutritech innovation programme.
“Food solutions” theme develops ingredients and foods with good nutritional profile, controlled digestibility and high technological quality, such as sensory quality and stability. The search for new enzymatic tools and microorganisms is part of this theme, as well as the development of controlled bioprocesses and understanding of changes of food matrix in relation to processing. Opportunities in this theme include hybrid processing, i.e. combining of bioprocessing tools with thermo-mechanical processing, structure and flavour engineering, new frac-tionation processes for plant-based ingredients and controlled release techniques.
The theme “Consumer behaviour” aims at delivering new ways of communi-cation, motivation and education to help people choose foods and diets promot-ing their well-being. In this area, the developing printing technologies offer in-teresting opportunities for new ways of communication in food packages. One of the VTT’s spearhead programs – Centre for Printed Intelligence CPI (http://www.vtt.fi/proj/cpi/index.jsp?lang=en) - has already several years devel-oped generic new technologies in this field, offering thus technology basis also

10. Opportunities
91
for food-related innovations. The innovation programme Technologies for Health (http://www.vtt.fi/research/innovation_health.jsp) aims to develop the technologies for personalized health and well being, with special emphasis on predictive markers, novel diagnostics and new business opportunities. A road-map of opportunities in service business in different industrial sectors has just been published (Vähä et al. 2009). VTT thus offers a good interdisciplinary en-vironment to develop tools for personalised nutrition.

92
Acknowledgements The participants of the three workshops and the January 2009 seminar are ac-knowledged for the valuable work for the roadmap. In addition, the speakers of the January 2009 seminar, Hannu Mykkänen, professor in Nutrition at the De-partment of Clinical Nutrition in University of Kuopio, and Dr. Johanna Mäkelä, research manager of national consumer research centre, are acknowledged.

93
References Aarne, M (ed.) DEHKO proceeds. Strategic plan for 2008–2010.
Anderson, R., Mikuliç, B., Vermeylen, G., Lyly-Yrjanainen, M. & Zigante, V. 2009. Second European Quality of Life Survey – Overview, Report. 108 p.
BI future convenience, 2008. Business Insights, Future Convenience Food and Drinks.
BI top 10 companies, 2009. Business Insights, Top 10 Food and Drinks Companies – Emerging opportunities, growth strategies and innovation in the leading players.
BI Top 10 Ingredients Companies, 2007. The Top 10 Food and Drinks Ingredients Com-panies – Emerging opportunities, growth strategies and innovation in the leading players, By Gravitie Limited, 2007, Business Insights.
Bird, A. 2007. Perceptions of epigenetics. Nature 447, 396–398.
Brunsø, K. & Grunert, K.G. 1998. Cross-cultural similarities and differences in shopping for food. Journal of Business Research 42, 145–150.
Bush, R.K. & Hefle, S.L. 1996. Food allergens. Critical Reviews in Food Science and Nutrition 36 (Suppl), S119–163.
Chao, A., Thun, M.J., Connell, C.J., McCullough, M.L., Jacobs, E.J., Flanders, W.D., Rodriguez, C., Sinha, R. & Calle, E.E. 2005. Meat consumption and risk of colo-rectal cancer. The Journal of the American Medical Association 293, 172–82.
CIAA, 2007. Data & trends of the European Food and Drink Industry, http://www.ciaa.eu.
CIAA, 2008. Data & Trends of the European Food and Drink industry, http://www.ciaa.eu.
Daily Consumer Goods, 2005–2006. Daily Consumer Goods Trade 2005–2006, a Finnish Food Marketing Association publication.
de Boer, M., McCarthy, M., Cowan, C. & Ryan, I. 2004. The influence of lifestyle charac-teristics and beliefs about convenience food on the demand for convenience foods in the Irish market. Food Quality and Preference 15, 155.
Dehko, 2009. http://www.diabetes.fi/index.php?lk_id=2.
Diabeteksen kustannukset Suomessa 1998–2007, DEHKO 2000–2010, ISBN 978-952-486-082-6.
EFSA, FAQ, 2009. http://www.efsa.europa.eu/EFSA/efsa_locale-1178620753812_1211 902944107.htm.

94
EFSA Europa, 2009; http://www.efsa.europa.eu/EFSA/efsa_locale-1178620753812_1211 902778363.htm.
EFSA recommendations, 2009. http://www.efsa.europa.eu/EFSA/efsa_locale-117862075 3812_1211902778363.htm.
ETL tilastot, 2008. http://www.etl.fi/www/fi/tilastot/rakennetilastot.php, http://www.etl.fi/www/fi/ tilastot/kotimaa.php, http://www.etl.fi/www/fi/tilastot/vienti-_ja_tuontitilastot.php, http://www.etl.fi/www/fi/tilastot/muut_tilastot.php.
ETP Food for Life, CIAA 2005. European Technology Platform on Food for Life – The vision for 2020 and beyond. http://etp.ciaa.be/documents/BAT%20Brochure% 20ETP.pdf.
ETP Food for Life, CIAA 2007. European Technology Platform on Food for Life – Strategic Research Agenda 2007–2020, http://etp.ciaa.eu/documents/CIAA-ETP%20 broch_LR.pdf.
ETP Food for Life, CIAA 2008. European Technology Platform on Food for Life – Imple-mentation Action Plan, http://www.ciaa.eu/documents/brochures/Broch%20ETP_ IAPlan_1.pdf.
EU regulation 1924/2006;.REGULATION (EC) No 1924/2006 OF THE EUROPEAN PARLIAMENT AND OF THE COUNCIL of 20 December 2006 on nutrition and health claims made on foods, Official Journal of the European Union L 404 of 30 December 2006.
Europa Legislation, 2005. http://europa.eu/legislation_summaries/public_health/health_ determinants_lifestyle/c11542b_en.htm.
European Platform for Action on Diet, Physical Activity and Health http://ec.europa.eu/health/ph_determinants/life_style/nutrition/platform/platform_en.htm.
FAO Report, 2002; Urban Food Distribution in Europe, “Food into Cities” Collection DT/61-02E Food and Agriculture Organization of the United Nations Rome, 2002.
FDA, 2003. Claims that can be made for conventional foods & dietary supplements, 2003, http://www.fda.gov/Food/LabelingNutrition/LabelClaims/ucm111447.htm.
Felicity, A., 2008. Future food and drink packaging, Business Insights.
Feinberg, A.P. 2007. Phenotypic plasticity and the epigenetics of human disease. Nature 447, 433–440.

95
FINDIET 2002. 2003. Männistö, S., Ovaskainen, M.-L. & Valsta L. (eds.). Finravinto 2002 -tutkimus. The National FINDIET 2002 Study. Kansanterveyslaitoksen julkaisuja B3/2003. Helsinki 2003. http://www.ktl.fi/portal/2920.
FINDIET 2007. 2008. Paturi, M., Tapanainen, H., Reinivuo, H. & Pietinen, P. (eds.) Fin-ravinto 2007 -tutkimus – The National FINDIET 2007 Survey, Kansanterveyslai-toksen julkaisuja, B23/2008, Helsinki 2008. http://www.ktl.fi/portal/2920.
Finnish Cancer Registry, 2007. http://www.cancerregistry.fi/tilastot/JID13.html.
Finnish dietary recommendations, 2005, Suomalaiset ravitsemussuositukset, 2005. Suo-malaiset ravitsemussuositukset Valtion Ravitsemusneuvottelukunta. http://wwwb.mmm.fi/ravitsemusneuvottelukunta/FIN11112005.pdf.
Forest industry, 2009. http://www.forestindustry.fi.
Global Packaging Industry Report, SPG media Group, 2003. http://www.economywatch.com/world-industries/packaging/report.html.
Gruenwald, J. 2008. Future Functional Ingredients Novel applications, emerging R&D and new product opportunities, Business Insights.
Grunert, K.G. 2006. Future trends and consumer lifestyles with regard to meat consumption. Meat Science. 74, 149–160.
Grunert, K.G., Brunsø, K., Bredahl, L. & Bech, A.C. 2001. Food-related lifestyle: a segmenta-tion approach to European food consumers. In: Frewer, L.J., Risvik, E., Schiffer-stein, H.N.J. & Alvensleben R. von (eds.). Food, people and society: A European perspective of consumers’ food choices. London: Springer Verlag. Pp. 211–230.
Haahtela, T., von Hertzen, L., Mäkelä, M. & Hannuksela, M. 2008. The allergy pro-gramme working group. Finnish allergy programme 2008–2018 – time to act and change the course. Allergy 63, 634–645.
Hare, N.D. & Fasano, MB. 2008. Clinical manifestations of food allergy: differentiating true allergy from food intolerance. Postgraduate Medicine 120:2, E1–5.
Hoppu, U., Kujala, J., Lehtisalo, J., Tapanainen, H. & Pietinen. P. (eds.). 2008. Nutrition and well-being of secondary school pupils. Situation at baseline and results of the intervention study during academic year 2007–2008 – Publications of the National Public Health Institute, B30/2008, Helsinki.
Hu, G., Lindström, J., Jousilahti, P., Peltonen, M., Sjöberg, L., Kaaja, R., Sundvall, J. & Tuomilehto J. 2008. The increasing prevalence of metabolic syndrome among

96
Finnish men and women over a decade. Journal of Clinical Endocrinology & Me-tabolism 93:3, 832–836.
Ikääntyneen ravitsemus, 2002. Ikääntyneen ravitsemus ja erityisruokavaliot, RTY 2002.
iRAP, 2009. http://www.prlog.org/10288107-global-market-for-nanoenabled-food-and-beverage-packaging-to-cross-7-billion-by-2014.pdf.
Jagger, C., Gillies, C., Moscone, F., Cambois, E., Van Oyen, H., Nusselder, W., Robine, J.-M. & the EHLEIS team, 2008. Inequalities in healthy life years in the 25 countries of the European Union in 2005: a cross-national meta-regression analysis. Lancet 372, 2124–2131. http://www.thelancet.com.
Kangas, T. 2002. Diabeetikkojen terveyspalvelut ja niiden kustannukset [The consump-tion and direct costs of health care services among persons with diabetes in Helsinki]. Studies in Social Security and Health 67, KELA.
Koponen, P. & Aromaa, A. 2005. Suomalaisten terveys kansainvälisessä vertailussa. http://www.terveyskirjasto.fi/terveyskirjasto/tk.koti?p_teos=suo&p_artikkeli=suo00044 (20.11.2009).
Kumar, R. 2008. Epidemiology and risk factors for the development of food allergy. Pediatric Annals 37, 552–558.
Kiiskinen, U., Vehko, T., Matikainen, K., Natunen, S. & Aromaa, A. 2008. Terveyden edistämisen mahdollisuudet. Vaikuttavuus ja kustannusvaikuttavuus. STM Jul-kaisuja,1.
Kirveennummi, A., Saarimaa, R. & Mäkelä, J., 2008. Syödään leväpullia pimeässä - Tähtikar-tastoja suomalaisten ruoan kulutukseen vuonna 2030, Tulevaisuuden tutkimuskes-kuksen julkaisuja, ISBN 978-951-564-553-1.
Kyttälä, P., Ovaskainen, M., Kronberg-Kippila, C., Erkkola, M., Tapanainen, H., Tuokkola, J., Veijola, R., Simell, O., Knip, M. & Virtanen, S.-M. 2008. The Diet of Finnish Pre-schoolers, Publications of the National Public Health Institute, B32, Helsinki.
Lack, G. 2008. Epidemiologic risks for food allergy. Journal of Allergy and Clinical Immu-nology 121, 1331–1336.
Lahti-Koski, M., Seppänen-Nuijten, E., Männistö, S., Härkänen, T., Rissanen, H., Knekt, P., Rissanen, A. & Heliövaara, M. 2009. Twenty-year changes in the prevalence of obesity among Finnish adults., Obesity Reviews, in press (2009 Oct 27), doi: 10.1111/j.1467-789X.2009.00681.x.

97
Lindström, J., Ilanne-Parikka, P. & Peltonen, M. 2006a. Sustained reduction in the inci-dence of type 2 diabetes by lifestyle intervention: follow-up of the Finnish Diabe-tes Prevention Study. Lancet 368, 1673–1679.
Lindström, J., Peltonen, M., Eriksson, J.G., Louheranta, A., Fogelholm, M., Uusitupa, M. & Tuomilehto, J. 2006b. High-fibre, low-fat diet predicts long-term weight loss and decreased type 2 diabetes risk: the Finnish Diabetes Prevention Study. Diabetologia 49, 912–920.
Marchant, J. 2006. Innovations in Diagnostics – Next generation molecular and point-of-care diagnostics driving personalized healthcare, Business Insights.
Mariani, M. 2007. Sustainable agri-food supply chains and systems, Preparatory Document of the WT35, Forum China-Europe, RIST-ECO, http://creativecommons.org/ licenses/by-nd/2.0/fr/deed.fr.
Nano-packaging, 2009. Nano-enabled Packaging For The Food And Beverage Industry – A Global Technology, Industry And Market Analysis, 124 Pages – Pub ID: IRAP2492726. Innovative Research and Products (iRAP), Inc.
Nesse, R.M. 2005. Natural section and the elusiveness of happiness. In: Nettle, D. 2005. The Science Behind Your Smile. Oxford University Press. Oxford.
Becker, W., Lyhne, N., Pedersen, A.N., Aro, A., Fogelholm, M., Thorsdottir, I., Alexander, J., Anderssen, S.A., Meltzer, H.M., Pedersen, J.I.. 2004. Nordic Nutrition Rec-ommendations 2004 – integrating nutrition and physical activity. Scandinavian Journal of Nutrition 48, 178–187.
NutraIngredients-USA.com. 2009. http://www.nutraingredients-usa.com/feature/news-by-month/09/2009.
Orešič M., Simell, S., Sysi-Aho, M., Näntö-Salonen, K., Seppänen-Laakso, T., Parikka, V., Katajamaa, M., Hekkala, A., Mattila, I., Keskinen, P., Yetukuri, L., Reinikainen, A., Lähde, J., Suortti, T., Hakalax, J., Simell, T., Hyöty, H., Veijola, R., Ilonen, J., Lahesmaa, R., Knip, M. & Simell, O. 2008. Dysregulation of lipid and amino acid metabolism precedes islet autoimmunity in children who later progress to type 1 diabetes. The Journal of Experimental Medicine 205:13, 2975–2984.
Ottelin, A.-M. 2004. Ravitsemushoidon kustannusvaikuttavuus – taloudellinen arviointi kansansairauksien ehkäisyssä ja hoidossa. Teknologiakatsaus 153, Tekes.
Ottelin, A.-M., Poutanen, K., Lapveteläinen, A., Kantanen, T., Keinänen, A.-R., Saarela, A.-M., & Rissanen, R. 2006. Kansainväliset kauppaketjut välittävät ravitsemustietoa asiakkailleen aktiivisesti. Kehittyvä Elintarvike 17:2, 26–27.

98
Peltonen, M., Harald, K., Männistö, S., Saarikoski, L., Peltomäki, P., Lund, L, Sundvall, J., Juolevi, A., Laatikainen, T., Aldén-Nieminen, H., Luoto, R., Jousilahti, P., Salo-maa, V., Taimi, M. & Vartiainen E. 2007. The National FINRISK Study. Publica-tions of the National Public Health Institute, B34/2008.
Poutanen, K., Kolehmainen, M. & Törrönen, R. 2007. Nutrigenetiikan kaupalliset sovel-lukset – kohti personoitua ravitsemusta? Bolus 2/2007, 24–26.
Prentice, A. 2004. Diet, nutrition and the prevention of osteoporosis, Public Health Nutrition, 7, 227–243.
Public Health Action Programme 2003–2008. http://ec.europa.eu/health/ph_programme/ programme_en.htm.
Reunanen, A., Kangas, T., Martikainen, J., Klaukka, T. 2000. Nationwide survey of co-morbidity, use and costs of all medications in Finnish diabetic individuals. Diabe-tes Care 23, 1265–1271.
Robertson, A. 2002. WHO European Food & Nutrition Action Plan. Heart Matters, 6, http://www.ehnheart.org.
Rona, R.J., Keil, T., Summers, C., Gislason, D., Zuidmeed, L., Sodergre E, Sigurdardottis, S.T., Lindner, T., Goldhahn, K., Dahlstrom, J., McBride, D. & Madsen, C. 2007. The prevalence of food allergy: a meta-analysis. Journal of Allergy and Clinical Im-munology 120, 638–646.
Ross, S.A. Dwyer, J., Umar, A., Kagan, J., Verma, M. & Dunn, B.K. 2008. Introduction: diet, epigenetic events and cancer prevention. Nutrition Reviews 66, S1–S6.
Shimizu, T. 2003. Health claims and scientific substantiation of functional foods – Japanese sys-tem aiming the global standard. Current Topics in Nutraceutical Research 1:2, 1–12.
Sitra ERA report. 2006. Food and nutrition sector strategy report by Finnish Food and Drink Industries’ Federation: Finland – a competitive forerunner in healthy nutri-tion. Uusikylä, M. (ed.). ISBN 951-563-532-3. http://www.sitra.fi.
Statistics Finland. 2009. www.tilastokeskus.fi (20.11.2009).
Suominen, M. 2007. Nutrition and nutritional care of elderly people in Finnish nursing homes and hospitals. PhD Thesis, Department of Applied Chemistry and Micro-biology (Nutrition) and Department of General Practice and Primary Health Care, University of Helsinki, Finland.
Supplement Business Report. 2009. 2009 Supplement Business Report, Nutrition Busi-ness Journal, 498 Pages – Pub ID: NUT2476114.

99
Tallon, M.J. 2007. The Dietary Supplements Market Outlook – The impact of changes in regulation, demographics and consumer trends, Business Insights.
Taylor, S.L., Hefle, S.L. & Munoz-Furlong, A. 1999. Nutrition and the life cycle: Food allergies and avoidance diet. Today 34:1, 15–22.
The EFSA Journal, 2007. 530, 1–44.
Tuomilehto, J., Lindström, J., Eriksson, J.G., Valle, T.T., Hämäläinen, H., Ilanne-Parikka, P., Keinänen-Kiukaanniemi, S., Laakso, M., Louheranta, A., Rastas, M., Salminen, V. & Uusitupa, M. 2001. Finnish Diabetes Prevention Study Group. Prevention of type 2 diabetes mellitus by changes in lifestyle among subjects with impaired glucose tolerance. The New England Journal of Medicine 344, 1343–1350.
USDA 2005, http://www.mypyramid.com.
Uusitupa M. 2001. Liikunta ja ruokavalio ovat metabolisen oireyhtymän täsmähoitoa. Duodecim 117, 621–630.
WHO European Region 2000–2005. The First Action Plan for Food and Nutrition Policy. Nutrition and Food Security Programme, Division of Technical Support and Stra-tegic Development.
WHO mediacentre, 2009. http://www.who.int/mediacentre/factsheets/fs311/en/index.html.
WHO diabetes, 2009. http://www.who.int/diabetes/en/.
WHO cancer, 2009. http://www.who.int/cancer/en/.
WHO Technical Report series 916, 2003. Diet, nutrition and the prevention of chronic diseases. Report of a joint WHO/FAO expert consultation.
Packaging Research, 2007. Packaging Research: Background to Packaging, http://www.iapriweb.org/packaging_research.html.
WPO, 2005. WPO promotes packaging – Packaging Gateway. http://www.packaging-gateway.com/features/feature14/.
Vähä, P., Kettunen, J., Ryynänen, T., Halonen, M., Myllyoja, J., Kokkala, M., Antikainen, M. & Kaikkonen, J. Palvelut muokkaavat kaikkia toimialoja. Palveluliiketoiminnan toimialakohtaiset tiekartat. [Services are shaping all industries. Industry specific roadmaps for service business]. Espoo 2009. VTT Tiedotteita – Research Notes 2508. 113 s. + liitt. 13 s. http://www.vtt.fi/inf/pdf/tiedotteet/2009/T2508.pdf.
Winell, K. & Reunanen, A. 2005. Diabetes Barometer. http://www.diabetes.fi/tiedoston_ katsominen.php?dok_id=560.


A1
Appendix A: Picture of the Nutritech roadmap tree
Pers
onificat
ion
Com
Conv
enienc
e
Value
s &
comm
unality
nica
tion
mu
Physio
logica
lfunctionality
Pers
onificat
ion
Com
Conv
enienc
e
Value
s &
comm
unality
nica
tion
mu
Physio
logica
lfunctionality
Aug
men
ted
real
ity
Age
ing
Hea
lthc
are
cost
sSust
aina
bilit
yCu
ltur
al m
ixin
gU
biqu
itou
s IC
TIn
form
atio
n fl
owIn
divi
dual
ism
Hea
lth
and
wellb
eing
thro
ugh
eati
ng
Environmentðic
s
Eati
ng t
oget
her
Elderly
Child
renadolesc.
&
Look
ing
good
Rewa
rd
Snackin
g
On-the
-go
Good
&qu
ick
Home a
lone
Non-hunger
eating
Obe
sity
Gut-
brainaxis
Prev
enti
onFood-
inter
actio
ns
Nee
d to
kno
w
Spec
ial g
roup
s
Diet lim
itatio
nsGuid
ance
Men
tal r
espo
nses
Guara
ntee
d
quality information
Tech
pus
h
Cons
umer
empo
wermen
tIn
form
ativ
em
arke
ting
Soci
alm
edia
Prin
ted
inte
llige
nce
Inte
grat
edin
d., t
rade
& n
utr.
data
base
s
Beha
vior
alsc
ienc
e&
user
ori
enta
tion
Supp
ort
from
heal
thca
re s
yste
m
Mob
ile t
echTa
gs
Cont
rolle
dde
liv.
Dia
gnos
tics
(lab)
Nut
rige
nom
ics
Hos
t-di
et-
mic
robi
ota
inte
ract
ions
Ethi
cs o
f fo
odpr
oduc
tion
cha
in
Targ
et
sear
ch
Polit
ical
will
Food
&pa
ck t
ech
Soci
alm
edia
Educ
atio
n &
chan
ge o
f he
art
ICT
Food
&
pack
tec
hN
utri
tion
&co
nsum
er r
esea
rch
Soci
al
med
ia
Mob
ilete
ch
Prin
ted
inte
llige
nce
Colla
bora
tion
: nut
riti
onis
ts,
Indu
stry
, ret
ail,
HO
RECA
Del
iver
y ch
ain
build
ing
Nat
ural
pr
oces
sing
Poin
t-of
-Act
ion
proc
essi
ng
Rein
vent
ing
trad
itio
nal f
ood
In s
itu
proc
essi
ng
Reso
urce
in
tens
ive
proc
essi
ng
Food
tec
h
Logi
stic
sBio-
chem
ical
gast
rono
my
Mul
tidi
sc.
rese
arch
Inte
llig.
orde
ring
syst
ems
Inte
llig.
orde
ring
syst
ems
Packag
ingconcep
ts
Packag
ingconcep
ts
Hyb
rid
prod
ucts
Hyb
rid
prod
ucts
Appe
aling
scho
ol
cate
ring
Appe
aling
scho
ol
cate
ring
Cate
ring
with
soc
.ga
ther
ing
Cate
ring
with
soc
.ga
ther
ing
Polit
ical
stee
ring
Polit
ical
stee
ring
Func.
Ingre-
dients
Func.
Ingre-
dients
Pers
onal
reco
mmen
-
datio
nsPe
rson
al
reco
mmen
-
datio
ns
Pers
onal
reco
mmen
d-
ations
Pers
onal
reco
mmen
d-
ations
Digita
lea
ting
scho
ol
Digita
lea
ting
scho
ol
Nut
rition
recipe
s in
health
care
Nut
rition
recipe
s in
health
care
Digi-inf
oin f
ood
pack
s
Digi-inf
oin f
ood
pack
s
Info
filters
Info
filters
Cumu
lativ
e
ener
gy
calculat
orCu
mulativ
e
ener
gy
calculat
or
Diet
acc.
to p
erso
nal
prof
ileDiet
acc.
to p
erso
nal
prof
ile
Targeted
selec
tion
service
sTa
rgeted
selec
tion
service
s
Low-
cal
fille
rsLo
w-ca
l
fille
rsFr
esh
food
taxi
Fres
hfo
odta
xiQua
lity
cate
ring
Qua
lity
cate
ring
Sustain.
pack
aging
Sustain.
pack
aging
Mob
ile
mot
ivat
ion&
feed
back
Mob
ile
mot
ivat
ion&
feed
back
Certi-
ficat
ion
Certi-
ficat
ion
My
welln
ess
men
u
My
welln
ess
men
uSe
lf-
mon
itor
ing
device
sSe
lf-
mon
itor
ing
device
s
drug
Tailo
red
diet
s with
medica
tion
Tailo
red
diet
s with
medica
tion
Risk
fact
ors
Nut
r.PO
C diag
.to
ols
Nut
r.PO
C diag
.to
ols


Series title, number and report code of publication VTT Research Notes 2514 VTT-TIED-2514
Author(s) Emilia Selinheimo, Maria Saarela, Minna Halonen, Raija Koivisto, Aimo Tiilikainen, Marika Lyly, Jarno Mikkonen, Pekka Lehtinen, Mirja Mokkila, Anu Kaukovirta-Norja & Kaisa Poutanen
Title
Solutions for intelligent nutrition Nutritech roadmap Abstract The objective of the Nutritech roadmap was to feature drivers, needs and future potential for various actors involved in the food production, distribution chain, and communication services. Seven general drivers influencing the challenges and needs of stakeholders in the area of food, nutrition and eating patterns were first identified: healthcare costs, sustainability, ubiquitous ICT, information flow, ageing, cultural mixing and individualism. Then five themes, Conven-ience, Values and communality, Physiological functionality, Communication and Personification, were defined in mul-tidisciplinary workshops. The themes were discussed in a view of nutrition and eating habits. Based on the formulated visions of these five themes, various fields in which there is a need for innovations to improve food supply and to facili-tate healthy eating were identified. Development of technologies to produce new healthy foods is the core of the sys-tem. Modern exploitation of enzymes and microbial fermentation offers plenty of opportunities to design specific prod-uct properties, and also for boosting of energy and raw material efficiency. Revealing of the physiological responses in humans and subsequent health effects is facilitated by the rapid developments of nutritional systems biology. Both control and design of the production chain and the research in the area of health effects produce plenty of interesting information to the consumer. Capitalizing on this information and design of convenient and experience-giving packag-ing and delivery systems is a large opportunity. Development of new packaging materials and ubiquitous ICT offer potential for innovations in this respect. ICT may also help to educate consumers to realise the benefits of healthy eating by diagnostic and monitoring tools. The vision for Nutritech roadmap was formulated as “Well-being through eating”. Producing, delivering and con-suming the right types of foods maintain health, enhance quality of life and contribute to sustainable environment. Intelligent nutrition is based on choices of foods and meals which bring multiple values to the consumer: pleasure for the senses, fulfilment of values, and benefits for health. In the modern society, intelligent nutrition solutions means, in addition to development of food production systems, also development of delivery, communication and personalization services for the needs of urban consumers. This opens up a range of new business opportunities. This roadmap will serve as a starting point for the VTT Innovation Programme “Solutions for Intelligent Nutrition”, where the aim is to develop technologies and services enabling to achieve well-being through eating.
ISBN 978-951-38-7542-8 (soft back ed.) 978-951-38-7543-5 (URL: http://www.vtt.fi/publications/index.jsp)
Series title and ISSN Project number VTT Tiedotteita – Research Notes 1235-0605 (soft back ed.) 1455-0865 (URL: http://www.vtt.fi/publications/index.jsp)
34237
Date Language Pages December 2009 English 99 p. + app. 1 p.
Name of project Commissioned by Nutritech
Keywords Publisher Food, nutrition, health, well-being, consumer, service
VTT Technical Research Centre of Finland P. O. Box 1000, FI-02044 VTT, Finland Phone internat. +358 20 722 4520 Fax +358 20 722 4374

• • • VTT RESEA
RC
H N
OTES 2514
SOlu
TiON
S fOR
iNTEllig
ENT N
uTR
iTiON
ISBN 978-951-38-7542-8 (soft back ed.) ISBN 978-951-38-7543-5 (URL: http://www.vtt.fi/publications/index.jsp)ISSN 1235-0605 (soft back ed.) ISSN 1455-0865 (URL: http://www.vtt.fi/publications/index.jsp)
This report describes the roadmap of the VTT Innovation Programme Solutions for Intelligent Nutrition, “Nutritech”. It includes descriptions of the actors and operational environment as well as the roadmap process and the identified five themes: Convenience, Values and communality, Physiological functionality, Communication and Personification. The overall vision of Nutritech was formulated as Well-being through eating; producing, delivering and consuming the right types of foods maintain health, enhance quality of life and contribute to sustainable environment. Opportunities for future research are featured in the report.
VTT CREATES BuSiNESS fROM TECHNOlOgY Technology and market foresight • Strategic research • Product and service development • iPR and licensing • Assessments, testing, inspection, certification • Technology and innovation management • Technology partnership