Solution Space Screening of a Hypersonic Endurance ...
26
Proceedings of the 2013 ASEE Gulf-Southwest Annual Conference, The University of Texas at Arlington, March 21 – 23, 2013. Copyright 2013, American Society for Engineering Education Saturday Morning Session 1 - Student Solution Space Screening of a Hypersonic Endurance Demonstrator Amit Oza, Gary Coleman, Lex Gonzalez, Bernd Chudoba Mechanical and Aerospace Engineering Department University of Texas at Arlington Paul Czysz Hypertech Concepts LLC St. Louis, MO Abstract The Solution Space Screening for a Hypersonic Endurance Demonstrator program was a two and one-half month study to: Demonstrate the Aerospace Vehicle Design (AVD) Laboratory sizing process applied to a fast turnaround project by using a dedicated knowledge-harvesting approach coupled with a unique sizing methodology to represent the first step in the conceptual design phase. Identify and visualize the solution space available for a hypersonic endurance (20 to 30 min) demonstrator that employs an air-breathing propulsion system. Propose prospective baseline vehicle(s) based on (1) available industry capability and (2) high-priority research (technology) required. Demonstrate a best-practice product development and technology forecasting environment that integrates the key team members, including (1) manager (decision maker), (2) synthesis specialist (integrator), and (3) technologist (disciplinary researcher). In an effort to increase the air-breathing endurance capability of current hypersonic research aircraft (i.e., X-43, 7 seconds; X-51, 5 minutes), the NASA Langley Research Center (LaRC) Vehicle Analysis Branch (VAB) has tasked the Aerospace Vehicle Design (AVD) Laboratory at the University of Texas Arlington (UTA) with exploring the technical and operational solution space for a 20 minute to 30 minute cruise endurance demonstrator operating at Mach 6 to Mach 8. The primary challenge has been to explore that portion of the available industry capability that will require future technology complementation, with the aim of arriving at a technically feasible demonstrator within a given time frame and
Transcript of Solution Space Screening of a Hypersonic Endurance ...

Proceedings of the 2013 ASEE Gulf-Southwest Annual Conference,
The University of Texas at Arlington, March 21 – 23, 2013.
Copyright 2013, American Society for Engineering Education
Saturday Morning Session 1 - Student
Solution Space Screening of a Hypersonic Endurance Demonstrator
Amit Oza, Gary Coleman, Lex Gonzalez, Bernd Chudoba
Mechanical and Aerospace Engineering Department
University of Texas at Arlington
Paul Czysz
Hypertech Concepts LLC
St. Louis, MO
Abstract
The Solution Space Screening for a Hypersonic Endurance Demonstrator program was a
two and one-half month study to:
Demonstrate the Aerospace Vehicle Design (AVD) Laboratory sizing process applied to a
fast turnaround project by using a dedicated knowledge-harvesting approach coupled
with a unique sizing methodology to represent the first step in the conceptual design
phase.
Identify and visualize the solution space available for a hypersonic endurance (20 to 30
min) demonstrator that employs an air-breathing propulsion system.
Propose prospective baseline vehicle(s) based on (1) available industry capability and (2)
high-priority research (technology) required.
Demonstrate a best-practice product development and technology forecasting
environment that integrates the key team members, including (1) manager (decision
maker), (2) synthesis specialist (integrator), and (3) technologist (disciplinary researcher).
In an effort to increase the air-breathing endurance capability of current hypersonic
research aircraft (i.e., X-43, 7 seconds; X-51, 5 minutes), the NASA Langley Research Center
(LaRC) Vehicle Analysis Branch (VAB) has tasked the Aerospace Vehicle Design (AVD)
Laboratory at the University of Texas Arlington (UTA) with exploring the technical and
operational solution space for a 20 minute to 30 minute cruise endurance demonstrator
operating at Mach 6 to Mach 8. The primary challenge has been to explore that portion of
the available industry capability that will require future technology complementation, with
the aim of arriving at a technically feasible demonstrator within a given time frame and

Proceedings of the 2013 ASEE Gulf-Southwest Annual Conference,
The University of Texas at Arlington, March 21 – 23, 2013.
Copyright 2013, American Society for Engineering Education
budget. Consequently, this study necessitated the use of a simulation capability to assess and
visualize the physical design drivers and sensitivities of the operational and technical
domain.
The overall goal of the project has been the development of a concept for an airbreathing
hypersonic endurance flight vehicle to increase our existing understanding and
knowledge-base regarding air-breathing propulsion, associated thermal protection systems
(TPS), and any operational peculiarities of long-duration hypersonic flight (e.g.,
maintenance, turnaround, practical range, etc.).
This report introduces the AVD Laboratory’s product development and technology
forecasting methodology as applied to the problem introduced above. Because the focus of
this activity has been on the exploration of the available solution space, a unique screening
process has been employed to assess the implication of (a) the mission, (b) the baseline
vehicle, and (c) the operational scenarios on key research objectives to be defined.
This study concludes that an air-launched, liquid-hydrogen-fueled, 30 minute Mach 6
demonstrator (with 10 minute Mach 8 capability) provides the largest feasible solution space
of the trades that have been examined (i.e., largest design margins with lowest technical risk)
when compared with a kerosene-fueled equivalent.
Mission Requirements and Research Objective
The overall objective of this study is to explore and visualize the technical solution space for a
hypersonic endurance demonstrator.
The NASA VAB operational and technology requirements for this demonstrator are:
scramjet test vehicle
reusable
unmanned
multiple aircraft (at least three test articles)
entry into service circa 2020
To evaluate the technical feasibility of such a research vehicle, the following mission
requirements are selected by NASA VAB:
design speed: Mach 6 to 8 (possibly Mach 12)
maximum endurance: 20 to 30 minutes
payload: test instrumentation
fuel selection: hydrogen or kerosene
operation: straight line or point-to-point
The broad direction specified by VAB in June 2010 translates into a large n-dimensional design
trade space. Please note that the VAB-defined design mission is considered a starting point only,
thus the mission itself is a variable. Since the targeted flight regime is novel terrain for the

Proceedings of the 2013 ASEE Gulf-Southwest Annual Conference,
The University of Texas at Arlington, March 21 – 23, 2013.
Copyright 2013, American Society for Engineering Education
designer, it is essential to trade flight vehicles capable of satisfying alternative missions. Clearly,
the sizing exposure will iteratively enable the designer to define and justify a feasible baseline
mission and baseline vehicle combination.
Figure 1 illustrates the iterative nature of the mission selection process. The unknown-terrain
nature of a 20 to 30 minutes air-breathing demonstrator requires a modification of the
traditionally utilized product development procedures. As shown in this figure, the AVD
Laboratory screening & sizing methodology is the primary tool utilized to arrive at a (a) baseline
mission which harmonizes with (b) the overall research objectives and (c) the baseline vehicle.
The sizing team is tasked to execute alternative missions resulting in prospective baseline
vehicle(s). Throughout the sizing phase, the involved mindsets (managerial (M), synthesis (S),
technology (T)) are successively gaining physical insight into the characteristic of the product.
Consequently, true product understanding is evolving while the solution space alternatives are
perturbed. The mission-trading needs to happen during the parametric sizing (PS) phase, an
essential task before a baseline objectives catalogue can be formally defined. Clearly, the
traditional notion of pre-defining the mission and objectives is not feasible with a product of such
novel characteristics. The screening & sizing approach becomes the enabling means to arrive at a
balanced set of (a) mission, (b) objectives, and (c) baseline vehicle(s).
Due to project time constraints, the present research undertaking excludes the research objectives
Figure 1. Iterative nature of the mission & objectives & baseline vehicle(s) selection process.

Proceedings of the 2013 ASEE Gulf-Southwest Annual Conference,
The University of Texas at Arlington, March 21 – 23, 2013.
Copyright 2013, American Society for Engineering Education
development and matching step. Figure 2 illustrates the finally implemented baseline vehicle
development sequence for the present study by omitting the objectives matching step shown in
Figure 2. It is recommended to formally complement the existing study at a later step by
including the objectives matching logic as an essential ingredient supporting decision-making.
Data-Base and Knowledge-Base Review of Hypersonic Demonstrators
A key component enabling the development of hypersonic flight test vehicles is effective
management of the knowledge-generation and knowledge-preservation activity. As illustrated before,
the research approach implemented places emphasis on elevating the understanding with regards to
project aims and objectives, overall resulting in an informed and structured approach. In the present
context, the research challenge is best formulated with the question: How to efficiently synchronize
the understanding available with the understanding required to specify a feasible air-breathing
hypersonic demonstrator with the technical resources, team support and time available? Due to the
limited timeframe available, the DB and KB assistances have become indispensable to expedite the
learning process.
The scope and complexity of the present research undertaking is seen as catalyst opportunity, which
translates into a chance to evaluate past and present data and knowledge for its utilization in the
context of a technically demanding demonstrator with not seen-before performance capability. Table
Figure 2. VAB/AVD Laboratory baseline vehicle development sequence.

Proceedings of the 2013 ASEE Gulf-Southwest Annual Conference,
The University of Texas at Arlington, March 21 – 23, 2013.
Copyright 2013, American Society for Engineering Education
1 lists high-speed flight vehicles of direct relevance in the context of a future endurance testbed.
The following two sub-chapters present the flight vehicle conceptual design data-base (DB) and
knowledge-base (KB) as developed and utilized for the present research undertaking. The main flight
vehicle research & design work is directly benefitting from this dedicated DB & KB foundation.
Table 1. Past Hypersonic Demonstrator Projects and Programs Start Date End Date Project/Program Organization Description
1952 1968 X-15 North American/NASA/USAF Mach 6 to 8 rocket powered hypersonic research vehicle. 3 test vehicles,
199 flights
1957 1959 Griffon 02 Nord Aviation Manned ramjet demonstrator
1962 1971 D-21 Lockheed Mach 4 ram-jet UAV launched from the SR-71
1964 1965 MHCV Lockheed Manned Hypersonic Cruise Vehicle, some description of a demonstrator
1967 1968 UHTV Vought Universal Hypersonic Test Vehicle, flexible and modular hypersonic test
vehicle
1967 1969 X-15 Delta North American/NASA Delta wing X-15
1969 1970 HYFAC MAC/NASA HYpersonic FACilities study, 32 rocket/air-breather configurations
explored
1969 1969 X-15 SERJ Marquardt Super Charged Ejector Ramjet (RJ) X-15
1969 1969 X-15 Scram Boeing Scramjet (SJ) X-15
1970 1972 IGV MAC/USAF Incremental growth vehicle
1972 1972 PPD Scramjet Test
Vehicle
Propulsion Performance Demonstrator, vertical takeoff cone with four
scramjets around its periphery; rocket acceleration to test speed
1975 1977 X-24C NHFRF Lockheed/NASA National Hypersonic Flight Research Facility, B-52 launched, Mach-4.8
70,000 lbs vehicle; envisioned as a X-15 type flight operation
1976 1980 ASALM Martin Hydrocarbon fuel air-launched cruise missile
1980 1981 SLRV Shuttle Launch Research Vehicle, Mach 8 aerodynamic configuration
demonstrator
1985 1985 RSFTP Ramjet/Scramjet Flight Test Program, M 4-7 F-15 launched vehicle
1989 1990 HYPAC MBB Sänger demonstrator study
1990 1995 BMFT MBB/UK/UT/Dornier/MTU Hypersonic technology program, HYTEX and RADUGA D2
1996 2004 X-43A NASA LaRC/NASA Dryden Scaled hypersonic scramjet demonstrator
1999 1999 SSTO Demonstrator Hyper Tec RBCC hypersonic demonstrators based on HYFAC Studies
1999 1999 Trailblazer NASA Glenn Modification of the NASA wing body to include RBCC and TBCC
2000 2002 X-43B NASA LaRC/NASA Dryden Reusable combined cycle demonstrator
2001 2002 X-43C NASA LaRC/NASA Dryden Hydrocarbon variant of the X-43A, RJ/SJ
2002 Present HYFLY Boeing/DARPA Mach 6 ramjet powered cruise missile demonstrator
2003 Present X-51A Boeing Scramjet propulsion research vehicle
2005 2007 X-43D NASA LaRC/NASA Dryden HYFLITE III, M 12 variant of the X-43A
2007 2007 HyCAUSE DARPA/ADST 2-stage sounding rocket for hypersonic propulsion demonstration
2007 2008 Falcon HTV-3X Lockheed/DARPA TBCC hydrocarbon hypersonic demonstrator
Overall and Reduced Trade Space
The challenge of designing a 20 to 30 minutes hypersonic endurance demonstrator is embodied in the
fundamentally unknown vehicle solution space and solution topography. Based on the best
understanding available at the outset, it is required to define an initial or ‘start’ trade-space by taking
relevant constraints and requirements into account.

Proceedings of the 2013 ASEE Gulf-Southwest Annual Conference,
The University of Texas at Arlington, March 21 – 23, 2013.
Copyright 2013, American Society for Engineering Education
Table 2. Overall Trade-Space Concepts, Categories and Options
CONCEPT/CONFIGURATION CATEGORIES TOTAL TRADE OPTIONS SELECTED TRADES
Mission Concept Mach number and duration design Mach 6 design Mach 6
design Mach 8 design Mach 8
design Mach 12
test duration 0 to 30 minutes
test range options point-to-point point-to-point
fly-back fly-back
Staging Configuration SSTC integrated booster, propellant and oxidizer
tanks
TSTC air launch air launch
expendable booster expendable booster
oxidizer drop tanks
MSTC any combination of TSTC options
Operations Concept launch HTO
VTO
recovery HL
Hardware Concept lift & volume supply lifting body lifting body
wing body
propulsion concept:
(accelerator engine)
RKT RKT
TJ
RBCC
PDE
propulsion concept:
(cruise engine)
SJ
dual mode RJ/SJ dual mode RJ/SJ
RKT
fuel selection hydrogen hydrogen
methane
kerosene kerosene
primary & secondary controls aerodynamic
mix mix
It is to be expected that this initial trade-space, with associated constraints & requirements, will
naturally mature during the configuration exploration phase. The configuration exploration phase is
tasked to identify two primary solution-space areas of significance: (a) the solution space area based
on presently available industry capability, and (b) the solution space area requiring prospective future
technologies. Dependent on the establishment of overall project objectives (technology development,
low-cost & risk demonstrator, etc.), the physical understanding generated will help to refine the
initial trade-space scope.

Proceedings of the 2013 ASEE Gulf-Southwest Annual Conference,
The University of Texas at Arlington, March 21 – 23, 2013.
Copyright 2013, American Society for Engineering Education
Clearly, the early identification of the correct trade-space and technology combinations requires
using logic, organization and transparency before any baseline design can be selected. This approach
will provide the greatest insight into the design problem within the time assigned.
The process of rectifying thus reducing the theoretical trade-space available consists of: (a)
Formulate a classification scheme for the design options available. (b) Focus the DB/KB
development and team learning on relevant design trade-studies. (c) Harmonize pre-selected trades
with VAB’s team’s long-term research objectives.
Table 2 presents the overall trade-space adopted classification scheme addressing (1) mission
concept, (2) staging configuration, (3) operations concept, and (4) hardware concept. If all of the
options shown in this general trade-space Table 2 would be executed, the total number of trades
would exceed 90,000+ cases.
Applying the DB/KB lessons-learned and harmonization with VAB’s research objects further allows
reducing and focusing the trade-space:
1. Mission Concepts: Mach 6 and Mach 8 design trades are given priority; point to point and
fly-back options are explored. Mach 12 has been eliminated.
2. Staging Configurations and Operational Concepts: HyFAC (Reference 3) determined that
air-launch and vertical take-off provide the largest research value for a hypersonic
demonstrator relative to horizontal takeoff and single-stage vehicles. Air-launch and vertical
takeoff with a booster allow for smaller and lighter demonstrators which can focus on testing
the high-speed regime. Consequently, the trades selected will focuse on air-launch and
vertical takeoff options.
3. Hardware Concepts: Alternative vehicle concepts have been grouped as follows:
a. Lifting body - for this speed range, the lifting body provides improved volumetric
efficiency over wing bodies; therefore, the lifting body has been selected as the sole
volume supply option (Reference 3, 4).
b. Off-the-shelf accelerator rocket – the off-the-shelf rocket motor (low risk item) is
selected to accelerate the ramjet to start Mach number.
c. Dual-mode ramjet cruise engine - the dual mode ramjet/scramjet is selected to allow
for testing of both modes with a single vehicle.
d. Fuel selection limited to liquid hydrogen and kerosene - the fuel selection is
determined by the operational vehicle envisioned; for possible reusable TSTC launch
vehicles, hydrogen appears to be the most likely choice. Kerosene appears to be an
operationally practical option for a military hypersonic point-to-point vehicle.
Consequently, both options (hydrogen and kerosene) are explored.

Proceedings of the 2013 ASEE Gulf-Southwest Annual Conference,
The University of Texas at Arlington, March 21 – 23, 2013.
Copyright 2013, American Society for Engineering Education
The above reasoning is reducing the overall trade-space to 10 trade studies, consisting of a constant
test vehicle concept (lifting body, dual mode ramjet/scramjet, horizontal landing) with varying (a)
design Mach number, (b) endurance, and (c) launch concept. The reduced trade-space is introduced
with Table 3 and Figure 3.
MISSION
STAGING
CONFIGURATION
OPERATIONS
CONCEPT
HARDWARE
CONCEPT
Atmospheric
Test Range
Options TSTC Launch Fuel Selection
Trade
#
design
Mach 6
design
Mach 8
test
duration
point-to-
point
air
launch
expendable
booster HTO VTO hydrogen kerosene
dual
fuel
1 x
0 - 30 min x x
x
x
2
x 0 - 30 min x x
x
x
3 x
0 - 30 min x x
x
x
4
x 0 - 30 min x x
x
x
5 x
0 - 30 min x x
x
x
6
x 0 - 30 min x x
x
x
7 x
0 - 30 min x
x
x x
8
x 0 - 30 min x
x
x x
9 x
0 - 30 min x
x
x
x
10
x 0 - 30 min x
x
x
x
For each individual trade study, the total system design solution space is identified and visualized
with the AVD Laboratory parametric sizing program AVDsizing
. This ‘best practice’ sizing
approach has been developed through a thorough review of parametric sizing processes and
methods from the 1960s to present for subsonic to hypersonic vehicles, see Reference 5. With
this framework in place, the available solution space is identified considering both technical and
operational constraints.
Table 3. Summary of Design Trades Executed

Proceedings of the 2013 ASEE Gulf-Southwest Annual Conference,
The University of Texas at Arlington, March 21 – 23, 2013.
Copyright 2013, American Society for Engineering Education
Parametric Sizing and Solution Space Screening
AVD Sizing Process Summary
AVD
sizing is a constant mission sizing process capable of first-order solution space screening of a
wide variety of conventional and unconventional vehicle configurations. Solution space
screening implies an overall focus on visualizing multi-disciplinary design interactions and
trends. AVDsizing
is based on the Hypersonic Convergence sizing approach for transonic to
hypersonic vehicle applications as developed at formerly McDonnell Aircraft Company between
1970 and 1990, see Reference 6. The modular process implemented with AVDsizing
relies upon a
robust disciplinary methods library for analysis and a unique multi-disciplinary analysis (MDA)
sizing logic and software kernel enabling data storage, design iterations, and process
convergence. The integration of the disciplinary methods library and the generic multi-
disciplinary sizing logic enables the consistent evaluation and comparison of radically different
flight vehicles, see References 7, 8. The flight vehicle configuration independent implementation
of AVDsizing
allows for rapid parametric exploration of the complete flight vehicle system via a
convergence check to mission. Figure 4 visualizes the top level sizing process implemented.
At the heart of the process is the weight and balance budget. The results from the geometry,
performance constraint and trajectory modules (weight ratio, required T/W ratio, and vehicle
geometry) are provided to a weight & volume available and required logic. For a given vehicle
Air L
aunch
Expendable
booste
r
Mach 6
Mach 8
Mach 6
Mach 8
Hydrogen Dual Fuel Kerosene
Figure 3. Reduced trade-space explored.

Proceedings of the 2013 ASEE Gulf-Southwest Annual Conference,
The University of Texas at Arlington, March 21 – 23, 2013.
Copyright 2013, American Society for Engineering Education
slenderness parameter , the planform area is iterated through the total design
process until weight & volume available equal weight & volume required.
Disciplinary Methods Library Overview
The following methods are utilized from the disciplinary methods library for this hypersonic
demonstrator study, see Reference 5. The methods selected are of consistent first-order nature,
including empirical, semi-empirical and reduced-order analytical types. Table 4 summarizes the
disciplinary methods used for this study.
DISCIPLINE METHOD TITLE DESCRIPTION REFERENCE
Geometry Planform
Vehicle length, span and spatular width for current
planform area based on constant leading edge sweep and
c/s.
Czysz [6]
Bottom Surface Total volume and dimensions determined from non-
dimensional engine constants. Appendix A
Top Surface
Total volume, dimensions and wetted area computed for a
compound elliptical cross-section. Top surface height
determined from specified slenderness parameter.
Appendix A
AVDsizing
Weight budget: compute OWEw
Volume budget: compute OWEv
Iterate Spln until OWEw and OWEv converge
Iterate for each t specified
Iterate over any independent design
variable
Geometry
Constraint Analysis: T/W=f(W/S)
Trajectory:
ff=f(trajectory,aero,propulsion)
Fundamental Sizing Steps
Sizing LogicOEW esitmationTrajectory
Anlaysis
Convergence
Logic
Constraint
Anlaysis
Constraints
Take-off
Approach
speed
(W/S)TO
Feasible solution
space
Cruise
Aborted Landing OEI
2nd
Segment Climb OEI
Current Design Point
Current (W/S)TO
Required
(T/W)TO
Trajectory
Figure 4. AVDsizing methodology visualized via Nassi-Schneidermann structogram.
Table 4. Summary of Disciplinary Methods

Proceedings of the 2013 ASEE Gulf-Southwest Annual Conference,
The University of Texas at Arlington, March 21 – 23, 2013.
Copyright 2013, American Society for Engineering Education
Aerodynamics Drag Polar
McDonnell-Douglas empirical correlations (circa 1970)
based on vehicle slenderness, frontal area and wetted area
with spatular corrections from Pike.
HyFAC [3]
Pike [10]
Lift-Curve Slope McDonnell-Douglas empirical correlations (circa 1970) of
all-body hypersonic vehicles. HyFAC [3]
Maximum Lift (low speed) FDL-7 wind tunnel data. FDL-7 report
Propulsion Scramjet - Modified 1-D
Cycle Analysis
1-D stream thrust analysis with corrections inlet spillage
drag. RSM from Bradford used for truncated SERN
nozzle performance.
Heiser and Pratt
[12], Bradford
[13]
Ramjet – Marquardt Data Representative data from Marquardt study (circa 1960). Marquardt [14]
Rocket – Pratt & Whitney
Method
Analytic off-design performance estimation of rocket
thrust and Isp based on ideal rocket equation. Czysz [6]
Performance Landing Wing loading requirement for given stall speed and
maximum trimmed lift coefficient. Coleman [5]
Trajectory
2-D energy integration method (altitude and velocity),
constant q trajectory to cruise velocity, cruise climb,
maximum L/D descent.
Appendix A
Stability and Control Trim effects Engine cowl location effect on trim drag. HyFAC [3] Czysz
[6]
Weight and Volume Hypersonic Convergence
Weight and Volume Budget
Empirical weight and volume estimation of structure,
systems, payload and propellant. Appendix A
Description of Solution Space Visualization
The overall product solution space consists of individually converged total flight vehicle design
points. For a fixed vehicle slenderness parameter (τ), the complete weight breakdown and
trajectory are computed for every individual vehicle planform iteration. The process is repeated
until the weight and volume required meet the weight and volume available, see Figure 5.
A vehicle geometry solution space contour or topography is determined by varying the vehicle
slenderness and re-converging each design point. The operational mission solution space is
created by varying cruise time and re-converging each solution contour. The result is a
continuous carpet plot comparing individually converged flight vehicle solutions based on
structural index, Istr, and TOGW, see Figure 6. The structural index, Istr, is a metric of the
structural efficiency of the concept, and is defined as structural weight per unit wetted area. This
parameter will be further discussed when addressing the description of the solution space
constraints.

Proceedings of the 2013 ASEE Gulf-Southwest Annual Conference,
The University of Texas at Arlington, March 21 – 23, 2013.
Copyright 2013, American Society for Engineering Education
Solution Space Constraint Description: Having generated a carpet plot consisting of individually
converged flight vehicles of varying vehicle slenderness (τ) and cruise time, the next step is to
superimpose the aborted landing constraint, the thrust minus drag (T-D) constraint and the
structural technology level available (Istr). The landing constraint is computed from the
prescribed approach speed, which translates to the required 1g stall speed and required stall wing
loading. Additionally, mapping the required wing loading to the TOGW and Istr, the T-D
constraint can be added to the solutions, see Figure 7.
The T-D constraint represents the highest τ allowable which will still have positive acceleration
during the ascent portion of the trajectory. If the vehicle is stouter (reduced planform area and
increased vehicle height), then this limits the wave drag increase and the reduced capture area
results in negative thrust, see Figure 7.
Figure 7 represents the structural weight per wetted area required to converge the configuration
to each specific slenderness value (τ). When superimposing relevant material and structural
concept technology levels onto the vehicle structural index carpet plot, the left boundaries of the
solution space are determined. For vehicle slenderness parameters which require structural
indices beyond this limit, the structural and shingle material are not feasible, see Figure 8. Figure
9 documents the structural indices utilized to derive the technology solution space boundaries
pertinent to the flight mission.
AVDsizing
Weight budget: compute OWEw
Volume budget: compute OWEv
Iterate Spln until OWEw and OWEv converge
Iterate for each t specified
Iterate over any independent design
variable
Geometry
Constraint Analysis: T/W=f(W/S)
Trajectory:
ff=f(trajectory,aero,propulsion)
Fundamental Sizing Steps
Sizing LogicOEW esitmationTrajectory
Anlaysis
Convergence
Logic
Constraint
Anlaysis
Constraints
Take-off
Approach
speed
(W/S)TO
Feasible solution
space
Cruise
Aborted Landing OEI
2nd
Segment Climb OEI
Current Design Point
Current (W/S)TO
Required
(T/W)TO
Trajectory
Geometry Weight Volume
t 0.125 TOGW (kg) 22136 Vtotal (m3) 131.3
Spln (m2) 103.31 Wppl (kg) 10047 Vppl (m3) 75.4
Swet (m2) 244.63 OEW (kg) 12090
b (m) 9.57 Wmargin 1099
c (m) 1.91 Wsys (kg) 3834 Vsys (m3) 10.3
l (m) 18.00 Wstr (kg) 4736 Vvoid (m3) 26.3
h (m) 2.84 Wprop (kg) 2420 Vprop (m3) 19.3
Aero and propulsion results across
trajectoryGeometry, Weight and Volume Results
constant5.1
pln
S
Vtotalt
Figure 5. Each design point represents a converged complete hypersonic vehicle (Example:
Mach-6, 30 minutes, cruiser configuration).

Proceedings of the 2013 ASEE Gulf-Southwest Annual Conference,
The University of Texas at Arlington, March 21 – 23, 2013.
Copyright 2013, American Society for Engineering Education
0
5000
10000
15000
20000
25000
30000
35000
40000
0 10 20 30 40
TOGW(kg)
Istr=Wstr/Swet
0 min10 min
20 min
30 min
0.050.10
0.15
tcruise
t
Increasing Technical Challenge
0.0750.125
Geometry Weight Volume
t 0.125 TOGW (kg) 22136 Vtotal (m3) 131.3
Spln (m2) 103.31 Wppl (kg) 10047 Vppl (m3) 75.4
Swet (m2) 244.63 OEW (kg) 12090
b (m) 9.57 Wmargin 1099
c (m) 1.91 Wsys (kg) 3834 Vsys (m3) 10.3
l (m) 18.00 Wstr (kg) 4736 Vvoid (m3) 26.3
h (m) 2.84 Wprop (kg) 2420 Vprop (m3) 19.3
Aero and propulsion results across
trajectoryGeometry, Weight and Volume Results
Weight budget: compute OWEw
Volume budget: compute OWEv
Iterate Spln until OWEw and OWEv converge
Iterate for each t specified
Iterate over each cruise time
Geometry
Constraint Analysis: T/W=f(W/S)
Trajectory:
ff=f(trajectory,aero,propulsion)
Figure 6. Solution space plot of TOGW and Istr for varying vehicle slenderness and cruise time.
The final constraints of relevance for identifying the solution space include: (a) launch vehicle
load capability, (b) geometry limits for the carrier (air-launch) aircraft, and (c) expendable
booster staging options. Options for the air-launched carrier vehicle are the B747-100SCA and
B-52H; both options have been explored as possibilities. The B-52H employs an under wing
mount constrained by: (a) the maximum load of the pylon, and (b) the geometric boundaries
between the fuselage and inboard engine, the test vehicle wing and engine exhaust plum. The X-
24C was intended to be the largest vehicle to possibly fit under the B-52H wing mount.
Therefore, the X-24C’s TOGW, length and width represent a guide for the maximum capability
of the B-52H air-launcher for this investigation, see Figure 10. The B747-SCA is a modified
B747-100 designed to carry the Space Shuttle Orbiter. For this study, the OEW, length and span
of the Space Shuttle Orbiter are used as a guide for the maximum air-lift capability of the B747-
SCA, see Figure 11.

Proceedings of the 2013 ASEE Gulf-Southwest Annual Conference,
The University of Texas at Arlington, March 21 – 23, 2013.
Copyright 2013, American Society for Engineering Education
0
5000
10000
15000
20000
25000
30000
35000
40000
0 10 20 30 40
TOGW(kg)
Istr=Wstr/Swet
Landingconstraint
0 min10 min
20 min
30 min
0.050.10
0.15
tcruise
t
Increasing Technical Challenge
T-Dconstraint
0.0750.125
Structural Technology Levels (Istr = Wstr/Swet)
Li - AL Structure - Refractory shingles
Li - AL Structure – SEP SiC/SiCMMC shingles
Composite Structure - Refractory shingles
Composite Structure - SEP SiC/SiCMMC shingles
0
5000
10000
15000
20000
25000
30000
35000
40000
0.00 10.00 20.00 30.00 40.00
TOGW(kg)
Istr=Wstr/Swet
B-52 under wing
Landingconstraint
0 min10 min
20 min
30 min
0.050.10
0.15
tcruise
t
Increasing Technical Challenge
T-Dconstraint
0.0750.125
Figure 7. Landing and T-D constraints imposed on the solution space. For the Mach 6
demonstrator, the landing constraint is more constraining than T-D.
Figure 8. Superposition of structural indices provides the final constraint to
determine the technical solution space.

Proceedings of the 2013 ASEE Gulf-Southwest Annual Conference,
The University of Texas at Arlington, March 21 – 23, 2013.
Copyright 2013, American Society for Engineering Education
Integral Hydrogen Fuel tank
Refractory
shingles
Advanced
schingles
Refractory
shingles
Advanced
schingles
kg/m2 kg/m2 kg/m2 kg/m2
Shingle 6.30 4.88 6.30 4.88
Insulation 4.39 4.39 4.39 4.39
Structure 7.08 7.08 3.61 3.61
Foam insulation 1.61 1.61 1.61 1.61
total 19.38 17.97 15.92 14.50
Integral Kerosene fuel tank
Refractory
shingles
Advanced
schingles
Refractory
shingles
Advanced
schingles
kg/m2 kg/m2 kg/m2 kg/m2
Shingle 6.30 4.88 6.30 4.88
Insulation 4.39 4.39 4.39 4.39
Structure 7.08 7.08 3.61 3.61
Foam insulation 0.00 0.00 0.00 0.00
total 17.77 16.36 14.31 12.89
Li-AL structure Composite strucutre
Li-AL structure Composite strucutre
Integral fuel Tank Structural
constant (MAC circa 1970)Break-down of industrial capability index
Figure 9. Definition of structural capability indices used for this study. (Ref 6)
Figure 10. B-52H under-wing mount geometric constraints. (Ref 15)

Proceedings of the 2013 ASEE Gulf-Southwest Annual Conference,
The University of Texas at Arlington, March 21 – 23, 2013.
Copyright 2013, American Society for Engineering Education
B-52H
Design Payload: X-24C
Payload = 31,751 kg
Spanlimit = 7.3 mLengthlimit = 17.3 m
B747-100SCA
Design Payload: Space Shuttle
Payload =78,000 kg
Spanlimit = 23.79 mLengthlimit = 37.24 m
Figure 11. Summary of B747-SCA and B-52H constraints for the hypersonic
demonstrator study. (Ref 15,16)
Castor 120
Taurus XL – 1st Stage
Payload = 19,046 kg
Velsep = 2,209 m/sec
Altsep = 41 km
M55A1
Minotaur I – 1st Stage
Payload =13,116 kg
Velsep = 1,510 m/sec
Altsep = 33 km
Payload equals
payload to orbit plus
weight of upper stages
Velocity and altitude
referenced to first
stage separation point
Both boosters are
currently in production
Figure 12. Summary of Minotaur I and Taurus XL 1
st stage constraints for the
hypersonic

Proceedings of the 2013 ASEE Gulf-Southwest Annual Conference,
The University of Texas at Arlington, March 21 – 23, 2013.
Copyright 2013, American Society for Engineering Education
When considering expendable boosters as the launch method for the hypersonic demonstrator,
the boosters are found to fit the hypersonic demonstrator options as the 2nd
-stage of either the
Minotaur I or Taurus XL launch vehicles. These representative boosters are selected based on
their maximum payload weight, separation velocity and separation altitude, see Figure 12. The
maximum payload weight capacity of the booster 1st stage is taken to be the maximum payload to
orbit, plus the weight of the upper stages.
During the screening process, each solution space is bounded by operational factors and
technology factors for landing, T-D, and structural index. Next, the carrier/launch vehicle
constraints are examined to determine the appropriate air-launch vehicle options for each trade.
Solution Space Screening
The selection of the trade-space and the accompanying trade-matrix results in a solution space
screening activity overall consisting of two (2) launch options, two (2) cruise Mach numbers, and
three (3) fuel combinations. The solution space deliverables for each option are visualized
relative to each other with Figure 13. For each trade, the cruise time will be increased from 0 min
to 30 min in increments of 10 min while vehicle slenderness is varied, generating the distinct
solution space carpet plot. Since Figure 13 compares discrete flight vehicle types (launch
method, Mach number, fuel), note that the ten (10) identified and visualized trade solution spaces
demonstrate regions of operational and technical feasibility with a varying TOGW y-axis scale.
In total, 237 flight vehicle design solutions have been converged.
0
2000
4000
6000
8000
10000
12000
14000
16000
18000
20000
0 10 20 30 40
TOGW(kg)
Istr=Wstr/Swet
Landingconstraint
0 min
10 min
20 min
30 min
0.04250.0625
0.0825
tcruiset
Increasing Technical Challenge
T-Dconstraint
0
2000
4000
6000
8000
10000
12000
0 10 20 30 40
TOGW(kg)
Istr=Wstr/Swet
Landingconstraint
0 min
10 min
20 min
30 min
0.05 0.07250.095
tcruise
t
Increasing Technical Challenge
T-Dconstraint
0.11750.14
Air L
aunch
Expendable
booste
r
Mach 6
Mach 8
Mach 6
Mach 8
Hydrogen Dual Fuel Kerosene
0
5000
10000
15000
20000
25000
30000
35000
40000
0 10 20 30 40
TOGW(kg)
Istr=Wstr/Swet
Landingconstraint0 min
10 min20 min
30 min
0.1 0.12750.155tcruise
Increasing Technical Challenge
T-Dconstraint
0.1825
0.21
0
2000
4000
6000
8000
10000
12000
14000
16000
18000
20000
0 10 20 30 40
TOGW(kg)
Istr=Wstr/Swet
Landingconstraint
0 min10 min
20 min
30 min
0.120.17
0.195
tcruise
Increasing Technical Challenge
T-Dconstraint
0.145
0
5000
10000
15000
20000
25000
30000
35000
40000
0 10 20 30
TOGW(kg)
Istr=Wstr/Swet
B-52 under wing
Landingconstraint0 min
10 min20 min
30 min
0.020.0425
0.0538
t
Increasing Technical Challenge
T-Dconstraint
0.0313
0.065
tcruise
0
5000
10000
15000
20000
25000
30000
35000
40000
0 10 20 30
TOGW(kg)
Istr=Wstr/Swet
B-52 under wing
Landingconstraint0 min
10 min20 min
30 min
0.050.10
0.125
t
Increasing Technical Challenge
T-Dconstraint
tcruise
0.075
0
10000
20000
30000
40000
50000
60000
0 10 20 30 40
TOGW(kg)
Istr=Wstr/Swet
B-52 under wing
Landingconstraint
0 min10 min
20 min30 min
0.050.10
0.15
tcruise
t
Increasing Technical Challenge
T-Dconstraint
0
5000
10000
15000
20000
25000
30000
35000
0.00 10.00 20.00 30.00
TOGW(kg)
Istr=Wstr/Swet
B-52 under wing
Landingconstraint
0 min10 min
20 min30 min
0.02 0.0520.084
tcruise
t
Increasing Technical Challenge
T-Dconstraint
0.0360.068
0.10
0
5000
10000
15000
20000
25000
30000
35000
0 10 20 30
TOGW(kg)
Istr=Wstr/Swet
B-52 under wing
Landingconstraint
0 min10 min
20 min
30 min
0.05 0.100.15
tcruise
t
Increasing Technical Challenge
T-Dconstraint
0.0750.125
0
5000
10000
15000
20000
25000
30000
35000
40000
0.00 10.00 20.00 30.00 40.00
TOGW(kg)
Istr=Wstr/Swet
B-52 under wing
Landingconstraint
0 min10 min
20 min
30 min
0.050.10
0.15
tcruise
t
Increasing Technical Challenge
T-Dconstraint
0.0750.125
Figure 13. Relative comparison of solution spaces for each design trade explored.

Proceedings of the 2013 ASEE Gulf-Southwest Annual Conference,
The University of Texas at Arlington, March 21 – 23, 2013.
Copyright 2013, American Society for Engineering Education
Solution Space Comparison and Baseline Selection
Using the results of this study, two endurance hypersonic demonstrators have been identified as
prospective baseline vehicles for research and development, concept formulation and definition,
and system development efforts. It has been determined that the goal of first flight within the 10
to 20 year time span can be achieved with reasonable confidence using mostly existing industrial
capability. Required technology development efforts would primarily focus on scramjet engine
requirements for (a) a hydrogen-based, and/or (b) a kerosene-based operational infrastructure.
In summary, the current research undertaking has covered and delivered sensitivity trends for
launch and staging options, accelerator motor selection, ramjet/scramjet fuel selection, material
concept and configuration arrangement, all measured against the operational mission (i.e. cruise
time, speed requirement). Considering the broadness of these engineering options evaluated, the
value of parametric sizing (PS) on physical understanding and system-level decision-making has
been demonstrated. Clearly, parametric sizing utilizes the first principles mindset and tools to
answer how changes within the mission, operational scenario and overall research objectives
influence the design ‘hardware’ requirements, thus the decision-making process. The
recommendations and conclusions of the solution space trade analysis follow.
Solution Space Screening
Hydrogen, Insulated integral fuel tank Kerosene, Non-insulated fuel tank
0
10000
20000
30000
40000
50000
60000
0 10 20 30 40
TOGW(kg)
Istr=Wstr/Swet
B-52 under wing
M8, AL, LH2
Increasing Technical Challenge
M6, AL, LH2
M6, EB, LH2
M8, EB, LH2
0
10000
20000
30000
40000
50000
60000
0 10 20 30
TOGW(kg)
Istr=Wstr/Swet
B-52 under wing
Increasing Technical Challenge
M8, AL, RP-1
M6, AL, RP-1
M8, EB, RP-1
Increasing Technical Challenge
M6, EB, RP-1
Structural Technology Levels (Istr = Wstr/Swet)
Li - AL Structure - Refractory shingles
Li - AL Structure – SEP SiC/SiCMMC shingles
Composite Structure - Refractory shingles
Composite Structure - SEP SiC/SiCMMC shingles
Figure 14. Hydrogen-fueled vehicles allow for a larger technical solution space compared to
kerosene-fueled vehicles.

Proceedings of the 2013 ASEE Gulf-Southwest Annual Conference,
The University of Texas at Arlington, March 21 – 23, 2013.
Copyright 2013, American Society for Engineering Education
A. Design-Level Summary
A direct comparison of the hydrogen and kerosene demonstrator trade space illustrates that
hydrogen vehicles have a larger feasible design space relative to kerosene equivalents, see Figure
14. Comparing kerosene vehicles relative to hydrogen vehicles, the kerosene designs show larger
sensitivity to landing constraints due to increased vehicle density (which increases wing loading)
and the requirement for a lighter structure to compensate for reduced fuel Isp values. Comparing
hydrogen vehicles relative to kerosene vehicles, the trade-off between fuel weight density and
energy density characteristics yields a higher total system benefit for hydrogen.
B. Mission-Level Summary
In order to explore the hypersonic design relationships at mission level, Figure 14 superimposes
the outer contours of the hydrogen and kerosene solution spaces. Both design spaces, with
decreasing maximum TOGW, include (a) M=8 Air-Launch, (b) M=6 Air-Launch, (c) M=8
Expendable Booster, and (d) M=6 Expendable Booster. This discussion centers on the cruise
time constraint equal to 30 min (positive curve at the top of the trade space). For the hydrogen-
based demonstrators, the individual solution spaces offer a vehicle point-design each that meets
the operational limit while having the largest structural technology margin compared to kerosene
equivalents. The M=8 Air-Launch option could be considered the higher risk solution for the 30
minutes cruise mission. For the kerosene-based demonstrators, only the M=6 Expendable
Booster trade offers a feasible 30 minutes endurance solution. The remaining trades do not
present feasible solutions for the 30 minutes demonstrator due to structural constraints. This
shows that overall vehicle feasibility is dependent on not-yet-available structural industry
capability, thus requiring future structures technology developments.
Design Point Comparison
The following discussion reviews the converged baseline vehicle design points selected from the
hypersonic flight vehicle design solution space screening activity. For more information
regarding the demonstrator selection for individual hydrogen- and kerosene-fuel trades, please
refer to the earlier sections. Figure 15 presents the short-list overview of prospective baseline
vehicle configuration-, speed- and fuel combinations. Table 5 and Table 6 are summarizing the
general ‘parametric’ design characteristics for the feasible baseline vehicle options utilizing
either hydrogen or kerosene fuel.

Proceedings of the 2013 ASEE Gulf-Southwest Annual Conference,
The University of Texas at Arlington, March 21 – 23, 2013.
Copyright 2013, American Society for Engineering Education
Air L
aunch
Expendable
booste
r
Mach 6
Mach 8
Mach 6
Mach 8
Hydrogen Kerosene
Figure 15. Configuration geometry of proposed hydrogen and kerosene hypersonic baseline
vehicle designs.

Table 5. Design Characteristics for Hydrogen-Based Suggested Vehicle Selection
tcruise 30 min 30 min 30 min 30 min
Down
range4060 km 2190 nm 6300 km 3402 nm 4120 km 2224 nm 6000 km 3239 nm
TOGW 22136 kg 48802 lbs 40900 kg 90170 lbs 25635 kg 25364 lbs 19577 kg 43160 lbs
Wppl 10047 kg 22149 lbs 20821 kg 45903 lbs 3757 kg 8283 lbs 7423 kg 16365 lbs
OEW 12090 kg 26653 lbs 20079 kg 44267 lbs 7709 kg 16995 lbs 12153 kg 26793 lbs
t 0.125 0.15 0.175 0.1825
S pln 103.3 m2 1112 ft
2 161.2 m2 1735 ft
2 63.5 m2 683.5 ft
2 95.67 m2 1230 ft
2
B 9.57 m 31 ft 11.95 m 39 ft 7.5 m 25 ft 9.2 m 30 ft
L 18 m 59 ft 22.48 m 74 ft 14.1 m 46 ft 17.32 m 57 ft
L/D cruise 2.46 2.31 1.88 1.98
Isp
cruise (s)2613 s 2246 s 2600 s 2248 s
Trkt 453 kN 102 klbs 1015 kN 228 klbs
Nrkt 7 at 64.7kN each 1 at 1015 kN each
Mach 8, Expendable Booster, LH2Mach 6, Expendable Booster, LH2Mach 8, Air-Launch, LH2Mach 6, Air-Launch, LH2
Table 6. Design Characteristics for Kerosene-Based Suggested Vehicle Selection
tcruise 20 min 4.5 min 30 min 20 min
Down
range3480 km 1880 nm 3270 km 1770 nm 4523 km 2442 nm 5640 km 3045 nm
TOGW 14191 kg 31287 lbs 19013 kg 41917 lbs 8345 kg 18398 lbs 12027 kg 26515 lbs
Wppl 7715 kg 17009 lbs 10627 kg 23429 lbs 3536 kg 7796 lbs 6074 kg 13391 lbs
OEW 6476 kg 14277 lbs 8386 kg 18488 lbs 4809 kg 10602 lbs 5953 kg 13124 lbs
t 0.07 0.0675 0.085 0.075
S pln 58.4 m2 628 ft
2 76.7 m2 826 ft
2 34.75 m2 374 ft
2 51.28 m2 552 ft
2
b 7.19 m 24 ft 8.24 m 27 ft 5.55 m 18 ft 6.74 m 22 ft
l 13.53 m 44 ft 15.51 m 51 ft 10.44 m 34 ft 12.68 m 42 ft
L/D cruise 3.79 3.39 4.08 3.92
Isp
cruise (s)943 s 753 s 970 s 732 s
Trkt 512 kN 115 klbs 512 kN 115 klbs
Nrkt 1 at 512 kN each 1 at 512 kN each
Mach 8, Expendable Booster, RP-1Mach 6, Expendable Booster, RP-1Mach 8, Air-Launch, RP-1Mach 6, Air-Launch, RP-1

Proceedings of the 2013 ASEE Gulf-Southwest Annual Conference,
The University of Texas at Arlington, March 21 – 23, 2013.
Copyright 2013, American Society for Engineering Education
Baseline Vehicle Description
While feasible options for both, the hydrogen-fueled and kerosene-fueled vehicles, exist, the
selection of the fuel type alone is not a sufficient indicator for demonstrator feasibility. The selection
criteria for the fuel type are primarily determined by the required operational vehicle characteristics,
in this case being a robust air-breathing propulsion system flying test bed. Clearly, additional criteria
are needed to measure the risk and benefit merits of this demonstrator vehicle. At this point we ask
the simple question: “If a hydrogen fueled scramjet is required, what demonstrator is
recommended?” and “If a kerosene-fueled scramjet is required, what demonstrator is
recommended?”
For each fuel requirement, trade-studies will have to address the following four qualitative
metrics:
1. Versatility Which vehicle represents the largest flexibility of its operational
capability?
2. Growth Capability Which vehicle is the least sensitive to scale? In other words, which
vehicle is least sensitive to changes in structural capability which are assumed for this
study?
• Selection
• Mach 6, 30 min cruise, air launch
with Mach 8, 10 min cruise capability
(the solutions spaces overlap)
• B747-100 air-launch
(planform constrained on the B-52)
• RL-10 rocket accelerator
• Li-Al structure
• Selection Criteria
• Versatility
(largest flexibility in operation)
• Mach 8, air-launch, 30 min
• Growth capability in concept
(sensitivity to increase in scale)
• Mach 6, air-launch, 30 min
• Design confidence
(largest technology margins)
• Mach 6, air-launch, 30 min
• Limitations
(Hydrogen demonstrator)
• B747-100 carrier required for
air-launch
• Operational limitation of
Hydrogen (relative to Kerosene)
0
10000
20000
30000
40000
50000
60000
0 10 20 30 40
TOGW(kg)
Istr=Wstr/Swet
B-52 under wing
M8, AL, LH2
Increasing Technical Challenge
M6, AL, LH2
Figure 16. The Mach 8 air-launched case represents the largest operational flexibility
while Mach 6 air-launched has larger growth capability and design confidence.
Since M6 30 min and M8 10 min solution curves overlay, it appears that the
M6 30 min vehicle could perform the Mach 8 mission for 10 minutes.

Proceedings of the 2013 ASEE Gulf-Southwest Annual Conference,
The University of Texas at Arlington, March 21 – 23, 2013.
Copyright 2013, American Society for Engineering Education
3. Design Confidence Which vehicle has the largest technology margins and allows for a
design point which has sufficient margin in terms of structural technology, T-D and
landing distance?
4. Limitations Which vehicle has any perceived limitations that would hinder
development?
If hydrogen scramjet testing is required, assessment results are presented with Figure 16:
Observing that the Mach 6, 30 minutes vehicle can perform the Mach 8 mission for 10 minutes,
this scenario provides a compromise which will allow for both, the endurance and speed
requirements to be accomplished at a lower risk option compared to the Mach 8, 30 minutes
vehicle. Consequently, the selection of this particular baseline design provides a superior design
margin and a concept less sensitive to structural and propulsion technology requirements.
• Selection
• Mach 6, 30 min cruise
• Composite structure
(possible aluminum)
• M55A1 Expendable Booster
• Selection Criteria
• Versatility
(largest flexibility in operation)
• Mach 6, expendable, 30 min
• Growth capability in concept
(sensitivity to increase in scale)
• Mach 6, expendable, 30 min
• Design confidence
(largest technology margins)
• Mach 6, expendable, 30 min
• Limitations
(Kerosene demonstrator)
• High level of structural
technology required
• Operation of Kerosene at high
temperatures
0
10000
20000
30000
40000
50000
60000
0 10 20 30
TOGW(kg)
Istr=Wstr/Swet
B-52 under wing
Increasing Technical Challenge
M8, AL, RP-1
M6, AL, RP-1
M8, EB, RP-1
Increasing Technical Challenge
M6, EB, RP-1
If kerosene scramjet testing is required, assessment results are presented with Figure 17:
Given the increased density of kerosene (which increases W/S and causes the landing constraint
to increase) accompanied with a reduced energy density, the required structural technology must
increase to compensate. This leaves the Mach 6, 30 minutes vehicle as the only viable technical
option for kerosene scramjets. Furthermore, it is important to note that the Mach 6, 30 minutes
Figure 17. The Mach 6 kerosene-fuel expendable booster trade is the only trade-
study which allows for 30 minutes cruise endurance.
Proceedings of the 2013 ASEE Gulf-Southwest Annual Conference,
The University of Texas at Arlington, March 21 – 23, 2013.
Copyright 2013, American Society for Engineering Education
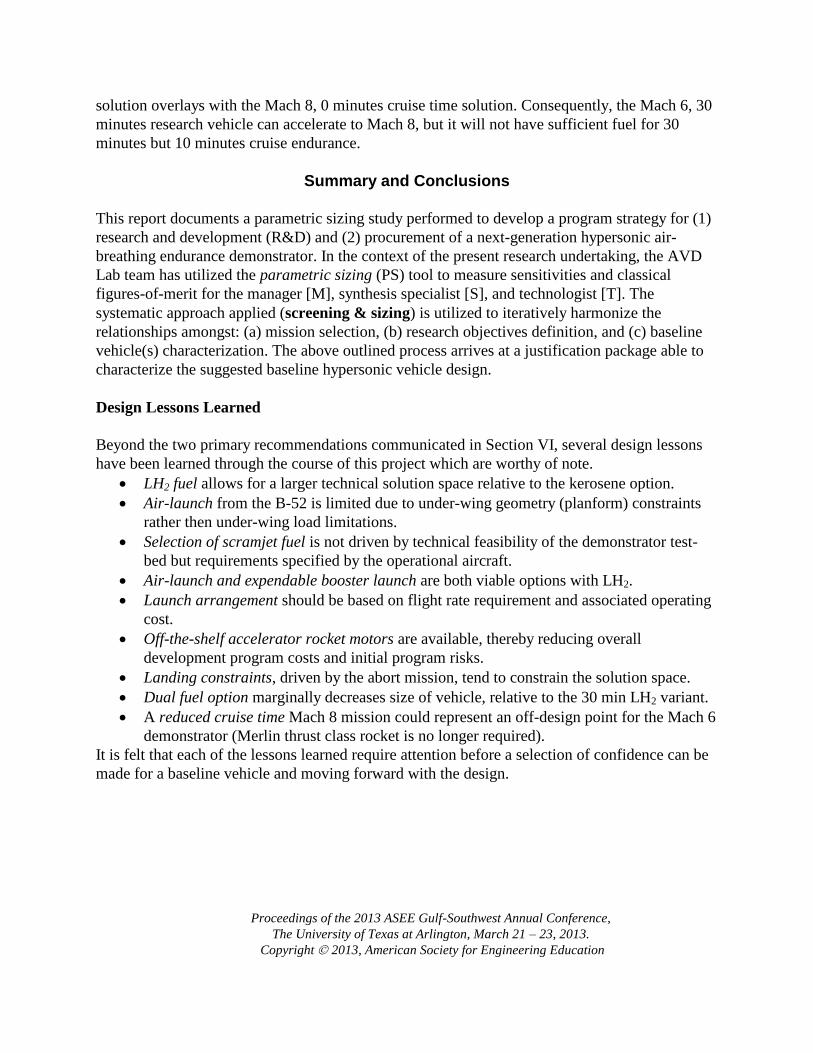
solution overlays with the Mach 8, 0 minutes cruise time solution. Consequently, the Mach 6, 30
minutes research vehicle can accelerate to Mach 8, but it will not have sufficient fuel for 30
minutes but 10 minutes cruise endurance.
Summary and Conclusions
This report documents a parametric sizing study performed to develop a program strategy for (1)
research and development (R&D) and (2) procurement of a next-generation hypersonic air-
breathing endurance demonstrator. In the context of the present research undertaking, the AVD
Lab team has utilized the parametric sizing (PS) tool to measure sensitivities and classical
figures-of-merit for the manager [M], synthesis specialist [S], and technologist [T]. The
systematic approach applied (screening & sizing) is utilized to iteratively harmonize the
relationships amongst: (a) mission selection, (b) research objectives definition, and (c) baseline
vehicle(s) characterization. The above outlined process arrives at a justification package able to
characterize the suggested baseline hypersonic vehicle design.
Design Lessons Learned
Beyond the two primary recommendations communicated in Section VI, several design lessons
have been learned through the course of this project which are worthy of note.
LH2 fuel allows for a larger technical solution space relative to the kerosene option.
Air-launch from the B-52 is limited due to under-wing geometry (planform) constraints
rather then under-wing load limitations.
Selection of scramjet fuel is not driven by technical feasibility of the demonstrator test-
bed but requirements specified by the operational aircraft.
Air-launch and expendable booster launch are both viable options with LH2.
Launch arrangement should be based on flight rate requirement and associated operating
cost.
Off-the-shelf accelerator rocket motors are available, thereby reducing overall
development program costs and initial program risks.
Landing constraints, driven by the abort mission, tend to constrain the solution space.
Dual fuel option marginally decreases size of vehicle, relative to the 30 min LH2 variant.
A reduced cruise time Mach 8 mission could represent an off-design point for the Mach 6
demonstrator (Merlin thrust class rocket is no longer required).
It is felt that each of the lessons learned require attention before a selection of confidence can be
made for a baseline vehicle and moving forward with the design.

Proceedings of the 2013 ASEE Gulf-Southwest Annual Conference,
The University of Texas at Arlington, March 21 – 23, 2013.
Copyright 2013, American Society for Engineering Education
References
1. Chudoba, B., Coleman, G., Oza, A., Gonzalez, L., Czysz, P., “Solution Space Screening of a Hypersonic Endurance
Demonstrator,” National Institute of Aerospace, NIA- contract NNL09AA00A, Task Order No. NIA Activity C10-
2800-UTA for NASA LaRC. August 2010
2. Pirrello, C. J., Czysz, P. A., “Hypersonic Research Facilities Study – Summary,” Volume 1, OART – Advanced
Concepts and Missions Division National Aeronautics and Space Administration, NASA CR 114322, Moffett Field,
California, 1970
3. Brewer, G. D., “Hydrogen Aircraft Technology,” CRC Press, Boca Raton, Florida, 1991
4. Coleman, G., “Aircraft Conceptual Design – An Adaptable Parametric Sizing Methodology,” Ph.D. Dissertation,
The University of Texas at Arlington, Arlington, Texas, 2010
5. Czysz, P. A., “Hypersonic Convergences”, Volumes 1, AFRL-VA-WP-TR-2004-3114
6. Pirrello, C. J., Czysz, P. A., “Hypersonic Research Facilities Study – Flight Vehicle Synthesis,” Volume 2, Part 2,
Phase I Preliminary Studies, OART – Advanced Concepts and Missions Division National Aeronautics and Space
Administration, NASA CR 114324, Moffett Field, California, 1970
7. Pike, J., “Minimum Drag Bodies of a Given Length and Base using Newtonian Theory,” AIAA Journal, Vol 15, No
6, pp. 769-770, June 1977.
8. Warneke, C.H., Kinroth, G. D., “Lifting Reentry Vehicle Preliminary Designs for FLD-7MC and FLD-5MA
Configurations, Volume IV Configuration Evolution, Design Approach Investigation and Supporting Analyses,”
Technical Report, AFFDL-TR-68-97, Air Force Flight Dynamics Laboratory, Wright-Patterson Air Force Base,
Ohio, 1969
9. Heiser, W. H., Pratt, D. T., “Hypersonic Airbreathing Propulsion,” AIAA Educational Series, Washington, DC,
1994
10. Bradford, J. E., “A Technique for Rapid Prediction of Aftbody Nozzle Performance for Hypersonic Launch Vehicle
Design,” Ph.D. Dissertation, Georgia Institute of Technology, Atlanta, Georgia, 2001
11. Flornes, B. J., Escher, J. D., “A Study of Composite Propulsion Systems for Advanced Launch Vehicle Applications,
Volume 2 Main Technical Report,” Report 25, 220, The Marquardt Corporation, Van Nuys, California, 1967
12. Chudoba B., Coleman, G., “Development of Advanced Commercial Transport Configurations (N+3 and Beyond),
Through the Assessment of Past, Present, and Future, Technologies,” Presentation to NASA Langley Research
Center, Aeronautics Systems Analysis Branch, Hampton, Virginia, 2009
13. Ingenito, A., Gulli, S., Bruno, C., “Sizing of a TBCC Powered Hypersonic Vehicle,” Journal of Aircraft, TBD
[Submitted].
14. Combs, H. G., “Configuration Development Study of the X-24C Hypersonic Research Airplane, Executive
Summary,” NASA CR 145274, NASA Langley Research Center, Hampton, Virginia, 1977
15. Klijin, M. S., et al, “Selection of Carrier Aircraft and a Launch Method for Air Launching Space Vehicles,” AIAA
2008-7835, AIAA Space 2008 Conference & Exposition, San Diego, California, 2008
16. Isakowitz, S. J., Hopkins, J. B., Hopkins, J. P., “International Reference Guide to Space Launch Systems,” 4th
Edition, AIAA, Reston, Virginia, 2004
Amit Oza
Mr. Oza currently serves as a graduate research assistant at the University of Texas at Arlington
Gary Coleman
Dr. Coleman currently serves as a Mechanical Engineer at RSG AeroDesign
Lex Gonzalez
Mr. Gonzalez currently serves as a graduate research assistant at the University of Texas at Arlington

Proceedings of the 2013 ASEE Gulf-Southwest Annual Conference,
The University of Texas at Arlington, March 21 – 23, 2013.
Copyright 2013, American Society for Engineering Education
Bernd Chudoba
Dr. Chudoba currently serves as an Assistant Professor of Aerospace Engineering at the University of Texas at
Arlington
Paul Czsyz
Mr. Czysz currently serves as a consultant through Hypertech Concepts LLC