Solid Waste sector in Serbia and research activities in ...X(1)S(nujr3lxmddr2...MOPRORK project •...
14
Solid Waste sector in Serbia and research activities in this sector Doc. Dr Goran Vujic 10.11.2011 1
Transcript of Solid Waste sector in Serbia and research activities in ...X(1)S(nujr3lxmddr2...MOPRORK project •...
Solid Waste sector in Serbia and research activities in this sector
Doc. Dr Goran Vujic
10.11.2011
1
MOPRORK project
• New Serbian landfill bylaw
• Database for solid waste for all municipalities
• Sampling wells (piezometers) for 170 big landfills
• Monitoring for 170 landfills
• GEOradar analysis
• Satellite picture analysis of landfills in the past
• New Analysis of the waste content
2 10.11.2011
3 10.11.2011
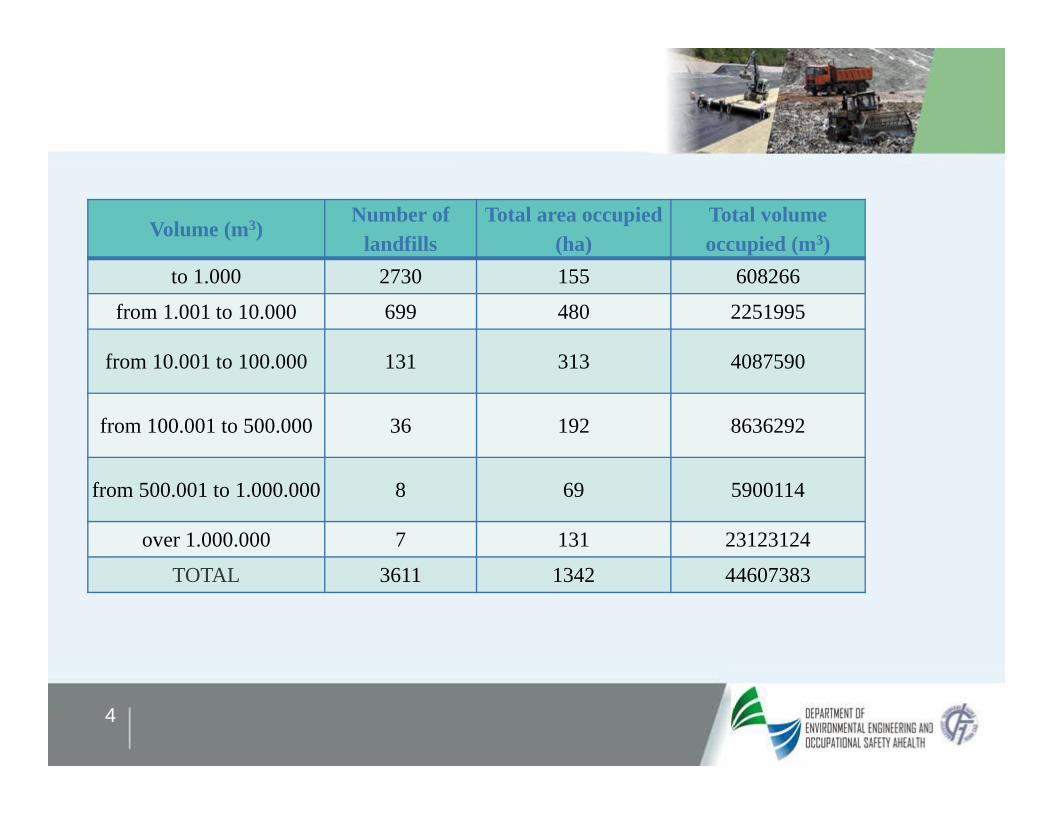
Volume (m3) Number of
landfills Total area occupied
(ha) Total volume occupied (m3)
to 1.000 2730 155 608266
from 1.001 to 10.000 699 480 2251995
from 10.001 to 100.000 131 313 4087590
from 100.001 to 500.000 36 192 8636292
from 500.001 to 1.000.000 8 69 5900114
over 1.000.000 7 131 23123124
TOTAL 3611 1342 44607383
4
10.11.2011
5
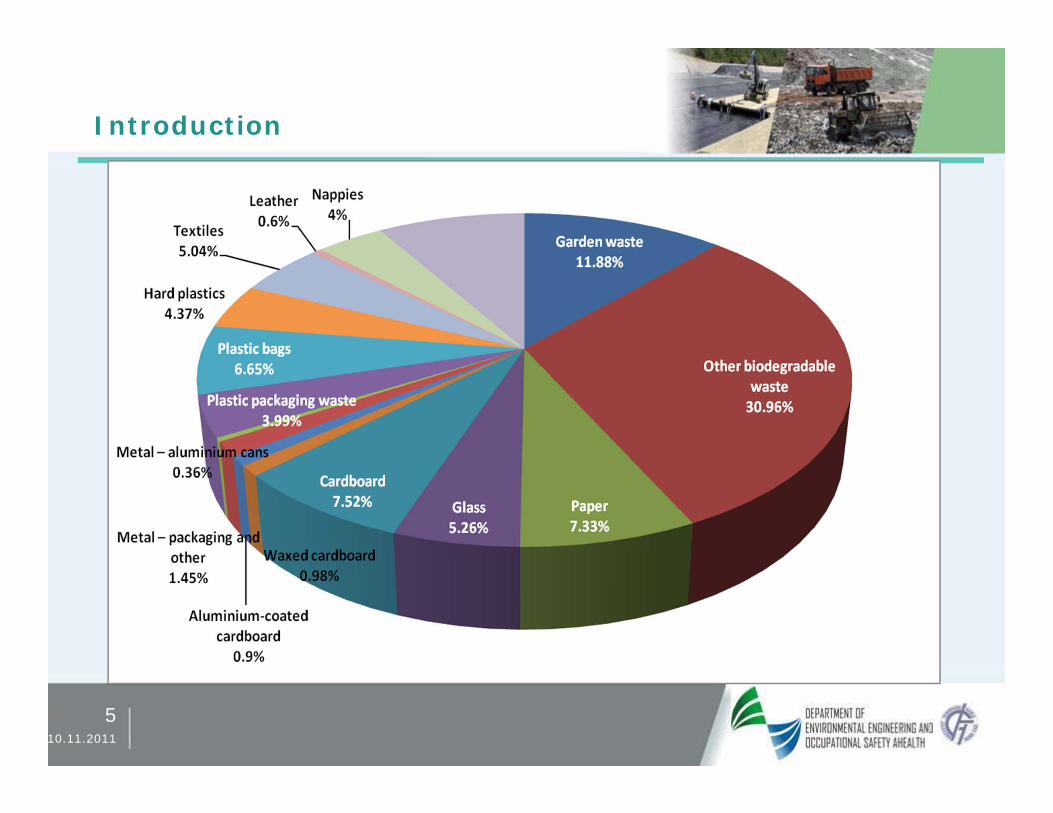
Introduction
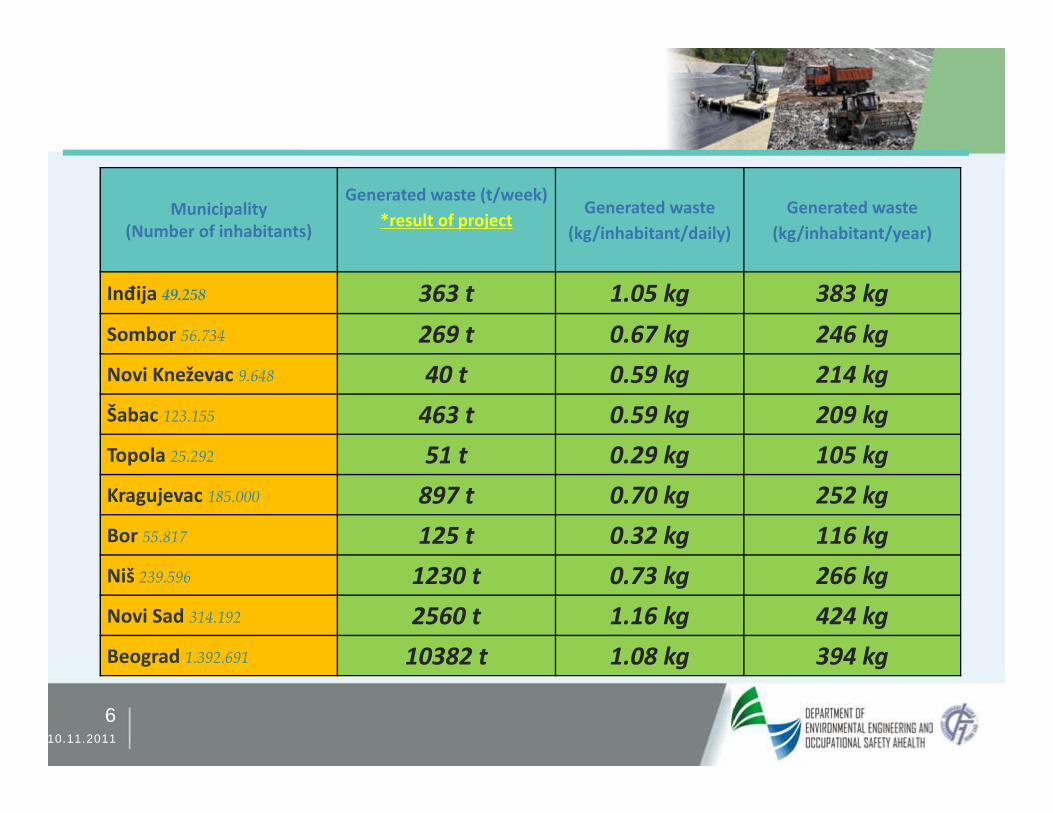
Municipality (Number of inhabitants)
Generated waste (t/week) *result of project
Generated waste (kg/inhabitant/daily)
Generated waste (kg/inhabitant/year)
Inđija 49.258 363 t 1.05 kg 383 kg
Sombor 56.734 269 t 0.67 kg 246 kg
Novi Kneževac 9.648 40 t 0.59 kg 214 kg
Šabac 123.155 463 t 0.59 kg 209 kg
Topola 25.292 51 t 0.29 kg 105 kg
Kragujevac 185.000 897 t 0.70 kg 252 kg
Bor 55.817 125 t 0.32 kg 116 kg
Niš 239.596 1230 t 0.73 kg 266 kg
Novi Sad 314.192 2560 t 1.16 kg 424 kg
Beograd 1.392.691 10382 t 1.08 kg 394 kg
6 10.11.2011
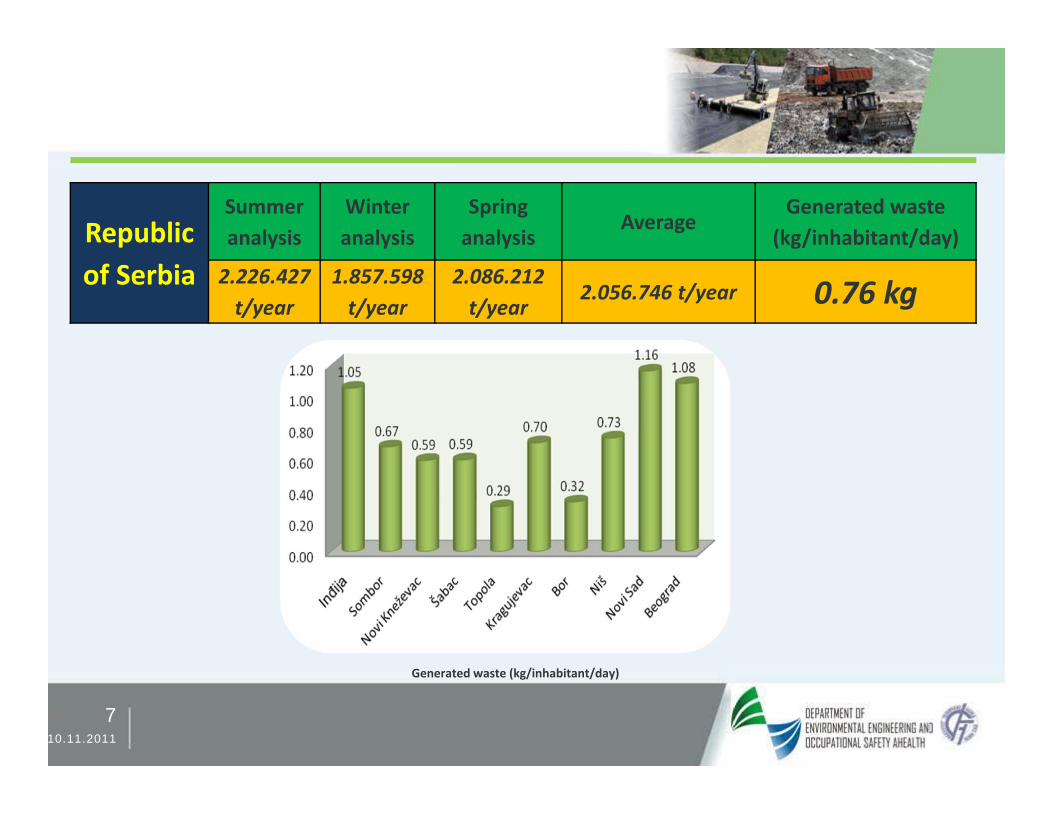
Republic of Serbia
Summer analysis
Winter analysis
Spring analysis
Average Generated waste
(kg/inhabitant/day)
2.226.427 t/year
1.857.598 t/year
2.086.212 t/year
2.056.746 t/year 0.76 kg
Generated waste (kg/inhabitant/day)
10.11.2011
7
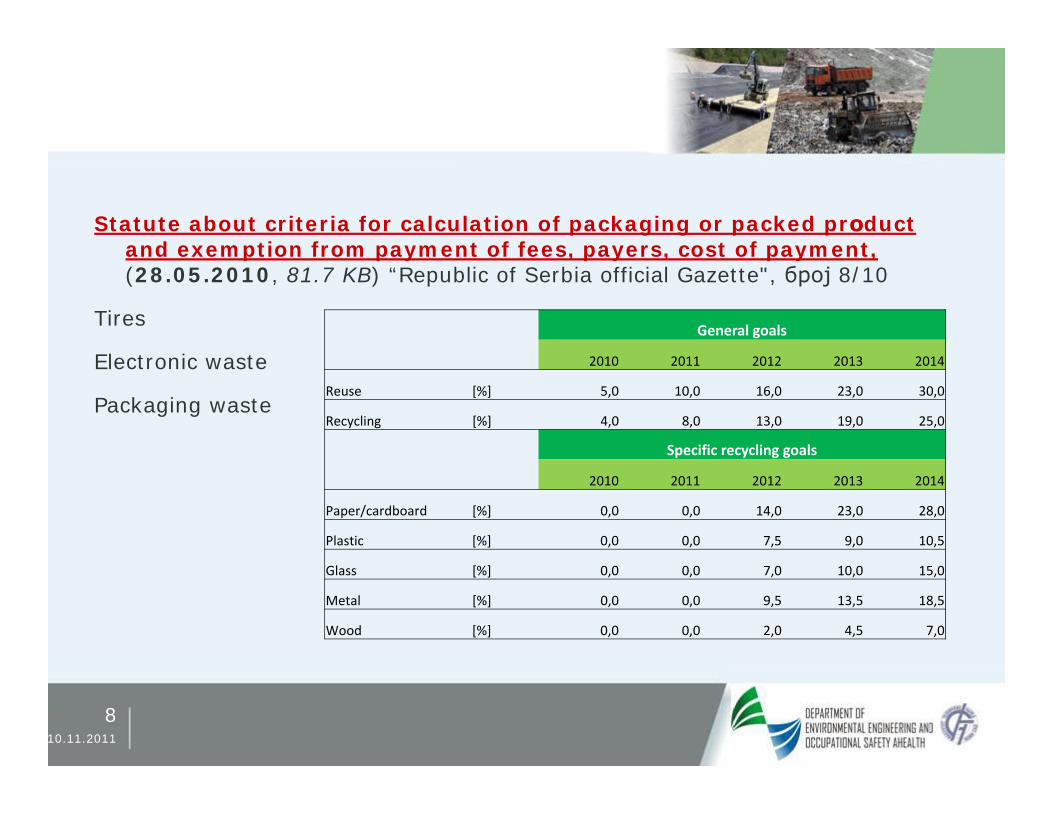
Statute about criteria for calculation of packaging or packed prоduct and exemption from payment of fees, payers, cost of payment, (28.05.2010, 81.7 KB) “Republic of Serbia official Gazette", број 8/10
Tires
Electronic waste
Packaging waste
2010
General goals
2011 2012 2013 2014
Reuse [%] 5,0 10,0 16,0 23,0 30,0
Recycling [%] 4,0 8,0 13,0 19,0 25,0
2010
Specific recycling goals
2011 2012 2013 2014
Paper/cardboard [%] 0,0 0,0 14,0 23,0 28,0
Plastic [%] 0,0 0,0 7,5 9,0 10,5
Glass [%] 0,0 0,0 7,0 10,0 15,0
Metal [%] 0,0 0,0 9,5 13,5 18,5
Wood [%] 0,0 0,0 2,0 4,5 7,0
8 10.11.2011
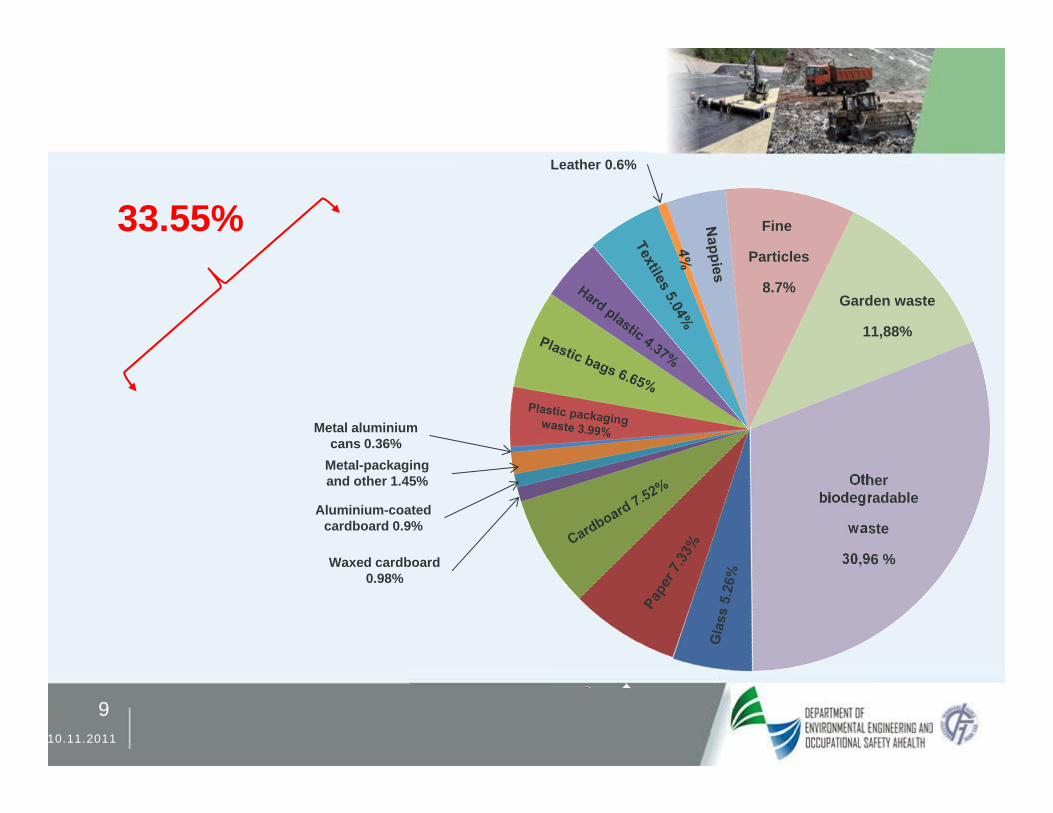
Waxed cardboard 0.98%
Aluminium-coated cardboard 0.9%
Metal-packaging and other 1.45%
Metal aluminium cans 0.36%
9 10.11.2011
Other biodegradable
waste
30,96 %
Garden waste
11,88%
Fine
Particles
8.7%
Leather 0.6%
33.55%
0% 5%
10% 15% 20% 25% 30% 35% 40% 45% 50% 55% 60% 65% 70% 75% 80% 85% 90% 95%
100% 19
9319
9419
9519
9619
9719
9819
9920
0020
0120
0220
0320
0420
0520
0620
0720
0820
0920
1020
1120
1220
1320
1420
1520
1620
1720
1820
1920
2020
2120
2220
2320
2420
2520
2620
27
% o
f BM
W P
rodu
ced
in 1
995
/ 201
2Th
at c
an b
e co
nsig
ned
to la
ndfil
l
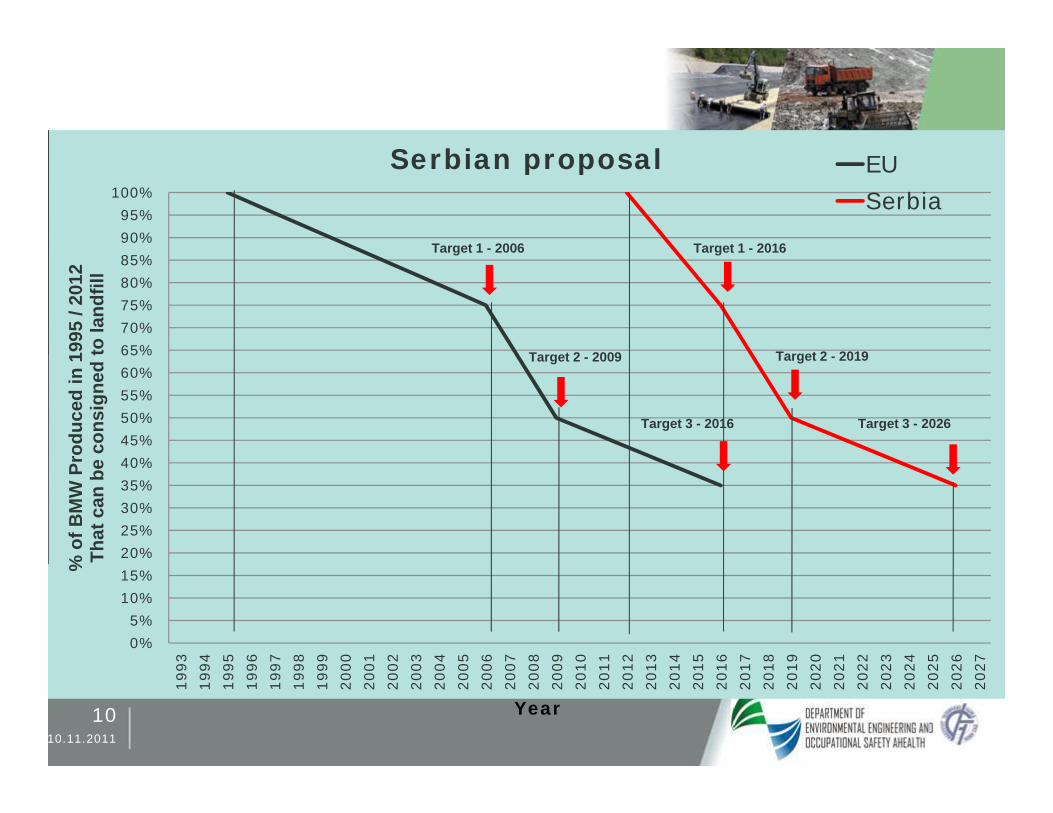
Serbian proposal EU Serbia
10 10.11.2011
Target 1 - 2016
Target 2 - 2019
Target 3 - 2026
Target 1 - 2006
Target 2 - 2009
Target 3 - 2016
Year
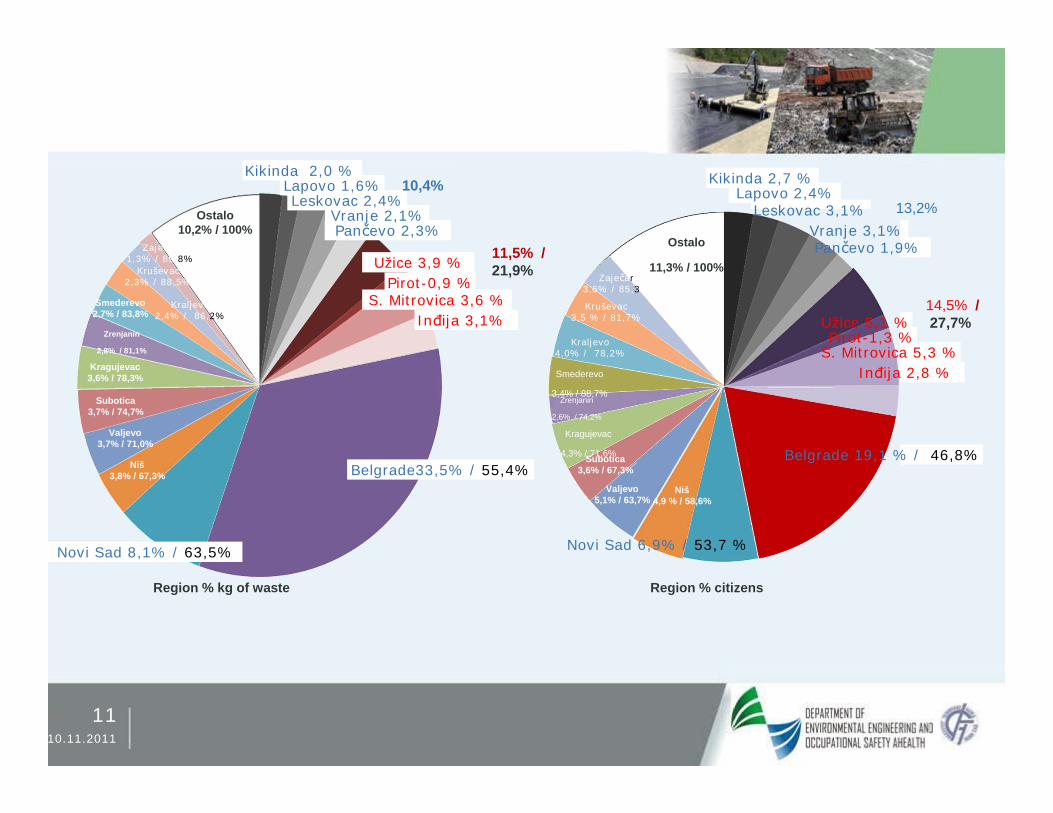
Kikinda 2,0 % Lapovo 1,6%Leskovac 2,4%
Vranje 2,1%Pančevo 2,3%
10,4%
Užice 3,9 % Pirot-0,9 %
S. Mitrovica 3,6 % Inđija 3,1%
Belgrade33,5% / 55,4%
Zaječar 1,3% / 89,8%
Novi Sad 8,1% / 63,5%
Niš 3,8% / 67,3%
Valjevo 3,7% / 71,0%
Subotica 3,7% / 74,7%
Kragujevac 3,6% / 78,3%
Zrenjanin
2,8% / 81,1%
Kraljevo 2,4% / 86,2%
Kruševac 2,3% / 88,5%
Ostalo 10,2% / 100%
Smederevo 2,7% / 83,8%
11,5% / 21,9%
Kikinda 2,7 % Lapovo 2,4%
Leskovac 3,1% Vranje 3,1% Pančevo 1,9%
13,2%
Užice 5,1 % Pirot-1,3 %
S. Mitrovica 5,3 % Inđija 2,8 %
14,5% / 27,7%
Belgrade 19,1 % / 46,8%
Zaječar 3,6% / 85,3%
Novi Sad 6,9% / 53,7 %
Niš 4,9 % / 58,6%
Valjevo 5,1% / 63,7%
Subotica 3,6% / 67,3%
Kragujevac
4,3% / 71,6%
Zrenjanin
2,6% / 74,2%
Kraljevo 4,0% / 78,2%
Kruševac 3,5 % / 81,7%
Ostalo
11,3% / 100%
Smederevo
3,4% / 88,7%
Region % kg of waste Region % citizens
10.11.2011
11
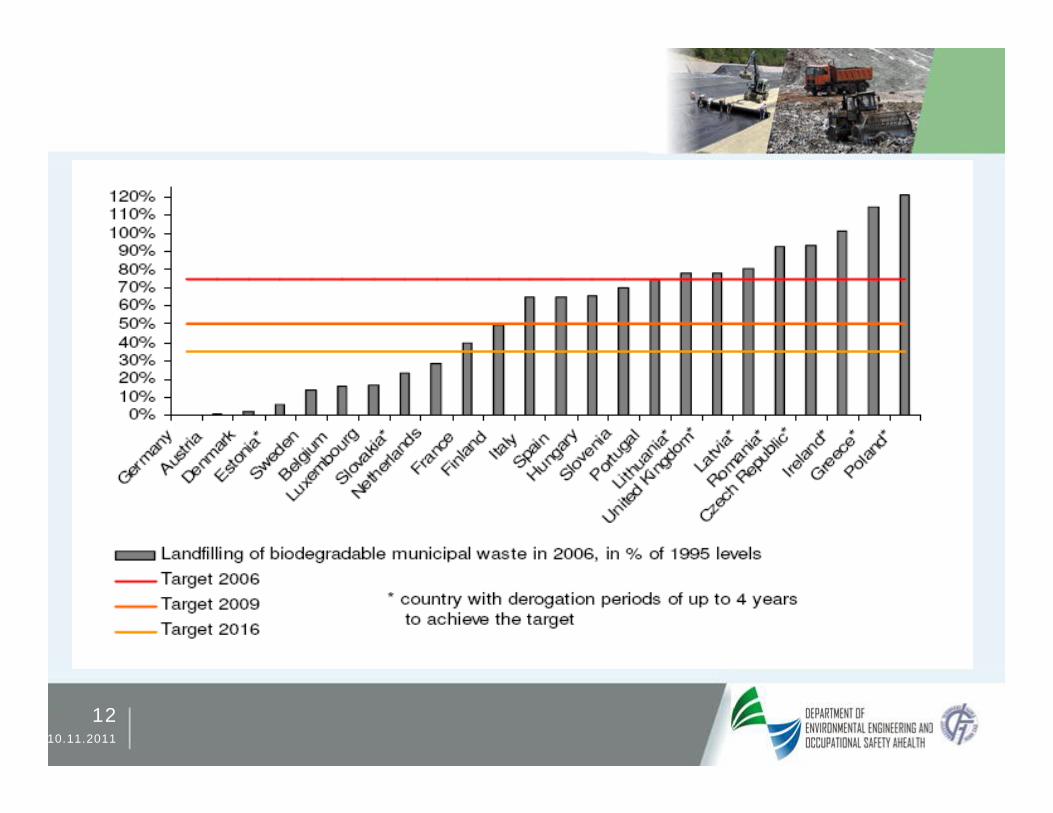
12 10.11.2011
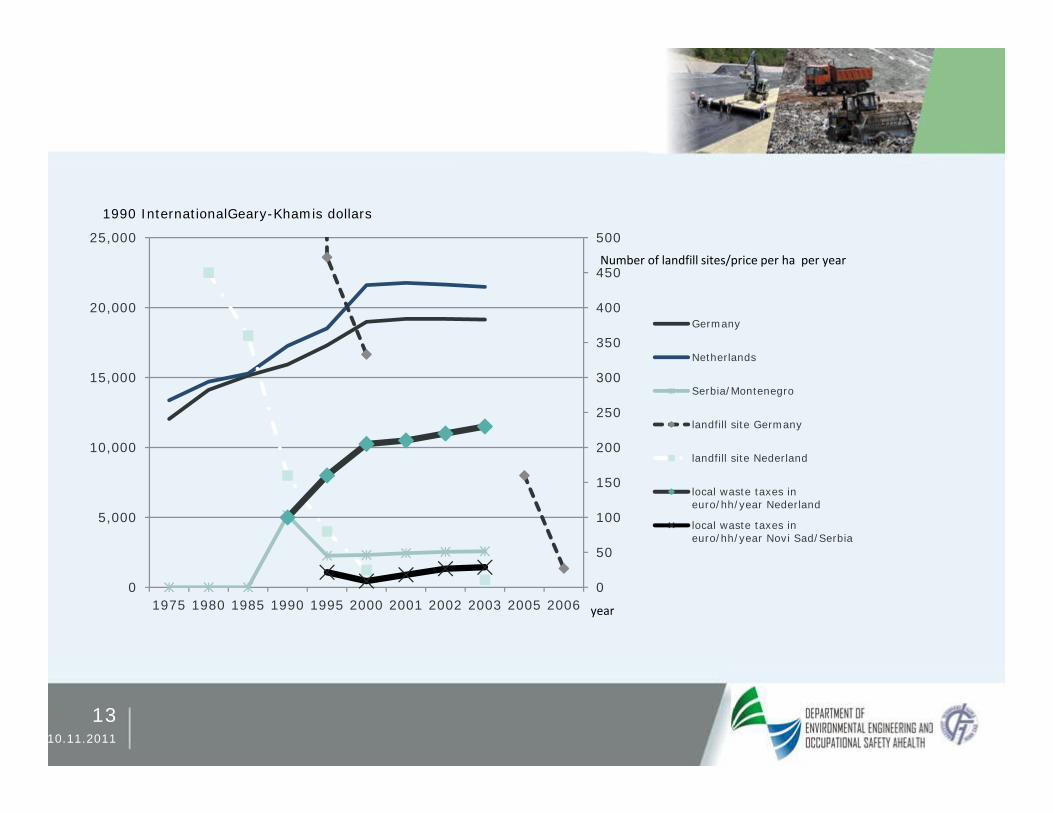
1990 InternationalGeary-Khamis dollars
25,000 500 Number of landfill sites/price per ha per year 450
20,000 400 Germany
350 Netherlands
15,000 300 Serbia/Montenegro
250 landfill site Germany
10,000 200 landfill site Nederland
150 local waste taxes in euro/hh/year Nederland
5,000 100 local waste taxes in euro/hh/year Novi Sad/Serbia
50
0 0 1975 1980 1985 1990 1995 2000 2001 2002 2003 2005 2006 year
13 10.11.2011
Further research in waste sector in Serbia but also in waste sector
• Landfill
• Two bins system
• More research for inexpensive technology
14 10.11.2011