Solid-liquid phase equilibrium of trans-cinnamic acid, p ...
29
Journal Pre-proof Solid-liquid phase equilibrium of trans-cinnamic acid, p-coumaric acid and ferulic acid in water and organic solvents: Experimental and modelling studies Sérgio M. Vilas-Boas, Rebeca S. Alves, Paula Brandão, Leila M.A. Campos, João A.P. Coutinho, Simão P. Pinho, Olga Ferreira PII: S0378-3812(20)30294-6 DOI: https://doi.org/10.1016/j.fluid.2020.112747 Reference: FLUID 112747 To appear in: Fluid Phase Equilibria Received Date: 12 May 2020 Revised Date: 26 June 2020 Accepted Date: 30 June 2020 Please cite this article as: Sé.M. Vilas-Boas, R.S. Alves, P. Brandão, L.M.A. Campos, Joã.A.P. Coutinho, Simã.P. Pinho, O. Ferreira, Solid-liquid phase equilibrium of trans-cinnamic acid, p-coumaric acid and ferulic acid in water and organic solvents: Experimental and modelling studies, Fluid Phase Equilibria (2020), doi: https://doi.org/10.1016/j.fluid.2020.112747. This is a PDF file of an article that has undergone enhancements after acceptance, such as the addition of a cover page and metadata, and formatting for readability, but it is not yet the definitive version of record. This version will undergo additional copyediting, typesetting and review before it is published in its final form, but we are providing this version to give early visibility of the article. Please note that, during the production process, errors may be discovered which could affect the content, and all legal disclaimers that apply to the journal pertain. © 2020 Published by Elsevier B.V.
Transcript of Solid-liquid phase equilibrium of trans-cinnamic acid, p ...
Journal Pre-proof
Solid-liquid phase equilibrium of trans-cinnamic acid, p-coumaric acid and ferulic acidin water and organic solvents: Experimental and modelling studies
Sérgio M. Vilas-Boas, Rebeca S. Alves, Paula Brandão, Leila M.A. Campos, JoãoA.P. Coutinho, Simão P. Pinho, Olga Ferreira
PII: S0378-3812(20)30294-6
DOI: https://doi.org/10.1016/j.fluid.2020.112747
Reference: FLUID 112747
To appear in: Fluid Phase Equilibria
Received Date: 12 May 2020
Revised Date: 26 June 2020
Accepted Date: 30 June 2020
Please cite this article as: Sé.M. Vilas-Boas, R.S. Alves, P. Brandão, L.M.A. Campos, Joã.A.P.Coutinho, Simã.P. Pinho, O. Ferreira, Solid-liquid phase equilibrium of trans-cinnamic acid, p-coumaricacid and ferulic acid in water and organic solvents: Experimental and modelling studies, Fluid PhaseEquilibria (2020), doi: https://doi.org/10.1016/j.fluid.2020.112747.
This is a PDF file of an article that has undergone enhancements after acceptance, such as the additionof a cover page and metadata, and formatting for readability, but it is not yet the definitive version ofrecord. This version will undergo additional copyediting, typesetting and review before it is publishedin its final form, but we are providing this version to give early visibility of the article. Please note that,during the production process, errors may be discovered which could affect the content, and all legaldisclaimers that apply to the journal pertain.
© 2020 Published by Elsevier B.V.
CRediT author statement
Sérgio M. Vilas-Boas: Investigation, Writing - Original Draft, Data Curation, Software. Rebeca S. Alves: Investigation. Paula Brandão: Investigation, Data Curation, Writing - Review and Editing. Leila M. A. Campos: Writing - Review & Editing. João A.P. Coutinho: Supervision, Writing - Review & Editing. Simão P. Pinho: Supervision, Project administration, Writing - Review and Editing. Olga Ferreira: Supervision, Project administration, Writing - Review & Editing.
1
Solid-liquid phase equilibrium of trans-cinnamic acid, p-coumaric acid 1
and ferulic acid in water and organic solvents: experimental and 2
modelling studies 3
Sérgio M. Vilas-Boasa,b,c, Rebeca S. Alvesc,d, Paula Brandãob, Leila M. A. Camposd, 4 João A.P. Coutinhob, Simão P. Pinhoa,c, Olga Ferreiraa,c* 5
aCentro de Investigação de Montanha (CIMO), Instituto Politécnico de Bragança, Campus de Santa Apolónia, 5300-253 Bragança, Portugal
bCICECO − Aveiro Institute of Materials, Department of Chemistry, University of Aveiro, 3810-193 Aveiro, Portugal.
cLaboratory of Separation and Reaction Engineering - Laboratory of Catalysis and Materials (LSRE-LCM), Instituto Politécnico de Bragança, Campus de Santa Apolónia, 5300-253 Bragança, Portugal
dChemical Engineering Post-Graduate Program, Salvador University (UNIFACS),
Salvador, BA 40140-110, Brazil.
*Corresponding author: Olga Ferreira
Telephone: +351 273 303 087
Fax: +351 273 313 051
E-mail: [email protected]
6
7
8
9
10
11
12
13
14
15

2
Abstract 16
The solubility of the trans isomers of cinnamic acid, p-coumaric acid and ferulic acid 17
was measured in water and seven organic solvents (methanol, ethanol, 1-propanol, 2-18
propanol, 2-butanone, ethyl acetate and acetonitrile), at 298.2 and 313.2 K, using the 19
analytical shake-flask technique. The melting temperatures and enthalpies of the solutes 20
were studied by differential scanning calorimetry, while solute solid structures were 21
identified by powder and single X-ray diffraction. 22
The NRTL-SAC model was applied to calculate the solubility of trans-cinnamic acid 23
and trans-ferulic acid in pure solvents. For trans-p-coumaric acid, the NRTL-SAC was 24
combined with the Reference Solvent Approach, as the solute melting properties could 25
not be determined. The global average relative deviations (ARD) were 32% and 41%, in 26
the correlation and prediction stages, respectively. The Abraham solvation model was 27
also applied. The global ARD were 20% for correlation and 29% for predictions, which 28
can be considered very satisfactory results for these semi-predictive models. 29
30
31
32
Keywords 33
Cinnamic acid derivatives; solubility; solid phase studies; NRTL-SAC model; Abraham 34
solvation model 35
36
37
38
39
40
41
42
43
44

3
45
1. Introduction 46
Naturally occurring phenolic acids are well studied for their bioactive properties and 47
present a wide distribution in plant material, where they can be found in the free form, 48
or conjugated to other molecules [1]. Among this family of compounds, two major 49
classes can be distinguished based on their structure: benzoic acid derivatives and 50
cinnamic acid derivatives [1,2]. In general, cinnamic acid derivatives are more abundant 51
in nature, especially ferulic acid, caffeic acid, p-coumaric acid and sinapic acid [2–4], 52
having many applications in the pharmaceutical, food, and cosmetic industries due to 53
their chemical and biological properties [2,3]. 54
The main aim of this work is to study the solubility of the trans isomers (for simplicity, 55
the prefix trans will be omitted in the text) of cinnamic acid and two derivatives (p-56
coumaric acid and ferulic acid) in water and seven pure organic solvents (methanol, 57
ethanol, 1-propanol, 2-propanol, 2-butanone, ethyl acetate and acetonitrile) at 298.2 K 58
and 313.2 K. Whenever possible, the solubility data were critically compared to 59
literature. Some solubility studies can be found for cinnamic acid [5–8], p-coumaric 60
acid [9,10], and ferulic acid [5,11–15], but for several binary systems, the solubility data 61
are reported for the first time. 62
The structures of the solutes are shown in Fig. 1. As can be seen, relatively to the 63
simplest cinnamic acid (3-phenylacrylic acid), p-coumaric acid (3-(4-64
hydroxyphenyl)acrylic acid) has an additional hydroxyl group and ferulic acid (3-(4-65
hydroxy-3-methoxyphenyl)acrylic acid) presents a hydroxyl and a methoxy group. 66
67
(a) (b) (c)
Fig. 1. Chemical structures of the trans isomers of: (a) cinnamic acid; (b) p-coumaric acid and (c) ferulic 68 acid. 69
The trans isomer is the predominant form of cinnamic acid, being Chinese cinnamon a 70
major natural source, and presents relevant pharmaceutical and biological properties, 71
such as antibacterial, anti-inflammatory, antifungal, antioxidant and antitumor activities 72

4
[16]. Cinnamic acid is also an ingredient used in several personal-care products and 73
non-cosmetic products [17]. Similarly, p-coumaric acid and its conjugates also present 74
bioactive properties in different dimensions, such as antioxidant, anti-tumour, 75
antimicrobial, antivirus, anti-inflammatory, antiplatelet aggregation, anxiolytic, 76
antipyretic, analgesic, and anti-arthritis [18]. Also, this compound has been identified as 77
a competitive inhibitor of tyrosinase, and studied as a potential skin-lightening cosmetic 78
ingredient [19]. Finally, ferulic acid is the most abundant phenolic acid found in cereal 79
grains, and in different vegetables and fruits, such as citrus fruits, banana, coffee, 80
eggplant, bamboo shoots, beetroot, cabbage, spinach, and broccoli [2,20]. It presents 81
antioxidant, antimicrobial, anti-inflammatory, anti-thrombosis, and anti-tumour 82
activities, among others. It is widely used as an ingredient in the food and cosmetic 83
areas and as a raw material for the production of other important compounds, such as 84
vanillin, sinapic acid and curcumin [20,21]. Thus, for the adequate design of products 85
and processes it is extremely relevant to know some of their physicochemical 86
properties, namely reliable solubility data in pure and mixed solvents, as the compounds 87
are in the solid state at room conditions. 88
Finally, to model the solid-liquid equilibria data, two semi-predictive thermodynamic 89
models were selected: (1) the semi-predictive Nonrandom Two-Liquid Segment 90
Activity Coefficient (NRTL-SAC) model proposed by Chen and Song [22] that was 91
already used to describe the solubility of phenolic compounds in water and organic 92
solvents [23–28]; (2) the Abraham solvation model [29–31] that has been applied to 93
calculate the solubility of benzoic acid derivatives [28,32–39], and cinnamic acid 94
derivatives [8,40]. To support the description of the solid-liquid equilibria, the melting 95
properties of the pure solutes were measured by Differential Scanning Calorimetry 96
(DSC) and solid phase studies were carried out by X-Ray Diffraction (XRD). 97
2. Experimental 98
2.1. Chemicals 99
Ultrapure water (resistivity of 18.2 MΩ·cm, free particles ≥ 0.22 μm and total organic 100
carbon < 5 μg.dm-3) was used. All the organic compounds were used as received from 101
the suppliers and are listed in Table 1. The solids were kept in a desiccator to avoid 102
water contamination. 103

5
Table 1: Mass purity (%), CAS number and source of the organic compounds used in this work. 104
a The purity was obtained in the certificate of analysis issued by the manufacturer. 105
2.2. Melting Properties 106
The melting temperatures and enthalpies were determined by DSC (model 204 F1 107
Phoenix, NETZSCH) using a nitrogen flowing system. Samples of 3 to 8 mg (± 0.1 mg) 108
were hermetically sealed into aluminum crucibles. The heating and cooling rates were 1 109
K/min and 2 K/min, respectively. The experiments were performed from 293.2 K to 110
523.2 K for cinnamic acid, from 293.2 K to 503.2 K for p-coumaric acid, and from 111
293.2 K to 473.2 K for ferulic acid. At least three runs were considered to calculate the 112
final average results. An external calibration was performed using 11 compounds 113
(water, 4-nitrotoluene, naphthalene, benzoic acid, diphenyl acetic acid, indium, 114
anthracene, tin, caffeine, bismuth and zinc). The onset value was considered as the 115
melting temperature. 116
2.3. Solubility Experiments 117
The solubility experiments were carried out by the isothermal shake-flask method, 118
which was described in detail elsewhere [27,41]. In summary, around 80 ml of a 119
saturated solution of each binary system was prepared and placed in a thermostatic bath 120
(maximum temperature deviation of ± 0.1 K). From preliminary experiments, the 121
optimum stirring and settling times were found to be 32 h and 15 h, respectively. After 122
reaching equilibrium, three samples of around 0.3 cm3 were collected from the 123
supernatant solution, using pre-heated plastic syringes coupled to a polypropylene filter 124
(0.45 μm pore size). 125
Compound Mass purity (%)a CAS number Source
trans-cinnamic acid ≥ 99.5 140-10-3 Alfa Aesar
p-coumaric acid ≥ 99.9 7400-08-0 Merck KGaA
trans-ferulic acid ≥99.9 537-73-5 Alfa Aesar
methanol ≥ 99.9 67-56-1 Carlo Erba
ethanol ≥ 99.9 64-17-5 Carlo Erba
1-propanol ≥ 99.5 71-23-8 Carlo Erba
2-propanol ≥ 99.9 67-63-0 Honeywell
2-butanone ≥ 99.5 78-93-3 Sigma-Aldrich
ethyl acetate ≥ 99.9 141-78-6 Carlo Erba
acetonitrile ≥ 99.9 75-05-8 Sigma-Aldrich

6
In previous works [27,28,41], the composition of the samples was quantified by 126
gravimetry. However, tests showed that trans-cinnamic acid was thermally unstable, 127
once it presented a weight loss of 6.3%, after remaining at 343.2 K for one week inside 128
an oven, and a weight loss of 1.3% after one month at 303.2 K (along with significant 129
color change in both cases). Therefore, the selected analytical method was UV-Vis 130
spectroscopy (model T70, PG Instruments), at wavelengths 273 nm (cinnamic acid), 131
310 nm (p-coumaric acid) and 321 nm (ferulic acid). The samples were diluted in a 132
mixture of water + ethanol (proportion 35:65 by wt.%), placed in cuvettes (5 mm 133
optical path) and then read at least three times. The calibration curves (R2 ≥ 0.998) were 134
obtained using seven standard solutions. 135
2.4. Solid-Phase Studies 136
2.4.1. Samples 137
The solid phase of the aromatic acids, as received from suppliers and crystallized after 138
evaporation of a set of selected solvents, was analyzed by powder or single crystal X-139
Ray diffraction. 140
2.4.2. Powder and Single X-ray Diffraction 141
Powder XRD data were collected on a X’Pert MPD Philips diffractometer, using Cu-Ka 142
radiation (λ = 1.5406 Å), with a curved graphite monochromator, a set incident area of 143
10 mm2, and a flat plate sample holder, in a Bragg–Brentano para-focusing optics 144
configuration. Intensity data were collected by the step counting method (step 0.02o and 145
time 5 s) in the range 5o < 2θ < 50o. 146
The cell parameters of suitable crystals of the solutes provided from suppliers as well 147
the solid samples obtained after evaporating the solvent (water, methanol, ethanol, 2-148
butanone, ethyl acetate and acetonitrile) were determined on a Bruker D8 Quest photon 149
100 CMOS, with monochromated Mo-Kα radiation (λ = 0.71073 Å) and operating at 150
150(2) K. The selected crystals were placed at 40 mm from the detector and the spots 151
were measured using different counting times (varying from 10 to 30 s). 152
3. Thermodynamic Modeling 153
3.1. The NRTL-SAC Model 154

7
The NRTL-SAC model was already applied in previous studies [22–25,28,41–43], and 155
is described in detail elsewhere [22,42]. The model describes each molecule using four 156
conceptual segments related to the different surface characteristics: hydrophobic (X), 157
hydrophilic (Z), polar attractive (Y+), and polar repulsive (Y−). These parameters were 158
reported for a large number of solvents, including those studied in this work [22,42]. 159
Therefore, only the molecular descriptors of the solute need to be estimated. 160
Assuming pure solid phase and neglecting the heat capacity change upon melting which 161
has often a small impact in equilibrium calculations, the solubility of a solid solute in a 162
liquid solvent can be calculated from the equation [44]: 163
ln �� = ���� �1 − ��� � − ln �� (1)
where �� is the mole fraction solubility of the solute S, R is the ideal gas constant, T is 164
the absolute temperature, Tm is the absolute melting temperature of the solute, ��� its 165
melting enthalpy, and �� is the activity coefficient of the solute S in the binary liquid 166
solution, here calculated using the NRTL-SAC model [22]. 167
As can be seen from Eq. (1), accurate melting properties are needed to predict the 168
solubility data. Alternatively, the NRTL-SAC model can be combined with the 169
Reference Solvent Approach (RSA), proposed by Abildskov and O'Connell [45,46]. In 170
this methodology, the use of a reference solvent eliminates the need of the melting 171
properties, being a useful tool whenever the melting properties present high 172
uncertainties or are unavailable. Briefly, the RSA can be described by: 173
ln ��� = ln ��� + ln �����, ������ − ln ��� �, �����! (2)
where ��� is the mole fraction solubility of solute S in a solvent i, ��� is the solubility of 174
the same solute in a reference solvent j, ��� �, �����! is the activity coefficient of the 175
solute in solvent i, while �����, ������ is the activity coefficient of the solute in the 176
reference solvent j. 177
As can be seen in Eq. (2), the experimental solubility of a solute in a given reference 178
solvent is used along with the activity coefficients calculated by the NRTL-SAC model. 179
For a given set of data, the optimal reference solvent is found by: 180
�"#$ % & '"()*+*
,#�-,"$% = �"#$ % & ,#�-" + ,#�-"! − .�,#�-$ + ,#�-$�"()*+*
% (3)

8
where ∑ 0�(1232 45��,�� is the error associated to the mole fraction solubilities of solute 181
S in all the solvents assuming a reference solvent j, and N is the number of experimental 182
data points in a given set. 183
3.2. The Abraham Solvation Model 184
The partition coefficient between water and a solvent (6-) can be approximated by the 185
ratio of the molar solubilities of a solute in the organic solvent (-�) and in water (-7): 186
8� = 9�9: (4)
As discussed by Abraham and co-authors [31], Eq. (4) only holds if: (a) the solid phase 187
in equilibrium with both solvents is the same; (b) the secondary medium activity 188
coefficient of the solute in the two phases is near unity; the same (undissociated, if 189
ionizable) chemical species should be present in each phase. In addition, the partition of 190
a solute between two fluid phases can be correlated by two linear free energy 191
relationships (LFERs) [29–31]. 192
log 89! = = + >? + @9 + AB + CD + EF (5)
log G�! = = + >? + @9 + AB + CD + 4H (6) 193
Eq. (5) calculates the solute partition between two condensed phases and, Eq. (6), the 194
partition between a gas phase and an organic solvent. In those equations, the uppercase 195
descriptors (E, S, A, B, V and L) represent the Abraham solute descriptors, where E is 196
the solute excess molar refractivity, S refers to the solute dipolarity/polarizability, A and 197
B account for the overall solute hydrogen bond acidity and basicity, V is the solute’s 198
McGowan characteristic molecular volume and L is the logarithm of the gas-to-199
hexadecane partition coefficient at 298.15 K. The lowercase regression coefficients and 200
constants represent condensed phase properties, already available for a large number of 201
solvents. For each solute, V can be calculated from its molecular structure. The 202
descriptor E can be calculated from the solute’s refractive index, which can be 203
experimentally obtained or, if unavailable, estimated using ACD free software. 204
For the solvents studied in this work, these coefficients have already been reported in 205
literature [31]. Regarding the solute descriptors, they can be estimated by multiple linear 206

9
regression, using experimental solubility data. Estimations of the solute descriptors have 207
been already reported for the monomeric and dimeric forms of trans-cinnamic acid [8] 208
and for the monomeric form of p-coumaric acid [40], but no information was found for 209
ferulic acid. 210
4. Results and Discussion 211
4.1. Melting Properties 212
The melting temperatures and enthalpies obtained in this work are presented in Table 2 213
along with the data found in literature [5,6,9,10,14,47–52]. In Fig. S1 of Supporting 214
Information (SI), exemplificative thermograms of trans-cinnamic acid and ferulic acid 215
are presented. 216
Table 2: Comparison of the melting temperatures and enthalpies of the studied aromatic acids found in 217 the literature and measured in this work. 218
Compound Tm/K ΔmH/kJ·mol-1 Methodology Reference
trans-cinnamic acid
406.1. ± 0.4 22.2 ± 0.8 DSC [5] 406.2 ± 0.3 22.2 ± 0.4 DSC [6]
406.2 22.6 NAa [48]
405.5 25.7 DSC [49]
404.8 22.6 DSC [50]
406.9 ± 0.2b 22.1 ± 0.1 DSC this work
p-coumaric acid 492.4 ±0.3 27.4 ± 0.9 DSC [9] 494.4 ± 0.2 34.3 ± 0.02 DSC [10]
-c -c DSC this work
ferulic acid
444.6 ±. 0.5 33.3 ± 1.2 DSC [5]
448.0d 33.5d
DSC [14] 447.7e 36.3e
445.9 ± 0.5 34.7 ± 0.2 DSC [47]
444.9 ± 0.4 31.9 ± 0.9 DSC [51]
445.1 ± 0.9 33.5 ± 0.5 DSC [52] 445.8 ± 0.2b 38.4 ± 0.2 DSC this work
a Not available. 219 b The experimental onset temperatures were considered as melting temperatures, in this work. 220 c Decomposition upon melting. 221 d Melting properties of ferulic acid as received from the supplier. 222 e Melting properties of ferulic acid recovered from an aqueous saturated solution (after evaporation of the solvent). 223
The melting properties of p-coumaric acid could not be derived from the DSC 224
experiments performed in this work due to decomposition of the samples upon melting. 225
Several experiments were performed, always showing an exothermic transition 226
immediately after an endothermic one, precluding the correct integration of the melting 227
10
peak. The melting temperatures reported by Alevizou et al. [9] and Ji et al. [10] are 228
similar, whereas the melting enthalpies present larger deviations. 229
In the case of trans-cinnamic acid, the melting temperature (406.9 ± 0.2 K) and 230
enthalpy (22.1 ± 0.2 kJ·mol-1) obtained in this work are consistent with the average 231
literature data (Tm = 405.7 ± 0.7 K and ΔmH = 23.1 ± 1.5 kJ·mol-1). For ferulic acid, the 232
melting temperature obtained in this work (445.8 ± 0.2 K) is very close to the average 233
melting temperature calculated from literature (445.7 ± 1.2 K), being closer to the value 234
reported by Emel'yanenko et al. [47]. The melting enthalpy (38.4 ± 0.2 kJ·mol-1), 235
however, is higher than the literature average (ΔmH = 33.9 ± 1.5 kJ·mol-1). Shakeel et al. 236
[14] measured the melting properties for ferulic acid obtained directly from the supplier 237
and recovered from saturated aqueous solutions, being the later much closer to the 238
melting enthalpy obtained in this work. In fact, the melting temperatures reported by the 239
authors [14] for both cases are very close, indicating that no solid phase transformation 240
occurred in the solid recovered from the aqueous mixtures. For this reason, both data 241
were included in Table 2. 242
For trans-cinnamic acid and ferulic acid, in the studied temperature range, only the 243
melting phase transition peak was identified in the thermograms. The melting peak 244
shapes of trans-cinnamic acid presented modifications over successive runs (at heating 245
rates of 1 K/min and cooling rates of 2 K/min) leading generally to lower temperature 246
and enthalpy values (as shown in Fig. S2 of SI). The samples of ferulic acid could not 247
be crystalized after melting. Therefore, only independent first runs were considered. 248
4.2. Experimental Solubilities 249
The solubilities of the trans isomers of cinnamic acid, p-coumaric acid and ferulic acid 250
in methanol, ethanol, 1-propanol, 2-propanol, 2-butanone, ethyl acetate, acetonitrile and 251
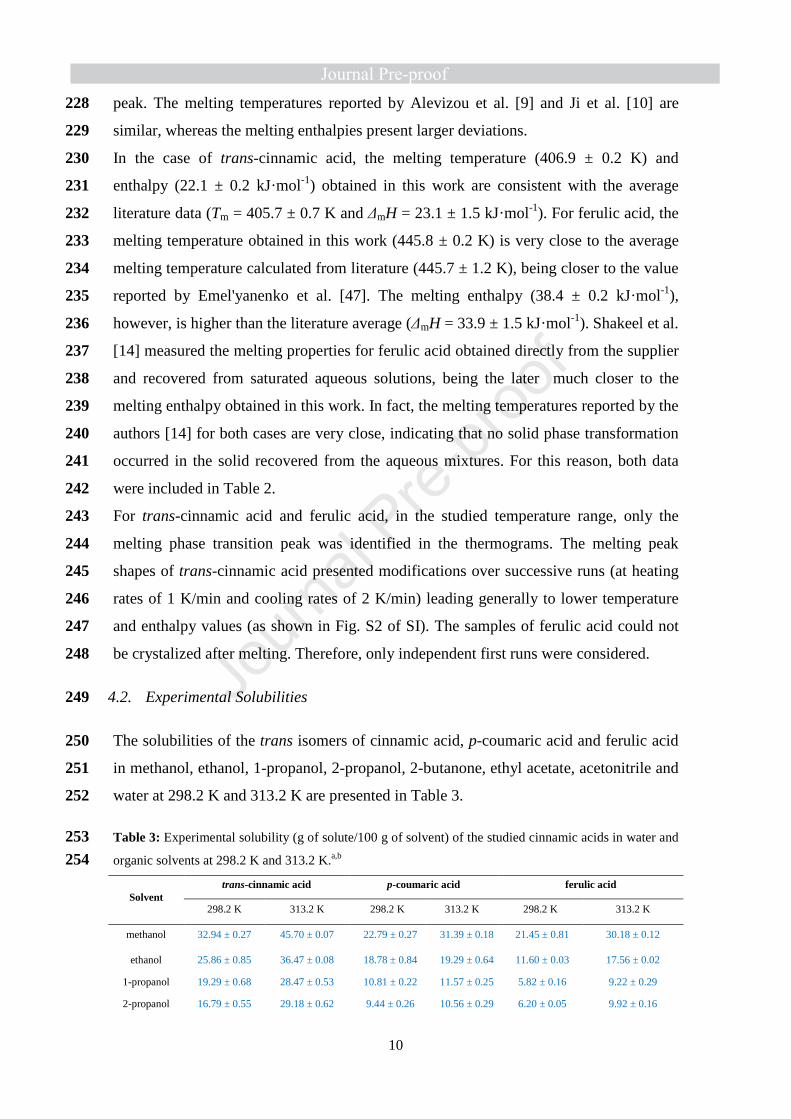
water at 298.2 K and 313.2 K are presented in Table 3. 252
Table 3: Experimental solubility (g of solute/100 g of solvent) of the studied cinnamic acids in water and 253 organic solvents at 298.2 K and 313.2 K.a,b 254
Solvent trans-cinnamic acid p-coumaric acid ferulic acid
298.2 K 313.2 K 298.2 K 313.2 K 298.2 K 313.2 K
methanol 32.94 ± 0.27 45.70 ± 0.07 22.79 ± 0.27 31.39 ± 0.18 21.45 ± 0.81 30.18 ± 0.12
ethanol 25.86 ± 0.85 36.47 ± 0.08 18.78 ± 0.84 19.29 ± 0.64 11.60 ± 0.03 17.56 ± 0.02
1-propanol 19.29 ± 0.68 28.47 ± 0.53 10.81 ± 0.22 11.57 ± 0.25 5.82 ± 0.16 9.22 ± 0.29
2-propanol 16.79 ± 0.55 29.18 ± 0.62 9.44 ± 0.26 10.56 ± 0.29 6.20 ± 0.05 9.92 ± 0.16

11
2-butanone 22.46 ± 0.15 31.93 ± 1.00 8.39 ± 0.28 10.19 ± 0.37 8.41 ± 0.16 11.74 ± 0.51
ethyl acetate 13.05 ± 0.24 19.86 ± 0.27 1.97 ± 0.11 2.85 ± 0.03 2.91 ± 0.08 4.49 ± 0.01
acetonitrile 6.26 ± 0.01 11.42 ± 0.03 1.20 ± 0.03 2.02 ± 0.04 2.19 ± 0.03 3.85 ± 0.06
water 0.042 ± 0.001 0.083 ± 0.001 0.056 ± 0.001 0.133 ± 0.003 0.060 ± 0.001 0.126 ± 0.003
aTemperature and pressure standard uncertainties are u T! = 0.10 K and ur p! = 0.05, respectively. 255 bStandard deviations are placed after plus-minus sign. 256
Each reported data point is the average of three samples. The consistency of the 257
measurements is confirmed by the low coefficients of variation, lower than 5.5%. 258
In all cases, the solubility increases as the temperature increases, being larger in 259
alcohols and 2-butanone and considerably smaller in water. This behavior was observed 260
in previous works with benzoic acid derivatives [27,28].... Among the solutes studied, 261
trans-cinnamic acid is the most soluble solute in all the organic solvents, whereas 262
ferulic acid and p-coumaric acid have similar solubilities. The latter are more soluble in 263
water than cinnamic acid. 264
Trans-cinnamic acid presents the lowest melting properties compared to the other two 265
acids (discussed in Section 4.1), meaning it has the highest ideal solubility. This effect 266
seems to dominate over the solute-polar solvent interactions that could be higher in the 267
cases of p-coumaric acid and ferulic acid due to the presence of an additional polar 268
hydroxyl group, which certainly contributes for their slightly higher (mole fraction) 269
solubility in water. 270
In the case of systems containing alcohols, the solubilities follow the order: trans-271
cinnamic-acid > p-coumaric acid > ferulic acid. Also, the solubility decreases as the 272
alkyl chain length of the alcohol increases. The increase in the solubility of p-coumaric 273
acid in ethanol from 298.2 K to 313.2 K (2.7%) is surprisingly much lower than the 274
average increase of the solubilities of the solutes in alcohols (26.4%), but also of the 275
other solutes in ethanol. 276
For ethyl acetate, 2-butanone and acetonitrile, trans-cinnamic acid is also the most 277
soluble solute, but ferulic acid presents higher solubilities than p-coumaric acid. In this 278
case, the presence of the methoxy group seems to increase the interactions of ferulic 279
acid with the polar non-associative solvents. 280
4.3. Comparison with Literature Data 281
The solubility data obtained in this work was critically compared to literature data.[5–282
15,53] In Fig. 2, a comparison between the solubility data in ethanol and water is 283

12
presented, while other relevant comparisons are given in Table S1 and Fig. S3-S5 in 284
Supporting Information. 285
Fig. 2: Comparison of the experimental solubility data obtained in this work with literature data [5–8,10–286 15]: (a) cinnamic acid + ethanol; (b) p-coumaric acid + ethanol; (c) ferulic acid + ethanol; (d) cinnamic 287 acid + water; (e) ferulic acid + water. 288
In general, the solubilities obtained in this work are in good agreement with the 289
literature data. For example, the solubilities in ethanol or water have ARD (calculated as 290
the ratio between the absolute value of the difference between the solubility data 291
15
25
35
45
55
280 290 300 310 320 330 340
Sol
ubili
ty (
g / 1
00 g
of s
olve
nt)
Temperature (K)
aLi et al. [6]
Noubigh and Akrem [7]
Bradley et al. [8]
This work
14
18
22
26
30
34
38
290 300 310 320 330 340
Sol
ubili
ty (
g / 1
00 g
of s
olve
nt)
Temperature (K)
bJi et al. [10]
This work
7
11
15
19
23
27
280 290 300 310 320 330 340
Sol
ubili
ty (
g / 1
00 g
of s
olve
nt)
Temperature (K)
cZhou et al. [11]Bitencourt et al. [12]Shakeel et al. [14]This work
0.01
0.06
0.11
0.16
0.21
0.26
0.31
280 290 300 310 320 330 340
Sol
ubili
ty (
g / 1
00 g
of s
olve
nt)
Temperature (K)
dMota et al. [5]Noubigh and Akrem [7]Bradley et al. [8]This work
0.00
0.08
0.16
0.24
0.32
280 290 300 310 320 330 340
Sol
ubili
ty (
g / 1
00 g
of s
olve
nt)
Temperature (K)
eMota et al. [5]Zhou et al. [11]Bitencourt et al. [12]Haq et al. [13]Shakeel et al. [14]Shakeel et al. [15]This work

13
obtained in this work and the average value from literature, divided by the average 292
value from literature) lower than 13% for ethanol and lower than 5% for water, with the 293
exception of the system p-coumaric acid + ethanol at 313.15 K, where the solubility 294
obtained in this work is 4 g/100 g of solvent (ARD of 17%) lower than the value 295
reported by Ji et al. [10]. The solubility of ferulic acid in water reported by Noubigh et 296
al. [53] is much higher than all the other data found in literature [5,11–15], and were not 297
included in Fig. 2 for practical viewing purposes. 298
A point deserving attention is the slope of the solubility change with temperature (Fig. 299
2b) in the systems p-coumaric acid + alcohol (ethanol, 1-propanol, 2-propanol), in Figs. 300
2b, S4b and S4c. Ji and co-authors [10] employed the gravimetric method for the 301
quantification analysis of the saturated solution, while the UV-Vis spectroscopy was 302
preferred in this work. As discussed by Königsberger [54], several parameters, from 303
compound purities to the analytical methods influence the final solubility value. To 304
check the accuracy of the solubility values obtained in this work, the experiments were 305
repeated for p-coumaric acid in alcohols, at both temperatures, but no significant 306
changes were observed. 307
4.4. Solid Phase Studies 308
The solid phase of the aromatic acids, as received from suppliers as well as crystallized 309
after evaporation of a set of selected solvents, was analyzed by powder or single crystal 310
X-ray diffraction. It was found that, for all solutes, the solid phase recovered from 311
evaporating the solvent kept the same structure when compared to that of the supplier. 312
The trans-cinnamic acid obtained from the supplier had very small crystals that were 313
analyzed by powder X-ray diffraction, showing a pattern comparable to that published 314
in CCDC database with number 705511 (Fig. S6). The solid phases of trans-cinnamic 315
acid obtained after evaporation from water, ethanol, methanol, ethyl acetate, 2-butanone 316
and acetonitrile solutions showed suitable crystals to be analyzed by single crystal X-317
ray diffraction. All solids crystalized in monoclinic system P with the cell parameters 318
a=5.57 Å, b=17.51 Å, c=7.61 Å and β=96.35º, which are comparable to trans-cinnamic 319
acid published with CCDC number 705511. 320
Crystals of p-coumaric acid from supplier and obtained after evaporation from water, 321
methanol, ethyl acetate, 2-butanone and acetonitrile solutions were indexed by single 322
crystal X-ray diffraction with the following cell parameters: a=8.70 Å, b=5.22 Å, 323

14
c=17.06 Å and β=100.43º, monoclinic P, which are comparable to p-coumaric acid 324
published with CCDC number 945006. Additionally, all samples were analyzed by 325
powder X-ray diffraction showing similar powder patterns. Fig. S7 compares the 326
powder pattern of p-coumaric acid from supplier and the powder pattern simulated from 327
the single crystal data of the sample published in CCDC database with number 945006. 328
The crystals of trans-ferulic acid from supplier, and obtained after evaporation from 329
water, methanol, ethanol, ethyl acetate and 2-butanone solutions, crystallized in the 330
monoclinic system P with the cell parameters a=4.61 Å, b=16.76 Å, c=11.85 Å and 331
β=91.55º, comparable to trans-ferulic acid deposited in CCDC database with number 332
950899. The structure of the bulk samples was analyzed by powder X-ray diffraction 333
showing all the same powder pattern as the trans-ferulic acid sample with CCDC 334
number of 950899 (Fig. S8). 335
336
4.5. Thermodynamic Modelling 337
4.5.1. NRTL-SAC and NRTL-SAC + RSA 338
The optimization of the NRTL-SAC segment descriptors of the solutes was carried out 339
using the routine Isqnonlin (MATLAB software version R2018a). The following 340
objective function was minimized using a nonlinear least-squares method: 341
_ = & `a��bcd − ��efgha��bcd i�
(7)
where �� is the mole fraction solubility in the solvent i and the superscripts “calc” and 342
“exp” mean the calculated and experimental values, respectively. 343
To assure that the NRTL-SAC parameters provide a good predictive character to the 344
model it is advisable to include, in the correlation step, solubility data obtained in 345
solvents with different surface characteristics. Therefore, the experimental solubilities 346
measured in seven solvents (water, methanol, ethanol, 2-propanol, ethyl acetate, 347
acetonitrile and 2-butanone) were used to correlate the four conceptual segment 348
parameters (X, Y-, Y+, Z) for each solute. Afterwards, the solubility in 1-propanol (data 349
from this work) and in other organic solvents [6,8,10,11,14] was predicted. The 350
deviations between the experimental and calculated data were calculated as: 351

15
Bj %! = 1l8 & a��mcd − ��efgea��mcd�∗ 100 (8)
where NP is the number of data points. 352
As discussed before, the melting properties obtained for trans-cinnamic acid and trans-353
ferulic acid are in satisfactory agreement with literature. For these two solutes, the 354
NRTL-SAC model could be directly combined with Eq. (1). Nevertheless, the melting 355
temperature and enthalpy could not be determined in this work for p-coumaric acid, and 356
high uncertainties are observed in the literature data, especially for the melting 357
enthalpies. For that reason, the RSA proposed by Abildskov and O’Connell [45,46] was 358
in this case combined with the NRTL-SAC model. 359
The molecular descriptors of the solutes obtained using both correlation approaches 360
(NRTL-SAC or NRTL-SAC + RSA), the outlier solvent (presenting the highest ARD) 361
and the global ARD are presented in Table 4. 362
Table 4: NRTL-SAC estimated parameters, outlier solvent and ARD (%) for each solute. 363 Compound X Y- Y+ Z Model Outliers ARD (%)
trans-cinnamic
acid 0.708 0.000 0.000 0.524 NRTL-SAC 2-butanone 23
p-coumaric acid 0.702 0.023 0.000 1.702 NRTL-SAC + RSAa ethyl acetate/
2-butanone 38
ferulic acid 0.456 0.816 0.583 0.000 NRTL-SAC methanol 36 aThe reference solvent is acetonitrile. 364
The results above show that both NRTL-SAC and NRTL-SAC + RSA approaches 365
adequately describe the solubilities of the studied compounds, presenting ARDs varying 366
from 23% to 38%, which are satisfactory for this semi-predictive model and close to 367
values obtained previously for similar binary systems [23,24,27,28]. Attempts to 368
estimate the NRTL-SAC segment descriptors of trans-cinnamic and ferulic acids using 369
the RSA were performed, but no significant improvements in the global ARDs were 370
accomplished. After, the models were applied to predict the solubility in other solvents 371
at 298.2 K and 313.2 K (+/- 1 K). Those systems are shown in Table S2 of SI. A 372
complete overview of the correlation and prediction results, using either the NRTL-373
SAC or NRTL-SAC + RSA, is presented in Fig. 3. 374

16
Fig. 3: Comparison between the experimental and calculated solubility data by the NRTL-SAC (trans-375 cinnamic acid and ferulic acid) and NRTL-SAC + RSA (p-coumaric acid): a) correlation; b) prediction. 376 The symbols correspond to: ○, trans-cinnamic acid; □, p-coumaric acid; Δ, ferulic acid. 377
As can be seen in Fig. 3, a very good description is achieved for aqueous systems 378
(maximum ARDs of 25%). The model also satisfactorily correlates the solubilities in 379
acetonitrile (ARD of 30%) and alcohols in general (global ARD of 26%). The highest 380
ARDs are obtained for the systems containing ethyl acetate and 2-butanone (ARDs of 381
45% and 60%, respectively). In general, the model provides satisfactory predictions for 382
systems including alcohols, ethers, esters and ketones. The global ARDs for trans-383
cinnamic acid, p-coumaric acid and ferulic acid are 40%, 40% and 44%, respectively. 384
The worse predictions were found for the solubility in dimethyl sulfoxide, ethylene 385
glycol, and methyl acetate, and generally, when deviations are more significant, the 386
model underestimates the solubility values. 387
388
4.5.2. Abraham Solvation Model 389
The solute descriptors A, B and S were obtained by multiple linear regression using 390
solid-liquid equilibrium data only (Eq. 5). From our previous experience with benzoic 391
acid derivatives [27,28], the robustness of the parameters relies in the number and 392
diversity of systems included in the correlation. For instance, the inclusion of 393
experimental solubility data in dimethylformamide (DMF) in the correlation set, 394
5E-05
0.0005
0.005
0.05
0.5
5E-05 0.0005 0.005 0.05 0.5
x cal
xexp
a
Methanol Ethanol 2-Propanol
2-Butanone Ethyl acetate Acetonitrile
Water
Color scheme
0.0005
0.005
0.05
0.5
0.0005 0.005 0.05 0.5
x cal
c
xexp
b
1-Propanol 1-ButanolIsobutanol 2-Butanol1-Pentanol Ethylene glycolAcetone Methyl acetatePropyl acetate Butyl acetateDiethyl ether TetrahydrofuranDimethyl sulfoxide
Color scheme

17
considerably improved the overall predictions [28]. Therefore, data reported by Bradley 395
et al. [8] and Shakeel et al. [14] for the solubility of trans-cinnamic acid and ferulic acid 396
in another polar aprotic solvent, dimethyl sulfoxide (DMSO), were added to the same 397
correlation set already used with the NRTL-SAC model. In the Abraham solvation 398
model, the data are expressed in molar concentration (Eq. 4), so all the experimental 399
solubilities were converted from mole fraction (�-o�p) to molar solubilities (-�o�p) (Table 400
S3 of SI). A global ARD of 20% was obtained in the correlation step. The model 401
parameters, the outlier solvent and the ARD% are shown in Table 5. 402
Table 5: Estimated solute parameters in the Abraham solvation model, outlier solvent and ARD (%) for 403 each solute. 404
Compound Ea S A B Vb Outlier ARD (%)
trans-cinnamic
acid 1.301 1.100 0.482 0.479 1.171 Methanol 14
p-coumaric acid 1.582 1.781 1.143 0.546 1.229 ethyl acetate 26
ferulic acid 1.472 1.138 0.290 0.877 1.429 ethyl acetate 18 a Calculated following the procedure described by Abraham et al.[30] using the index of refraction of the solutes obtained from the 405 ACD free software.[55] 406 b Calculated from the molecular structures of the solutes, as described by Abraham.[29] 407
408
Like in a previous work [27,28], the results obtained in the correlation show an 409
excellent description of the SLE. To the best of our knowledge, the Abraham solvation 410
descriptors are reported for the first time for ferulic acid. Bradley et al. [8] and Acree et 411
al. [40] have already applied the model to describe the SLE of the monomeric and 412
dimeric forms of trans-cinnamic acid and the monomeric form of p-coumaric acid, 413
respectively. In the first case, the authors considered the solubility data of trans-414
cinnamic acid in water and in 21 organic solvents along with water-solvent partition 415
coefficient data of five systems. The solute parameters reported for the monomeric form 416
[8] are very close to the parameters found in this work, being the largest deviation 417
observed for the E parameter (1.140 compared to 1.301 obtained in this work). The 418
authors estimated E through a group contribution model proposed by Platts et al. [56], 419
which allowed the calculation of different values for both monomeric and dimeric forms 420
of the cinnamic acid, which is different from the methodology used in this work. It is 421
relevant to mention that, as discussed by Bradley et al. [8] and Acree et al. [40], 422
cinnamic acids might dimerize in less polar solvents, such as alkyl benzenes, 423
chloroalkanes and nonpolar hydrocarbons. As the set of solvents selected to correlate 424

18
the parameters of solutes in both NRTL-SAC and Abraham models are composed by 425
polar solvents, such as alcohols, ketones, esters and nitriles, the parameters obtained in 426
this work are expected to provide reliable solubility predictions for systems where the 427
solute is predominantly present in the monomeric form. 428
For comparison purposes, the parameters were re-estimated, considering all the 429
solubility data available for trans-cinnamic acid in its monomeric form, in the 430
correlation step. As can be seen in Table S4 of SI, no significant changes were observed 431
either in the parameter values nor in the relative deviations. It shows the robustness of 432
the models, more clearly for the Abraham solvation model, even when using a small 433
number of solvents in the correlation. 434
In the case of p-coumaric acid, Acree and co-authors [40] regressed the Abraham solute 435
descriptors using 32 LFERs, including expressions derived from Eqs. (5-6). The 436
parameters reported by the authors [40] are comparable to those calculated in this work. 437
Despite the broader number of expressions used in the correlation of the parameters, the 438
authors did not include the experimental solubility of p-coumaric acid in water, 439
regressing it along with the molar concentration of the solute in the gas phase, obtained 440
from Eq. (6) and the parameters S, A and B. Besides, the value of the parameter E 441
reported by the authors (1.330) is slightly lower than the value estimated in this work 442
(1.582), which also contributes for small differences in the regressed parameters. 443
The parameters presented in Table 5 were used to estimate the solubilities of the acids 444
in 1-propanol and other organic solvents. An overview of the correlation and prediction 445
results is presented in Fig. 4. 446

19
Fig. 4: Comparison between experimental and calculated solubility data by the Abraham solvation model: 447 (a) correlation, (b) prediction. The symbols correspond to: ○, trans-cinnamic acid; □, p-coumaric acid; Δ, 448 ferulic acid. 449
Even if the number of LFERs used in the regression of the solute parameters is reduced, 450
the predicted solubilities are in very good agreement with the experimental solubility 451
data, even for solvents very structurally different, such as propylene glycol (ARD of 452
21%) and tetrahydrofuran (ARD of 19%). The global ARDs obtained were 18% for 453
trans-cinnamic acid, 26% for p-coumaric acid and 46% for ferulic acid, being the 454
highest deviations found for the system ferulic acid + butyl acetate. 455
One of the advantages of the Abraham solvation model is that the descriptors are related 456
to some physicochemical properties of the solute. According to Abraham and co-457
authors [57], the acidity descriptor (A) represents the strength of H-bonds formed by the 458
donor groups when they interact with lone pairs of acceptor groups present in the 459
solvent, whereas the basicity descriptor (B) is related to the strength of the lone pairs of 460
acceptor groups of the solute when there is interaction between the solute and solvents 461
presenting H-bond donor groups. Thus, the presence of hydroxyl groups increases the 462
H-bond acidity of the solute, whereas intramolecular hydrogen bonds tend to reduce it. 463
Looking at the aromatic acids studied in this work, p-coumaric acid presents the highest 464
value for the parameter A (1.143), followed by trans-cinnamic acid (0.482) and trans-465
ferulic acid (0.290). The presence of the hydroxyl group in the para position of the 466
0.001
0.01
0.1
1
0.001 0.01 0.1 1
x cal
c
xexp
a
Methanol Ethanol
2-Propanol 2-Butanone
Ethyl acetate Acetonitrile
Dimethyl sulfoxide
Color scheme
0.01
0.02
0.04
0.08
0.16
0.32
0.01 0.02 0.04 0.08 0.16 0.32
x cal
c
xexp
b
1-Propanol 1-ButanolIsobutanol 2-Butanol1-Pentanol 2-PentanolEthylene glycol Propylene glycolAcetone Methyl acetatePropyl acetate Butyl acetateDiethyl ether Tetrahydrofuran
Color scheme

20
aromatic ring significantly increases the acidity of p-coumaric acid [58] when compared 467
to trans-cinnamic acid, but the presence of the methoxy group in the meta position in 468
trans-ferulic acid probably leads to intramolecular hydrogen bond with the hydroxyl 469
group in the para position, which only partially explains the decrease of the acidity 470
descriptor. Regarding the basicity character, the values of B progressively decrease in 471
the following order: ferulic acid > p-coumaric acid > trans-cinnamic acid, which 472
matches very consistently the number of hydrogen acceptors in the molecules. 473
5. Conclusions 474
In this work, experimental solubility data of three cinnamic acids (trans-cinnamic acid, 475
p-coumaric acid and ferulic acid) in water and seven pure organic solvents at 298.2 K 476
and 313.2 K are reported. A good agreement with literature was found for all the 477
systems containing trans-cinnamic acid, while some inconsistences were found for the 478
solubility of p-coumaric acid and ferulic acid in alcohols, especially at 313.2 K. 479
The melting temperatures and melting enthalpies of trans-cinnamic acid and ferulic acid 480
were determined by DSC. The melting temperatures of both acids and melting enthalpy 481
of trans-cinnamic acid were in excellent agreement with the literature average value, 482
whereas the melting enthalpy of ferulic acid was slightly higher. The melting properties 483
of p-coumaric acid could not be measured due to its decomposition upon melting. The 484
solid phase analysis showed that the solute structure after the evaporation of the 485
solvents corresponds to the structure of the compound as received from the suppliers. 486
The NRTL-SAC was successfully employed to describe the SLE of trans-cinnamic acid 487
and ferulic acid, reaching global ARD of 31% for the correlations and 42% for the 488
predictions. Once the melting properties could not be measured for p-coumaric acid, the 489
NRTL-SAC model was combined with the RSA to represent the solubility data. 490
Selecting acetonitrile as the reference solvent, the obtained ARDs for the correlation 491
and prediction were 38% and 40%, respectively. 492
The Abraham solvation model was also applied to correlate and predict the solubility in 493
organic solvents at 298.2 K. The obtained ARDs obtained in the correlation step for 494
trans-cinnamic acid, p-coumaric acid and trans-ferulic acid were 14%, 26% and 18%, 495
respectively, whereas a very satisfactory global ARD for the predictions was found 496
(29%). 497
In general, the thermodynamic models used in this work provided an adequate 498
description of the solid-liquid equilibria using a reduced set of experimental solubility 499

21
data and estimating only a few number of parameters. The ability of estimating 500
solubilities at different temperatures is one of the main advantages of NRTL-SAC, and 501
the model still provides solubility estimates comparable to the experimental data for 502
most of the studied systems. Nevertheless, the Abraham solvation model provides more 503
robust predictions for the solubility of the three aromatic acids at 298.15 K. 504
Acknowledgments 505
This work was developed within the scope of the project CICECO-Aveiro Institute of 506
Materials, UIDB/50011/2020 & UIDP/50011/2020, and CIMO-Mountain Research 507
Center, UIDB/00690/2020, both financed by national funds through the Portuguese 508
Foundation for Science and Technology/MCTES. We also acknowledge the support of 509
the projects “AIProcMat@N2020 - Advanced Industrial Processes and Materials for a 510
Sustainable Northern Region of Portugal 2020”, with the reference NORTE-01-0145-511
FEDER-000006, supported by Norte Portugal Regional Operational Programme 512
(NORTE 2020), under the Portugal 2020 Partnership Agreement, through the European 513
Regional Development Fund (ERDF); and project AllNat - POCI-01-0145-FEDER-514
030463, funded by the European Regional Development Fund (ERDF) through the 515
Competitiveness and Internationalization Operational Program (COMPETE2020-POCI) 516
and national funding from the Foundation for Science and Technology (FCT, Portugal). 517
S. M. Vilas-Boas thanks the financial support provided by FCT PhD grant 518
(SFRH/BD/138149/2018). 519
Appendix A. Supporting Information 520
521
References 522
[1] L.M.L. Nollet, J.A. Gutierrez-Uribe, Phenolic Compounds in Food: Characterization 523
and Analysis, CRC Press, Boca Raton, 2018. 524
[2] S. Lafay, A. Gil-Izquierdo, Bioavailability of phenolic acids, Phytochem. Rev. 7 525
(2008) 301–311. 526
[3] M. Sova, Antioxidant and antimicrobial ativities of cinnamic acid derivatives, Mini-527
Reviews Med. Chem. 12 (2012) 749–767. 528
[4] S.A. Heleno, A. Martins, M.J.R.P. Queiroz, I.C.F.R. Ferreira, Bioactivity of phenolic 529
acids: Metabolites versus parent compounds: A review, Food Chem. 173 (2015) 501–530
513. 531

22
[5] F.L. Mota, A.J. Queimada, S.P. Pinho, E.A. Macedo, Aqueous Solubility of Some 532
Natural Phenolic Compounds, Ind. Eng. Chem. Res. 47 (2008) 5182–5189. 533
[6] J. Li, Z.X. Zeng, L. Sun, W.L. Xue, H.H. Wang, Solid-Liquid Phase Equilibrium of 534
trans-Cinnamic Acid in Several Alcohols: Measurements and Thermodynamic 535
Modeling, J. Chem. Eng. Data. 61 (2016) 1192–1198. 536
[7] A. Noubigh, A. Akremi, Solution thermodynamics of trans‑Cinnamic acid in 537
(methanol + water) and (ethanol + water) mixtures at different temperatures, J. Mol. 538
Liq. 274 (2019) 752–758. 539
[8] J.C. Bradley, M.H. Abraham, W.E. Acree, A.S.I.D. Lang, S.N. Beck, D.A. Bulger, 540
E.A. Clark, L.N. Condron, S.T. Costa, E.M. Curtin, S.B. Kurtu, M.I. Mangir, M.J. 541
McBride, Determination of Abraham model solute descriptors for the monomeric and 542
dimeric forms of trans-cinnamic acid using measured solubilities from the Open 543
Notebook Science Challenge, Chem. Cent. J. 9:11 (2015) doi:10.1186/s13065-015-544
0080-9. 545
[9] E.I. Alevizou, E.C. Voutsas, Solubilities of p-coumaric and caffeic acid in ionic 546
liquids and organic solvents, J. Chem. Thermodyn. 62 (2013) 69–78. 547
[10] W. Ji, Q. Meng, P. Li, B. Yang, F. Wang, L. Ding, B. Wang, Measurement and 548
Correlation of the Solubility of p‑Coumaric Acid in Nine Pure and Water + Ethanol 549
Mixed Solvents at Temperatures from 293.15 to 333.15 K, J. Chem. Eng. Data. 61 550
(2016) 3457–3465. 551
[11] C. Zhou, X. Shi, H. Wang, N. An, Measurement and Correlation of Solubilities 552
of Adipic Acid in Different Solvents, J. Chem. Ind. Eng. 11 (2007) 2705–2709. 553
[12] R.G. Bitencourt, F.A. Cabral, A.J.A. Meirelles, Ferulic acid solubility in 554
supercritical carbon dioxide, ethanol and water mixtures, J. Chem. Thermodyn. 103 555
(2016) 285–291. 556
[13] N. Haq, N.A. Siddiqui, F. Shakeel, Solubility and molecular interactions of 557
ferulic acid in various (isopropanol + water) mixtures, J. Pharm. Pharmacol. 69 (2017) 558
1485–1494. 559
[14] F. Shakeel, M. Salem-Bekhit, N. Haq, N.A. Siddiqui, Solubility and 560
thermodynamics of ferulic acid in different neat solvents: Measurement, correlation and 561
molecular interactions, J. Mol. Liq. 236 (2017) 144–150. 562
[15] F. Shakeel, N. Haq, N.A. Siddiqui, Thermodynamic solubility and solvation 563
behavior of ferulic acid in different (PEG-400 + water) binary solvent mixtures, Drug 564
Dev. Ind. Pharm. 45 (2019) 1468–1476. 565
23
[16] H. Wang, Q. Li, W. Deng, E. Omari-Siaw, Q. Wang, S. Wang, S. Wang, X. Cao, 566
X. Xu, J. Yu, Self-nanoemulsifying drug delivery system of trans-cinnamic acid: 567
Formulation development and pharmacodynamic evaluation in alloxan-induced type 2 568
diabetic rat model, Drug Dev. Res. 76 (2015) 82–93. 569
[17] C.S. Letizia, J. Cocchiara, A. Lapczynski, J. Lalko, A.M. Api, Fragrance 570
material review on cinnamic acid, Food Chem. Toxicol. 43 (2005) 925–943. 571
[18] K. Pei, J. Ou, J. Huang, S. Ou, p-Coumaric acid and its conjugates: Dietary 572
sources, pharmacokinetic properties and biological activities, J. Sci. Food Agric. 96 573
(2016) 2952–2962. 574
[19] Y.C. Boo, p-Coumaric Acid as An Active Ingredient in Cosmetics: A Review 575
Focusing on its Antimelanogenic Effects, Antioxidants. 8 (2019) 275. 576
[20] Z. Zhao, M.H. Moghadasian, Chemistry, natural sources, dietary intake and 577
pharmacokinetic properties of ferulic acid: A review, Food Chem. 109 (2008) 691–702. 578
[21] S. Ou, K.C. Kwok, Ferulic acid: Pharmaceutical functions, preparation and 579
applications in foods, J. Sci. Food Agric. 84 (2004) 1261–1269. 580
[22] C.-C. Chen, Y. Song, Solubility modeling with NRTL segment activity 581
coefficient model, Ind. Eng. Chem. Res. 43 (2004) 8354–8362. 582
[23] F.L. Mota, A.P. Carneiro, A.J. Queimada, S.P. Pinho, E.A. Macedo, 583
Temperature and solvent effects in the solubility of some pharmaceutical compounds: 584
Measurements and modeling, Eur. J. Pharm. Sci. 37 (2009) 499–507. 585
[24] F.L. Mota, A.J. Queimada, A.E. Andreatta, S.P. Pinho, E.A. Macedo, 586
Calculation of drug-like molecules solubility using predictive activity coefficient 587
models, Fluid Phase Equilib. 322–323 (2012) 48–55. 588
[25] E. Sheikholeslamzadeh, S. Rohani, Solubility prediction of pharmaceutical and 589
chemical compounds in pure and mixed solvents using predictive models, Ind. Eng. 590
Chem. Res. 51 (2012) 464–473. 591
[26] Y. Feng, W. Tang, Y. Huang, Y. Xiong, L. Chen, Y. Liu, Y. Li, (Solid + liquid) 592
phase equilibria of tetraphenyl piperazine-1, 4-diyldiphosphonate in pure solvents, J. 593
Chem. Thermodyn. 78 (2014) 143–151. 594
[27] S.M. Vilas-Boas, P. Brandão, M.A.R. Martins, L.P. Silva, T.B. Schreiner, L. 595
Fernandes, O. Ferreira, S.P. Pinho, Solid phase studies and solubility of isomeric 596
phenolic acids in water and organic solvents, J. Mol. Liq. 272 (2018) 1048–1057. 597
[28] S.M. Vilas-Boas, V. Vieira, P. Brandão, R.S. Alves, J.A.P. Coutinho, S.P. Pinho, 598
O. Ferreira, Solvent and temperature effects on the solubility of syringic, vanillic or 599

24
veratric acids: Experimental, modeling and solid phase studies, J. Mol. Liq. 289 (2019) 600
111089. 601
[29] M.H. Abraham, Scales of Solute Hydrogen-bonding: Their Construction and 602
Application to Physicochemical and Biochemical Processes, Chem. Soc. Rev. 096 603
(1992) 73–83. 604
[30] M.H. Abraham, A. Ibrahim, A.M. Zissimos, Determination of sets of solute 605
descriptors from chromatographic measurements, J. Chromatogr. A. 1037 (2004) 29–606
47. 607
[31] M.H. Abraham, R.E. Smith, R. Luchtefeld, A.J. Boorem, R. Luo, W.E. Acree 608
Jr., Prediction of Solubility of Drugs and Other Compounds in Organic Solvents, J. 609
Pharm. Sci. 99 (2010) 1500–1515. 610
[32] K.R. Hoover, D.M. Stovall, E. Pustejovsky, R. Coaxum, K. Pop, W.E. Acree Jr., 611
M.H. Abraham, Solubility of crystalline nonelectrolyte solutes in organic solvents: 612
Mathematical correlation of 2-methoxybenzoic acid and 4-methoxybenzoic acid 613
solubilities with the Abraham solvation parameter model, Can. J. Chem. 82 (2004) 614
1353–1360. 615
[33] D.M. Stoval, C. Givens, S. Keown, K.R. Hoover, R. Barnes, C. Harris, J. 616
Lozano, M. Nguyen, E. Rodriguez, W.E. Acree Jr., M.H. Abraham, Solubility of 617
crystalline nonelectrolyte solutes in organic solvents: mathematical correlation of 4-618
chloro-3-nitrobenzoic acid and 2-chloro-5- nitrobenzoic acid solubilities with the 619
Abraham solvation parameter model, Phys. Chem. Liq. 43 (2005) 351–360. 620
[34] C.R. Daniels, A.K. Charlton, R.M. Wold, W.E. Acree, Jr., M.H. Abraham, 621
Thermochemical behavior of dissolved carboxylic acid solutes: Solubilities of 3-622
methylbenzoic acid and 4-chlorobenzoic acid in organic solvents, Can. J. Chem. 81 623
(2003) 1492–1501. 624
[35] A.K. Charlton, C.R. Daniels, R.M. Wold, E. Pustejovsky, W.E. Acree, M.H. 625
Abraham, Solubility of crystalline nonelectrolyte solutes in organic solvents: 626
Mathematical correlation of 3-nitrobenzoic acid solubilities with the Abraham general 627
solvation model, J. Mol. Liq. 116 (2005) 19–28. 628
[36] S. Ye, M. Saifullah, L.M. Grubbs, M.C. McMillan-Wiggins, P. Acosta, D. 629
Mejorado, I. Flores, W.E. Acree, M.H. Abraham, Determination of the Abraham model 630
solute descriptors for 3,5-dinitro-2-methylbenzoic acid from measured solubility data in 631
organic solvents, Phys. Chem. Liq. 49 (2011) 821–829. 632
[37] W.E. Acree, K.R. Bowen, M.Y. Horton, M.H. Abraham, Computation of 633

25
Abraham model solute descriptors for 3-methyl-4-nitrobenzoic acid from measured 634
solubility data, Phys. Chem. Liq. 55 (2017) 482–491. 635
[38] K.R. Hoover, R. Coaxum, E. Pustejovsky, D.M. Stovall, W.E. Acree, M.H. 636
Abraham, Thermochemical behavior of dissolved carboxylic acid solutes: part 4 – 637
mathematical correlation of 4-nitrobenzoic acid solubilities with the abraham solvation 638
parameter model, Phys. Chem. Liq. 42 (2004) 339–347. 639
[39] K.R. Hoover, K. Pop, W.E. Acree Jr., M.H. Abraham, Solubility of crystalline 640
nonelectrolyte solutes in organic solvents: mathematical correlation of 3-chlorobenzoic 641
acid solubilities with the Abraham solvation parameter model, South African J. Chem. 642
58 (2005) 25–29. 643
[40] W.E. Acree, M. Barrera, M.H. Abraham, Comment on “measurement and 644
correlation of the solubility of p-coumaric acid in nine pure and water + ethanol mixed 645
solvents at temperatures from 293.15 to 333.15 K,” J. Chem. Eng. Data. 62 (2017) 578–646
583. 647
[41] O. Ferreira, S. Pinho, Solubility of Flavonoids in Pure Solvents, Ind. Eng. Chem. 648
Res. 51 (2012) 6586–6590. 649
[42] C.-C. Chen, P.A. Crafts, Correlation and prediction of drug molecule solubility 650
with the NRTL-SAC model, Comput. Aided Chem. Eng. 21 (2006) 859–864. 651
[43] S. Vilas-Boas, P. Brandão, M.A.R. Martins, L.P. Silva, L. Fernandes, O. 652
Ferreira, S.P. Pinho, Solid Phase Studies and Solubility of isomeric phenolic acids in 653
water and organic solvents, in: Int. Symp. Solubility Phenom., Tours, 2018: p. 8362. 654
[44] J.M. Prausnitz, R.N. Lichtenthaler, E.G. de Azevedo, Molecular 655
Thermodynamics of Fluid-Phase Equilibria, Prentice Hall PTR, 1999. 656
[45] J. Abildskov, J.P. O’Connell, Predicting the solubilities of complex chemicals I. 657
Solutes in different solvents, Ind. Eng. Chem. Res. 42 (2003) 5622–5634. 658
[46] J. Abildskov, J.P. O’Connell, Thermodynamic method for obtaning the 659
solubilities of complex medium-sized chemicals in pure and mixed solvents, Fluid 660
Phase Equilib. 228–229 (2005) 395–400. 661
[47] V.N. Emel’yanenko, A. V. Yermalayeu, M. Voges, C. Held, G. Sadowski, S.P. 662
Verevkin, Thermodynamics of a model biological reaction: A comprehensive combined 663
experimental and theoretical study, Fluid Phase Equilib. 422 (2016) 99–110. 664
[48] W.E. Acree, Thermodynamic properties of organic compounds: enthalpy of 665
fusion and melting point temperature compilation, Thermochim. Acta. 189 (1991) 37–666
56. 667

26
[49] L. Sturz, V.T. Witusiewicz, U. Hecht, S. Rex, Organic alloy systems suitable for 668
the investigation of regular binary and ternary eutectic growth, J. Cryst. Growth. 270 669
(2004) 273–282. 670
[50] B.L. Sharma, R. Jamwal, R. Kant, Thermodynamic and lamella models 671
relationship for the eutectic system benzoic acid - Cinnamic acid, Cryst. Res. Technol. 672
39 (2004) 454–464. 673
[51] M.S. Manic, D. Villanueva, T. Fornari, A.J. Queimada, E.A. Macedo, V. 674
Najdanovic-Visak, Solubility of high-value compounds in ethyl lactate: Measurements 675
and modeling, J. Chem. Thermodyn. 48 (2012) 93–100. 676
[52] J.Z. Dávalos, R. Herrero, A. Chana, A. Guerrero, P. Jiménez, J.M. Santiuste, 677
Energetics and structural properties, in the gas phase, of trans -hydroxycinnamic acids, 678
J. Phys. Chem. A. 116 (2012) 2261–2267. 679
[53] A. Noubigh, M. Abderrabba, E. Provost, Temperature and salt addition effects 680
on the solubility behaviour of some phenolic compounds in water, J. Chem. 681
Thermodyn. 39 (2007) 297–303. 682
[54] E. Königsberger, Editorial: Guidelines for the Measurement of Solid-Liquid 683
Solubility Data at Atmospheric Pressure, J. Chem. Eng. Data. 64 (2019) 381–385. 684
[55] I. (ACD/Labs) Advanced Chemistry Development, Percepta Predictors, (2017). 685
[56] J.A. Platts, D. Butina, M.H. Abraham, A. Hersey, Estimation of molecular linear 686
free energy relation descriptors using a group contribution approach, J. Chem. Inf. 687
Comput. Sci. 39 (1999) 835–845. 688
[57] M.H. Abraham, A. Ibrahim, A.M. Zissimos, Y.H. Zhao, J. Comer, D.P. 689
Reynolds, Application of hydrogen bonding calculations in property based drug design, 690
Drug Discov. Today. 7 (2002) 1056–1063. 691
[58] D.O. Abranches, M.A.R. Martins, L.P. Silva, N. Schaeffer, S.P. Pinho, J.A.P. 692
Coutinho, Phenolic hydrogen bond donors in the formation of non-ionic deep eutectic 693
solvents: The quest for type v DES, Chem. Commun. 55 (2019) 10253–10256. 694

Declaration of interests
☒ The authors declare that they have no known competing financial interests or personal relationships that could have appeared to influence the work reported in this paper.
☐The authors declare the following financial interests/personal relationships which may be considered as potential competing interests:


![New cinnamic N-benzylpiperidine and cinnamic Ndigital.csic.es/bitstream/10261/133225/7/New...impairment, but they do not stop neuronal degeneration or repair brain damage [2]. Nowadays](https://static.fdocuments.net/doc/165x107/5fe4de2c411490725a638bf1/new-cinnamic-n-benzylpiperidine-and-cinnamic-impairment-but-they-do-not-stop.jpg)