Solar PV The Game Changer in Malaysian Electricity Supply ... · electricity supplier like TNB. ......
52
By MPIA Solar PV – The Game Changer in Malaysian Electricity Supply Industry 16 February 2015
Transcript of Solar PV The Game Changer in Malaysian Electricity Supply ... · electricity supplier like TNB. ......
By
MPIA
Solar PV – The Game Changer in
Malaysian Electricity Supply Industry
16 February 2015

Thailand
Cumulative solar in 2014 :
1.2GW
Solar market size (2014):
800MW
Solar pipeline from
2015~2016: 1GW
Solar Capacity target in
2021: 3.8GW
Indonesia
Solar market size
(2014): 20MW
Solar Capacity target:
620GW (2020)
Singapore
Solar market size
(2015) for HDB project
: 50MWp
Allow consumer to
export solar energy
back with S$0.05/kWh
lower from the tariff
rate.
Philippines
Solar market size (2014):
112MW
Solar Capacity Target
(2015)
: 500MW
Available for Net
Metering policy with no
quota limit with Php
5/kWh (RM 0.40/kWh)

Why Solar PV is Game Changer?
Electricity users now have the choice and capability to generate its own electricity more efficiently and at competitive costs.
Electricity users are now more sophisticated and better informed and can manage how electricity is used through the use of modern communication devices and technology. All these affect revenues to conventional electricity supplier like TNB.
Complies with the demand of clean environmental considerations
Infinite source of fuel - SUN

Current Challenges Facing
Regulated Electric Utilities
Fuel Supply and Fluctuating Prices
Aging Infra (T & D) and high cots of
upgrading
Controlled Tariff
High O & M costs (fuel, interest rate, wages/salaries for
~36,0000 employees
Environmental Considerations- to comply with CO2 emmission control
Increase in the use of RE and EE
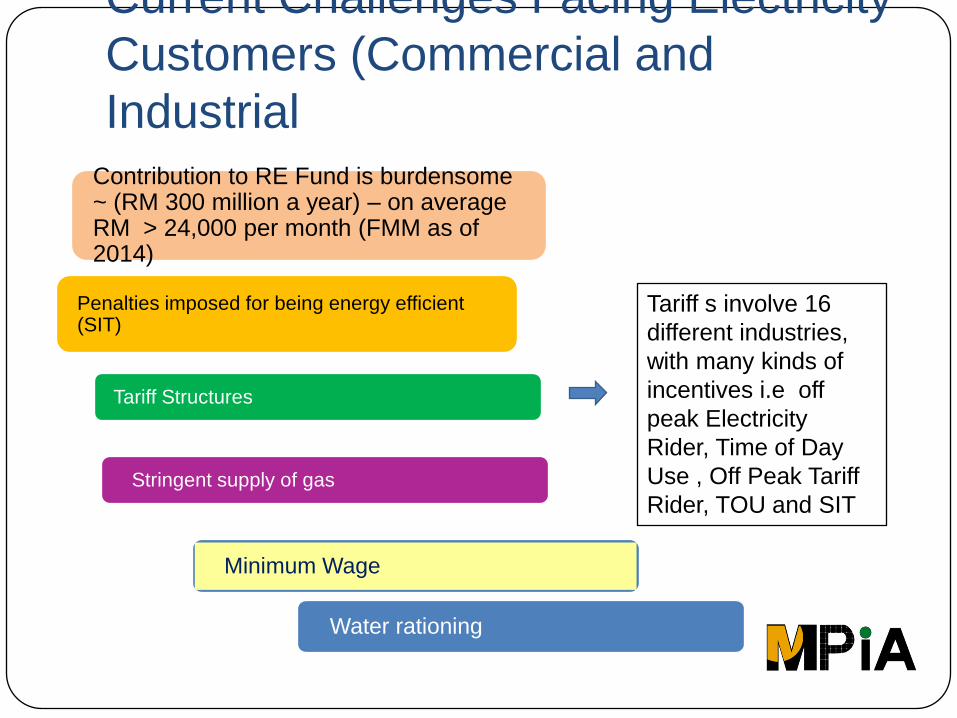
Current Challenges Facing Electricity
Customers (Commercial and
Industrial
Minimum Wage
Water rationing
Tariff s involve 16
different industries,
with many kinds of
incentives i.e off
peak Electricity
Rider, Time of Day
Use , Off Peak Tariff
Rider, TOU and SIT
Contribution to RE Fund is burdensome ~ (RM 300 million a year) – on average RM > 24,000 per month (FMM as of 2014)
Tariff Structures
Stringent supply of gas
Penalties imposed for being energy efficient (SIT)
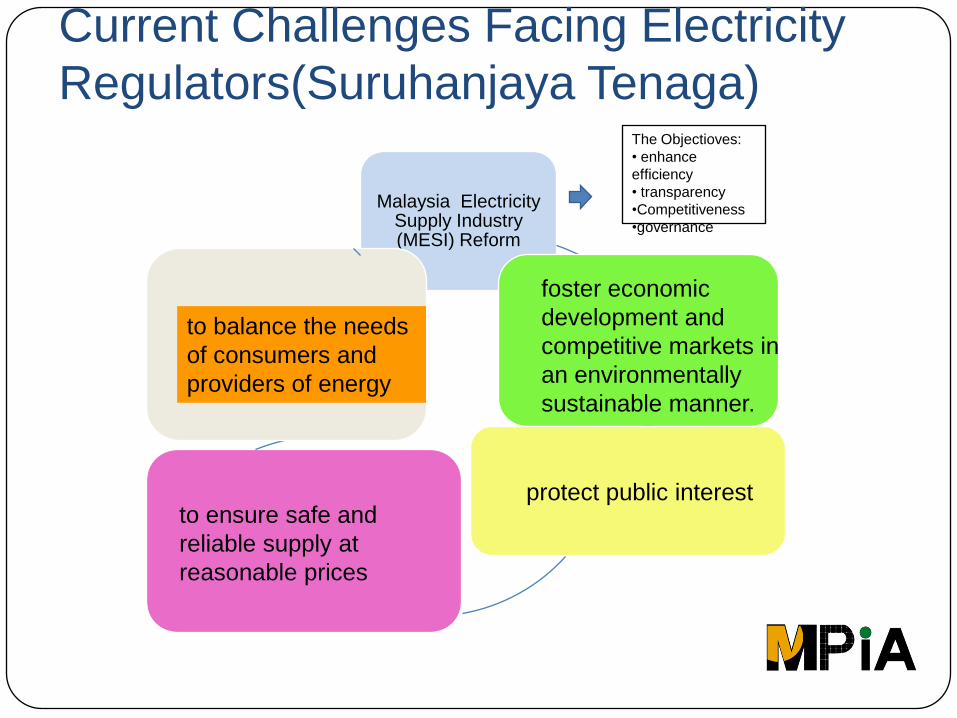
Current Challenges Facing Electricity
Regulators(Suruhanjaya Tenaga)
Malaysia Electricity Supply Industry (MESI) Reform
The Objectioves:
• enhance
efficiency
• transparency
•Competitiveness
•governance
to balance the needs
of consumers and
providers of energy
to ensure safe and
reliable supply at
reasonable prices
protect public interest
foster economic
development and
competitive markets in
an environmentally
sustainable manner.

Challenges Facing Policy Makers
(KeTTHa, EPU, PEMANDU, dll)
To meet CO2
emission reduction
targets
Energy Security

Transformation of Malaysia
Electricity Supply Industry in
Malaysia
Public Electric Utilities 3 (TNB, SEB and
SESCO)
IPP‟s
Conventional (18 in Peninsular and 8
in Sabah
RE:100 (solar PV/MH,Biomass,
Landfill)
Micro IPP‟s~ 2000 (solar PV), 4000 at
the end of 2015.
Distributed Licencees (DL): 200

Strategies Options for Electric
Utilities

Strategies Options for Electric
Utilities
Utility
Scale
PV
farm
Distributed
Generation
Elecetric
Vehicles

ACTS RELATED TO PUBLIC AND
PRIVATE LICENCEES
(SELF-CONSUMPTION)


Self-
Consumption


GUIDING PRINCIPLES OF NET
ENERGY METERING

Guiding Principles for Net Energy
Metering Self-Generation and Access to the Utility Grid.
Qualified retail electricity customers should have
the right to install RE generation facilities such as
rooftop solar PV systems at their premises and
connect them to the utility grid without
discrimination.

Guiding Principles for Net Energy
Metering Value of Solar PV generated Electricity. Rooftop
customer owned solar PV generation systems can offer many benefits to the electricity supply system and the nation. These include:- Reduction in utility capacity and energy generation
requirements, especially during the peak demand period hich coincides with the PV generation profile.
Reduction in distribution system losses. Avoidance or deferral of distribution and transmission
system reinforcement investments. Hedging against fuel price volatility especially for
imported fuel. Reduction in greenhouse gas emissions and water use.
These benefits should be quantified to determine the true value of solar PV generated energy delivered to the grid.

Guiding Principles for Net Energy
Metering
Capacity Limit on Rooftop PV Installations.
Reasonable capacity limit should be imposed on
the total rooftop PV generation as it forms
“generation at point of use” and is a valuable
addition to the national electricity generation fuel
mix.

Guiding Principles for Net Energy
Metering
Access to Billing Data. Billing statements from utilities should clearly show the consumer's total electricity use, the PV generated electricity, and where applicable the net energy exported to the utility grid. This “credit” should be available for the consumer to utilize when required.
Metering Equipment. The present 1-meter system under RE Act should continue
Customer Classes. All customers should be able to participate in net metering.

Cost Benefits of NEM

Benefits of NEM Roof top PV systems is planned to be limited to 30%
of National maximum demand to shave the system
peak and reduce the need for costly peak period
generation plant like OCGT.
Foregone revenues for PETRONAS to provide gas for
power generation will be eliminated as gas subsidies
are removed.
The peak period energy generation cost to a utility is
normally well above the average retail selling price.
Thus TNB should see a net gain in profits even
though its overall revenue may drop slightly. This is
because every KWh sold during the peak period that
is generated from conventional generation plant
would have cost more than the average revenue
derived for the sale.
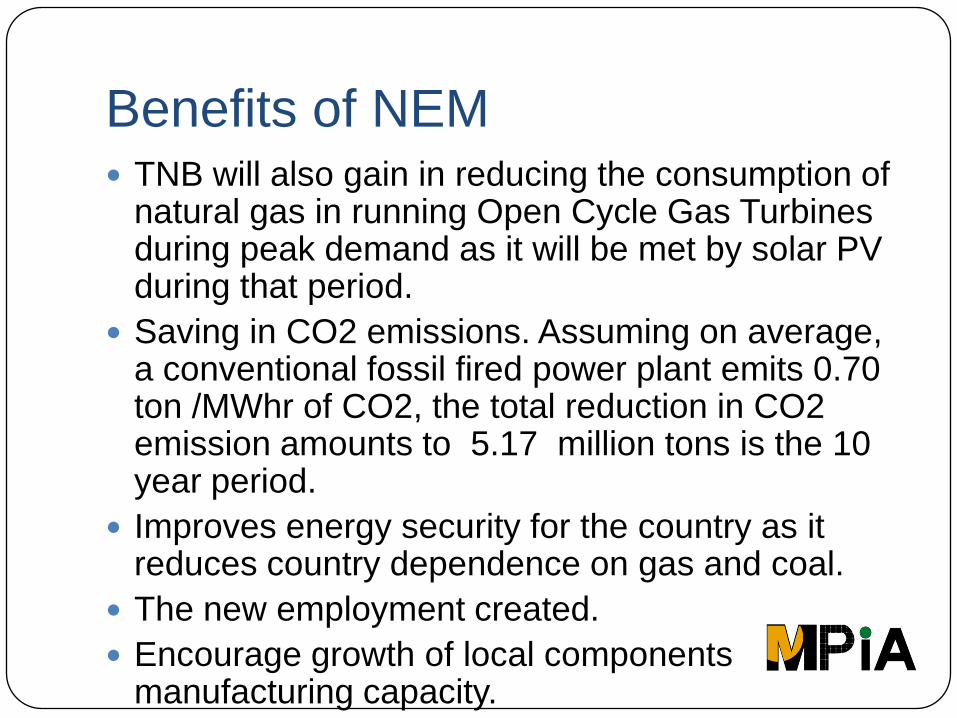
Benefits of NEM TNB will also gain in reducing the consumption of
natural gas in running Open Cycle Gas Turbines during peak demand as it will be met by solar PV during that period.
Saving in CO2 emissions. Assuming on average, a conventional fossil fired power plant emits 0.70 ton /MWhr of CO2, the total reduction in CO2 emission amounts to 5.17 million tons is the 10 year period.
Improves energy security for the country as it reduces country dependence on gas and coal.
The new employment created.
Encourage growth of local components manufacturing capacity.

Enablers
Investment Tax
Allowance (ITA)
Capital Allowance
Net Energy Metering
Act.

Issues with NEM
Utility perceived income shrinks
Cost of maintaining the grids will be shifted to
middle and lower income groups.
stability of the grids
Premium value of clean electricity

Our Challenges now…
To determine the capacity of
roof top solar PV for next
coming years ( at least for
next 5 years)
To determine the tariff rates
that take into account all
factors .

Cost Analysis On Peak Demand
Generation, Transmission & Distribution
21% Distribution : RM 0.0824
9% Transmission : RM0.0366
69% Generation : RM0.2639
1% Operation : 0.0024

Generation Cost (OCGT) (RM/kWh)
Tansmission Cost (RM/kWh)
Distribution Cost (RM/kWh)
Total Cost (RM/kWh)- LV
Total Cost (RM/kWh)- MV
Assumption 1 0.5 0.0366 0.0824 0.619 0.5366
Assumption 2 0.45 0.0366 0.0824 0.569 0.4866
Assumption 3 0.35 0.0366 0.0824 0.469 0.3866
Tariff Rate (RM/kWh)
Electricity Cost (RM/kWh) TNB Gain/Loss
Tariff B - Low Voltage Commercial 0.509 0.619 -0.11
Tariff C1 - Medium Voltage General Commercial 0.365 0.537 -0.172Tariff D -Low Voltage Industrial 0.441 0.619 -0.178Tariff E2 - Medium Voltage Peak/Off Peak Industial 0.355 0.537 -0.182
Tariff Rate (RM/kWh)
Electricity Cost (RM/kWh) TNB Gain/Loss
Tariff B - Low Voltage Commercial 0.509 0.569 -0.06
Tariff C1 - Medium Voltage General Commercial 0.365 0.487 -0.122Tariff D -Low Voltage Industrial 0.441 0.569 -0.128Tariff E2 - Medium Voltage Peak/Off Peak Industial 0.355 0.487 -0.132
Tariff Rate (RM/kWh)
Electricity Cost (RM/kWh) TNB Gain/Loss
Tariff B - Low Voltage Commercial 0.509 0.469 0.04
Tariff C1 - Medium Voltage General Commercial 0.365 0.387 -0.022Tariff D -Low Voltage Industrial 0.441 0.469 -0.028Tariff E2 - Medium Voltage Peak/Off Peak Industial 0.355 0.387 -0.032
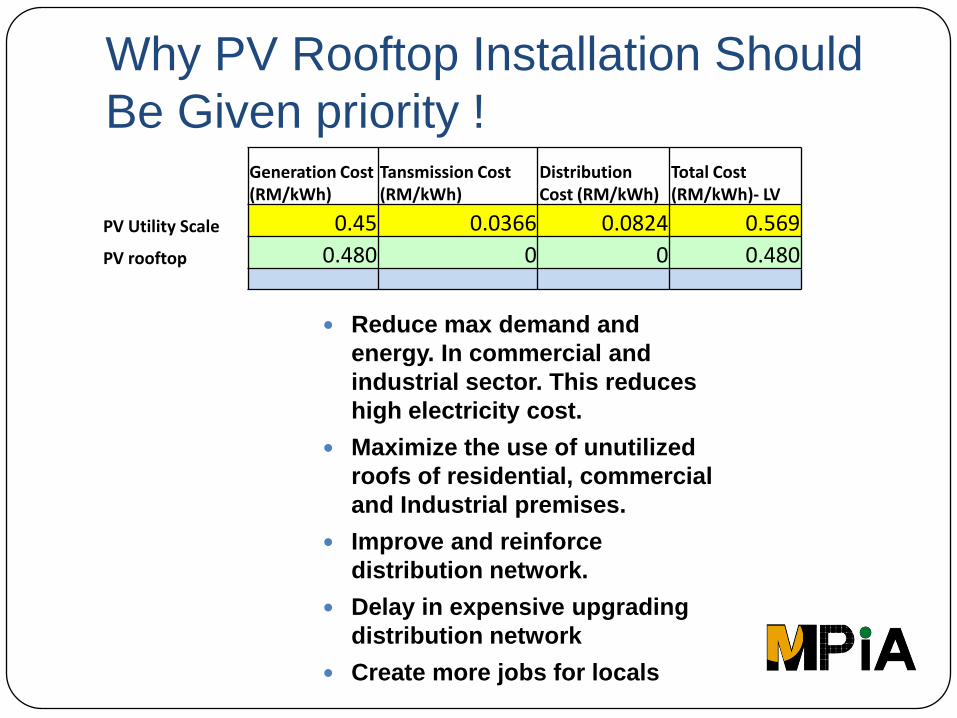
Why PV Rooftop Installation Should
Be Given priority !Generation Cost (RM/kWh)
Tansmission Cost (RM/kWh)
Distribution Cost (RM/kWh)
Total Cost (RM/kWh)- LV
PV Utility Scale 0.45 0.0366 0.0824 0.569
PV rooftop 0.480 0 0 0.480
Reduce max demand and
energy. In commercial and
industrial sector. This reduces
high electricity cost.
Maximize the use of unutilized
roofs of residential, commercial
and Industrial premises.
Improve and reinforce
distribution network.
Delay in expensive upgrading
distribution network
Create more jobs for locals

Commercial & Industry Rooftop
Installation – Net Energy
Metering(NEM)
PROPOSED NEM PROGRAM FOR COMMERCIAL &
INDUSTRIAL ROOF TOP–ANALYSIS OF ITS MACRO
& MICRO ECONOMIC COSTS & BENEFITS

Proposed NET ENERGY METERING - Terms
and Conditions
Maximum Installed Capacity : 80% of
Declared Maximum Demand
Energy Export Limit : Shall not be more than
25% of Energy Imported
Export Tariff : 10% lower than Import Tariff
Proposed NO CAP & NO QUOTA
!
PHASE 1 (less than 5% of energy mixed)
PHASE 2 (More than 5% of energy mixed)
- Every kWh generated require to pay power grid
fee
- Power grid Fee to be determined & negotiated by
all Stake Holders

Government Tax Reduction, Tax Gain and
Direct GDP Contribution – NEM Program
Forcast PV Capacity (MW)
PV Accumulated Capacity(MW) Forcast PV market
Size(mil, RM)Forcast Maintenance (mil, RM)
GST Income (mil, RM)
Cummulative GST Income (mil, RM)
Corporate Tax (mil, RM)
Cummulative Corporate Tax (mil, RM)
ITA Reduction (mil,RM)Year
2015 150 150 1,050.00 - 63.00 63.00 12.60 12.60 262.50
2016 195 345 1,365.00 - 81.90 144.90 16.38 28.98 327.60
2017 244 589 1,708.00 - 102.48 247.38 20.50 49.48 409.92
2018 305 894 2,135.00 58.90 131.63 379.01 27.03 76.51 512.40
2019 381 1,275 2,667.00 89.40 165.38 544.40 34.15 110.66 640.08
2020 476 1,751 3,332.00 133.88 207.95 752.35 43.20 153.86 799.68
2021 595 2,346 4,165.00 183.86 260.93 1,013.28 54.39 208.25 -
2022 744 3,090 5,208.00 258.65 328.00 1,341.28 68.70 276.95 -
2023 930 4,020 6,510.00 340.67 411.04 1,752.32 86.30 363.25 -
2024 1162 5,182 8,134.00 465.37 515.96 2,268.28 108.78 472.03 -
2025 1278 6,460 8,947.40 599.88 572.84 2,841.12 121.77 593.79 -
2026 1406 7,866 9,842.14 785.24 637.64 3,478.76 136.95 730.74 -
2027 1547 9,413 10,826.35 956.14 706.95 4,185.71 152.86 883.61 -
2028 1701 11,114 11,908.99 1,201.34 786.62 4,972.33 171.74 1,055.35 -
2029 1871 12,986 13,099.89 1,418.48 871.10 5,843.43 191.24 1,246.59 -
2030 2059 15,044 14,409.88 1,740.19 969.00 6,812.44 214.68 1,461.27 -
2031 2264 17,309 15,850.86 2,016.05 1,072.02 7,884.45 238.60 1,699.87 -
2032 2491 19,799 17,435.95 2,435.48 1,192.29 9,076.74 267.68 1,967.55 -
2033 2740 22,539 19,179.55 2,925.27 1,326.29 10,403.03 300.36 2,267.91 -
2034 3014 25,553 21,097.50 3,171.50 1,456.14 11,859.17 329.29 2,597.20 -
2035 3315 28,869 23,207.25 3,595.59 1,608.17 13,467.34 364.78 2,961.98 -
Total 202,079.76 22,375.88 13,467.34 2,961.98 2,952.18


Direct Jobs Creation – NEM Program

Reduction CO2 Emission –NEM Program

PROPOSED EXTENSION OF FIT (10years)+NEM
FOR RESIDENTIAL – ANALYSIS OF ITS MACRO
& MICRO ECONOMIC COSTS AND NENEFITS

Proposed Residential -10 years FIT
+NEM
2016-2025 FIT Program (10 years Power Purchase
Agreement )
Proposed FIT Rate
2016 -2017 – RM1.00/kWh , Capacity : 125MWp
2018- 2019 – RM0.95/kWh , Capacity : 225MWp
2020- 2021 – RM0.90/kWh, Capacity : 325MWp
2022- 2023 - RM0.85/kWh, Capacity : 425MWp
2024- 2025 – RM0.80/kWh, Capacity : 525MWp
After 10years PPA , Automatic Grant with NEM license.
2026-2035 Net Energy Metering Program

Proposed TERMS AND CONDITIONS
10 Years PPA – FIT Program
Installation Capacity : Maximum 5kWp per installation (Single
Phase)
Maximum 12kWp per installation (Three Phase)
Applicant : Must be property Owner (No Quota Limit Per
Applicant)
Net Energy Metering
Installation Capacity :
Single Phase System
Maximum 5kWp per installation without Energy
Storage
No limit per installation with Energy Storage
Three Phase System
Maximum 12kWp per installation without Energy
Storage
No limit per installation with Energy Storage

Residential - FIT + NEM Program „s Cost, Fund
, Tax Income & Direct GDP Contribution
(FIT Program) (NEM Program) (FIT + NEM)
Year Forcast PV Capacity (MW)
PV Accumulated Capacity(MW) Nett FIT Cost
(mil, RM)Forcast PV market Size(mil, RM)
Forcast Maintenance (mil, RM)
GST Income (mil, RM)-6%
Cummulative GST Income (mil, RM)
Corporate Tax (mil, RM)-24%
Cummulative Corporate Tax (mil, RM)
Proposed FIT Fund (mil, RM)
2016 50 50 43.75 375.00 - 22.50 22.50 4.50 4.50 350.00
2017 75 125 74.57 562.50 - 33.75 56.25 6.75 11.25 360.50
2018 100 225 180.60 750.00 - 45.00 101.25 9.00 20.25 371.32
2019 125 350 221.51 937.50 27.00 57.87 159.12 11.90 32.15 382.45
2020 150 500 358.59 1,125.00 42.00 70.02 229.14 14.51 46.66 393.93
2021 175 675 400.63 1,312.50 63.00 82.53 311.67 17.26 63.92 405.75
2022 200 875 547.17 1,500.00 85.05 95.10 406.77 20.04 83.96 417.92
2023 225 1100 581.22 1,687.50 115.76 108.20 514.97 23.03 106.99 430.46
2024 250 1350 715.07 1,875.00 145.53 121.23 636.20 25.99 132.98 443.37
2025 275 1625 729.02 2,062.50 187.54 135.00 771.20 29.25 162.23 456.67
2026 300 1925 716.92 2,250.00 225.74 148.54 919.75 32.42 194.65 470.37
2027 350 2275 628.66 2,625.00 280.78 174.35 1,094.09 38.24 232.89 484.48
2028 400 2675 531.91 3,000.00 331.83 199.91 1,294.00 43.96 276.85 499.02
2029 500 3175 431.31 3,750.00 409.69 249.58 1,543.58 54.83 331.68 513.99
2030 600 3775 331.10 4,500.00 486.26 299.18 1,842.76 65.67 397.35 529.41
2031 800 4575 235.54 6,000.00 607.06 396.42 2,239.18 86.57 483.92 545.29
2032 1000 5575 150.71 7,500.00 735.71 494.14 2,733.33 107.66 591.58
2033 1200 6775 79.09 9,000.00 941.35 596.48 3,329.81 130.59 722.17
2034 1500 8275 28.95 11,250.00 1,201.17 747.07 4,076.88 163.83 886.00
2035 1800 10075 3.94 13,500.00 1,397.25 893.84 4,970.71 195.53 1,081.54
Total 10075 6,990.27 75,562.50 7,282.73 4,970.71 1,081.54 7,054.91

Residential - FIT + NEM Program „s Cost, Fund , Tax
Income & Direct GDP Contribution

Reduction CO2 Emission


WHAT PV INDUSTRY Can
Contribute
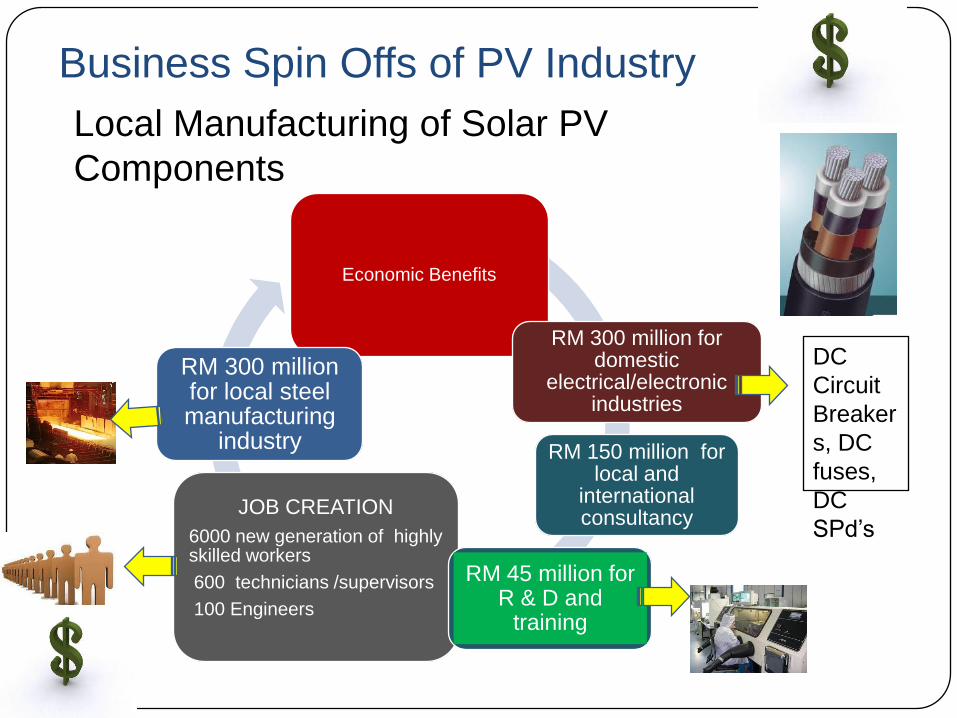
Business Spin Offs of PV Industry
Economic Benefits
RM 300 million for domestic
electrical/electronic industries
RM 150 million for local and
international consultancy
JOB CREATION
6000 new generation of highly skilled workers
600 technicians /supervisors
100 Engineers
RM 300 million for local steel manufacturing
industry
RM 45 million for R & D and
training
Local Manufacturing of Solar PV
Components
DC
Circuit
Breaker
s, DC
fuses,
DC
SPd‟s

Forecast National Load Profile Forecast PV Generation
2015 – 200MW
2020 – 2000MW
2025 – 6000MW
2030 – 12000MW

Proposed Strategies and Future PV
Capacity for Malaysia
Commercial and Industry - NET ENERGY METERING (2015 – 2025)
2015-2020 - With Investment Tax Allowance (1.75GW)
2021-2025 - Without Investment Tax Allowance (5 GW)
2026-2035 - Without Investment Tax Allowance (22.4 GW)
Extension of FIT +NEM – Individual/Residential Quota Only (2016-2025)
2016-2025 – 10 years Power Purchase Agreement (1.65GW) - 200,000 rooftops
2026-2035 – Net Energy Metering ( 8.45GW) – 1,000,000 rooftops
PV Utility Scale Installation - Future

Direct GDP Contribution and Direct
Jobs Creation
Commercial and Industry - NET ENERGY METERING (2015 – 2025)
2015-2020 -Direct GDP Contribution (RM12.25bil) & Direct Jobs Creation (4760)
2021-2025 - Direct GDP Contribution (RM32.96bil) & Direct Jobs Creation (12,780)
2026-2035 – Direct GDP Contribution (RM156.8bil) & Direct Jobs Creation(33,150)
Residential FIT +NEM (2016-2025)
2016-2025 – Direct GDP Contribution (RM12.2bil) & Direct Jobs Creation (3300)
2026-2035 – Direct GDP Contribution (RM63.37bil) & Direct Jobs Creation (18300)


CONCLUSIONS