
Solar Monthly Update for Print -...
12
SOLAR MONTHLY UPDATE Issue II January 2016 Vol. I
Transcript of Solar Monthly Update for Print -...

SOLARMONTHLY UPDATE
Issue II January 2016Vol. I

CERC BENCHMARK SOLAR PV CAPITAL
COSTS FALL BY MORE THAN 25% IN 2 YEARS
The Central Electricity Regulatory Commission (CERC) passed an order for determination of benchmark capital cost for solar PV projects for FY 2016-17 dated 23 December 2015. The order estimates capital cost including cost of equipment, construction, land, transmission and pre-operative expenses of solar PV projects for the upcoming financial year at ̀ 50.1 million/MW (USD 0.76 million). Based on inputs from the industry due by 10th January 2016, final benchmark capital cost and solar tariff is expected to be notified on 31st March 2016).
CLEAN ENERGY INVESTMENT JUMPS TO
RECORD USD 329BN IN 2015
Clean energy investment in 2015 rose to the record-high USD 329.3 billion (EUR 303bn), thanks to growth in China India, Africa, the US and Latin America.
A new report by Bloomberg New Energy Finance (BNEF) shows that investment in the past year was 4% above 2014 figures. It also beat by 3% the previous record of USD 318.3 billion set in 2011. That happened despite falling fossil fuel commodity prices, the continued weakness of the European economy, the declining cost of PV and the strong US currency, which is reducing the dollar value of investments. This means that despite these factors, more capacity could be installed for the same price, and despite the strength of the US currency, which is reducing the dollar value of non-dollar investment.
Preliminary calculations show that, thanks to utility-scale and small-scale activity, the world installed roughly 64 GW of wind and 57 GW of solar PV in 2015, marking a rise of around 30% on 2014. This combined total of 121 GW will have made up around half of the net capacity added in all generation technologies globally last year.
SOLAR POWER TARIFF AT RECORD LOW,
DROPS TO ̀ 4.34/UNIT
Foreign firms have bid record low solar power tariffs of `4.34 per unit in the latest auction, making green energy even more competitive and brightening the prospects of India adding 1 lakh mw of solar power capacity by 2022.Companies from Finland and South Africa have won projects in a solar park in Rajasthan, offering tariffs that are actually lower than some new coal-fired plants although older thermal units like those operated by NTPC charge less than `2.00 per unit. Analysts believe high solar radiation at the location and assured availability of land at the park would have attracted aggressive bids from foreign firms.
lSolar News Round Up
lSolar State Focus - Rajasthan
lCompany Limelight - Jakson Group
lSolar Financing & Falling Solar Tariffs
lTechnology Update
lSolar Tracker December - January
2015
Inside this Issue:
SOLAR NEWS ROUND UP
SOLAR MONTHLY UPDATE January 2016| 2
SOLAR MONTHLY UPDATE | January 2016 3
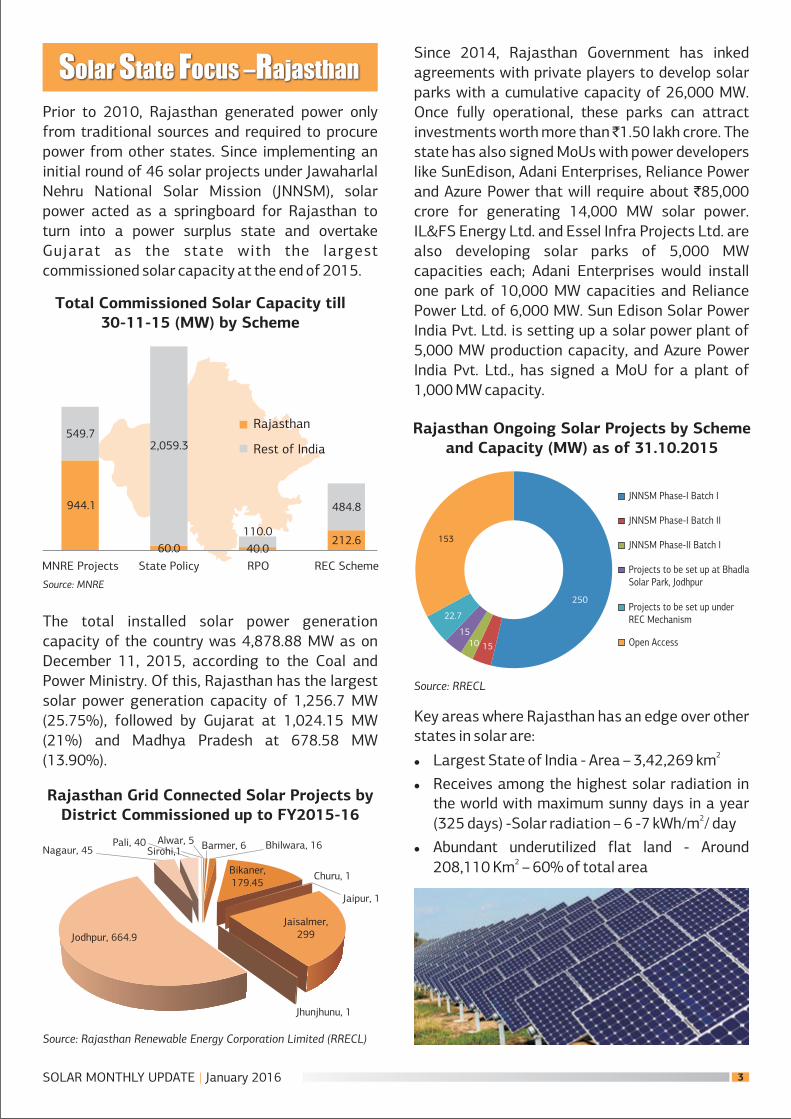
Since 2014, Rajasthan Government has inked agreements with private players to develop solar parks with a cumulative capacity of 26,000 MW. Once fully operational, these parks can attract investments worth more than ̀ 1.50 lakh crore. The state has also signed MoUs with power developers like SunEdison, Adani Enterprises, Reliance Power and Azure Power that will require about `85,000 crore for generating 14,000 MW solar power. IL&FS Energy Ltd. and Essel Infra Projects Ltd. are also developing solar parks of 5,000 MW capacities each; Adani Enterprises would install one park of 10,000 MW capacities and Reliance Power Ltd. of 6,000 MW. Sun Edison Solar Power India Pvt. Ltd. is setting up a solar power plant of 5,000 MW production capacity, and Azure Power India Pvt. Ltd., has signed a MoU for a plant of 1,000 MW capacity.
Prior to 2010, Rajasthan generated power only from traditional sources and required to procure power from other states. Since implementing an initial round of 46 solar projects under Jawaharlal Nehru National Solar Mission (JNNSM), solar power acted as a springboard for Rajasthan to turn into a power surplus state and overtake Gujarat as the state with the largest commissioned solar capacity at the end of 2015.
The total installed solar power generation capacity of the country was 4,878.88 MW as on December 11, 2015, according to the Coal and Power Ministry. Of this, Rajasthan has the largest solar power generation capacity of 1,256.7 MW (25.75%), followed by Gujarat at 1,024.15 MW (21%) and Madhya Pradesh at 678.58 MW (13.90%).
Solar State Focus –Rajasthan
Total Commissioned Solar Capacity till30-11-15 (MW) by Scheme
Source: MNRE
Rajasthan Grid Connected Solar Projects byDistrict Commissioned up to FY2015-16
Source: Rajasthan Renewable Energy Corporation Limited (RRECL)
MNRE Projects State Policy
212.6
484.8
110.0
2,059.3549.7
944.1
RPO REC Scheme
Rajasthan
Rest of India
40.060.0
Rajasthan Ongoing Solar Projects by Schemeand Capacity (MW) as of 31.10.2015
Source: RRECL
Key areas where Rajasthan has an edge over other states in solar are:
2lLargest State of India - Area – 3,42,269 km
lReceives among the highest solar radiation in the world with maximum sunny days in a year
2(325 days) -Solar radiation – 6 -7 kWh/m / day
lAbundant underutilized flat land - Around 2208,110 Km – 60% of total area
JNNSM Phase-I Batch I
JNNSM Phase-I Batch II
JNNSM Phase-II Batch I
Projects to be set up at BhadlaSolar Park, Jodhpur
Projects to be set up underREC Mechanism
Open Access
153
250
22.7
15
1510
Jodhpur, 664.9
Nagaur, 45Pali, 40 Alwar, 5 Barmer, 6
Bikaner,179.45
Jaisalmer,299
Bhilwara, 16
Churu, 1
Jaipur, 1
Jhunjhunu, 1
Sirohi,1

SOLAR MONTHLY UPDATE | January 2016 4
Rajasthan Solar Policy 2014-Highlights
Source: Reconnect Energy
The Flip Side
Rajasthan is saddled with the highest Discom losses. At present, the state has a financial burden of
around ̀ 85,000 crore to lending institutions. The state, along with other loss-making states, is already
on notice by the RBI to clear its debts or it will be debarred from receiving financial aid.
Rajasthan State Discoms have tried debt restructuring twice…..
During the last five years, all state-owned power firms in Rajasthan have resorted to taking short- term working capital loans, owing to growing demand for electricity, though they have been unable to increase tariffs adequately. Now, by being the first state to adopt the Government's latest UDAY (Ujwal Discom Assurance Yojana), a financial restructuring programme for the loss-making power utilities, it has now bought time for a turnaround. Under UDAY, power distribution companies have to reduce their technical and commercial losses to 15 percent by FY2018-19 against existing national average 22 percent and eliminate the gap between Average Revenue Realised (ARR) & Average Cost of Supply (ACS) by FY2018-19.
Rajasthan Solar Policy 2014 w.e.f 08.10.2014 (till modification or newer policy supersedes it);Nodal Agency: RREC Target Capacity: 25 GW
Particulars Rajasthan Solar Policy 2014
1. Setting up of Solar plants under guidelines of MNRE or JNNSM.
2. Setting up of Solar plants in Rajasthan for sale to Discoms.
3. Setting up plants for sale through REC mechanism.
4. Projects for Captive use or sale to 3rd party or sale to other states through open Access.
5. Solar Rooftop Systems through Net Metering mechanism.
6. Decentralized & Off grid Solar Applications - Hybrid Systems, SPV Pumping Systems, Standalone Solar Systems.
7. Development of Solar parks in the state.
1. Projects of capacities more than 500 MW will be directly placed before State Level Empowered Committee (SLEC) for consideration.
2. Such projects will be eligible for benefits/concessions available under Rajasthan Investment Promotion Scheme.
1. Incentives as per Rajasthan Industrial Policy.
2. Availability of Water for Power Generation.
3. Clearance from Rajasthan State Pollution Control Board.
4. Banking will be allowed as per RERC Regulations and orders.
The solar power producer will have to submit an application to RREC, and will be required to deposit processing fee defined under the Policy.
The govt. land will be alloted to Solar park developer or a project developer as per the provisions of Rajasthan Land and Revenue Rules 2007. The setting up of Solar projects on private lands will also be promoted.
Rs. 10 Lac/MW in form of Bank Guarantee.
Open access will be granted to beneficiaries, provided that they will have to pay OA charges asas approved by RERC through its orders.
The drawal of reactive power shall be charged by Transmission companies as per the RERCorders.
The Transmission and Distribution companies will ensure the availability of powerevacuation network. The solar power producer will have to pay grid connectivity chargesas finalized by RERC.
Projects to bepromoted under the
Policy
Registration of SolarProjects
Land Allotment
Incentives
Security Deposits
Special Provision forMega Solar Power
Projects
Open Access for ThirdParty
Reactive EnergyCharges
Power Evacuation andGrid interfacing

SOLAR MONTHLY UPDATE | January 2016 5
COMPANY LIMELIGHT – JAKSON GROUP
About Jakson Group
Jakson Group is a diversified power solutions provider group with multiple business interests ranging from power generation, solar and power distribution to generators, EPC, IPP and hospitality. Founded in 1947, the company has over 7 decades of engineering experience. Jakson occupies a leading market position with its business activities in the following key areas:
lPower Generation.
lSolar & Power Distribution division
lEPC division.
lIPP
lInternational Business – Bangladesh, UK, Nepal, Singapore and Bangladesh, Africa.
lHospitality
The Jakson group represents:
lOver 1 million sq. ft. of combined manufacturing space, 3 manufacturing plants
lOver 2000 employees pan India
lGlobal Training Centre and 2 Service Centers
l22 offices in India, overseas Offices in Nepal, Bangladesh & Singapore, upcoming office in Dubai
lGrowing into a USD 300 million (`1800 crore) enterprise, as of 2016.
lSatish Kumar Gupta - Founder & Chairman
lSameer Gupta - Managing Director
Management
Growth Story: Jakson Group Turnover (` Crore), FY2009-2016
Source: Jakson
Director's Quote:
From the perspective of an India based solar solutions provider, what do you perceive as a key challenge in the solar market today?
The key challenge for domestic solar companies are definitely, the drastically falling tariffs in the recent PV grid connected solar bids auctioned during the course of 2015. Here, companies with external funding and those that manufacture components and cells have a temporary advantage over others in bidding for PV projects. Vertical integration and ensuring an optimum financing mix in the long run is thus, the key to sustaining low tariffs in the sector.
Group and Company Performance Highlights
2015-2016(E
)
Tur
nove
r (`
Cro
re) 1500
1000
500
2009-2010
2010-2011
2011-2012
2012-2013
2013-2014
2014-2015
0
2000
1,301.88
1,800.00
1,438.771,362.25
1,088.591,113.19
887.07

SOLAR MONTHLY UPDATE | January 2016 6
lSundeep Gupta - Jt. Managing Director
lSunil Narang - Sr. Director
lRakesh Kumar Sharma (Group CFO)
lAtul Gupta (Strategic Head-Finance)
lSudershan Kumar Gupta (Board Advisor & Solar IPP Head)
lAshish Sethi (Solar EPC Head)
lSandip Ghosh (Solar Products Head)
lPraveen Pai (Power Solutions Head)
lGagan Chanana (Commercail Genset Head)
lAparajitha Ramadyani (HR and Admin)
In 2011, the Jakson group diversified its business operations in solar power, extending its experience in power generation to serve the solar markets. Its solar portfolio includes the following key solutions:
1. Solar IPPs: Selling power to Govt. entities and
private customers through long term PPAs
2. Solar EPC & Components:
a. Turnkey EPC for Utility scale & Rooftop power plants
b. On-grid & Off-grid solar systems
c. PV plant components
3. Solar Products & Systems:
a. Mini/Micro Grids
b. Solar Pumping Systems
c. Solar Street Lighting Systems
d. Solar Home Lighting Systems
Jakson has also laid foundation for its 25 MW solar power plant (with plans to scale it upto 100MW) to address growing power needs of India and provide a clean renewable source of energy.
lSetting up of MW scale land based Solar Power Plants under long term PPAs to sell power to Government entities.
lSetting up rooftop solar power plants on BOOT/ BOO basis under long term PPAs to sell power to private customers.
Current Land Based IPP's
l20 MW Solar Power Plant in Bap, Rajasthan
in operation since March 2012: Set up with
About Jakson Solar Projects
1. Solar IPP
an investment of 200 crore under Government's Jawaharlal Nehru National Solar Mission (JNNSM) policy Phase 1 Batch 2. The solar power plant is built on an approximately 100 acres land using high efficiency crystalline solar cells technology. It is the largest single location solar power farm in India based on crystalline cell technology. Commissioned in March 2013, executed in 10 months. Current CUF:19%
l10 MW Solar Plant in Uttar Pradesh commissioned in March 2015
l30 MW Solar plant in UP Plant to be commissioned by June 2016
Current Rooftop IPP's
l200kWp in Chennai
l250 kWp for Delhi Metro Rail Corporation
l100kWp for Airport Authority of India, Raipur.
Jakson plans to own 200 MW solar power plants in the next three years
lTurnkey EPC and O&M for Rooftop solar power plants
lSupply of Solar Power Plant Components for MW projects
lSolar Inverter Sub-station (SISS)- Introduced in 2012
lString Combiner Box ( SCB)- Introduced in 2012
lModule Mounting Structures (MMS)- Introduced in 2014
lPV Modules- Introduced in Aug 2015
Current Land Based EPC & Components
Projects
l20 MW, JPPL- Bap, Rajasthan
uDesign, Engineering, Equipment Supply, Installation, Commissioning and O&M for 25 yrs
l10 MW, NTPC- Talcher, Orissa
uDesign, Engineering, Equipment Supply (except PV Modules) , Insta l lat ion , Commissioning and O&M for 1 year
uThree different design of civil foundation used on Ash fill land
l20 MW EPC Solution for Solar Power plant in Rajasthan
`
2. Solar EPC and Components

SOLAR MONTHLY UPDATE | January 2016 7
1.05 MWp
23.0 MWp
10 MWp
33.5 MWp
148.5
81 MWp under execution
Table 1 : Jakson Solar EPC Projects Executed/Under Execution, FY2012-2016
F. Y. Land Rooftop Turnover ( Cr.)`
2011-12
2012-13
2013-14
2014-15
TOTAL
2015-16
-
300 KWp
600 KWp
3.1 MWp
17.2
13.2 MWp under execution
11
152
38
130
831
481.705 Cr orders in handunder execution, 500 Cr total
expected
Source: Jakson
l20 MW EPC Solution for Vikram Solar in Rajasthan
l1 MW EPC for Ganges Enterprises in Khetri, Rajasthan
3. Solar Products and Systems
Design & manufacture of innovative solar power products for various applications being marketed both directly and through Channel Partners
lNetwork of 22 channel partners and 160 dealers Expected 60 channel partners and 600 dealers by end of 2016
lDeveloping a channel of distributors in Africa & Middle East
SOLAR PROJECT FINANCING- FALLING TARIFFS AND ITS IMPLICATIONS
Falling Solar Costs
The January 2016 update of CERC, outlined how the major components of capital costs associated
with solar PV projects in India have witnessed drastic reductions, resulting in a clear fall in overall cost of solar PV utility scale projects in India.
26.13 48.5 60 80 80
Table 1 : Capital Cost Norm Proposed (` lakhs/MW) for Solar PV Projects, FY2013-17
Cost Component
PV Modules
Land Cost
Civil and General Works
Mounting Structures
Power Conditioning Unit (Inverter)
Evacuation Cost up to Inter-connection Point(Cables and Transformers)
Preliminary and Pre-Operative Expensesincluding IDC and Contingency
2016-17(Proposed)
310.19
25
35
35
30
40
2015-16
332.35
25
50
50
45
55
2014-15
365.8
25
60
50
50
60
2013-14
335.71
16.8
94.5
105
60
105
2012-13
344.5
16.8
94.5
105
60
105
Total Capital Cost 501.32 605.85 670.8 797.01 805.8
Source: CERC

Source: Energy Trend, Jan 2016
Market/Country Installation Target Share ofRenewable Generation
150GW by 2020 20%(non-fossil fuel by 2030)
64GW by 2030 22-24% by 2030
- 20% by 2030
66GW by 2030 50% by 2030
22GW by 2020 15% by 2020
100GW by 2022 40%(non-fossil fuel) by 2030
8.7GW by 2030 13.3% by 2030
China
Japan
US
Germany
UK
India
Taiwan(current Government)
Taiwan(Opposition party)
13GW by 2025 20% by 2025
Table 2 : Installation targets of major markets and LCOE for utility-scale systems
Current LCOE(min), $/kWh
0.08
0.10
0.07
0.11
0.12
0.08
0.09
0.09
Current LCOE(max), $/kWh
0.14
0.14
0.12
0.17
0.20
0.11
0.14
0.14
SOLAR MONTHLY UPDATE | January 2016 8
Global Trends contributing to the
Falling costs
Globally installed cost of PV is expected to fall by over 15%, driving demand for solar PV installations worldwide. In the US with increased deployment
and new technological advances, installed costs could drop to around US$1.15/W in 2016 and by 15% by the end of 2017. Such a decrease would drive down the Levellised Cost Of Electricity (LCOE) to under US$0.07/kWh in some areas.
Falling Domestic Tariffs amid
Aggressive Bidding in Auctions
Questions Solar Viability
Massive scaling up of solar targets, global fall in solar panel prices, combined with aggressive bidding in the auctioned solar projects in 2015 have raised the question of whether the solar projects in India would remain financially viable in the future.
The lowest tariffs in the portfolio obviousy have been quoted for solar parks, where ready and free availability of land, water, transmission and grid connectivity infrastructure would translate to lower costs compared to other solar projects where the onus is on the bidder to procure the relevant infrastructure. Alternatively, power bundling schemes also provide leeway for lower tariffs in a market, where grid parity has yet to be achieved.
Table 3 : Trend in Solar PV Auction Bid Results by Project/Scheme, 2010-2015
NSM Batch 1
NSM Batch 2
Orissa Phase 1
Orissa Phase 2
Karnataka
Dec '10
Dec '11
Mar '12
Dec '12
Apr '12
Project/ Scheme Year Capacity onOffer (MW)
Highest Bid(`/KWh)
Lowest(`/KWh)
Bid Weighted Avg.Price (`/KWh)
150
350
25
25
60
12.76
9.39
8.98
9.50
8.50
10.95
7.49
7.00
7.28
7.94
12.16
8.79
8.36
8.73
8.34
Madhya Pradesh
Tamil Nadu
Rajasthan
Andhra Pradesh
Punjab Phase 1
Jun '12
Mar '13
Mar '13
Apr '13
June '13
125
150
75
226
270
12.45
14.50
8.25
15.99
8.75
7.90
5.97
6.45
6.49
7.20
8.05
6.48*
6.45 (L1)
6.49 (L1)
8.41

Uttar Pradesh Phase 1
Karnataka Phase 2
Madhya Pradesh Phase 2
Aug '13
Aug '13
Jan '14
Oct '14
130
130
100
500
9.33
8.05
6.97
5.99** (7.03Levelized)
8.01
5.50
6.47
5.25**(6.17 Level.)
8.90
6.87
6.86
5.75**(6.75 Level.)
Andhra Pradesh Phase 2
Karnataka
Telangana
Punjab (Capacity 5-24 MW)
Punjab (Capacity 25-100 MW)
NTPC Anantapur
Uttar Pradesh Phase 2
Madhya Pradesh
Telangana Group 1****
Telangana Group 2****
Punjab
Uttarakhand
AP-500 MW Bundling scheme******
Rajasthan Solar Park
Nov '14
Nov '14
Feb '15
Feb '15
May '15
Jun '15
Jun '15
Aug '15
Aug '15
Sep '15
Oct '15
Nov '15
Jan '16
500
500
100
100
250
215
300
500
1500
500
170
500
420
7.12
6.90
7.45
7.56
-
8.60
5.64
5.87
5.89
5.98
5.57
4.63
5.60
6.71
6.46
6.88
6.88
-
7.02
5.05
5.50
5.17
5.09
5.99
4.63
4.34
6.94
6.72
7.17
7.16
6.16*** (L1)
8.04
5.36
5.73
5.62
5.65
5.76
4.63
5.00
* 5% escalation for 10 years** 3% escalation for 10 years. Separate L1 for 9 districts*** EPC Bids with Domestic content requirement. Capital subsidy of `1 Cr/MW**** Results for the lowest bid for 500 and 1500 MW respectively. The sub-station wise final list to be declared soon****** Online reverse action concluded on 03.11.2015. Entire capacity has been won by Sun Edison.
Source: MNRE
SOLAR MONTHLY UPDATE | January 2016 9
Project/ Scheme Year Capacity onOffer (MW)
Highest Bid(`/KWh)
Lowest(`/KWh)
Bid Weighted Avg.Price (`/KWh)
The lowest price quoted so far in the Rajasthan Solar Park tender on January 19, 2016 is an example. Moreover, according to the MNRE, the weakest link in the value chain is distribution, wherein discoms in the country have accumulated losses of approximately `3.8 lakh crore and outstanding debt of approximately ̀ 4.3 lakh crore (as on March, 2015). The Government has come out with a clear cut action plan called UDAY (Ujjwal Discom Assurance Yojana) to tackle the problem of debt-ridden discoms head on over the next two to three years. This could level the playing field and eliminate bottlenecks in distribution across the market in the future and make the equations on tariffs less complex and easier to compare.
Innovative Financing of solar projects and availability of funding
According to credit rating agency CRISIL, the wind and solar sectors will require approximately `3 trillion in the next five years to double capacity. Of this, about 70 percent (`2 trillion) will have to be funded through debt. Bank financing is likely to
remain poor given the low appetite for financing renewable projects, asset-liability mismatch constraints and crowding-out by conventional power sources.
CRISIL recommends innovative financing as a means of widening financing avenues and reducing costs. There are various credit enhancements available, which can be deployed to match the needs, such as:
lPartial guarantee
lSecuritization of renewable project cash flows
lInfrastructure debt funds (IDFs), and
lPartial credit enhancement facility for renewable energy bonds
Government initiatives to fund renewable energy projects
The Ministry of Finance incubated the idea of an infrastructure debt fund (IDF) as a trust or mutual fund that can supplement bank finance by taking over a substantial share of outstanding loans.

lEnergy Storage Systems
lIndia Needs to Make Silicon for Solar Power
Energy Storage Systems
Energy storage is tightly linked with renewable energy generation and lower costs. This requires the integration of storage mechanisms into existing grids and other distribution systems in ways that manage peak loads and thus contribute to reducing the necessary generating costs. According to Greentech Media analysis forecasts, the cost of installing an energy storage system will drop by some 41% by 2020.
Battery costs have fallen 50 per cent in the past five years. The balance-of-system cost (hardware, labor and customer acquisition, etc.) suggests installing energy storage will drop to $400 a kilowatt by 2020, down from the current average of $670. This suggests advances in storage could rapidly overturn established business models.
The biggest price cut will be seen in inverters — the most complicated piece of machinery in the storage system, besides the battery.
Storage Technologies and their Applications:
lPumped hydro systems - enable us to manage the use of flows of water. It has been in use for centuries
lBatteries - can balance power loads and help manage the challenges of energy supplies that are intermittent and also at the production and
TECHNOLOGY UPDATE
SOLAR MONTHLY UPDATE | January 2016 10
Currently, two IDF-NBFCs (L&T Infra Debt Fund Ltd and India Infradebt Ltd, both rated CRISIL AAA/Stable) are operational. IREDA is a NBFC which was created to finance renewable energy. Government had allowed IREDA to raise `2,000 crore through tax-free bonds. Besides, it has also asked Power Finance Corporation, Rural Electrification Corporation and NTPC Ltd to raise `1,000 crore through tax-free renewable energy bonds.
The RBI is considering allowing banks to provide credit enhancement to corporate bonds either as a subordinated loan facility or as a non-funded contingent line of credit.
at the consumption ends of the supply chain. While technologies such as lithium ion batteries, are not yet commercially viable, costs are falling at an impressive pace, which could soon make it an attractive alternative.
India Needs to Make Silicon for Solar Power
Market research firm GTM Research expects around 130,000MT of polysilicon production to come on stream in the next few years, equivalent of 25GW, which could impact pricing. GTM Research stated that cumulative global polysilicon supply capability was expected to reach 437,000MT by 2016, enough to support 85GW of c-Si module production. Silicon is the material at the base of modern electronics and IT, be it computers, television, mobile phones which all depend on silicon chips for their operation. Semiconductor silicon is now used in 85 per cent of all the photovoltaic (PV) cells in commercial use. India however, does not manufacture silicon on a significant scale!
One MW capacity of solar modules requires 3-7 tons of highly pure semiconductor grade silicon. Thus for 1,00,000 MW, India requires about 3,00,000 – 7,00,000 tons of silicon. Though we have plenty of sand as raw material, we don't have the technology to process it into silicon wafers for solar cells or panels.
lPolysilicon production involves chemical processes using chlorination followed by fractional distillation to eliminate impurities such as B, P and As and metallic impurities down to less than 1 part per billion.
2013 2014E 2015E 2016E 2018E2017E
Siemens FBR UMG
550
50
100
150
200
250
300
350
400
450
500
550
KM
T
72
374 395 404
Ramped Polysillicon Capacity byProduction Technology, 2013-2018E
555
5
2
260 278325
7258
46
2620
Source: Polysillicon 2015-2018: Supply, Demand, Cost and Pricing
SOLAR MONTHLY UPDATE | January 2016 11
There are now only 6-8 major producers of electronic-grade silicon in the world, Germany, Norway and Taiwan being the other three. All are vigorously expanding their production capacity in view of the worldwide shortage of silicon, which is expected to become even more critical with the rapid expansion of the PV industry, especially in developing economies.
Indian Scenario
India manufacture of silicon is limited to SCL
Chandigarh, while BEL and ITI in Bangalore all
depend on imported wafers. In India, Polysillicon
production leading to Si wafers at a commercial
level started at Mettur Chemicals in the 80's, but
did not achieve viable economies of scale and used
outdated processes.
A plan to import technology from USA and
considerable R&D did not result in technology
transfer. Thus all Si device production at SCL, BEL,
BHEL and ITI has depended on imported wafers.
Indigenous production of silicon is thus the key to
lowering costs of PV projects in India viable.
SOLAR BIDS IN THE MONTH OF DECEMBER 2015 AND JANUARY 2016
750 MW (6x125 Mw Each) Solar PhotovoltaicPower Project (Phase-II)
750 MW - DCR, 100 MW -Open
400 MW (10MW X 5 = 50MW DCR, 35 X 10MW =350 Open)
100 MW DCR, 130 MW Open
100 MW DCR, 500 MW Open
JNNSM Phase-II, Batch-III, Tranche-II - 250 MW
1200 MW
Technical Bid Date
—
25/11/2015 & 26/11/2015
10 15 & 16 15/12/20 /12/20
23 15 & 24 15/12/20 /12/20
27/01/2016 & 29 16/01/20
Capacity in MWState
Andhra PradeshAP - II
Anantpur - AP
Telangana
Rajasthan
Karnataka
Gujarat
Karnataka
Organiser
NTPC
NTPC
NTPC
NTPC
NTPC
SECI
Karnataka RenewableEnergy Development(KREDL)
50 MW IPP Mode
500 MW IPP Mode
500 MW Open
440 MW IPP Mode
250 MW Open
200 MW
1200 MW
10 MW, Paradip Port
1000 MW ultra mega solar PV at NP kunta village
8 16/01/20
12 16/01/20
15 16/01/20
1 16/02/20
Kerala
Maharashtra
Maharashtra
UP
Gujarat
Madhya Pradesh
Jharkhand
Odisha
Andhra Pradesh
SECI
SECI
SECI
SECI
SECI
SECI
JREDA
SECI
NTPC
26/11/2015
27 15/11/20
30 15/11/20
30 15/11/20
16 15/12/20
18 15/12/20
30 15/12/20

New Delhi
P FE
1201, 12th Floor, Chiranjiv Tower
43, Nehru Place, New Delhi 110019 011 46628817 011 46628851 [email protected]
Kolkata
P FE
Sagar Trade Cube 5th Floor
104, S P Mukherjee Road, Kolkata 700026 033 24863815 033 24863816 [email protected]
Mumbai
P FE
Unit 8, 4th Floor, Trade World B Wing
Kamala Mills Compound, Lower Parel, Mumbai 400013 022 66702000/04 022 66702005 [email protected]
www.lsifinance.com


