Socioeconomic Impacts of COVID-19 in Four African Countries
60
Policy Research Working Paper 9466 Socioeconomic Impacts of COVID-19 in Four African Countries Anna Josephson Talip Kilic Jeffrey D. Michler Development Economics Development Data Group November 2020 Public Disclosure Authorized Public Disclosure Authorized Public Disclosure Authorized Public Disclosure Authorized
Transcript of Socioeconomic Impacts of COVID-19 in Four African Countries

Policy Research Working Paper 9466
Socioeconomic Impacts of COVID-19 in Four African Countries
Anna JosephsonTalip Kilic
Jeffrey D. Michler
Development Economics Development Data GroupNovember 2020
Pub
lic D
iscl
osur
e A
utho
rized
Pub
lic D
iscl
osur
e A
utho
rized
Pub
lic D
iscl
osur
e A
utho
rized
Pub
lic D
iscl
osur
e A
utho
rized

Produced by the Research Support Team
Abstract
The Policy Research Working Paper Series disseminates the findings of work in progress to encourage the exchange of ideas about development issues. An objective of the series is to get the findings out quickly, even if the presentations are less than fully polished. The papers carry the names of the authors and should be cited accordingly. The findings, interpretations, and conclusions expressed in this paper are entirely those of the authors. They do not necessarily represent the views of the International Bank for Reconstruction and Development/World Bank and its affiliated organizations, or those of the Executive Directors of the World Bank or the governments they represent.
Policy Research Working Paper 9466
The coronavirus disease 2019 (COVID-19) and the attempts to limit its spread have resulted in profound eco-nomic impacts, and a significant contraction in the global economy is expected. This paper provides some of the first evidence on the socioeconomic impacts of and responses to the pandemic among households and individuals in Sub-Saharan Africa. To do so, reduced-form econometric methods are applied to longitudinal household survey data from Ethiopia, Malawi, Nigeria, and Uganda—originating from the pre-COVID-19 face-to-face household surveys and from the novel phone surveys that are being imple-mented during the pandemic. The headline findings are fourfold. First, although false beliefs about COVID-19 remain prevalent, government action to limit the spread of the disease is associated with greater individual knowledge
of the disease and increased uptake of precautionary mea-sures. Second, 256 million individuals—77 percent of the population in the four countries—are estimated to live in households that have lost income due to the pandemic. Third, attempts to cope with this loss are exacerbated by the inability to access medicine and staple foods among 20 to 25 percent of the households in each country, and food inse-curity is disproportionately borne by households that were already impoverished prior to the pandemic. Fourth, stu-dent-teacher contact has dropped from a pre-COVID-19 rate of 96 percent to just 17 percent among households with school-age children. These findings can help inform decisions by governments and international organizations on measures to mitigate the effects of the COVID-19 pan-demic and reveal the need for continued monitoring.
This paper is a product of the Development Data Group, Development Economics. It is part of a larger effort by the World Bank to provide open access to its research and make a contribution to development policy discussions around the world. Policy Research Working Papers are also posted on the Web at http://www.worldbank.org/prwp. The authors may be contacted at [email protected].

Socioeconomic Impacts of COVID-19 in Four African Countries
Anna Josephson†, Talip Kilic‡, Jeffrey D. Michler#1
JEL Codes: C83, I15, I31, O12.
Keywords: SARS-CoV-2, COVID-19, behavioral change, income loss, household enterprises,
access to basic needs, food insecurity, concerns, access to basic needs, access to education,
Ethiopia, Malawi, Nigeria, Uganda, Sub-Saharan Africa.
1 † Department of Agricultural and Resource Economics, University of Arizona, [email protected]. ‡
Development Data Group, World Bank, Washington, DC, [email protected]. ‡ Department of Agricultural and
Resource Economics, University of Arizona, [email protected].

2
1. Introduction
SARS-CoV-2 is a major global threat to human health, with 36 million cases and 1 million deaths
worldwide as of October 9, 2020.1 Governments have sought to limit the spread of the virus and
mitigate the negative health outcomes of the disease through various policy measures that have
limited travel, imposed quarantines and lockdowns, and closed businesses and schools.11 In
addition to the economic burden of COVID-19 related morbidity and mortality, government
attempts to limit the spread of SARS-CoV-2 are having profound economic impacts, with the
global economy projected to shrink by 8%.2 To date, the greatest health and economic burden has
been borne by the Americas and Europe.1 However, recent evidence indicates that low-income
countries, with their limited health system capacities, are likely to suffer infection and mortality
rates similar to or greater than those currently suffered by upper-income countries.5 While research
on the health impacts of COVID-19 in low-income countries is rapidly emerging,3 there is limited
evidence on the socioeconomic impacts of the pandemic.4 The evidence that exists relies primarily
on pre-COVID-19 macroeconomic data and simulation models to forecast potential future
scenarios based on assumptions about the disease spread.6 In contrast, we rely on direct
measurements of socioeconomic indicators to present evidence on the effects of the pandemic on
households, individuals, and children living in low-income countries, as well as the actions that
households are taking to mitigate these impacts.
An acute challenge emerging from the global pandemic is how individuals and communities are
to strike the balance between the health benefits and the economic costs of managing the spread
of the virus.11 Even in high-income countries, which tend to be data rich in terms of health and
economic information, striking this balance frequently proves politically difficult. By contrast,
low-income countries, which tend to be resource-constrained, are data poor in terms of reliable
and timely information on the spread of SARS-CoV-2 and on the economic impacts of anti-
contagion policies. Our objective is to directly, at the household, individual, and child levels, the
socioeconomic impacts of the pandemic and the policies implemented to slow the spread of the
virus. Our hope is to learn from how individuals in these four countries cope with the
socioeconomic effects of the virus. This can inform decisions by governments and international
aid organizations regarding how best to mitigate the persisting effects of the COVID-19 pandemic.
2. Data and Methods
Our findings are based on the longitudinal data from the high-frequency phone surveys conducted
in Ethiopia, Malawi, Nigeria, and Uganda with support from the World Bank. Starting in May
2020, every month, the phone surveys aim to interview a national sample of households that had
been interviewed face-to-face prior to the COVID-19 pandemic as part of the national longitudinal
household surveys that have been supported under the World Bank Living Standards Measurement
Study – Integrated Surveys on Agriculture (LSMS-ISA) initiative.

3
The pre-COVID-19 LSMS-ISA-supported surveys that serve as sampling frames for the phone
surveys were designed to be representative at the national, regional and urban/rural levels. These
surveys include the Ethiopia Socio-economic Survey (ESS) 2018/19, Malawi Integrated
Household Panel Survey (IHPS) 2019, Nigeria General Household Survey (GHS) - Panel 2018/19,
and Uganda National Panel Survey (UNPS) 2019/20. In Ethiopia, Malawi, and Uganda, the phone
survey attempted to call all LSMS-ISA households for whom at least one phone number was
available either for a household member or for a reference individual. In Nigeria, a national sub-
sample was drawn from the universe of LSMS-ISA households with phone numbers. The
anonymized survey data and documentation are accessible through the World Bank Microdata
Library12-15 and are comparable across countries, based on the template questionnaire modules and
the phone survey sampling guidelines that were made publicly available by the World Bank prior
to the start of the phone survey activities (see Supplementary Materials – Methods).
We directly measure the effects of the pandemic on 8,603 households across the four countries, as
well as how households attempt to cope with these effects. We use well-established sampling
techniques7-9 to correct for potential selection bias associated with not interviewing households
that do not own mobile phones or that cannot be reached despite repeated call attempts (see
Supplementary Materials – Methods for more details on the calculation of phone survey sampling
weights). The correction for selection bias allows us to provide estimates of the total number of
households, individuals, and children associated with any of the reported outcomes.
We then use reduced-form econometric techniques,10 which are common to the field, in order to
estimate heterogeneity in effects across 1) countries, 2) rural and urban sectors, 3) pre-COVID-19
wealth, 4) gender, and 5) time (see Supplementary Materials - Methods). Tracking how people’s
lives are differentially affected by the COVID-19 pandemic can enable governments and policy
makers to better understand the circumstances faced by their citizenry and to make data-driven,
informed policy decisions. The need to understand the contemporaneous impacts and coping
strategies of households is and will continue to be important for low-income countries, as they are
likely to lack access to a vaccine for longer than high-income countries.16,17 The longitudinal data
collected through the high-frequency phone surveys cultivate this understanding by documenting
near-real-time trends.
3. Results
Government action is reflected in household knowledge of and behavior around COVID-19:
With the global spread of the SARS-CoV-2 virus, numerous low-income countries followed
worldwide trends by declaring states of emergency, issuing stay-at-home orders, closing schools,
and imposing curfews.18 Considering the countries in our data set, Ethiopia closed schools on
March 1619 and declared a state of emergency on April 8.20 Nigeria and Uganda issued stay-at-
home orders on March 29 and 30, respectively.21, 22 Malawi attempted to issue stay-at-home orders

4
on April 14,23 but the country’s High Court barred the government from implementing the
lockdown.24 As a result, Malawi, unlike the other countries in our study, instituted no stay-at-home
orders, though schools did close. This heterogeneity in government responses is reflected in the
data (Figure 1A), with individuals in Malawi significantly less likely to report that governments
and local authorities have taken specific steps to curb the spread of the virus (see Table S1 in
Supplementary Evidence).
This divergent path observed in Malawi also impacts individual knowledge of COVID-19 and the
adoption of behaviors to limit the spread of SARS-CoV-2. In Ethiopia, Nigeria, and Uganda,
knowledge about measures that can be adopted to reduce the risk of contracting the virus is
extremely high (Figure 1B). In Uganda, we estimate that over 90% of individuals are familiar with
all six mitigation measures asked about in the survey, while in Ethiopia and Nigeria at least 80%
of individuals are familiar with five of the six measures. By comparison, in Malawi, handwashing
with soap is the only mitigation strategy with which at least 80% of individuals are familiar. For
the other five mitigation strategies, Malawians are significantly less knowledgeable than those in
Ethiopia, Nigeria, or Uganda (Table S2).
The heterogeneity in knowledge between Malawi and the other three countries is reflected in
changing behavior related to the virus (Figure 1C). In Ethiopia, Nigeria, and Uganda we estimate
that adoption of handwashing is near universal, as is avoidance of physical contact within the week
prior to the interview. Even in Malawi, we estimate that 91% of individuals wash their hands more
frequently than before. While an estimated 80% to 90% of individuals in Ethiopia, Nigeria, and
Uganda report adapting their behavior to help reduce the spread of the virus, significantly fewer
do so in Malawi (Table S3). In Uganda and Malawi, where we have behavioral data over time, we
show that the number of people continuing to wash hands and avoid crowds decreases significantly
over the period of June to August 2020 (Tables S4 and S5).
The lack of knowledge and behavioral change in Malawi is further manifested in a greater
prevalence of beliefs in unproven, disproven, or false claims about the virus and the disease (Figure
1D). These data exist only for Malawi and Uganda. Malawians are significantly more likely than
Ugandans to believe that Africans are immune to the virus, that children are not affected by the
virus, and that the disease is no different than the common flu. While Malawians are significantly
more likely to hold several of these false beliefs (Table S6), the number of people in Uganda that
lack accurate information of SARS-CoV-2 is greater than the number in Malawi, due to Uganda’s
larger population. In Malawi, we estimate that 3.1 million individuals believe that the virus is just
the common flu, the most common false belief. In Uganda, the most common false belief is that
the virus cannot survive warm weather, with an estimated 6.1 million individuals subscribing to
this disproven claim (Table S7). An estimated 1.3 million to 3.3 million adults in each country
believe the other false claims. These represent substantial shares of the population in each country
and reveal the continued need for clear and accurate messaging about COVID-19.

5
Economic impacts and food security vary by country and gender of household head: As
countries declared states of emergency and issued stay-at-home orders, hundreds of millions of
individuals in low-income countries found themselves out of work, both in the formal and informal
labor markets.25 Correspondingly, households have lost income across a variety of sources (Figure
2A). We estimate that 256 million individuals - 77% of the population across the four countries -
live in households that have lost income due to the pandemic (Table S8). To have lost income from
a particular source, the household must have previously received income from that source; that is,
our estimates of losses are conditional on having received income from a given source in the
previous 12 months (Table S9). Considering country-level heterogeneity in income loss, Ethiopian
households are significantly less likely to have lost income from every source, except business
income, compared to the other three countries. The share of households that have lost income tends
to be the same across Malawi, Nigeria, and Uganda (Table S10). In the majority of cases, we find
no evidence of heterogeneity in income loss between rural and urban households (Table S11). This
suggests that income losses have been borne equally across the rural and urban populations, both
within and across countries. However, we do find evidence of heterogeneity in income loss by
gender (see Figure S1A in Supplementary Evidence). Female-headed households are significantly
more likely to lose income from remittances while male-headed households are significantly more
likely to lose income from other sources, including from investments, savings, pensions, and
government assistance (Table S12).
While households have lost income from a variety of sources, we focus on losses to non-farm
enterprises, as they are the income sources likely to be most affected by shutdown and lockdown
orders. An estimated 35% of households across all four countries operated a non-farm enterprise
(NFE) prior to the pandemic. Of these, a majority report that revenue is down, compared with pre-
COVID-19 levels (Figure 2B). As with income losses, reduced revenue from NFEs varies by
country. We estimate that Ethiopians with NFEs are significantly less likely to experience revenue
losses than their Nigerian, Malawian, and Ugandan counterparts. Conversely, Ugandans with
NFEs are significantly more likely to experience revenue loss than those in the other countries.
Modeling these dynamics over time shows that some NFEs are recovering revenue relative to
previous rounds: across all countries, significantly more individuals are making the same or greater
revenue than they were in the first round of interviews. However, in Ethiopia and Nigeria the
estimated differences between the second and third rounds are not significantly different from one
another (Table S13). This suggests the lack of a clear trajectory in recovery for household
businesses over the coming months.
Estimating these income and revenue losses is important as they may have reverberating impacts
on other elements of the household economy, in particular food security. We estimate the
prevalence of food insecurity among the adult population, as measured by the Food Insecurity
Experience Scale (FIES) (see Supplementary Materials - Methods). Based on our estimates, 61%
of the adult population, representing more than 100 million adults across all four countries, suffer
6
moderate or severe food insecurity. Severe food insecurity alone affects an estimated 38 million
adults, or 23% of the adult population (Table S14). Using the pre-COVID-19 LSMS-ISA survey
data, we can calculate household annual per capita income to generate consumption quintiles (see
Supplementary Materials - Methods). Examining heterogeneity across consumption quintiles,
poorer households (in lower quintiles) suffer significantly greater prevalence of food insecurity
(Figure 2C). Further, there is significant heterogeneity in the prevalence of food insecurity, across
countries (Table S15). Nigeria suffers from the greatest prevalence food insecurity where an
estimated 76% of adults (63 million) are moderately or severely food insecure. This is followed
by Malawi with 68% (6.2 million), Ethiopia with 47% (24 million) and Uganda with 33% (6.9
million). As with loss of income, there is a high degree of heterogeneity based on the gender of
the household head (Figure S1B). Since the global pandemic began, female-headed households
have significantly higher prevalence of moderate and/or severe food insecurity than male-headed
households, though food insecurity is decreasing over time at an equal rate for adults in both types
of households (Table S16).
Levels of concern are high across all four countries: an estimated 257 million individuals (78%)
are concerned that someone will fall ill with COVID-19 and 292 million individuals (88%) are
concerned about COVID-19-related financial threats (Table S17). Higher prevalence of food
insecurity is associated with concerns about household health and financial status, especially in
Malawi (Figure 2D). There is substantial heterogeneity in the degree of concern over health and
finances based on food insecurity, initial wealth, and the gender of the household head. Those
concerned about the financial threat of COVID-19 have a significantly higher prevalence of food
insecurity than those unconcerned about financial threats (Table S18). At the same time concerns
about household finances do not vary by the gender of the household head nor across pre-COVID-
19 consumption quintiles (Tables S19 and S20; Figures S1C and S2). The opposite is true for those
concerned about household health: differences are not significant based on food insecurity, though
male-headed households and households from the lowest two consumption quintiles are
significantly more likely to be concerned about someone falling ill with COVID-19 than the
relevant comparison group. This sort of variation provides no clear pattern regarding who is
concerned about finances versus health and why, though it is clear that COVID-19 related concerns
weigh heavily on individuals in many contexts.
Households struggle to access medicine, staple foods, and education: Since the closure of
schools and the issuance of emergency stay-at-home orders, households have suffered a variety of
economic shocks, including job loss, closure of a business, or the lack of availability of farm inputs.
In total, an estimated 25 million households have suffered a virus-related shock to their income,
around 42% of all households. This ranges from 26% of households (5 million) in Ethiopia to 56%
of households (15 million) in Nigeria (Table S21). Households have adopted a number of strategies
to try and cope with these shocks (Figure 3A). To employ a coping strategy a household must have
previously experienced an economic shock; that is, our estimates for the adoption of each coping

7
strategy are conditional on exposure to a shock. The specific coping strategy that households adopt
is context dependent, but the estimated number of households adopting some strategy is indicative
of the scale of economic loss. In total, an estimated 33 million households, about 56% of the
household population across the four countries, have adopted some coping strategy (Table S22).
These strategies include living off of savings (12 million), selling assets (3.5 million), reducing
food or non-food consumption (21 million and 6.5 million, respectively), receiving help from
family (8.1 million), and receiving government assistance (4.3 million), though there is significant
heterogeneity across countries (Table S23). This is also heterogeneity between rural and urban
households: we estimate that rural households are significantly more likely to rely on the sale of
assets, while urban households are significantly more likely to reduce food consumption or rely
on friends and family (Table S24). In terms heterogeneity by gender of the household head, male-
headed households are significantly more likely to rely on savings, sale of assets, and on reducing
non-food consumption (Figure S1D, Table S25). Female-headed households are significantly more
likely than male-headed ones to receive assistance from the government or an NGO.
The challenges of coping with lost income are exacerbated by the inability to purchase basic
necessities (Figure 3B). Conditional on the households having sought to purchase medicine, an
estimated 20% are unable to buy what they need. Access to staple foods is even more limited, with
an estimated 24% of households unable to purchase the staple. Soap is relatively more available,
with only an estimated 12% of households unable to purchase soap when they needed it (Table
S26). This lack of access to basic necessities varies by consumption quintile. Households that were
in the lowest consumption quintile before the global pandemic are significantly less likely to be
able to access medicine than households that were in the highest consumption quintile (Table S27).
Similarly, households in the lowest consumption quintile are less likely to have access to staple
foods and soap than households in other quintiles. The disproportionate burden of the disease on
the poorest has been noted previously,26 and the distribution of the economic burden has been
speculated on,27 but we provide econometric evidence of this playing out in the past few months
among the surveyed households.
Prior to the spread of SARS-CoV-2, the global community made substantial progress towards
completing Millennium Development Goal 2: universal primary education. As of 2015, primary
school enrollment rates in low-and middle-income countries had reached 91%.28 Based on our
data, an estimated 96% of households with school-aged children had their children attending
school before the outbreak. Following the outbreak and school closures, the incidence of school-
aged children engaging in any learning activity fell to an estimated 46% and we estimate the
incidence of student-teacher contact at just 17%. These estimates amount to 68 million school-
aged children across in the four countries without any education engagement (Table S28). As with
access to basic necessities, there is a disproportionate lack of access to education among poorer
households (Figure 3C). Children from households in the top 40 percent of the pre-COVID-19

8
consumption distribution were significantly more likely to be engaged in any learning activity after
the outbreak than children from households in the lower quintiles (Table S29).
The loss of educational contact is widespread and likely to have long-term impacts, though we
find evidence that households are using technologies, such as radios, televisions, and mobile
learning apps, to mitigate educational losses (Figure 3D). While millions of children in these
countries are participating in various types of educational contact, millions more are unable to do
so. We estimate that the share of households with school-aged children using these technologies
to be below 50%. This may have short-term consequences for adults trying to return to work, as
well as long-term consequences on children’s educational attainment. Further, linkages between
economic outcomes and educational attainment already exist: the incidence of moderate or severe
food insecurity is significantly higher in households whose school-aged children are not engaged
in learning activities (Table S30; Figure S3). There is good news, though, in that our estimates
show engagement with several of these technologies is increasing over time. In Ethiopia, Malawi,
and Nigeria there has even been significant increases in student contact with teachers (Table S31).
4. Discussion
In order to formulate policies and target resources at mitigating the adverse health and economic
impacts of the COVID-19 pandemic, governments, international organizations, NGOs, and other
stakeholders need reliable and timely data and estimates of the circumstances faced by individuals
and households.
The results presented here illustrate some of the first evidence of the socioeconomic impacts of
the COVID-19 pandemic in low-income countries. Governments in these countries were already
facing complex and mutually reinforcing development challenges prior to the pandemic, and the
arrival of a COVID-19 vaccine in the region is not expected until 2022.16,17 Our econometric
analysis relies on sampling techniques to correct for bias and reduced-form methods and is focused
on Ethiopia, Malawi, Nigeria, and Uganda. Our findings give insight on government policies and
perceptions related to suppression of the virus, as well as consequences related to income loss,
food security, education, and the ability to access and purchase basic necessities. Although false
beliefs about COVID-19 are prevalent, government action to limit the spread of the disease is
associated with greater knowledge about the disease and increased uptake of precautionary
measures. We estimate that 256 million individuals, around 77% of the population across the four
countries, live in households that have lost income due to the pandemic. Attempts to cope with
this lost income are exacerbated by an inability to access medicine and staple foods for an
estimated 20% to 25% of households who need these items. Income loss and lack of access to
necessities have disproportionately been borne by households that were already impoverished prior
to the pandemic, as well as female-headed households. Finally, the loss of educational access has

9
been profound, as the rate of maintaining student-teacher contact dropped to an estimated 17%
among households with school-aged children.
Presently, it is not possible to reliably predict the trajectory of SARS-CoV-2 and its impacts within
any given country. The precise mortality and disease burden, and the economic benefits and
drawbacks of different approaches to controlling the virus, remain unknown. We present some of
the first results of the economic burden of the global pandemic in low-income countries, where
data have proven particularly scarce. The need to understand the contemporaneous socioeconomic
impacts of the pandemic and the related restrictions on households, individuals, and children will
continue to be important for evidence-based policy making.
References
1. WHO, Coronavirus disease (COVID-19) Weekly Epidemiological Update. (2020);
https://www.who.int/docs/default-source/coronaviruse/situation-reports/20200921-weekly-
epi-update-6.pdf?sfvrsn=d9cf9496_6.
2. World Bank. Global Economic Prospects, June 2020. (World Bank, Washington, D.C., 2020);
DOI: 10.1596/978-1-4648-1553-9.
3. M. Mbow, et al., COVID-19 in Africa: Dampening the storm? Science 369, 624-626 (2020).
4. D. Laborde, W. Martin, J. Swinnen, R. Vos, COVID-19 risks to global food security. Science
369, 500-502 (2020).
5. P.G.T. Walker, et al., The impact of COVID-19 and strategies for mitigation and suppression
in low- and middle-income countries. Science 369, 413-422 (2020).
6. H. Morsey, L. Balma, and A.N. Mukasa, ‘Not a good time’: Economic impact of COVID-19
in Africa. (African Development Bank Group, Working Paper Series #338, 2020).
7. W.G. Cochran, Sampling Techniques, 3rd ed. (Wiley, New York, 1977).
8. K. Himelein, Weight Calculations for Panel Surveys with Subsampling and Split-off Tracking.
Statistics and Public Policy 1 (1): 40 – 45 (2014).
9. Y, Tillé. Sampling Algorithms (Spring, New York, 2006).
10. Greene, W.H. Econometric Analysis, 8th ed. (Pearson, New York, 2017).
11. S. Hsiang, et al., The effects of large-scale anti-contagion policies on the COVID-19 pandemic.
Nature 584, 262-267 (2020).
12. World Bank, Ethiopia - High-Frequency Phone Survey on COVID-19 2020. (World Bank,
Washington, D.C., 2020); https://microdata.worldbank.org/index.php/catalog/3716.
13. World Bank, Malawi - High-Frequency Phone Survey on COVID-19 2020. (World Bank,
Washington, D.C., 2020); https://microdata.worldbank.org/index.php/catalog/3766.
14. World Bank, Nigeria - High-Frequency Phone Survey on COVID-19 2020. (World Bank,
Washington, D.C., 2020); https://microdata.worldbank.org/index.php/catalog/3712.
15. World Bank, Uganda - High-Frequency Phone Survey on COVID-19 2020. (World Bank,
Washington, D.C., 2020); https://microdata.worldbank.org/index.php/catalog/3765.

10
16. R. Khamsi, If a coronavirus vaccine arrives, can the world make enough? Nature 580, 578-80
(2020).
17. WHO, WHO calls for equitable access to future COVID-19 vaccines in Africa (2020);
https://www.afro.who.int/news/who-calls-equitable-access-future-covid-19-vaccines-africa.
18. "PERC: Brief on Public Health and Social Measure Implementation in Africa," Africa CDC
Tech. Rep. (2020); https://africacdc.org/download/perc-brief-on-public-health-and-social-
measure-implementation-in-africa/.
19. A. Khodr, With schools closed due to COVID-19, Ethiopia grapples with providing distance
education to children. (UNICEF. Addis Ababa, 2020);
https://www.unicef.org/ethiopia/stories/schools-closed-due-covid-19-ethiopia-grapples-
providing-distance-education-children.
20. Proclamation 3/2020 - A State of Emergency Proclamation Enacted to Counter and Control
the Spread of COVID-19 and Mitigate Its Impact. (Addis Ababa, 2020);
https://www.ilo.org/dyn/natlex/natlex4.detail?p_isn=110046&p_lang=en.
21. Address by H.E. Muhammadu Buhari, President of the Federal Republic of Nigeria on the
COVID-19 pandemic. (Abuja, 2020); https://www.nigerianembassy.ru/index.php/address-
buhari-about-covid19.html.
22. More guidelines on COVID19, preventive measures & the need for a shut down - President
Museveni. (Kampala, 2020); https://www.statehouse.go.ug/media/press-
releases/2020/03/30/more-guidelines-covid19-preventive-measures-need-shut-down-
president.
23. Speech by President Mutharika on 21-day Covid-19 lockdown. (Lilongwe, 2020);
https://malawi.un.org/en/46797-speech-president-mutharika-21-day-covid-19-lockdown.
24. Republic of Malawi in the High Court of Malawi, Lilongwe District Registry, Judicial Review
Cause No. 22 of 2020, Before Honorable Justice Kenyatta Nyirenda, “Order granting
permission to apply for judicial review and interlocutory order of injunction,” (Lilongwe,
2020); https://perma.cc/MML4-8FNU.
25. ILO, ILO Monitor: COVID-19 and the world of work. 6th edition. (ILO, Genève, 2020).
26. F. Ahmed, N. Ahmed, C. Pissarides, and J. Stiglitz, Why inequality could spread COVID-19.
Lancet Public Health 5, e240 (2020).
27. D. Laborde, W. Martin, R. Vos, Poverty and food insecurity could grow dramatically as
COVID-19 spreads (IFPRI, Washington, D.C., 2020); https://www.ifpri.org/blog/poverty-and-
food-insecurity-could-grow-dramatically-covid-19-spreads
28. The Millennium Development Goals Report 2015 (United Nations, New York, 2015).
Acknowledgments: We gratefully acknowledge the research assistance provided by Ann Furbush
and Joshua Brubaker. We also owe a great debt to the individuals involved in the design,
implementation and dissemination of high-frequency phone surveys on COVID-19, specifically
the World Bank Living Standards Measurement Study (LSMS) team, and the phone survey

11
managers and interviewers at the Malawi National Statistical Office, the Nigeria Bureau of
Statistics, the Uganda Bureau of Statistics, and Laterite Ethiopia.
Author contributions: Authors are listed alphabetically. Anna Josephson: conceptualization,
formal analysis, data curation, writing - original draft, visualization. Talip Kilic: conceptualization,
investigation, writing - review & editing, visualization. Jeffrey D. Michler: conceptualization,
formal analysis, data curation, writing - original draft, visualization. All authors contributed to the
final draft.
Competing interests: Authors declare no competing interests.

Figure 1: Knowledge of COVID-19 restrictions, behaviors, and false beliefs
(A) Percentage of individuals with knowledge regarding government actions undertaken to curb the spread of COVID-19. (B) Percentage of individuals with knowledge of actions that an individual can take to reduce exposure toCOVID-19. (C) Percentage of individuals reporting a change in behavior in the previous 7 days. (D) Percentage ofindividuals in Malawi and Uganda with beliefs about common misconceptions regarding coronavirus.
0
20
40
60
80
100
Indi
vidu
al’s
Kno
wle
dge
of g
over
nmen
t act
ions
to c
urb
spre
ad (
%)
Ethiopia Malawi Nigeria Uganda
A
Advised to stay home Restricted travel Closed schoolsCurfew/lockdown Closed businesses Stopped social gatherings
0
20
40
60
80
100
Indi
vidu
al’s
kno
wle
dge
of a
ctio
ns to
red
uce
expo
sure
(%
)
Ethiopia Malawi Nigeria Uganda
B
Handwash with soap Avoid physical contact Use masks/glovesStay at home Avoid crowds Socially distance
0
20
40
60
80
100
Indi
vidu
al’s
cha
nge
in b
ehav
ior
to r
educ
e ex
posu
re (
%)
Ethiopia Malawi Nigeria Uganda
C
Increased hand washing Avoided physical contact Avoided crowds
0 20 40 60 80 100Percent
Coronavirus is justcommon flu
Coronavirus cannot survivewarm weather
Coronavirus does notaffect children
Africans are immuneto coronavirus
Uganda
Malawi
Uganda
Malawi
Uganda
Malawi
Uganda
Malawi
D
False True

Figure 2: Household income, food insecurity, and concerns about COVID-19
(A) Percentage of households reporting loss of income sources, by country and rural/urban residence. (B) Percentageof households reporting change in business revenue, by country and round. (C) Prevalence of moderate and/or severefood insecurity among adult individuals, by country and pre-COVID-19 household annual per capita consumptionquintile. (D) Prevalence of food insecurity among adult individuals, by country and COVID-19-related concernslinked to health and finance.
0
20
40
60
80
100
Hou
seho
lds
repo
rtin
g de
crea
se in
inco
me
(%)
Ethiopia Malawi Nigeria UgandaRural Urban Rural Urban Rural Urban Rural Urban
A
Farm income Business income Wage incomeRemittances All else
0 20 40 60 80 100
Ethiopia
July
June
May
0 20 40 60 80 100
MalawiJuly
June
0 20 40 60 80 100
Nigeria
July
June
May
0 20 40 60 80 100
Households reporting change in business revenue (%)
UgandaJuly
June
B
Higher than before Same as before Less than before
0
20
40
60
80
100
Pre
vale
nce
of m
oder
ate
or s
ever
e fo
od in
secu
rity
Ethiopia Malawi Nigeria Uganda0
20
40
60
80
100
Pre
vale
nce
of s
ever
e fo
od in
secu
rity
Ethiopia Malawi Nigeria Uganda
C
First Quintile Second Quintile Third QuintileFourth Quintile Fifth Quintile
0 20 40 60 80 100Prevalence of food insecurity
Uganda
Malawi
Ethiopia
YesNo
YesNo
YesNo
Concerned that family or self will fall ill with COVID−19
0 20 40 60 80 100Prevalence of food insecurity
Uganda
Malawi
Ethiopia
YesNo
YesNo
YesNo
Concerned about the financial threat of COVID−19
D
Moderate or severe Severe

Figure 3: Household coping strategies and access to basics necessities
(A)Percentage of households reporting use of coping strategy, by country and rural/urban residence. (B) Share ofhouseholds reporting a lack of access to medicine, staple food, and soap, by country and pre-COVID-19 householdannual per capita consumption quintile. (C) Percentage of households with school-aged children experiencing ed-ucational contact, by country and survey round. (D) Percentage of households with children engaged in learningactivities, by country and pre-COVID-19 household annual per capita consumption quintile.
0
20
40
60
80
100
Hou
seho
lds
repo
rtin
g us
e of
cop
ing
stra
tegy
(%
)
Ethiopia Malawi Nigeria UgandaRural Urban Rural Urban Rural Urban Rural Urban
A
Relied on savings Sale of asset Reduced food cons.Reduced non−food cons. Help from family Received assistanceDid nothing
0
20
40
60
80
100
Pre
vale
nce
of h
ouse
hold
’s in
abili
ty to
buy
med
icin
e (%
)
Ethiopia Malawi Nigeria Uganda0
20
40
60
80
100
Pre
vale
nce
of h
ouse
hold
’s in
abili
ty to
buy
sta
ple
food
(%
)
Ethiopia Malawi Nigeria Uganda0
20
40
60
80
100
Pre
vale
nce
of h
ouse
hold
’s in
abili
ty to
buy
soa
p (%
)
Malawi Nigeria Uganda
B
First Quintile Second Quintile Third QuintileFourth Quintile Fifth Quintile
0
20
40
60
80
100
Hou
seho
lds
with
chi
ldre
n en
gage
d in
lear
ning
act
iviti
es (
%)
Ethiopia Malawi Nigeria Uganda
C
First Quintile Second Quintile Third QuintileFourth Quintile Fifth Quintile
0
20
40
60
80
100
Hou
seho
lds
with
chi
ldre
n ex
perie
ncin
g ed
ucat
iona
l con
tact
(%
)
EthiopiaMay June July
0
20
40
60
80
100
MalawiJune July
0
20
40
60
80
100
NigeriaMay June July
0
20
40
60
80
100
UgandaJune
D
Listened to educational radio programs Using mobile learning appsWatched education television Session with teacher

15
Supplementary Materials
Methods
Data Collection: This paper leverages high-frequency phone surveys on COVID-19 that were
implemented in Ethiopia, Malawi, Nigeria, and Uganda during the period of May-July 2020, with
support from the World Bank Living Standards Measurement Study (LSMS) and the Poverty and
Equity Global Practice. In each country, the phone survey aims to conduct monthly phone
interviews, for a period of 12 months. The sample for these surveys is a national sample of
households that had been interviewed during the latest round of the national longitudinal household
survey implemented by the respective national statistical office, with financial and technical
assistance from the World Bank LSMS-ISA initiative. Please see below for more information on
the calculation of phone survey sampling weights.
The implementing agency for the phone survey in Ethiopia, Malawi, Nigeria, and Uganda, is,
respectively, Laterite Ethiopia, Malawi National Statistical Office, Nigeria Bureau of Statistics,
and Uganda Bureau of Statistics. The anonymized, unit-record phone survey data associated with
each monthly survey round are made publicly available, within approximately four weeks of
completion of phone interviews, through the World Bank Microdata Library, under the High-
Frequency Phone Survey collection: http://bit.ly/microdata-hfps.
The publicly-available data for each survey round is coupled with a basic information document,
interview manual, and questionnaire for that round, which can be accessed through the following:
● Ethiopia: http://bit.ly/ethiopia-phonesurvey
● Malawi: http://bit.ly/malawi-phonesurvey
● Nigeria: http://bit.ly/nigeria-phonesurvey
● Uganda: http://bit.ly/uganda-phonesurvey
The approach to the phone survey questionnaire design and sampling is comparable across
countries. It is informed by the template questionnaire and the phone survey sampling guidelines
that have been made publicly available by the World Bank. These can be accessed through the
following:
● Template Questionnaire: http://bit.ly/templateqx
● Manual: http://bit.ly/interviewermanual
● Sampling Guidelines: http://bit.ly/samplingguidelines.
All regressions and results presented in the paper are based on the publicly available data from the
World Bank Microdata Library. Data is downloaded from the website and processed using Stata

16
16.1. All cleaning, processing, and analysis was conducted by the research team and the code is
available29.
Food Insecurity Experience Scale: The estimates of prevalence of (i) moderate or severe and (ii)
severe food insecurity among adult individuals are based on the eight-question Food Insecurity
Experience Scale (FIES), which was included as a module in the high-frequency phone survey.
The FIES is an experience-based metric of food insecurity severity, which relies on people’s direct
responses to questions about their experiences with access to adequate food. This metric makes it
possible to compare prevalence rates of food security across national and sub-national
populations30. Widely used around the world, FIES is an appropriate measure for assessing food
security as it is a direct measure of food insecurity which produces comparable estimates of food
insecurity experienced by people in different contexts.
In the high-frequency phone surveys that inform our analyses, the FIES questions had a reference
period of the last 30 days. Following the FIES standard survey model, eight questions were asked,
aimed to capture whether the respondent or other adult households members: (i) were worried they
would not have enough to eat, (ii) were unable to eat healthy and nutritious food, (iii) ate only a
few kinds of foods, (iv) had to skip a meal, (v) ate less than they thought they should, (vi) ran out
of food, (vii) were hungry but did not eat, and (viii) went without eating for a whole day.
The approach to process and analyze FIES data comes from Item Response Theory31, also known
as the Rasch model32, which accounts for the measurement of unobservable traits through the
analysis of responses to survey. Analysis of FIES data involves parameter estimation, statistical
validation, and calculation of individual and population prevalence estimates, as appropriate, for
food insecurity. In this analysis, a respondent’s raw score (an integer number between zero and
eight) is determined. Based on this raw score, an interval measure of the severity of food security,
based on global standards, is determined, by equating (calibrating the score on a common metric)33.
Equating is completed for each household, which allows us to estimate the probability of (i)
moderate or severe and (ii) severe food insecurity among adult household members. Following
procedures detailed by the Food and Agriculture Organization of the United Nations and the
associated program, Voices of the Hungry, we calculate FIES for households in our data as
follows:
1. Beginning with Stata constructed data files, we construct binary variables for each of the
eight FIES components that take a value of 1 for “Yes”, and 0 for “No” answers (and leave
untouched any missing answers). We reorder the variables and recode the variable names
to ensure the following order and naming convention: Worried, Healthy, FewFood,
Skipped, AteLess, RunOut, Hungry, and WhlDay.
2. We construct adult population weights (𝑤𝑎), by multiplying household sampling weights
(𝑤𝑖,𝑓𝑖𝑛𝑎𝑙) with the count of adult members in each household. This household sampling

17
weight is retained. The resulting file is exported to .csv format. We upload the .csv file to
the FIES Shiny App: https://fies.shinyapps.io/ExtendedApp/, which was developed by the
Food and Agriculture Organization of the United Nations (FAO), the custodian agency for
FIES34.
3. In the App, under the “Item and Raw Score Stat” tab, we check the Infit statistic for each
component. If it is not within the bounds 0.7 and 1.3, it is dropped from the analysis. At
least six questions should be retained in this step.
4. We equate the included items to the global standard. It is sometimes the case that some
items may diverge from the global standard to be included in the calibration of the country
scale to the global standard. The rule then is to exclude items that differ by > 0.35. This is
accomplished in the “Equating” tab. If there were multiple items differing by > 0.35 in
our sample, we iterate on which set of items to exclude. At least five items must be retained
for a robust estimation. The items that are excluded from the equating procedure are not
dropped entirely from the construction of the FIES indicators but are simply ignored when
equating the country scores to the global standard.
5. Under the “Additional Information” tab, we next “download respondent-level model-based
variables”. This provides a dataset with as many rows as the .csv file that was uploaded
into the Shiny App in step #2. This downloaded dataset includes the estimates of prevalence
of (i) moderate or severe and (ii) severe food insecurity among adult individuals in
accordance with the “raw score” for each household (that is, the count of “yes” answers
across the eight questions).
6. We import the data downloaded in step #5 into Stata and using “raw score” as the linking
variable, merge it with other Stata formatted data files that are defined at the household-
level.
Consumption quintiles: To define pre-COVID-19 household per capita consumption quintiles,
we rely on the pre-public-dissemination versions of the consumption aggregates. These are
provided by the Living Standards Measurement Study (LSMS) team on an exceptional basis, with
clearance from the respective NSOs, for the pre-COVID-19 LSMS-ISA-supported surveys that
serve as a sampling frame for the high-frequency phone surveys on COVID-19. In the case of
Ethiopia, Nigeria and Malawi, the consumption aggregates are computed by the respective NSO,
with technical assistance from the LSMS. In the case of Uganda, the consumption aggregate is
computed by and has been obtained from the Uganda Bureau of Statistics. In the specific case of
Malawi, the consumption aggregate is for the IHPS 2016, as this information is unavailable for the
IHPS 2019.
Econometric Analysis
Phone Survey Weights: Since we rely on phone interviews with a sample of households that had
been interviewed face-to-face prior to the COVID-19 pandemic as part of the LSMS-ISA-

18
supported national longitudinal household survey, there are two potential sources of bias in the
resulting data: (i) selection bias associated with not being able to call LSMS-ISA households that
do not own mobile phones and (ii) non-response bias associated with not being able to interview
households that are targeted for phone interviews. Without correcting for these two sources of bias,
results of our analysis are likely to underestimate the negative impacts of COVID-19, since poorer
households are less likely than wealthier households to have phones, and less likely to respond
even if they do have phones.
In our analysis, we use the phone survey weights that are provided in public use datasets and that
are computed in an attempt to address the aforementioned potential sources of bias using well-
established sampling techniques.7,9. The phone survey weights in each country build on the
sampling weights for the associated LSMS-ISA-supported survey. They are calibrated to address
the selection bias introduced from LSMS-ISA households not owning a mobile phone and non-
response bias from not answering the phone. This latter issue is overwhelmingly due to non-
working phone numbers or prospective respondents not answering calls (as opposed to refusals).
To calculate survey weights for the phone survey, we implement the following steps in Ethiopia,
Malawi, and Uganda8.
1. We begin with the existing sampling weight for each household, as computed for the
associated LSMS-ISA-supported survey (𝑤𝑖,𝑝𝑟𝑒), which are available in those datasets.
2. We calculate the probability of selection into the phone survey for each household (𝑝𝑖), as
the total number of LSMS-ISA households for which contact was attempted in that
household’s region (𝑚𝑟) divided by the total number of LSMS-ISA households in that
region (𝑀𝑟).
𝑝𝑖 =𝑚𝑟
𝑀𝑟
3. We multiply the existing LSMS-ISA sampling weight with the reciprocal of the probability
of selection in the phone survey, as calculated in step #2.
𝑤𝑖,𝑝ℎ𝑜𝑛𝑒 = 𝑤𝑖,𝑝𝑟𝑒
1
𝑝𝑖
4. Using the entire LSMS-ISA sample, we run a multivariate logistic regression in which the
dependent variable is a binary variable that is equal to 1 for LSMS-ISA households that
were successfully interviewed for the phone survey and equal to 0 otherwise. The
independent variables included represent a range of household, dwelling, and head of
household attributes that predict the likelihood of a completed phone survey interview.

19
Pr(phone = 1) = 𝐹 (𝛽0 +∑𝛽𝑘𝑋𝑘
𝐾
𝑘=1
)
The independent variables included vary by country and round, since the sampling frame
and survey instrument vary by country and round. The basic information document for
each phone survey provides specifics of what variables are included.
5. We predict the probability of response (i.e. propensity score) and create ten equal groups
(deciles) for this variable. Within each decile 𝑑, we compute the mean value and take the
reciprocal as the phone survey attrition correction factor for observations in each decile
(𝑎𝑐𝐷=𝑑):
𝑎𝑐𝐷=𝑑 =1∑ phone𝑖̂𝑁𝑖=1
𝑁
⁄
where phone𝑖̂ is the predicted value (i.e. propensity score) for each observation 𝑖. 𝑁 is the
total number of individuals in each decile. We then apply the attrition correction factor to
the adjusted household sampling weight as derived in step #3.
𝑤𝑖,𝑎𝑐 = 𝑎𝑐𝐷=𝑑 ∗ 𝑤𝑖,𝑝ℎ𝑜𝑛𝑒
6. We winsorize the resulting weight (𝑤𝑖,𝑎𝑐) by replacing the top two percent of observations,
with the value at the 98th percentile cut-off point.
7. Finally, we post-stratify weights to reduce standard errors and to match the projected
population totals at the highest spatial resolution possible, ranging from region to district,
based on the data availability in each country. Population projections come from national
statistic bureaus, often as part of census data. The post-stratification weights (𝑤𝑝𝑠) are
calculated as the weighted total number of observations from the data divided by the census
projections:
𝑤𝑝𝑠 =∑ 𝑤𝑖,𝑎𝑐𝑀𝑟𝑖=1
𝑝𝑜𝑝𝑢𝑙𝑎𝑡𝑖𝑜𝑛
where 𝑀𝑟 is the total population in the region, or whatever is the highest spatial resolution
available, and 𝑝𝑜𝑝𝑢𝑙𝑎𝑡𝑖𝑜𝑛 is the national statistic bureau’s projected population for that
region. The final weight is then calculated as:
𝑤𝑖,𝑓𝑖𝑛𝑎𝑙 = 𝑤𝑝𝑠 ∗ 𝑤𝑖,𝑎𝑐
In our case, post-stratification is not a major adjustment to the weights but a fine tuning of
their values.
In the case of Nigeria, to obtain a nationally representative sample for the phone survey, a sample
size of approximately 1,800 successfully interviewed households was targeted. Based on the

20
experience with prior phone surveys in Nigeria, a response rate of 60% was assumed, implying
that the required number of households to contact in order to reach the interview target was 3,000.
These households were selected from the frame of 4,934 GHS-Panel households with at least one
phone number for a household member or a reference individual. Given the large amount of
auxiliary information available in the GHS-Panel for these households, a balanced sampling
approach (using the cube method) was adopted35. This balanced sampling approach enables
selection of a random sample that still retains the properties of the pre-COVID sampling frame
across selected covariates. Balancing on these variables results in a reduction of the variance of
the resulting estimates, assuming that the chosen covariates are correlated with the target variable.
Calibration to the balancing variables after the data collection further reduces this variance9. The
sample was balanced across several important dimensions: state, sector (urban/rural), household
size, per capita consumption expenditure, household head sex and education, and household
ownership of a mobile phone.
Reduced form estimation: The reduced form econometric methods applied here describe
behavior of the various outcomes of interest in the data (e.g. food security, education, income loss).
This setup allows us to make inference and conduct more complex statistical tests with multiple
controls for differences across populations than simple univariate tests for differences in means10.
For a given outcome, 𝑦, define the conditional expectation function (CEF)36 as:
E[𝑦𝑖|𝑋𝑖 = 𝑥] = ∫𝑡𝑓𝑦(𝑡|𝑋𝑖 = 𝑥)𝑑𝑡
Here the CEF is the expectation, or sample mean, of individual outcomes 𝑦𝑖, given a 𝑘 × 1 vector
of covariates 𝑋𝑖, which is held fixed. The conditional density function of 𝑦𝑖 is 𝑓𝑦(𝑡|𝑋𝑖 = 𝑥). In our
case, the expectation is the mean in the population-weighted sample surveyed by the high-
frequency phone surveys on COVID-19. Given that the calculated weights correct for selection
bias and non-response bias, the CEF allows us to make unbiased inference about the impact of a
specific 𝑥𝑘 (a single covariate element in 𝑋) on the outcome for the national population. Stated
another way, we can use the weighted sample CEF to learn about the population CEF.
Using the law of iterated expectations, we can rewrite the CEF as:
𝑦𝑖 = E[𝑦𝑖|𝑋𝑖] + 𝜖𝑖
where 𝜖𝑖 is mean independent of 𝑋𝑖. For an arbitrary function 𝛽(𝑋𝑖), the CEF solves:
E[𝑦𝑖|𝑋𝑖] = argmin𝛽(𝑋𝑖)
E [(𝑦𝑖 − 𝛽(𝑋𝑖))2]
which is simply the minimum mean squared error prediction problem. Using the first order
condition, the solution is 𝛽 = E[𝑋𝑖𝑋𝑖′]−1E[𝑋𝑖𝑦𝑖], which is the well-known least squares

21
estimator10. To ensure correct inference of statistical tests, we calculate Huber-White robust
standard errors, which correct for heteroskedasticity.
Our reduced form approach to estimating the weighted CEF allows us to produce unbiased
estimates of impacts of covariates on the population as a whole without explicitly describing the
underlying mechanisms. However, this approach can only plausibly identify causal effects and
requires the maintained assumption that E[𝜖𝑖|𝑋𝑖] = 0. In some cases, this assumption is easily
maintained, such as testing for the effect of living in one country versus another on COVID-19
related loss in income. That a particular household 𝑗 lives in Ethiopia as opposed to Nigeria is
unlikely to be correlated with any relevant (non-ignorable) omitted variables. Obviously, our
reduced form approach allows us to say nothing about why households in Ethiopia have lost less
income due to COVID-19 than households in Nigeria. The approach simply allows us to produce
an unbiased estimate of the likelihood that a household in Ethiopia has lost income and compare
it to the likelihood for households in Nigeria. This allows us to conclude that the simple fact of
living in Ethiopia means that COVID-19 has had a different impact on household 𝑗’s income
relative to the impact the disease would have had had the household lived in Nigeria.
However, in some cases, such as the gender of the household head or the location of a household
in a rural region, the assumption of exogeneity may be more difficult to maintain. As an example,
it is possible for the likelihood that household 𝑗 is female-headed to be correlated with an omitted
variable, such as disease susceptibility of male household members, and also correlated with
concern for COVID-19 related health impacts. If male members of household 𝑗 are more likely to
die young due to disease, then that household is more likely to be female-headed and may also be
more likely to be concerned about additional disease burdens. In this case, estimates of the effect
of living in a female-headed household on COVID-19 related health concerns may be biased.
Because of this, we encourage the reader to be cautious in interpreting some regression results as
causal effects. This concern does not apply to estimates of population weighted means or totals,
bias in which are fully corrected for by our calculation of sampling weights.
References
29. A. Josephson and J.D. Michler. Socioeconomic impacts of COVID-19 in low income
countries: Replication Code, Version 1.0, Zenodo (2020);
https://doi.org/10.5281/zenodo.4060416.
30. Food and Agriculture Organization of the United Nations: Voices of the Hungry. Bringing
experience-based food insecurity measurement to the global level. http://www.fao.org/in-
action/voices-of-the-hungry/background/en/
31. M. Nord. Introduction to Item Response Theory applied to Food Security Measurement:
Basic Concepts, Parameters, and Statistics. Technical Paper, FAO, Rome.
http://www.fao.org/3/a-i3946e.pdf.

22
32. B.D. Wright. Solving measurement problems with the Rasch Model. (Mesa Psychometric
Laboratory, College of Education, University of Chicago, 1977).
33. Food and Agriculture Organization of the United Nations. FIES Basics – The Food Insecurity
Experience Scale: Measuring food insecurity through people’s experiences.
http://www.fao.org/3/a-i7835e.pdf
34. Food and Agriculture Organization of the United Nations. Using the FIES App: A simple
tool for the analysis of Food Insecurity Experience Scale data.
http://www.fao.org/3/ca9318en/ca9318en.pdf.
35. J-C. Deville and Y. Tillé. Efficient balanced sampling: The cube method. Biometrika 91: (4),
893-912 (2004).
36. J.D. Angrist and J-S Pischke. Mostly Harmless Econometrics. (Princeton University Press,
Princeton, 2009).

23
Supplementary Evidence
Supplementary figures: Figure S1 provides graphical evidence of heterogeneous effects based
on the gender of the household head. Panel A shows differences in loss of income. Panel B shows
differences in the prevalence of food insecurity. Panel C shows differences in concern about
COVID-19 related health and financial hardships. Panel D shows differences in coping strategies.
Figures S2 and S3 primarily provide evidence of “null” results referenced in the paper. Figure S2
present results regarding expected heterogeneity in food insecurity by consumption quintile,
though as the figures demonstrate, there is in fact no heterogeneity in these measures. Figure S3
presents results regarding expected heterogeneity in food insecurity by child engagement in
learning activities. The lack of heterogeneity in food insecurity along both of these variables is
interesting, though we caution overinterpreting the “null” that no heterogeneity exists.
Supplementary tables: Tables S1 – S31 present either (1) biased corrected estimates of
population means and population totals or (2) reduced form regressions of heterogenous effects.
Tables S4, S7 - S9, S14, S17, S21 – S22, S26, and S28 are type (1). These tables present estimates
of the mean number of households, individuals, adults, or school-aged children using corrected for
selection bias using survey weights as described above. We use the sample means and total to
make inference about the means and totals in the national-level population of interest (households,
individuals, adults, or school-aged children). Standard errors for these estimates are presented in
parentheses.
Tables S1 - S3, S5 - S6, S10 - S13, S15 - S16, S18 - S20, S23 – S25, S27, S29, and S30 – S31 are
type (2). These tables present results from reduced form regressions to test for heterogenous effects
across 1) countries, 2) rural and urban sectors, 3) pre-COVID-19 wealth, 4) gender, and 5) time.
Every regression uses weights to correct for selection bias. Huber-White robust standard errors are
reported in parentheses for all of these tables. With the exception of Table S13, all estimates use
the least squares estimator derived above. Table S13 reports results from an ordered logit
regression. Tables testing heterogeneity across country use Malawi as the base case. To test
differences between the other countries (not Malawi) we conduct Wald tests for equality in the
estimated coefficients for each country pair.
Data and Code Availability
The data used in this study can be freely downloaded from the World Bank Microdata Library.
The code used to generate these analyses is available at Zenodo29. The code is licensed under the
MIT license.

24
Model Code
The code used to generate these analyses is available at: http://doi.org/10.5281/zenodo.4060416
Data
All data used in this study can be downloaded from the cited sources. Each specific country dataset
can be found at the following:
Data S1. World Bank, Ethiopia - High-Frequency Phone Survey on COVID-19 2020. (World
Bank, Washington, D.C., 2020); https://microdata.worldbank.org/index.php/catalog/3716.
Data S2. World Bank, Malawi - High-Frequency Phone Survey on COVID-19 2020. (World Bank,
Washington, D.C., 2020); https://microdata.worldbank.org/index.php/catalog/3766.
Data S3. World Bank, Nigeria - High-Frequency Phone Survey on COVID-19 2020. (World Bank,
Washington, D.C., 2020); https://microdata.worldbank.org/index.php/catalog/3712.
Data S4. World Bank, Uganda - High-Frequency Phone Survey on COVID-19 2020. (World
Bank, Washington, D.C., 2020); https://microdata.worldbank.org/index.php/catalog/3765.

Figure S1: Heterogeneity in outcomes by gender
(A) Percentage of households reporting loss of income sources, by country and gender of the head of household. (B)Prevalence of moderate and/or severe food insecurity among adult individuals, by country and gender of the headof household. (C) Percentage of households concerned about COVID-19-related issues linked to health and finance,by country and gender of the head of household. (D) Percentage of households reporting use of coping strategy, bycountry and gender of the head of household.
0
20
40
60
80
100
Hou
seho
lds
repo
rtin
g de
crea
se in
inco
me
(%)
Ethiopia Malawi Nigeria UgandaMale Female Male Female Male Female Male Female
A
Farm income Business income Wage incomeRemittances All else
0
20
40
60
80
100
Pre
vale
nce
of m
oder
ate
or s
ever
e fo
od in
secu
rity
Ethiopia Malawi Nigeria UgandaMale Female Male Female Male Female Male Female
B
Moderate or severe food insecurity Severe food insecurity
0 20 40 60 80 100Percent of households reporting concern
Uganda
Nigeria
Malawi
Ethiopia
Female
Male
Female
Male
Female
Male
Female
Male
Concerns about COVID−19
C
Concerned that family or self will fall ill with COVID−19Concerned about the financial threat of COVID−19
0
20
40
60
80
100
Hou
seho
lds
repo
rtin
g us
e of
cop
ing
stra
tegy
(%
)
Ethiopia Malawi Nigeria UgandaMale Female Male Female Male Female Male Female
D
Relied on savings Sale of asset Reduced food cons.Reduced non−food cons. Help from family Received assistance

Figure S2: Prevalence of moderate and/or severe food insecurity food insecurity among adults, byhealth/financial concerns and consumption quintiles
(A) Prevalence of moderate or severe food insecurity in adults is calculated using the FIES and is presented by (i)whether respondent reports being concerned that a family member or the respondent will fall ill with COVID-19 (leftpanel) or that the household will suffer financially from the pandemic (right panel), and (ii) household annual percapita consumption quintile using pre-COVID-19 data. (B) Prevalence of severe food insecurity in adults is calculatedusing the FIES and is presented (i) by whether respondent reports being concerned that a family member or therespondent will fall ill with COVID-19 (left panel) or that the household will suffer financially from the pandemic(right panel), and (ii) by household annual per capita consumption quintile using pre-COVID-19 data.
0
20
40
60
80
100
Pre
vale
nce
of m
oder
ate
or s
ever
e fo
od in
secu
rity
Ethiopia Malawi UgandaNo Yes No Yes No Yes
Concerned that family/self will fall ill with COVID−19
0
20
40
60
80
100
Pre
vale
nce
of m
oder
ate
or s
ever
e fo
od in
secu
rity
Ethiopia Malawi UgandaNo Yes No Yes No Yes
Concerned about the financial threat of COVID−19
A
First Quintile Second Quintile Third QuintileFourth Quintile Fifth Quintile
0
20
40
60
80
100
Pre
vale
nce
of s
ever
e fo
od in
secu
rity
Ethiopia Malawi UgandaNo Yes No Yes No Yes
Concerned that family/self will fall ill with COVID−19
0
20
40
60
80
100
Pre
vale
nce
of s
ever
e fo
od in
secu
rity
Ethiopia Malawi UgandaNo Yes No Yes No Yes
Concerned about the financial threat of COVID−19
B
First Quintile Second Quintile Third QuintileFourth Quintile Fifth Quintile

Figure S3: Prevalence of moderate and/or severe food insecurity among adults, by whether house-hold children are engaged in learning activities
Prevalence of food insecurity among adults is calculated using the FIES and is presented by whether the householdhas school-age children that are engaged in any learning activities following the school closures.
0
20
40
60
80
100
Pre
vale
nce
of fo
od in
secu
rity
Ethiopia Malawi Nigeria UgandaNo Yes No Yes No Yes No Yes
Children engaged in learning activities (yes/no)
Moderate or severe Severe

28
Table S1. Knowledge of government actions undertaken to curb the spread of COVID-19
Stay at
home
Restricted
travel
Close
schools Lockdown
Close
businesses
Limit social
gatherings
Ethiopia 0.203*** 0.167*** 0.031 0.139*** 0.059*** 0.225***
(0.024) (0.016) (0.024) (0.013) (0.009) (0.025)
Nigeria 0.506*** 0.319*** 0.128*** 0.446*** 0.332*** 0.080***
(0.024) (0.020) (0.026) (0.019) (0.020) (0.027)
Uganda 0.025 0.656*** 0.242*** 0.705*** 0.329*** 0.214***
(0.022) (0.017) (0.024) (0.015) (0.017) (0.025)
Ethiopia-Nigeria 0.000 0.000 0.000 0.000 0.000 0.000
Ethiopia-Uganda 0.000 0.000 0.000 0.000 0.000 0.591
Nigeria-Uganda 0.000 0.000 0.000 0.000 0.898 0.000
Observations 9,113 9,113 9,113 9,113 9,113 9,113
R-squared 0.157 0.123 0.021 0.178 0.096 0.029
Note: Each column reports results from a single regression of a binary variable equal to 1 if the respondent was familiar
with the government action and 0 otherwise. The binary variable is then regressed on indicators for each country, with
Malawi as the base case. The second panel reports p-values for Wald tests of the simple linear hypothesis that the
coefficient on one country indicator equals the coefficient on an indicator for a different country. Data are only from
the first phone survey round in each country. Robust standard errors are reported in parentheses (*** p<0.01, **
p<0.05, * p<0.10).

29
Table S2. Knowledge of actions that can reduce exposure to COVID-19
Soap reduces
risk
Avoid
physical
greetings
Use masks or
gloves Stay at home
Avoid
crowds
Maintain
distance of
one meter
Ethiopia 0.006 0.459*** 0.299*** 0.540*** 0.295*** 0.193***
(0.005) (0.022) (0.027) (0.022) (0.024) (0.021)
Nigeria -0.013* 0.298*** 0.372*** 0.544*** 0.314*** 0.058**
(0.007) (0.026) (0.026) (0.023) (0.024) (0.025)
Uganda 0.010** 0.462*** 0.585*** 0.617*** 0.381*** 0.161***
(0.004) (0.021) (0.021) (0.020) (0.022) (0.021)
Ethiopia-Nigeria 0.007 0.000 0.003 0.838 0.218 0.000
Ethiopia-Uganda 0.340 0.585 0.000 0.000 0.000 0.006
Nigeria-Uganda 0.000 0.000 0.000 0.000 0.000 0.000
Observations 9,127 9,127 9,128 9,127 9,127 9,128
R-squared 0.006 0.122 0.078 0.160 0.067 0.038
Note: Each column reports results from a single regression of a binary variable equal to 1 if the respondent was familiar with
the action and 0 otherwise. The binary variable is then regressed on indicators for each country, with Malawi as the base case.
The second panel reports p-values for Wald tests of the simple linear hypothesis that the coefficient on one country indicator
equals the coefficient on an indicator for a different country. Data are only from the first phone survey round in each country.
Robust standard errors are reported in parentheses (*** p<0.01, ** p<0.05, * p<0.10).

30
Table S3. Change in behavior since COVID-19 outbreak
Handwashed
with soap more
often
Avoided
physical
greetings Avoided crowds
Ethiopia 0.079*** 0.238*** 0.231***
(0.014) (0.019) (0.024)
Nigeria 0.050*** 0.196*** 0.329***
(0.016) (0.022) (0.023)
Uganda 0.061*** 0.232*** 0.301***
(0.014) (0.019) (0.023)
Ethiopia-Nigeria 0.001 0.001 0.000
Ethiopia-Uganda 0.005 0.485 0.000
Nigeria-Uganda 0.235 0.004 0.037
Observations 9,138 9,138 9,131
R-squared 0.011 0.045 0.064
Note: Each column reports results from a single regression of a binary variable equal
to 1if the respondent changed their behavior and 0 otherwise. The binary variable is
then regressed on indicators for each country, with Malawi as the base case. The
second panel reports p-values for Wald tests of the simple linear hypothesis that the
coefficient on one country indicator equals the coefficient on an indicator for a
different country. Data are only from the first phone survey round in each country.
Robust standard errors are reported in parentheses (*** p<0.01, ** p<0.05, *
p<0.10).

31
Table S4. Average incidence of engaging in safe practices, by survey round
Malawi Uganda
Hand
washed
Avoided
physical
greetings
Avoided
crowds
Hand
washed
Avoided
physical
greetings
Avoided
crowds
Round 1 0.908 0.730 0.609 0.969 0.962 0.909
(0.013) (0.019) (0.020) (0.005) (0.006) (0.010)
Round 2 0.817 0.740 0.346 0.805 0.855 0.768
(0.017) (0.019) (0.021) (0.013) (0.011) (0.013)
Observations 3375 3375 3375 4376 4376 4376
Note: Each column reports the estimated population-weighted mean number of people living in households that
report changing their behavior. Standard errors are in parenthesis.

32
Table S5. Behavioral change over time in Malawi and Uganda
Malawi Uganda
Hand
washed
Avoided physical
greetings
Avoided
crowds
Hand
washed
Avoided physical
greetings
Avoided
crowds
Round 2 -0.090*** 0.010 -0.263*** -0.164*** -0.107*** -0.141***
(0.022) (0.027) (0.029) (0.014) (0.013) (0.017)
Observations 3,375 3,375 3,375 4,376 4,376 4,376
R-squared 0.017 0.000 0.069 0.068 0.035 0.037
Note: Each column reports results from a single regression of a binary variable equal to 1 if the respondent changed their
behavior and 0 otherwise. The binary variable is then regressed on an indicator for phone survey round number, with the
first round as the base case. Regressions are run for each country (Malawi and Uganda) separately. Robust standard errors
are reported in parentheses (*** p<0.01, ** p<0.05, * p<0.10).

33
Table S6. Prevalence of false beliefs about COVID-19 in Uganda versus Malawi
Africans immune
Not affect
children
Survive warm
weather Common flu
Uganda -0.057*** -0.056*** 0.007 -0.293***
(0.022) (0.017) (0.027) (0.024)
Observations 3,662 3,651 3,152 3,621
R-squared 0.005 0.008 0.000 0.150
Note: Each column reports results from a single regression of a binary variable equal to 1 if the
respondent stated that they thought a false belief was in fact true and 0 if they knew it was false. The
binary variable is then regressed on an indicator for Uganda, with Malawi as the base case. The questions
about false beliefs were only asked in the first phone survey round in Uganda and only asked in the
second round in Malawi. Robust standard errors are reported in parentheses (*** p<0.01, ** p<0.05, *
p<0.10).

34
Table S7. Estimated population counts in accordance with response
to false beliefs about COVID-19
Panel A: Malawi
Response
Africans
immune
Not affect
children
Survive
warm
weather Common flu
Yes 2,372,739 1,333,154 2,550,250 3,140,407
(264,328) (211,726) (267,776) (296,737)
No 5,711,152 5,620,943 4,798,198 4,550,404
(281,989) (244,100) (279,246) (293,239)
Don't Know 871,254 738,656 1,291,835 1,007,683
(173,078) (163,452) (179,043) (184,135)
Observations 731 679 764 723
Panel B: Uganda
Response
Africans
immune
Not affect
children
Survive
warm
weather Common flu
Yes 3,271,887 1,661,419 6,115,156 1,307,071
(346,188) (242,429) (451,666) (237,573)
No 14,205,739 14,780,783 11,799,655 15,115,205
(383,993) (278,064) (493,215) (311,635)
Don't Know 1,109,367 831,381 3,629,792 1,137,212
(205,851) (147,278) (357,983) (220,189)
Observations 947 880 1,080 881
Note: Each column reports the estimated total number of people living in households
that respond “yes,” “no,” or “don’t know” to whether a series of statements were true.
The questions about false beliefs were only asked in the first phone survey round in
Uganda and only asked in the second round in Malawi. Standard errors are in
parentheses.

35
Table S8. Estimated total number of households that report income loss due to COVID-19
pandemic and average household-level incidence of income loss, by source
Any type of
income loss
Farm
income
reduced
Business
income
reduced
Wage
income
reduced
Remittances
reduced
Other income
sources
reduced
Total 748,720,384 223,353,008 174,818,736 67,815,688 44,469,788 38,765,196
(4,869,609) (4,087,100) (2,156,618) (2,204,293) (1,403,495) (1,964,309)
Mean 0.773 0.637 0.856 0.527 0.707 0.522
(0.009) (0.012) (0.011) (0.020) (0.026) (0.027)
Observations 9,153 5,624 3,849 3,447 1,687 1,574
Note: Each column reports the estimated total number of households that report loss of income and the average
household-level incidence of reporting a loss of income. The estimates are based on the pooled data from 4 countries.
Reporting loss of income from a given source is conditional on receiving income from that source prior to the COVID-
19 pandemic. Data are only from the first phone survey round in each country. Standard errors on the estimates are in
parenthesis.

36
Table S9. Estimated total number of households that report pre-COVID-19 income and average household-level
incidence of income receipt, by source
Panel A: All Countries
Farm income Business income Wage income Remittances Other income sources
Total 62,095,944 35,097,532 25,267,792 103,765,224 18,852,056
(607,921) (656,727) (575,150) (946,421) (619,989)
Mean 0.730 0.447 0.284 0.652 0.253
(0.008) (0.010) (0.008) (0.009) (0.009)
Observations 9,155 9,155 9,155 9,155 9,155
Panel B: Ethiopia
Farm income Business income Wage income Remittances Other income sources
Total 12,545,457 4,207,898 4,740,819 0 3,865,377
(283,973) (249,049) (243,303) (0) (254,336)
Mean 0.634 0.213 0.240 0.000 0.195
(0.014) (0.013) (0.012) (0.000) (0.013)
Observations 3,249 3,249 3,249 3,249 3,249
Panel C: Malawi
Farm income Business income Wage income Remittances Other income sources
Total 3,243,256 1,584,694 1,210,010 3,600,947 1,054,078
(32,910) (68,720) (64,491) (8,046) (63,054)
Mean 0.893 0.436 0.333 0.991 0.290
(0.009) (0.019) (0.018) (0.002) (0.017)
Observations 1,729 1,729 1,729 1,729 1,729
Panel D: Nigeria
Farm income Business income Wage income Remittances Other income sources
Total 21,167,000 16,985,522 8,020,662 26,334,226 9,433,393
(380,014) (444,969) (403,349) (127,001) (427,423)
Mean 0.785 0.630 0.298 0.977 0.350
(0.014) (0.017) (0.015) (0.005) (0.016)
Observations 1,950 1,950 1,950 1,950 1,950
Panel E: Uganda
Farm income Business income Wage income Remittances Other income sources
Total 6,025,480 3,533,057 2,773,255 8,462,181 547,760
(124,336) (128,328) (125,664) (10,362) (64,285)
Mean 0.709 0.416 0.326 0.995 0.064
(0.015) (0.015) (0.015) (0.001) (0.008)
Observations 2,227 2,227 2,227 2,227 2,227
Note: Each column reports the estimated total number of households that reported pre-COVID-19 income from each source and the average
household-level incidence of pre-COVID-19 income receipt from each source. Data are only from the first phone survey round in each
country. Standard errors on the estimates are in parenthesis.

37
Table S10. Income loss due to the COVID-19 pandemic, by source
Farm income
reduced
Business
income reduced
Wage income
reduced
Remittances
reduced
Other income
sources
reduced
Ethiopia -0.314*** 0.016 -0.240*** -0.260*** -0.299***
(0.028) (0.033) (0.041) (0.053) (0.054)
Nigeria -0.001 0.011 -0.005 -0.086* -0.029
(0.024) (0.025) (0.042) (0.044) (0.055)
Uganda -0.133*** 0.075*** 0.074* 0.028 0.116
(0.025) (0.025) (0.041) (0.040) (0.072)
Ethiopia-Nigeria 0.000 0.853 0.000 0.001 0.000
Ethiopia-Uganda 0.000 0.048 0.000 0.000 0.000
Nigeria-Uganda 0.000 0.002 0.044 0.007 0.034
Observations 5,624 3,849 3,447 1,687 1,574
R-Squared 0.080 0.004 0.056 0.037 0.075
Note: Each column reports results from a single regression of a binary variable equal to 1 if the household lost income
from that source and 0 otherwise. Reporting loss of income from a given source is conditional on receiving income from
that source prior to the COVID-19 pandemic. The binary variable is then regressed on indicators for each country, with
Malawi as the base case. The second panel reports p-values for Wald tests of the simple linear hypothesis that the
coefficient on one country indicator equals the coefficient on an indicator for a different country. Data are only from the
first phone survey round in each country. Robust standard errors are reported in parentheses (*** p<0.01, ** p<0.05, *
p<0.10).

38
Table S11. Income loss due to the COVID-19 pandemic, by income source and
urban/rural residence
Farm income
reduced
Business
income
reduced
Wage
income
reduced
Remittances
reduced
Other income
sources
reduced
Urban -0.019 0.024 -0.016 -0.016 -0.137***
(0.025) (0.022) (0.035) (0.045) (0.046)
Ethiopia 0.001 0.009 -0.004 -0.083* -0.017
(0.024) (0.025) (0.042) (0.045) (0.054)
Nigeria -0.132*** 0.072*** 0.076* 0.029 0.157**
(0.025) (0.025) (0.041) (0.040) (0.074)
Uganda -0.314*** 0.011 -0.234*** -0.256*** -0.281***
(0.028) (0.034) (0.045) (0.056) (0.055)
Observations 5,624 3,849 3,447 1,687 1,574
R-Squared 0.081 0.005 0.056 0.038 0.091
Note: Each column reports results from a single regression of a binary variable equal to 1 if the
household lost income from that source and 0 otherwise. Reporting loss of income from a given source
is conditional on receiving income from that source prior to the COVID-19 pandemic. The binary
variable is then regressed on indicators for each country, with Malawi as the base case, along with an
indicator equal to 1 if the household was located in an urban area, as opposed to a rural area. Data are
only from the first phone survey round in each country. Robust standard errors are reported in
parentheses (*** p<0.01, ** p<0.05, * p<0.10).

39
Table S12. Income loss due to the COVID-19 pandemic, by income source and
gender of household head
Farm income
reduced
Business
income
reduced
Wage
income
reduced
Remittances
reduced
Other income
sources
reduced
Female Head -0.021 -0.008 -0.003 0.082* -0.100*
(0.025) (0.030) (0.037) (0.044) (0.057)
Ethiopia -0.004 0.012 -0.009 -0.079* -0.046
(0.024) (0.026) (0.042) (0.044) (0.056)
Nigeria -0.136*** 0.076*** 0.068 0.011 0.128*
(0.025) (0.026) (0.041) (0.042) (0.073)
Uganda -0.318*** 0.018 -0.245*** -0.258*** -0.290***
(0.028) (0.033) (0.041) (0.054) (0.054)
Observations 5,556 3,816 3,420 1,666 1,567
R-Squared 0.082 0.004 0.056 0.044 0.080
Note: Each column reports results from a single regression of a binary variable equal to 1 if the household
lost income from that source and 0 otherwise. Reporting loss of income from a given source is conditional
on receiving income from that source prior to the COVID-19 pandemic. The binary variable is then
regressed on indicators for each country, with Malawi as the base case, along with an indicator equal to
1 if the household head is female, as opposed to male. Data are only from the first phone survey round in
each country. Robust standard errors are reported in parentheses (*** p<0.01, ** p<0.05, * p<0.10).

40
Table S13. Change in business revenue
loss over time
Business Revenue
Loss
Round 2 -1.010***
(0.112)
Round 3 -1.026***
(0.134)
Ethiopia 0.032
(0.115)
Nigeria -0.145
(0.108)
Uganda -0.569***
(0.090)
Ethiopia-Nigeria 0.084
Ethiopia-Uganda 0.000
Nigeria-Uganda 0.000
Round 2-Round 3 0.907
Observations 7,242
Pseudo R-Squared 0.030
Note: The table reports the result from a single
ordered logit regression in which the dependent
variable equals 1 if revenue is higher than the
previous period, equal to 2 if revenue is the same
as in the previous period, equal to 3 if revenue is
less than the previous period, and 4 if they
received no revenue. The ordinal variable is then
regressed on indicators for each country, with
Malawi as the base case, and indicators for each
phone survey round, with round 1 as the base case.
The second panel reports p-values for Wald tests
of the simple linear hypothesis that the coefficient
on one country or wave indicator equals the
coefficient on an indicator for a different country
or round. Robust standard errors are reported in
parentheses (*** p<0.01, ** p<0.05, * p<0.10).

41
Table S14. Estimated total number of adults that are (i) moderately or
severely food insecure and (ii) severely food insecure and average
incidence of (i) moderate or severe food insecurity and (ii) severe food
insecurity among the adult population
Panel A: Total
All Countries Ethiopia Malawi Nigeria Uganda
Moderate or 100,014,992 24,130,336 6,232,031 62,767,288 6,885,341
Severe 1,577,726 846,790 150,580 1,191,869 285,413
Severe 38,032,228 6,787,466 2,167,532 27,992,446 1,084,782
1,376,278 600,851 123,643 1,144,950 110,423
Observations 8,713 3,051 1,646 1,820 2,196
Panel B: Mean
All Countries Ethiopia Malawi Nigeria Uganda
Moderate or 0.609 0.469 0.676 0.757 0.330
Severe (0.010) (0.016) (0.016) (0.014) (0.014)
Severe 0.231 0.132 0.235 0.338 0.052
(0.008) (0.012) (0.013) (0.014) (0.005)
Observations 8,713 3,051 1,646 1,820 2,196
Note: Each column in Panel A reports the estimated total number of adults who are
moderately or severely food insecure, or just severely food insecure. Each column in Panel
B reports the average incidence of (i) moderate or severe food insecurity and (ii) severe
food insecurity among the adult population. In both panels, food insecurity is measured
using the FIES. Data come from the most recent round of phone survey data available. This
is round 3 in Ethiopia, round 2 in Malawi, Nigeria, and Uganda. Standard errors on the
estimates are in parenthesis.

42
Table S15. Prevalence of food insecurity
Moderate or
Severe Food
Insecurity
Severe Food
Insecurity
Ethiopia -0.207*** -0.103***
(0.023) (0.018)
Nigeria 0.081*** 0.102***
(0.022) (0.019)
Uganda -0.346*** -0.183***
(0.021) (0.014)
Ethiopia-Nigeria 0.000 0.000
Ethiopia-Uganda 0.000 0.000
Nigeria-Uganda 0.000 0.000
Observations 8,713 8,713
R-squared 0.147 0.119
Note: Each column reports results from a single regression of the
prevalence of either moderate or severe food insecurity or just
severe food insecurity. Food insecurity is measured using the
FIES. The FIES variable is regressed on indicators for each
country, with Malawi as the base case. The second panel reports
p-values for Wald tests of the simple linear hypothesis that the
coefficient on one country indicator equals the coefficient on an
indicator for a different country. Data come from the most recent
round of phone survey data available. This is round 3 in
Ethiopia, round 2 in Malawi, Nigeria, and Uganda. Robust
standard errors are reported in parentheses (*** p<0.01, **
p<0.05, * p<0.10).

43
Table S16. Prevalence of food insecurity by
gender of household head
Moderate or
Severe Food
Insecurity
Severe Food
Insecurity
Female Head 0.111*** 0.039***
(0.023) (0.015)
Round 2 -0.075*** -0.042***
(0.017) (0.011)
Round 3 -0.087*** -0.070***
(0.029) (0.019)
Female × Round 2 -0.027 -0.028
(0.029) (0.023)
Female × Round 3 -0.040 0.011
(0.045) (0.036)
Ethiopia -0.172*** -0.098***
(0.021) (0.016)
Nigeria 0.108*** 0.089***
(0.020) (0.017)
Uganda -0.323*** -0.205***
(0.015) (0.011)
Observations 15,687 15,687
R-squared 0.130 0.114
Note: Each column reports results from a single regression of the
prevalence of either moderate or severe food insecurity or just
severe food insecurity. Food insecurity is measured using the
FIES. The FIES variable is regressed on indicators for each
country, with Malawi as the base case, and round, along with an
indicator equal to 1 if the household head is female, as opposed
to male. Data come from all rounds of phone survey data in
which FIES questions exist. Robust standard errors are reported
in parentheses (*** p<0.01, ** p<0.05, * p<0.10).

44
Table S17. Estimated population concerned about health and finances
Panel A: Concerned about household health
All Countries Ethiopia Malawi Nigeria Uganda
Total 257,414,816 71,449,632 17,517,492 137,937,232 30,510,464
(3,083,491) (1,858,111) (189,537) (2,295,302) (623,196)
Mean 0.779 0.707 0.933 0.821 0.716
(0.009) (0.018) (0.010) (0.014) (0.015)
Observations 8,849 3,058 1,646 1,948 2,197
Panel B: Concerned about household finances
All Countries Ethiopia Malawi Nigeria Uganda
Total 292,328,256 81,848,456 17,919,304 157,232,592 35,327,904
(2,431,731) (1,526,779) (164,040) (1,785,593) (510,836)
Mean 0.884 0.810 0.954 0.935 0.829
(0.007) (0.015) (0.009) (0.011) (0.012)
Observations 8,850 3,058 1,646 1,949 2,197
Note: Each column reports the estimated total number of households using a coping strategy in response to
COVID-19-relaated income loss and average household-level incidence of using a coping strategy. Adoption of a
strategy is condition on experiencing a COVID-19 related loss of income per Table S8. Data come from the most
round of phone survey data available. This is round 3 in Ethiopia and Nigeria, round 2 in Malawi, and round 1 in
Uganda.

45
Table S18. Prevalence of food insecurity as it
relates to health and financial concerns
Moderate or
Severe Food
Insecurity
Severe Food
Insecurity
Concerned about 0.042 0.010
household health (0.030) (0.021)
Concerned about 0.206*** 0.062***
household finances (0.031) (0.019)
Ethiopia -0.170*** -0.093***
(0.023) (0.018)
Uganda -0.311*** -0.173***
(0.022) (0.015)
Ethiopia-Uganda 0.000 0.000
Observations 6,893 6,893
R-squared 0.089 0.051
Note: Each column reports results from a single regression of the
prevalence of either moderate or severe food insecurity or just
severe food insecurity. Food insecurity is measured using FIES.
The FIES variable is regressed on indicators whether or not the
respondent is concerned about the health impacts of COVID-19
and the financial impacts of COVID-19. Also included are
indicators for each country, with Malawi as the base case. The
second panel reports p-values for Wald tests of the simple linear
hypothesis that the coefficient on one country indicator equals the
coefficient on an indicator for a different country. Data come from
the most recent round of phone survey data available. This is round
3 in Ethiopia, round 2 in Malawi and in Uganda. Nigeria is not
included because questions about concerns were not asked in the
same rounds as questions about food insecurity. Robust standard
errors are reported in parentheses (*** p<0.01, ** p<0.05, *
p<0.10).

46
Table S19. Concerns about health and finance by gender
of household head
Concerned about
household health
Concerned about
household finances
Female Head -0.059*** -0.003
(0.022) (0.016)
Ethiopia -0.228*** -0.144***
(0.021) (0.017)
Nigeria -0.119*** -0.020
(0.017) (0.014)
Uganda -0.213*** -0.124***
(0.018) (0.015)
Observations 8,814 8,815
R-squared 0.028 0.035
Note: Each column reports results from a single regression of a binary
variable equal to 1 if the respondent answered “yes” to the question of
whether they were concerned that a household member may fall ill with
COVID-19 or that the household would experience financial distress due
to COVID-19. The binary variable is regressed on indicators for each
country, with Malawi as the base case, along with an indicator equal to 1
if the household head is female, as opposed to male. Data come from the
most recent round of phone survey data available. This is round 3 in
Ethiopia, round 2 in Malawi and Uganda, and round 1 in Nigeria. Robust
standard errors are reported in parentheses (*** p<0.01, ** p<0.05, *
p<0.10).

47
Table S20. Concerns about health and finance across
consumption quintile
Concerned about
household health
Concerned about
household finances
Ethiopia -0.219*** -0.150***
(0.019) (0.016)
Nigeria -0.141*** -0.032***
(0.017) (0.012)
Uganda -0.217*** -0.133***
(0.017) (0.014)
Quintile 2 -0.004 -0.019
(0.031) (0.027)
Quintile 3 -0.064* -0.012
(0.032) (0.026)
Quintile 4 -0.059** 0.004
(0.030) (0.025)
Quintile 5 -0.094*** -0.006
(0.028) (0.023)
Ethiopia-Nigeria 0.000 0.000
Ethiopia-Uganda 0.929 0.351
Nigeria-Uganda 0.000 0.000
Observations 8,846 8,847
R-squared 0.024 0.032
Note: Each column reports results from a single regression of a binary
variable equal to 1 if the respondent answered “yes” to the question of
whether they were concerned that a household member may fall ill
with COVID-19 or that the household would experience financial
distress due to COVID-19. The binary variable is regressed on
indicators for each country, with Malawi as the base case, and each
pre-COVID-19 household annual per capita consumption quintile,
with the lowest consumption quintile as the base case. The second
panel reports p-values for Wald tests of the simple linear hypothesis
that the coefficient on one country indicator equals the coefficient on
an indicator for a different country or that the coefficient on one
quintile indicator equals the coefficient on an indicator for a different
quintile. Data come from the most recent round of phone survey data
available. This is round 3 in Ethiopia, round 2 in Malawi and Uganda,
and round 1 in Nigeria. Robust standard errors are reported in
parentheses (*** p<0.01, ** p<0.05, * p<0.10).

48
Table S21. Estimated total number of households that report suffering a
COVID-19-related shock and average household incidence of suffering a
COVID-19-related shock
All Countries Ethiopia Malawi Nigeria Uganda
Total 24,885,908 5,177,274 1,167,996 15,045,319 3,495,319
(594,983) (276,409) (66,812) (466,172) (128,117)
Mean 0.423 0.261 0.325 0.558 0.411
(0.010) (0.014) (0.019) (0.017) (0.015)
Observations 8,721 3,058 1,646 1,790 2,227
Note: Each column reports the estimated total number of households that reported suffering a COVID-
19-related shock and average household-level incidence of suffering a COVID-19-related shock. Data
comes from the most recent wave (round) of data available. This is round 3 in Ethiopia and Nigeria,
round 2 in Malawi, and round 1 in Uganda. Standard errors on the estimates are in parenthesis.

49
Table S22. Estimated total number of households using a coping strategy in response to COVID-19-
related income loss and average household-level incidence of using a coping strategy
Any
Coping
Strategy
Relied on
Saving
Sale of
Assets
Reduced
Food
Consumption
Reduced
Non-Food
Consumption
Received
Assistance
from
Friends and
Family
Received
Any
Assistance
Total 33,171,234 12,219,426 3,462,072 21,370,172 6,491,568 8,084,976 4,270,560
(578,286) (473,945) (284,763) (518,857) (354,462) (422,270) (313,064)
Mean 0.564 0.294 0.083 0.514 0.156 0.194 0.073
(0.010) (0.011) (0.007) (0.012) (0.009) (0.010) (0.005)
Observations 8,721 5,595 5,595 5,595 5,595 5,595 8,719
Note: Each column reports the estimated total number of households using a coping strategy in response to COVID-19-relaated
income loss and average household-level incidence of using a coping strategy. Adoption of a strategy is condition on experiencing
a COVID-19 related loss of income per Table S8. Data come from the most round of phone survey data available. This is round
3 in Ethiopia and Nigeria, round 2 in Malawi, and round 1 in Uganda. Standard errors on the estimates are in parenthesis.
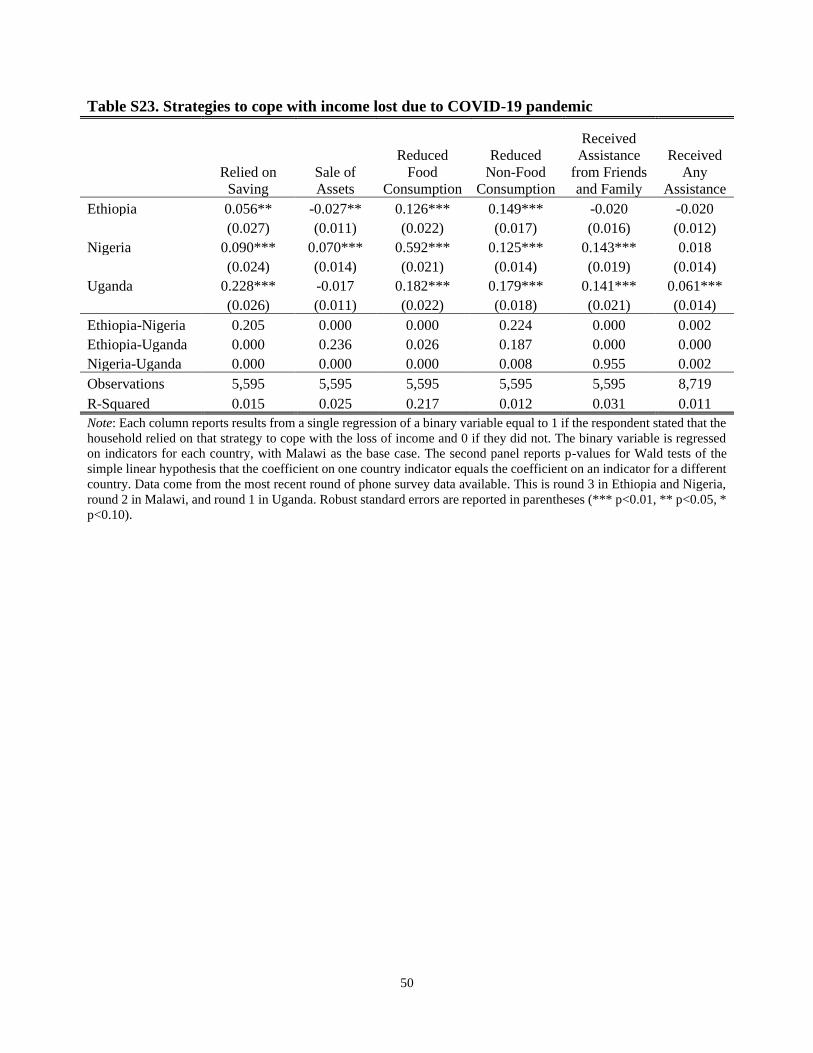
50
Table S23. Strategies to cope with income lost due to COVID-19 pandemic
Relied on
Saving
Sale of
Assets
Reduced
Food
Consumption
Reduced
Non-Food
Consumption
Received
Assistance
from Friends
and Family
Received
Any
Assistance
Ethiopia 0.056** -0.027** 0.126*** 0.149*** -0.020 -0.020
(0.027) (0.011) (0.022) (0.017) (0.016) (0.012)
Nigeria 0.090*** 0.070*** 0.592*** 0.125*** 0.143*** 0.018
(0.024) (0.014) (0.021) (0.014) (0.019) (0.014)
Uganda 0.228*** -0.017 0.182*** 0.179*** 0.141*** 0.061***
(0.026) (0.011) (0.022) (0.018) (0.021) (0.014)
Ethiopia-Nigeria 0.205 0.000 0.000 0.224 0.000 0.002
Ethiopia-Uganda 0.000 0.236 0.026 0.187 0.000 0.000
Nigeria-Uganda 0.000 0.000 0.000 0.008 0.955 0.002
Observations 5,595 5,595 5,595 5,595 5,595 8,719
R-Squared 0.015 0.025 0.217 0.012 0.031 0.011
Note: Each column reports results from a single regression of a binary variable equal to 1 if the respondent stated that the
household relied on that strategy to cope with the loss of income and 0 if they did not. The binary variable is regressed
on indicators for each country, with Malawi as the base case. The second panel reports p-values for Wald tests of the
simple linear hypothesis that the coefficient on one country indicator equals the coefficient on an indicator for a different
country. Data come from the most recent round of phone survey data available. This is round 3 in Ethiopia and Nigeria,
round 2 in Malawi, and round 1 in Uganda. Robust standard errors are reported in parentheses (*** p<0.01, ** p<0.05, *
p<0.10).

51
Table S24. Strategies to cope with income lost due to pandemic across rural/urban sector
Relied on
Saving
Sale of
Assets
Reduced
Food
Consumption
Reduced
Non-Food
Consumption
Received
Assistance
from Friends
and Family
Received
Any
Assistance
Urban 0.016 -0.061*** 0.088*** 0.017 0.046** 0.014
(0.023) (0.012) (0.021) (0.019) (0.022) (0.011)
Ethiopia 0.053* -0.014 0.108*** 0.146*** -0.030* -0.022*
(0.028) (0.011) (0.022) (0.018) (0.017) (0.013)
Nigeria 0.088*** 0.077*** 0.581*** 0.123*** 0.137*** 0.016
(0.024) (0.015) (0.022) (0.014) (0.019) (0.014)
Uganda 0.226*** -0.009 0.171*** 0.177*** 0.135*** 0.059***
(0.026) (0.011) (0.023) (0.018) (0.021) (0.014)
Observations 5,595 5,595 5,595 5,595 5,595 8,719
R-Squared 0.015 0.035 0.223 0.012 0.033 0.011
Note: Each column reports results from a single regression of a binary variable equal to 1 if the respondent stated
that the household relied on that strategy to cope with the loss of income and 0 if they did not. The binary variable
is regressed on indicators for each country, with Malawi as the base case, along with an indicator equal to 1 if the
household was located in an urban area, as opposed to a rural area. Data come from the most recent round of phone
survey data available. This is round 3 in Ethiopia and Nigeria, round 2 in Malawi, and round 1 in Uganda. Robust
standard errors are reported in parentheses (*** p<0.01, ** p<0.05, * p<0.10).

52
Table S25. Strategies to cope with income lost due to pandemic across gender of head of
household
Relied on
Saving
Sale of
Assets
Reduced
Food
Consumption
Reduced
Non-Food
Consumption
Received
Assistance
from Friends
and Family
Received
Any
Assistance
Female Head -0.105*** -0.021** 0.037 -0.068*** 0.020 0.085***
(0.022) (0.009) (0.028) (0.021) (0.024) (0.018)
Round 2 -0.029 -0.004 0.090*** -0.003 0.000 0.014
(0.024) (0.010) (0.022) (0.019) (0.016) (0.010)
Round 3 -0.004 0.044*** 0.146*** -0.040** -0.009 -0.031***
(0.021) (0.011) (0.020) (0.017) (0.018) (0.010)
Female × Round 2 0.096** 0.013 -0.033 0.083** 0.079** -0.057**
(0.038) (0.011) (0.039) (0.033) (0.038) (0.024)
Female × Round 3 0.027 0.007 -0.038 0.039 -0.008 -0.069***
(0.038) (0.022) (0.043) (0.030) (0.038) (0.024)
Ethiopia 0.014 -0.036*** 0.093*** 0.134*** 0.004 -0.007
(0.024) (0.010) (0.021) (0.016) (0.018) (0.010)
Nigeria 0.088*** 0.010 0.532*** 0.191*** 0.178*** 0.058***
(0.030) (0.013) (0.026) (0.020) (0.022) (0.011)
Uganda 0.225*** -0.017 0.265*** 0.201*** 0.165*** 0.061***
(0.034) (0.014) (0.030) (0.025) (0.027) (0.011)
Observations 10,618 10,618 10,618 10,618 10,618 22,664
R-Squared 0.021 0.022 0.204 0.014 0.042 0.022
Note: Each column reports results from a single regression of a binary variable equal to 1 if the respondent stated that the
household relied on that strategy to cope with the loss of income and 0 if they did not. The binary variable is regressed on
indicators for each country, with Malawi as the base case, and round, along with an indicator equal to 1 if the household head
is female, as opposed to male. Data come from all rounds of phone survey data in which FIES questions exist. Robust standard
errors are reported in parentheses (*** p<0.01, ** p<0.05, * p<0.10).

53
Table S26. Estimated total number of households
without access to basic necessities and average
household-level incidence of lack of access
Unable to
Access
Medicine
Unable to
Access Staple
Unable to
Access Soap
Total 5,132,974 11,151,785 4,075,418
(253,575) (448,490) (276,591)
Mean 0.204 0.243 0.124
(0.010) (0.010) (0.008)
Observations 4,604 6,793 5,298
Note: Each column reports the estimated total number of households
without access to basic necessities and average household-level
incidence of lack of access. Inability or ability to access a basic necessity
is conditional on the household needing the item or attempting to
purchase the item. Note that the question regarding soap was not asked
in Ethiopia. Data are only from the first phone survey round in each
country. Standard errors on the estimates are in parenthesis.

54
Table S27. Lack of access to basic necessities by consumption
quintile
Unable to Access
Medicine
Unable to Access
Staple
Unable to Access
Soap
Ethiopia 0.221*** 0.009
(0.037) (0.033)
Nigeria 0.011 -0.034 0.018
(0.024) (0.032) (0.019)
Uganda 0.217*** -0.129*** 0.092***
(0.024) (0.030) (0.019)
Quintile 2 0.004 -0.081* -0.071*
(0.043) (0.047) (0.039)
Quintile 3 0.001 -0.156*** -0.115***
(0.042) (0.043) (0.036)
Quintile 4 -0.039 -0.121*** -0.099***
(0.039) (0.042) (0.037)
Quintile 5 -0.113*** -0.218*** -0.138***
(0.034) (0.039) (0.036)
Ethiopia-Nigeria 0.000 0.107
Ethiopia-Uganda 0.919 0.000
Nigeria-Uganda 0.000 0.000 0.000
Observations 4,604 6,792 5,297
R-squared 0.072 0.038 0.030
Note: Each column reports results from a single regression of a binary variable equal to
1 if the respondent answered “yes” to a question about the inability to access a basic
necessity. Inability or ability to access a basic necessity is conditional on the household
needing the item or attempting to purchase the item. The binary variable is regressed on
indicators for each country, with Malawi as the base case, and each pre-COVID-19
household annual per capita consumption quintile, with the lowest consumption quintile
as the base case. Note that the question regarding soap was not asked in Ethiopia. The
second panel reports p-values for Wald tests of the simple linear hypothesis that the
coefficient on one country indicator equals the coefficient on an indicator for a different
country. Data are only from the first phone survey round in each country. Robust standard
errors are reported in parentheses (*** p<0.01, ** p<0.05, * p<0.10).

55
Table S28. Estimated total number of school-aged children in
households without educational engagement
All
Countries Ethiopia Malawi Nigeria Uganda
Total 68,465,008 31,681,834 6,116,277 24,741,134 5,925,768
(1,797,619) (614,013) (156,190) (1,489,912) (313,951)
Observations 6,190 1,911 1,193 1,417 1,669
Note: Each column reports the estimated total number of school-aged children living in
households that report their children have not been engaged in any sort of educational
activity since schools closed. Data are only from the first phone survey round in each
country. Standard errors are in parenthesis.

56
Table S29. Prevalence of engagement in
educational activity by consumption quintile
Education Activity
Ethiopia 0.011
(0.024)
Nigeria 0.437***
(0.028)
Uganda 0.439***
(0.025)
Quintile 2 0.012
(0.042)
Quintile 3 0.051
(0.039)
Quintile 4 0.108***
(0.038)
Quintile 5 0.179***
(0.037)
Ethiopia-Nigeria 0.000
Ethiopia-Uganda 0.000
Nigeria-Uganda 0.931
Observations 6,316
R-squared 0.185
Note: The table reports the result from a single regression
of a binary variable equal to 1 if the household has a
school-aged child that has been engaged in some
educational activity since schools closed and 0 otherwise.
The question is asked conditional on the household
containing a school-aged child. The binary variable is
regressed on indicators for each country, with Malawi as
the base case, and each pre-COVID-19 household annual
per capita consumption quintile, with the lowest
consumption quintile as the base case. The second panel
reports p-values for Wald tests of the simple linear
hypothesis that the coefficient on one country indicator
equals the coefficient on an indicator for a different
country. Data are only from the first phone survey round
in each country. Robust standard errors are reported in
parentheses (*** p<0.01, ** p<0.05, * p<0.10).

57
Table S30. Educational activity and food
insecurity
Moderate or
Severe Food
Insecurity
Severe Food
Insecurity
Education
Activity -0.075*** -0.033
(0.024) (0.023)
Ethiopia -0.118*** -0.054**
(0.029) (0.024)
Nigeria 0.112*** 0.102***
(0.029) (0.027)
Uganda -0.195*** -0.147***
(0.028) (0.021)
Ethiopia-Nigeria 0.000 0.000
Ethiopia-Uganda 0.005 0.000
Nigeria-Uganda 0.000 0.000
Observations 5,978 5,978
R-squared 0.089 0.074
Note: Each column reports results from a single regression of
a continuous variable that measures the prevalence of moderate
or severe food security, or just severe food insecurity among
adult household members. The variable is regressed on
indicators for each country, with Malawi as the base case, and
a binary for educational activity. Educational activity is a
binary variable equal to 1 if the household has a school-aged
child that has been engaged in some educational activity since
schools closed and 0 otherwise. The question is asked
conditional on the household containing a school-aged child.
The second panel reports p-values for Wald tests of the simple
linear hypothesis that the coefficient on one country indicator
equals the coefficient on an indicator for a different country.
Data come from the most recent round of phone survey data
available. This is round 2 in Ethiopia, Malawi, and Nigeria, and
round 1 in Uganda. Robust standard errors are reported in
parentheses (*** p<0.01, ** p<0.05, * p<0.10).

58
Table S31. Engagement in educational activities over time
Panel A: Ethiopia
Education
Activity
Listened to
Education
Programs on
Radio
Used Mobile
Learning Apps
Watched
Educational TV
Programs
Meeting with
Lesson Teacher
Round 2 0.130*** -0.110* -0.043 -0.070** 0.119***
(0.027) (0.064) (0.028) (0.036) (0.037)
Round 3 -0.117* 0.037 -0.051 0.041
(0.063) (0.038) (0.038) (0.031)
Observations 3,742 2,228 2,228 2,228 2,228
R-Squared 0.023 0.009 0.012 0.006 0.017
Panel B: Malawi
Education
Activity
Listened to
Education
Programs on
Radio
Used Mobile
Learning Apps
Watched
Educational TV
Programs
Meeting with
Lesson Teacher
Round 2 0.054* -0.053 -0.058* 0.087** 0.343***
(0.030) (0.077) (0.030) (0.043) (0.057)
Observations 2,355 516 516 516 516
R-Squared 0.004 0.003 0.017 0.031 0.141
Panel C: Nigeria
Education
Activity
Listened to
Education
Programs on
Radio
Used Mobile
Learning Apps
Watched
Educational TV
Programs
Meeting with
Lesson Teacher
Round 2 -0.012 0.267*** 0.123*** 0.141*** 0.168***
(0.033) (0.038) (0.028) (0.032) (0.034)
Round 3 -0.113*** 0.291*** 0.182*** 0.242*** 0.304***
(0.034) (0.038) (0.032) (0.035) (0.036)
Observations 4,045 2,515 2,515 2,515 2,515
R-Squared 0.010 0.076 0.042 0.049 0.072
Note: Each column in each panel reports results from a single regression of a binary variable equal to 1 if the school-
aged children in the household have engaged in the educational activity. The question is asked conditional on the
household containing a school-aged child. Each panel reports results for a single country. Uganda is excluded as there
is only one round of data. All rounds of all available data for a country are included in each regression. Robust standard
errors are reported in parentheses (*** p<0.01, ** p<0.05, * p<0.10).