Assessing socioeconomic impacts of climate change on...
108
Assessing socioeconomic impacts of climate change on Puerto Rico’s coral reef fisheries through a participatory approach Tarsila Seara, Karin Jakubowski, Richard Pollnac, and Thomas Webler SEDAR57-RD-23 July 2019
Transcript of Assessing socioeconomic impacts of climate change on...
Assessing socioeconomic impacts of climate change on Puerto Rico’s
coral reef fisheries through a participatory approach
Tarsila Seara, Karin Jakubowski, Richard Pollnac, and Thomas Webler
SEDAR57-RD-23
July 2019
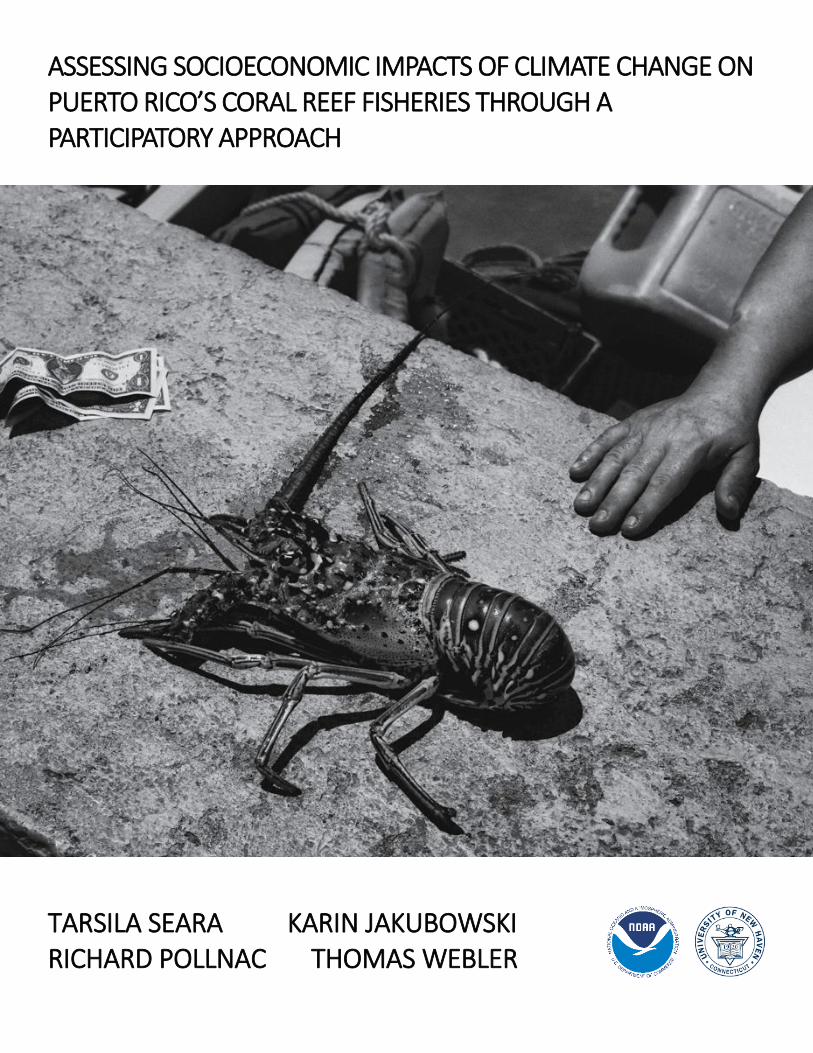
ASSESSING SOCIOECONOMIC IMPACTS OF CLIMATE CHANGE ON PUERTO RICO’S CORAL REEF FISHERIES THROUGH A PARTICIPATORY APPROACH
TARSILA SEARA KARIN JAKUBOWSKIRICHARD POLLNAC THOMAS WEBLER

2
Citation
Seara, T., K. Jakubowski, R. Pollnac, and T. Webler. 2018. Assessing Socioeconomic Impacts of Climate Change on
Puerto Rico’s Coral Reef Fisheries through a Participatory Approach. Final Report for the NOAA Coral Reef
Conservation Program NA16NOS4820051. 107p.
Award NA16NOS4820051
Acknowledgements
First, we would like to thank the National Oceanic and Atmospheric Administration (NOAA) Coral Reef
Conservation Program for the opportunity to conduct this research.
We are grateful for all those involved in different sectors of the Puerto Rican fisheries who agreed to be
interviewed as key informants and provide information crucial for the development of this study. We also wish to
recognize all the fishers we interviewed and who helped us during the course of this project.
We would also like to thank our data collection team and research assistants: Tessaliz Quiles Delgado, Guarionex
Padilla Marty, Kristie Olmeda Bird, Edna Espinosa Rivera, Kiara Acevedo, and Karina Krul.
We also thank Jordan Campbell for developing the animation video, Ines Reardon for translating and narrating the
video script in Spanish, and Roberto Irizarry for his help translating our questionnaires.
Cover photo: Graeme Swank
3
Table of Contents List of Tables ...............................................................................................................................................................4
List of Figures ..............................................................................................................................................................6
Introduction ................................................................................................................................................................8
Background .............................................................................................................................................................8
Coral Reef Ecosystems ........................................................................................................................................9
Puerto Rico Fisheries ....................................................................................................................................... 10
Puerto Rico Fisheries Management ................................................................................................................ 10
Climate Change and Coral Reef Fisheries ........................................................................................................ 11
Part I: Assessing Socioeconomic Impacts of Climate Change on Puerto Rico Coral Reef Fisheries ........................ 13
Methods of Data Collection and Sampling .......................................................................................................... 13
Key Informant Interviews ................................................................................................................................ 13
Surveys............................................................................................................................................................. 14
Analyses ............................................................................................................................................................... 14
Key Informant Interviews with Fishery Stakeholders ...................................................................................... 14
Surveys with Fishers ........................................................................................................................................ 20
Discussion ............................................................................................................................................................ 48
Part II: Impacts of Hurricanes Irma and Maria on Puerto Rican Fisheries and Fishers’ Perceptions of Climate
Change ..................................................................................................................................................................... 51
Methods of Data Collection and Sampling .......................................................................................................... 51
Analyses ............................................................................................................................................................... 52
Characteristics of the Sample .......................................................................................................................... 52
Impacts of Hurricanes Irma and Maria on Fishers and Fisheries .................................................................... 54
Fishers’ Perceptions of Environmental and Climate Change Before and After Hurricane Impacts ................ 57
Discussion ............................................................................................................................................................ 59
Outreach Strategies ................................................................................................................................................. 62
Introduction ......................................................................................................................................................... 62
Methodology ................................................................................................................................................... 62
Results ............................................................................................................................................................. 64
Conclusions .......................................................................................................................................................... 66
Policy Recommendations ........................................................................................................................................ 67
References ............................................................................................................................................................... 70
Appendix 1 ............................................................................................................................................................... 73
Appendix 2 ............................................................................................................................................................... 75
4
Appendix 3 ............................................................................................................................................................... 81
Appendix 4 ............................................................................................................................................................... 82
Appendix 5 ............................................................................................................................................................... 83
Appendix 6 ............................................................................................................................................................... 84
Appendix 7 ............................................................................................................................................................... 85
Appendix 8 ............................................................................................................................................................... 86
Appendix 9 ............................................................................................................................................................... 88
Appendix 10 ............................................................................................................................................................. 90
Appendix 11 ............................................................................................................................................................. 91
Appendix 12 ............................................................................................................................................................. 92
Appendix 13 ............................................................................................................................................................. 93
Appendix 14 ............................................................................................................................................................. 99
Appendix 15 ........................................................................................................................................................... 100
Appendix 16 ........................................................................................................................................................... 101
Appendix 17 ........................................................................................................................................................... 102
Appendix 18 ........................................................................................................................................................... 103
Appendix 19 ........................................................................................................................................................... 104
Appendix 20 ........................................................................................................................................................... 105
Appendix 21 ........................................................................................................................................................... 106
Appendix 22 ........................................................................................................................................................... 107
List of Tables Table 1. Survey sample size by region and communities visited by region during the first data collection effort. 14
Table 2. Descriptive statistics of demographic variables. ....................................................................................... 20
Table 3. Descriptive statistics of demographic variables by region. ....................................................................... 21
Table 4. ANOVA comparing demographic variables between regions. .................................................................. 21
Table 5. Frequency of responses of fishers’ occupations in addition to fishing. .................................................... 23
Table 6. ANOVA comparing fishing effort between regions. .................................................................................. 29
Table 7. Job satisfaction variables with mean values and standard deviation measured on a 5-point Likert scale
ranging from 1 = ‘very dissatisfied’ to 5 = ‘very satisfied.’ ...................................................................................... 33
Table 8. Results of Principal Component Analysis using job satisfaction items. ..................................................... 33
Table 9. ANOVA comparing scores on the job satisfaction components between regions. ................................... 34
Table 10. Standardized averages for the three job satisfaction components by region. ....................................... 35
Table 11. Fishers perceptions on the current status of fishery resources asked on a Likert scale ranging from 1 =
‘in very bad shape’ to 5 = ‘in very good shape.’ ...................................................................................................... 37
Table 12. Environmental awareness variables with mean values and standard deviation measured on a 5-point
Likert scale ranging from 1 = ‘strongly disagree’ to 5 = ‘strongly agree’ except for items marked with an asterisk
for which scale was reversed. ................................................................................................................................. 37
5
Table 13. Descriptive statistics for fishers’ perceptions of current status of fishery resources and change in state
of resources in the past decade. ............................................................................................................................. 38
Table 14. ANOVA comparing regions with regard to fishers’ perceptions of the current status of fishery resources
and change in resource status over the past decade. ............................................................................................. 38
Table 15. Frequencies of fisher’s’ responses regarding changes observed in the marine environment as a result
of climate change. ................................................................................................................................................... 40
Table 16. Adaptations strategies adopted by fishers in response to changes observed in marine resource and
environment. ........................................................................................................................................................... 40
Table 17. Frequency of ‘yes’ responses to climate change and anthropogenic factors fishers believe are affecting
their fishing activity. ................................................................................................................................................ 41
Table 18. Regional frequencies of fishers’ perceptions of the local climate changing. .......................................... 42
Table 19. Descriptive statistics of fishers’ views on climate change status by region. ........................................... 42
Table 20. Descriptive statistics of fishers’ level of concern about climate change by region. ................................ 43
Table 21. Frequency of ‘yes’ responses and chi square results of regional comparisons of frequencies of
anthropogenic and climate change factors fishers perceive as affecting the fishery. ............................................ 44
Table 22. Descriptive statistics for participation and compliance levels (measured on 10-point scales) by region.
................................................................................................................................................................................. 47
Table 23. Regional comparisons of the frequency of ‘yes’ responses to whether or not fishers can work together
to solve problems in the fishery. ............................................................................................................................. 48
Table 24. Regional comparisons of the frequency of fishers’ responses to whether or not fishers and government
should work together to solve problems in the fishery. ......................................................................................... 48
Table 25. Sample sizes by region for the pre-storm (T1) and post-storm (T2) time periods showing communities
grouped under each region. .................................................................................................................................... 52
Table 26. Descriptive statistics of fishers’ demographics for the post-storm period. ............................................ 52
Table 27. Perceptions on the impacts of human activities on the environment and the climate measured on a 5-
point Likert scale ranging from 1 = ‘strongly disagree’ to 5 = ‘strongly agree’ except for items marked with an
asterisk for which scale was reversed. .................................................................................................................... 54
Table 28. Mean value of damage level for different personal belonging measured on a scale of 1 to 4 from minor
to complete damage. .............................................................................................................................................. 54
Table 29. Between region differences in total number and severity level indices of damages and losses from the
hurricanes. ............................................................................................................................................................... 55
Table 30. Current status or jobs of people known to fishers who have exited the fishery occupation after the
hurricanes. ............................................................................................................................................................... 56
Table 31. Fishers’ perceptions on the current status of fishery resources asked on a Likert scale of 1 (very bad
shape) to 5 (very good shape). ................................................................................................................................ 56
Table 32. Fishers’ perceptions comparing the status of resources before and after the hurricanes. .................... 56
Table 33. Percent of responses about frequency with which fishers go out fishing since the storms. .................. 56
Table 34. Comparisons of fishers’ perceptions on the health of the resource (scale of 1 to 5) before and after the
storms. ..................................................................................................................................................................... 57
Table 35. Comparisons of fishers’ perceptions on the status of climatic changes observed (scale of 1 to 5) and
concern about changes (scale of 1 to 10) in the pre- and post-storms periods. .................................................... 57
Table 36. Frequency of ‘yes’ responses and chi square results of comparisons of frequencies of anthropogenic
and climate change factors fishers perceive as affecting the fishery before and after the hurricanes. ................. 58
Table 37. Comparison of scores on the Anthropogenic Impact scale (1 to 10) between the pre- and post-storms
period. ..................................................................................................................................................................... 59
Table 38. Comparisons of pre- and post-hurricanes job satisfaction and happiness mean scores. ....................... 59
6
List of Figures Figure 1.Map of Puerto Rico showing municipalities included in the first data collection effort (Adapted from
USDA 2012). ............................................................................................................................................................. 14
Figure 2. Diagram representing divergence and convergence of opinions between different stakeholder groups
regarding issues facing Puerto Rican fisheries and challenges affecting the fisheries that interviewees attribute to
climate change. ....................................................................................................................................................... 17
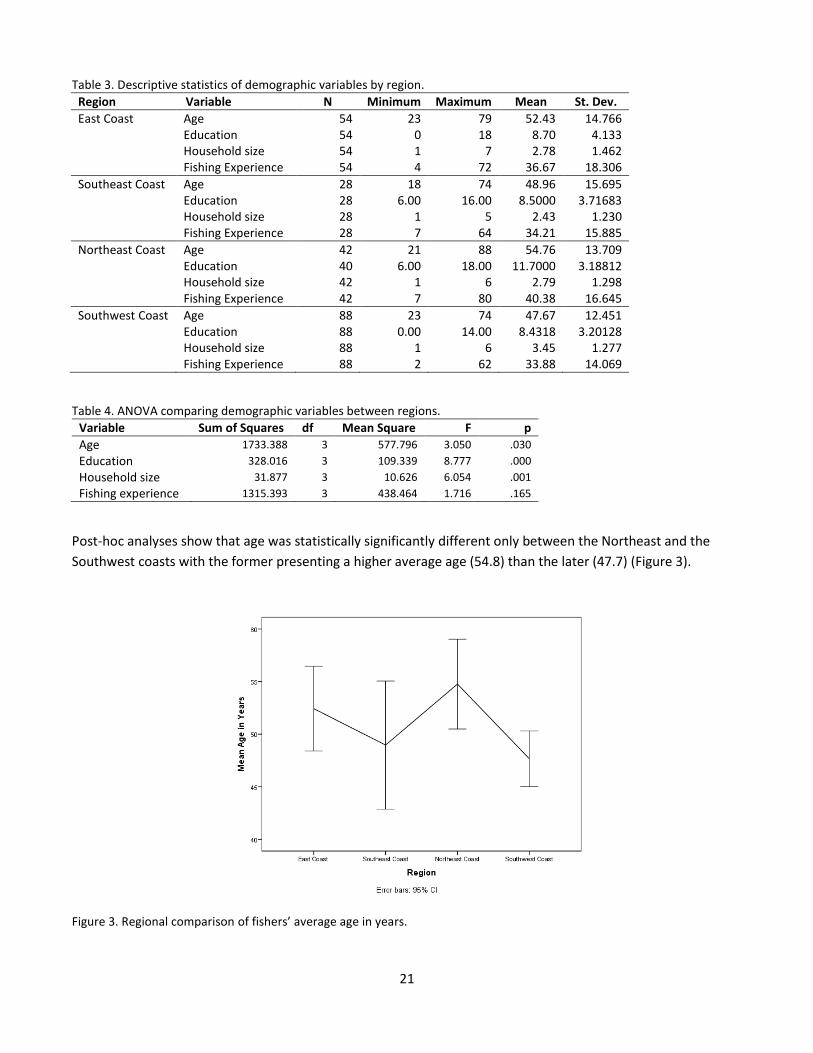
Figure 3. Regional comparison of fishers’ average age in years. ............................................................................ 21
Figure 4. Regional comparison of fishers’ average education in years. .................................................................. 22
Figure 5. Regional comparison of average fishers’ household size. ........................................................................ 22
Figure 6. Regional differences with regard to the percentage of fishers for whom fishing was a primary source of
income. .................................................................................................................................................................... 24
Figure 7. Most frequently used methods and gear types among fishers. Percentages represent frequency of
responses since individual fishers may use more than one method/gear type. .................................................... 25
Figure 8. Most frequently species targeted by fishers. Percentages represent frequency of responses since
individual fishers could mention more than target species. ................................................................................... 26
Figure 9. Regional comparison of average fishing boat length. .............................................................................. 27
Figure 10. Most frequent fishing methods and gears used by region. Percentages represent frequency of
responses since individual fishers may use more than one method/gear type. .................................................... 28
Figure 11. Most frequent target species by region. Percentages represent frequency of responses since
individual fishers may use more than one method/gear type. ............................................................................... 29
Figure 12. Regional comparison of average fishing effort in number of months per year. .................................... 30
Figure 13. Regional comparison of average fishing effort in number of days per month. ..................................... 30
Figure 14. Regional comparison of average fishing effort in hours per day. .......................................................... 31
Figure 15. Regional comparisons for average amount reported to be caught on a good day (left) and on a bad
day (right) of fishing. ............................................................................................................................................... 32
Figure 16. Regional comparison of the frequency of fishers who reported more good or equal versus bad days
fishing during the previous year. ............................................................................................................................. 32
Figure 17. Scree plot of Principal Component Analysis using job satisfaction variables. ....................................... 34
Figure 18. Regional comparison of average score on the job satisfaction component Basic Needs. ..................... 35
Figure 19. Regional comparison of average score on the job satisfaction component Self-Actualization. ............ 36
Figure 20. Regional comparison of average score on the well-being (happiness) scale. ........................................ 36
Figure 21. Regional comparisons of fishers’ perceptions of the current state of fishery resources and change in
resource status over the past decade. .................................................................................................................... 38
Figure 22. Regional comparison of average score on the Total Environmental Awareness variable. .................... 39
Figure 23. Frequency of ‘yes’ responses to climate change and anthropogenic factors fishers believe are affecting
their fishing activity. ................................................................................................................................................ 41
Figure 24. Regional comparison of perceptions in climate change status. ............................................................. 42
Figure 25. Regional comparisons of average scores on the climate change concern scale. ................................... 43
Figure 26. Regional comparisons of frequencies of anthropogenic and climate change factors fishers mentioned
as affecting the fishery. ........................................................................................................................................... 44
Figure 27. Regional comparisons of average scores on the Anthropogenic Impacts Scale. ................................... 45
Figure 28. Average levels of participation on fishery management decisions and compliance with fishing
regulations measured on a 10-point self-anchoring scale. ..................................................................................... 46
Figure 29. Regional comparisons of mean scores of fishers’ perceptions on levels of compliance by fishers
measured on a 10-point self-anchoring scale. ........................................................................................................ 47
7
Figure 30. Map of Puerto Rico showing municipalities surveyed in the second data collection effort (Adapted
from USDA 2012). .................................................................................................................................................... 51
Figure 31. Most frequently used methods and gear types among fishers interviewed in the post-storms period.
Percentages represent frequency of responses since individual fishers may use more than one method/gear
type. ......................................................................................................................................................................... 53
Figure 32. Most frequently species targeted by fishers interviewed in the post-storms period. Percentages
represent frequency of responses since individual fishers could mention more than target species. .................. 53
Figure 33. Comparisons of frequencies of anthropogenic and climate change factors fishers mentioned as
affecting the fishery before and after the hurricanes. ............................................................................................ 58
8
Introduction The primary objective of this research is to generate knowledge about important aspects of the socioeconomic
impacts of climate change on individuals, households, and communities engaged in various types of fishing
activities in and around coral reef areas in Puerto Rico. Climate change and other anthropogenic impacts have
greatly affected corals and organisms dependent on these ecosystems in the Caribbean region. These impacts
have indirect and direct consequences for people whose livelihoods, nutrition, and overall well-being depend
upon the health of these marine resources. This research aimed at assessing the perceptions of different
stakeholders, but primarily fishers, about climate change and other anthropogenic impacts affecting the
fisheries in Puerto Rico from a socioeconomic perspective. Understanding the perceptions of different
stakeholders including natural resource users is crucial for the development of effective strategies for resource
sustainability and human adaptation to climate change and other stressors. Policy strategies that are designed
to account for and include stakeholder perceptions are more likely to be met with acceptance and compliance.
Further, assessing the perceptions of different stakeholders involved in different aspects within the fishery
sector allows for the analysis of convergent and divergent viewpoints which can be used to guide policy
strategies to focus on areas of agreement and work on areas of discrepancy.
Originally, this project was focused exclusively on achieving the above described objectives. However, the
research design was revisited and slightly modified to accommodate for unforeseen events. During the final six
months of the original project timeline, hurricanes Irma and, particularly, Maria caused significant damage and
severely disrupted the lives of all people in Puerto Rico. As a result, we decided to extend the project timeline
and conduct a second data collection effort approximately eight months after Maria made landfall to assess
impacts of the hurricane on fisheries and to collect data that allowed us to compare fishers’ perceptions of
aspects of climate change vulnerability before and after this major natural disaster. This second data collection
effort allowed for the unique opportunity to further investigate how natural disasters shape resource users’
perceptions and experiences, and affect aspects of their vulnerability to environmental change including climate
change. Findings of this second data collection effort provide additional valuable knowledge to help the
development of policy strategies aimed at increasing and maximizing the resilience of coastal communities to
natural disasters particularly under climate change scenarios in which storms, hurricanes, and sea level rise
compound environmental stresses caused by other anthropogenic impacts.
This report includes all major findings of this project and is organized into four sections which follow this
introduction. The first section includes the analyses of data collected as part of the original effort before
hurricanes Irma and Maria hit Puerto Rico. The second section provides a comparison of the pre- and post-
hurricanes assessment of fishers’ perceptions of climate change as well as an assessment of impacts of the
storms on fishers’ fishing activities. The third section describes the outreach components of the project which
includes an innovative participatory method of field testing an animated video portraying the major findings of
part one. Finally, the fourth section of this report includes our policy recommendations based on the major
findings of this research.
Background Anthropogenic activities have been threatening marine ecosystems and resources worldwide at an increasing
rate. In the Caribbean region, economic development and population growth have generally occurred without
effective policies to safeguard the sustainability of natural resources, resulting in rapid degradation of coastal

9
waters and critical ecosystems (Valdéz-Pizzini et al. 2012). These ecosystem changes have serious consequences
of both ecological and socioeconomic nature, reducing biodiversity, revenues, and the resilience of fishers, their
families and communities. Marine fisheries in the Caribbean are also increasingly vulnerable to the impacts of
climate change, including warmer sea temperatures, coral bleaching, and more frequent and intense storms,
affecting fish and shellfish species of economic and cultural significance, as well fishing infrastructure.
Understanding aspects of fisheries and fishers’ vulnerability to change and exploring new strategies to address
future challenges in fisheries policy is crucial to maximize coastal communities’ resilience and adaptation to
change, particularly under future climate change scenarios.
Coral Reef Ecosystems Coral reefs in the Caribbean have been declining for at least the last forty years. Today, 75 percent of the coral
reef ecosystems in this region are under medium to highly threatened status (Appledoorn et al. 2009, Burke et
al. 2011). Puerto Rico’s coastline includes over 5,000 kilometers squared of coral reef ecosystems that are
accessible to the public (NOAA 2018). These reefs have been affected by a variety of both global and local
stressors. Specific local stressors include land based pollution and runoff, coastal development, overfishing,
population increases along the coast, vessel groundings, recreational overuse, coral diseases, bleaching due to
increasing sea temperatures, and invasive species. More than 50 percent of the living coral in Puerto Rico has
been lost and the rate of loss continues to increase (Morelock et al. 2001).
The degradation of coral reefs and the decline in fishery resources that live in and depend upon these
ecosystems have serious consequences of both ecological and socioeconomic nature. Ecological effects include
threats to biodiversity, loss of coral reef resilience, degradation of the reef habitat, and disruption of ecological
balance (Hoegh-Guldberg et al. 2007, Hughes et al. 2003; 2007, Baker et al. 2004, Mumby et al. 2007).
Socioeconomic impacts include negative effects on revenue such as decreases in the total catch and lower catch
per unit effort, and also reduced food security, changes in livelihood opportunities, as well as loss of other
important ecosystem services provided by coral reefs (Moberg and Folke 1999, Mumby et al. 2014).
Furthermore, the decline of coral reef fisheries can have important social and psychological consequences to
many individuals, households, and communities. Extensive research shows that fishers demonstrate a strong
attachment to the fishing occupation (Binkley 1995, Pollnac et al. 2008; 2015, Marshall et al. 2007) and,
consequently, high levels of job satisfaction and well-being (Pollnac and Poggie 1988, Smith and Clay 2010, Seara
et al. 2017a; 2017b). Certain aspects of the occupation of fishing such as “adventure” and “being outdoors,”
coupled with familial and cultural traditions are important factors influencing fishers to enter and remain in their
occupation even when income has declined or become more uncertain (Crawford 2002, Pollnac et al. 2001).
Griffith and Valdes-Pizzini (2002) described that Puerto Rican fishers consider fishing as “therapy.” Many Puerto
Rican fishers who work on land jobs (e.g. farming) during the fishery off seasons, return to the sea, to what they
describe as a healthy activity that keeps their minds occupied on useful things and that provide relief from stress
(Griffith and Valdes-Pizzini 2002). These sociocultural aspects of the fishing occupation provide further evidence
of the complexity of the relationships governing coupled human and natural systems and emphasize the
importance of understanding and considering social, economic, and cultural factors in managing and conserving
coral reef fishery resources.
10
Puerto Rico Fisheries Fishing activities in Puerto Rico are predominantly dependent on nearshore coral reef systems (Appeldoorn
2008) and adjacent ecosystems such as seagrass beds and mangrove forests. Fishers can be found using a
variety of gear types along the coasts of Puerto Rico as well as the smaller islands located off the eastern and
western coasts (Matos-Caraballo and Agar 2011). Puerto Rico fisheries are organized around fishery centers or
associations, “villas pesqueras,” or along fishing villages and population centers. The fisheries often consist of an
owner and operators who use small vessels with limited horsepower. Catches consist of low quantities of a
variety of species (Griffith and Valdes-Pizzini 2002) including snappers (Lutjanidae), groupers (Serranidae), and a
variety of crustaceans and mollusks that are sold to the villas pesqueras and private fish markets (pescaderias),
or more informally from fishers’ houses or directly to buyers or restaurants.
According to Garcia-Quijano (2009) the Puerto Rican small-scale fisheries socioeconomic context can be typified
by “heterogeneity and unpredictability of opportunities for employment and for covering the basic needs of
subsistence” (2009: 12). According to the latest census of Puerto Rican fishers, approximately 900 individuals
engage in the activity throughout the island (Matos-Caraballo and Agar 2011). There is indication, however, that
the actual number is higher, ranging between 1,500 and 2,000 as suggested by qualitative data, since many
fishers on the island are not fully licensed (Tonioli and Agar 2009). The licensing system in Puerto Rico requires
that fishers provide proof of income deriving from fishing in the form of tax documentation in order to be
considered eligible for either part- or full-time commercial fishing licenses (Matos-Caraballo 2009). As
mentioned above, the fishery sector in Puerto Rico has been historically characterized by occupational
multiplicity (Garcia-Quijano 2009, Garcia-Quijano et al. 2015, Griffith and Valdes-Pizzini 2002) which may be in
conflict with the current licensing system, therefore unintentionally creating an incentive for unlicensed and,
thus, under-or unreported fishing activity.
Puerto Rican fishers typically engage in multiple gear activities including nets, traps, hook and line, and harpoon.
In recent years, the percentage of fishers practicing SCUBA diving has increased considerably: from
approximately 35% in the mid-90s to between 40 and 50% in 2008 (Matos-Caraballo and Agar 2011). According
to Matos-Caraballo and Agar (2011) this reflects a necessity for fishers to become more specialized as a result of
declines in coastal catches. Down trends in commercial fish landings in Puerto Rico have been reported since the
1970s (Matos-Caraballo 2009) with an alarming decline of approximately 69% occurring between 1970 and 1990
(Appeldoorn et al. 1992). The species predominantly targeted by SCUBA divers are spiny lobster (Panulirus
argus) and queen conch (Strombus gigas).
Puerto Rico Fisheries Management Some of the unique characteristics of Puerto Rico coral reef fisheries, such as strong habitat dependence,
susceptibility to coastal impacts, diffuse landings sites, intense multispecies and multigear interaction, along
with socioeconomic and cultural factors, can pose significant challenges to local conservation and management
(Appeldoorn 2008). Puerto Rico state water fisheries are managed by the Puerto Rico Department of
Environmental Resources (DNER). Beyond the commonwealth’s claimed nine nautical miles, the fisheries are
regulated by the NOAA Caribbean Fisheries Management Council (CFMC). Both agencies establish compatible
regulations to address fishery conservation goals. The DNER estimates that approximately 70% of all fishing
activities occur within their jurisdiction (Matos-Caraballo 2009). In 2004, the DNER passed Regulation 6768,
known as Puerto Rico Fisheries Regulations (PRFR). Although the process for implementation of the new code

11
included public hearings and allowed for stakeholder recommendations, the new rules were received with
animosity by the majority of fishers (Matos-Caraballo 2009). Puerto Rico fishers thought the rules restrained
them from making a living from fishing and focused excessively on overfishing while undervaluing other impacts
on mortality such as pollution and habitat degradation (Garcia-Quijano 2009). Conflicts between Puerto Rican
fishers and management agencies led to hundreds of fishers ceasing to report their landings statistics and
refusing to participate in catch monitoring programs (Matos-Caraballo and Agar 2011). Such resistance practices
are common methods for protesting regulations that are seen as unfit and unfair (Garcia-Quijano 2009).
Fisheries management is ultimately a trade-off between maximizing yields and achieving social, economic, and
cultural goals. Government based management strategies that fail to consider social and community needs,
beliefs, and norms of stewardship may result in further conflict, non-compliance, and an increase in illegal
practices (Valdéz-Pizzini et al. 2012, Hernández-Delgado 2014). There is strong evidence to support the need for
participatory approaches that involve and empower stakeholders (as opposed to consult) and take into account
local ecological knowledge (LEK) (see Apeldoorn 2008, Garcia-Quijano 2009, Hernández-Delgado 2014).
Management strategies that address multiple stressors in a participatory manner convey a sense of fairness to
impacted parties, and decisions that are perceived to be fair are more widely accepted by the impacted public
(NOEP 2014).
In a census of Puerto Rican fishers conducted in 2008, the majority of participants shared the opinion that the
island’s fishery resources were worse off then, when compared to “other years” (Matos-Caraballo and Agar
2011). Among the most important reasons cited by Puerto Rican fishers as the cause for declining fish stocks
were overfishing, pollution, habitat degradation, regulations, weather and ocean conditions, and climate
change. Research conducted on the causes of reef-estuarine ecosystems degradation support the Puerto Rico
fishers’ opinions that other factors along with overfishing significantly contribute to fish mortality (Mora 2008,
Mumby et al. 2004, Nellemann et al. 2008).
Climate Change and Coral Reef Fisheries While it is possible to develop strategies to effectively manage resource use on a local scale, such task becomes
more difficult when compounded by multiple stressors, specifically large-scale global threats. Examples of such
threats to coral reefs include warmer ocean temperatures and changes in the chemistry of ocean water (Doney
2006). There is a direct correlation between increased greenhouse gases, climate change, and regional-scale
bleaching of corals (Hughes et al. 2003, Hoegh-Guldberg 1999). Moreover, changes in ocean chemistry
(acidification) due to increased concentrations of carbon dioxide in the atmosphere contribute to the weakening
of coral skeletons and may cause death of coral organisms (Doney 2006, Kleypas et al. 1999). Climatic changes
can also result in an increase in the frequency and intensity of severe weather events such as storms and
hurricanes, which can cause wave damage to corals and increase stress from terrestrial run-off (Heron et al.
2008). Coral bleaching and diseases associated with climate related stressors have already increased greatly in
frequency and magnitude over the past 30 years (Glyn 1993, Wilkinson and Souter 2008, Baker et al. 2008,
Baker 2014).
Climate change is also considered a major aspect affecting the well-being of coastal communities worldwide
(Karl et al. 2009, Melillo et al. 2014). Specifically in fishing resource dependent communities, direct and indirect
impacts of climatic changes on commercially important species affect the ability of fishers to harvest them
(Sumaila et al. 2011, Pinsky and Mantua 2014, McCay et al. 2011) resulting in declining landings and revenue.
12
Declines in revenue will not only impact fishers and their families but also local coastal economies at large.
Effects of climate change may also influence changes in fishery management (e.g. reduced quotas),
compounding the pressures associated with resource scarcity and further affecting fishing communities’ socio-
economic well-being.
Environmental transformations associated with climate change and specifically the potential impacts of indirect
effects (e.g. ocean acidification) on range and productivity of commercially important species require that
fishers adopt strategies to respond adaptively. Adaptive responses may include within-fishing adaptations, e.g.
finding new fishing grounds and exploiting different species, or outside-fishing adaptations, i.e. finding
alternative income or employment (Pinsky and Mantua 2014, McCay et al. 2011). As described above, a great
deal of research suggests that fishers are reluctant to leave the occupation of fishing even under economic
hardship due to a combination of socio-cultural and psychological factors (Smith and Clay 2010, Pollnac et al.
2015, Seara et al. 2017a; 2017b). Therefore, seeking alternative employment as a strategy is unlikely and of
particular concern for individual, familial, and community well-being (Pollnac and Poggie 2008, Pollnac et al.
2015). Specifically in Puerto Rico, evidence of the significance of fisheries to cultural, psychological, and basic
subsistence aspects (Valdéz-Pizzini et al. 2002, Garcia-Quijano 2009, Valdéz-Pizzini et al. 2012, Garcia-Quijano et
al. 2015) further exacerbates the challenges associated with fishers’ adaptation under climate change.
An extensive assessment of socioeconomic vulnerability to climate change is necessary for understanding long-
term scenarios of socioeconomic futures of reef dependent communities engaged in fishing activities in Puerto
Rico. Fishing in and around coral reef systems has traditionally had significant economic as well as social and
cultural importance while also representing a crucial source of subsistence to many Puerto Rican individuals,
households, and communities. The goal of this study is to inform management decisions tightly linked to
ecosystem goods and services to address climate change and other important pressures on coral reef fishing
systems, while focusing on supporting community resilience at a local scale. This research also focused on the
development of a participatory approach, both within the context of the study and more broadly through
exploring strategies to further involve stakeholders, particularly fishers, in future decision making and to better
communicate research findings to fishers and communities at large. These are necessary steps to maximize
acceptance and success of recommended fisheries and climate change policy strategies into the future.
13
Part I: Assessing Socioeconomic Impacts of Climate Change on Puerto Rico
Coral Reef Fisheries This section of the report includes major findings of the first data collection effort that took place between July
2016 and January 2017. This data collection effort included key informant interviews with different fisheries
stakeholders and surveys with fishers in different coastal communities around Puerto Rico. The key informant
interviews were used to obtain information that helped the development of the survey questionnaire and also
allowed for the collection of important data on perceptions of different stakeholders about critical issues
affecting the fisheries in Puerto Rico and an analysis of aspects of convergence and divergence of viewpoints
among these different stakeholders. Surveys with fishers were conducted to further investigate aspects of
fishers’ dependence on the occupation, their well-being and job satisfaction, perceptions on climate change and
other anthropogenic impacts on fisheries, and their views on aspects of fisheries governance. This section of the
report provides a characterization of the fisheries in Puerto Rico through the analyses of data collected with
fishers’ surveys and key informant interviews, and it investigates the perceptions of fishers in Puerto Rico
communities toward environmental and climate change as well as factors potentially influencing these
perceptions and their ability to adapt.
Methods of Data Collection and Sampling
Key Informant Interviews Key informant interviews were conducted with 20 people involved in different aspects of the fisheries sector in
Puerto Rico. Seven interviews were conducted with government officials involved in various aspects of fisheries
management of which two were affiliated with the Caribbean Fisheries Management Council (CFMC) and five
with the Department of Natural and Environmental Resources (DNER). Six interviews were conducted with
people directly involved in the fisheries sector, five of which were experienced fishers including two presidents
of fishing associations (villas pesqueras), and one was the owner of a major fish market (pescaderia). Three key
informants were scholars directly involved in research to inform fisheries management decisions in Puerto Rico,
three were affiliated with NGOs working directly with the fisheries sector, and one key informant was the head
of an institute with indirect ties to the local fishing industry (“other”). Interviews were conducted face-to-face
with all informants directly involved in the fishery sector, one of the scholars, one of the NGO members, and
with the key informant in the “other” category. Two interviews were conducted over the phone with one of the
scholars and one of the government officials. The remaining interviews were self-administered and submitted
via email. Although the preferred method for these interviews was face-to-face or over the phone, time
constraints created a challenge for many of the key informants, and in order to maximize the total sample,
particularly from government officials, the self-administered option was utilized. The sampling method used was
a mix of convenience (mostly for the fishery sector) and chain referral sampling starting with our previously
established network. The key informant questionnaire included questions on aspects of fisheries dependence,
major issues facing the Puerto Rico fisheries sector, opinions on perceptions and impacts of climate change, as
well as aspects of fisheries governance. The full questionnaire in both English and Spanish versions can be seen
in Appendix 1.

14
Surveys A total of 212 fishers were surveyed in ten different municipalities representing the East, Northeast, Southeast,
and Southwest regions of Puerto Rico (Figure 1 and Table 1). An intercept sampling method was used, which
consisted of approaching fishers at different fishing associations (villas pesqueras) and other locations where
they were known to land their catches or congregate. This sampling technique was considered the most
effective to maximize sampling of the studied universe since no comprehensive list or directory of Puerto Rican
fishers is readily available from which to draw a random sample. The questionnaires included questions on
demographics, work and fishery attributes, well-being and job satisfaction, perceptions of the status of fishery
resources and the environment, perceptions of climate change, and views on aspects of governance and
participation in fisheries management. Questions used a combination of dichotomous, Likert scale, and open
ended methods to collect data that could be analyzed quantitatively while allowing respondents to elaborate on
their views and experiences to aid in interpretation of results. The full survey questionnaire in both English and
Spanish versions can be seen in Appendix 2.
Figure 1.Map of Puerto Rico showing municipalities included in the first data collection effort (Adapted from USDA 2012).
Table 1. Survey sample size by region and communities visited by region during the first data collection effort.
Region & Municipalities N
East Coast (Naguabo, Fajardo, Ceiba, Vieques, Culebra) 54
Southeast Coast (Patillas, Guayama) 28
Northeast Coast (San Juan, Cataño) 42
Southwest Coast (Cabo Rojo) 88
Total 212
Analyses
Key Informant Interviews with Fishery Stakeholders Aspects of coastal communities’ and fishers’ dependence on fisheries were explored during the key informant
interviews. Opinions regarding levels of dependence on fishery resources among key informants differed
considerably even within the same stakeholder groups. Many key informants stated that dependence is place
specific with some communities depending more than others (e.g. Cabo Rojo and Vieques). Informants also
15
pointed out that many coastal communities depend heavily on tourism and, thus, indirectly on fish and shellfish
to attend demand for the product by restaurants or recreational fishing tourists. However, another point
brought up during the interviews is that the contribution of imported seafood in the Puerto Rican market has
increased considerably in the past few years:
“[M]ore than 90% of our seafood is imported and local fishers have to depend on second jobs to be able to
generate additional income to survive. This is in part due to habitat destruction, limited resources, legal and
political barriers to the development of a fishing industry with agreements with other countries” (Government).
“[Coastal communities’] dependency on fisheries is based on how you gage it. Landings and value are not great; in
fact, a vast majority of fish are imported. Fisheries are recreationally important to the economy and support the
tourism culture. This is important to the communities who depend on tourism” (Research).
One key informant affiliated with the fishing industry expressed concern about the contribution of imported
seafood and aspects of government support for the local fisheries:
“Many fishers retired from fishing and went into other occupations because of the fishing regulations and because
the government wants to get rid of the fishers because they prefer the fishery from ‘outside’” (Fishery).
Different key informants across stakeholder groups stated that in general the majority of fishers have other jobs
and sources of income and that they rarely depend solely on fishing for their livelihoods. Key informants
affiliated with the fishing industry explained that the number of full time fishers has declined considerably in the
past few years and that, due to seasonality and market prices, many fishers complement their income with
other activities. Some key informants also expressed concern over the decline in fish stocks:
“In Puerto Rico there is a lot of variety of fish but not quantity and the stocks have been declining in the last 15
years or so. Many fishers in Puerto Rico do not sell or make money out of the fish they catch but rather they fish to
eat” (Fishery).
Key informants who believe fishers depend heavily upon fishery resources mentioned lack of alternative
employment opportunities and some expressed regard for aspects other than income by mentioning social and
cultural components of one’s livelihood such as family ties:
“There are not too many options for employment on the island [Vieques] and therefore [fishers] depend on the
fishery to make a living. They go out everyday fishing.” (Fishery)
“Most [fishers] fish for a living. This is their full time job. Some don’t know any other job or vocation other than
fishing, which many times is a family trade” (Government).
“Most coastal communities in Puerto Rico still depend of the fisheries industry for self-sustenance or market to
local restaurants or shops. Some continuing family traditions, others with no work opportunities or experience”
(NGO).
“Fishers that live in [coastal] communities are very dependent on fishing. A lot of them dedicate only to fishing
either because they learned fishing with their parents and inherited the business or because they do not have
formal education and have less chances of getting other types of jobs” (NGO).
Overall, perceptions on coastal communities’ and fishers’ dependency on fishery resources differed considerably
among individuals and even within the different stakeholder groups. Data to more objectively measure
dependence of Puerto Rico coastal communities on fishery resources is needed as one government affiliated key
informant explained:
“There is very little data on fishermen’s dependency on fish resources and we need good objective studies that will
provide solid information on this” (Government).
16
In general, key informants agreed with regard to coastal communities’ and fishers’ dependence on coral reef
ecosystems for their livelihood. Interviewees mentioned the importance of corals to the health of the species
fishers depend upon either directly or indirectly:
“Fisheries in Puerto Rico are mostly coral reef based (although some pelagic species and deep water snappers also
are important) so fishers depend on their health to have a steady source of income” (NGO).
“Coastal communities have both tourism and fisheries which both depend on the reefs for livelihood. There is a
good deal of overlap between both. Communities seem to be more dependent on the coral reefs than on
fisheries” (Researcher).
“Most of the fish here concentrate around the coral: yellowtail snapper, mutton snapper, and grouper” (Fishery).
Key informants involved in the fishery industry also mentioned the higher value of reef and reef dependent
species:
“The reef species are the ones with a better market – they are the ones we can sell” (Fishery).
“Lobster is the number one species that sell in Vieques (conch is also important) and the lobsters live in the reefs”
(Fishery).
Aspects of coral reef degradation were also mentioned by key informants. One government affiliated
interviewee mentioned the fact that fishers are concerned about pollution and, in another interview, a fisher
mentioned their concern for the effects of pollution on corals and the fishery, specifically with regard to
pollution from tourism activities:
“Coral reef health is vital to the health of the fisheries and coral reef degradation due to contamination is the
number 1 complaint of fishers” (Government).
“The most important fish we catch are reef species and many of the coral reefs are damaged because of pollution.
[Pollution] from [a] nearby resort goes into the water directly and it affects and kills the corals. There are many
beautiful reefs but many of them are in bad shape” (Fishery).
One key informant mentioned changes in the local fishery in Puerto Rico that has affected the relationship
between fishers and the coral reef habitats:
“Our fishing efforts have changed from traps deployed at coral reefs to deep ocean fishing and SCUBA. Fishers
depend indirectly on coral reefs as habitat for some species but fishing has dramatically changed from what it used
to be” (Researcher).
Key informants’ views regarding major issues facing Puerto Rican fisheries and challenges affecting the fisheries
that they attribute to climate change are summarized in Figure 2. Circles representing different topics
mentioned during interviews are spatially organized and colored to illustrate issues that represent convergence
and divergence or perceptions between different stakeholder groups1 (represented by black squares). Issues
currently affecting the fisheries mentioned by all four stakeholder groups (pink circles) include: challenges
related to lack of enforcement and compliance of fishery regulations, lack of participation from fishers in
decision-making, poor relationship and communication between fishers and other stakeholders including
government agencies, climate change, coral bleaching and coral damage, and algal blooms. Other important
issues which were mentioned by multiple stakeholders including those directly involved in the fishery sector
were: lack of concern by fishers with regard to fish stock conservation, fisheries management decisions that are
not effective, lack of funding for efforts to deal with fisheries and fisheries management, changes in the
1 The “other” category containing one key informant was excluded from this analysis.

17
behavior of fish, more storms, pollution, and warmer water temperatures. Issues common to all other
stakeholders except the fishery sector were overfishing, erosion, and lack of or low quality data to make
decisions. Issues raised by the fishery sector alone were poor water visibility, change in water color, and
statements that say climate change is not a problem or that no changes in climate have been observed.
Government and fishery stakeholders were the only two groups to mention that the fishery licensing system in
Puerto Rico is a problem currently affecting the fishery (Figure 2).
Figure 2. Diagram representing divergence and convergence of opinions between different stakeholder groups regarding issues facing Puerto Rican fisheries and challenges affecting the fisheries that interviewees attribute to climate change.
Although the majority of key informants stated that, in their opinion, fishers are in general concerned about
changes in the marine environment that are associated with impacts of climate change, opinions differed with
regard to their understanding of the links between changes observed and climate change as the main cause:
“The fishers are noticing changes but they may not be able to link it to climate change. Fishers lack the knowledge
to connect it to climate change. For example, they are aware the water is warmer but use myths to explain why
events, like warming, are happening. They see changes in weather patterns. Often, they cannot go out due to
weather conditions. Fishers are having to take greater risks” (Researcher).
“[Fishers] are observing the changes but they do not know why” (Fishery).
Some key informants stated that, although fishers perceive changes related to climate change, this issue is not a
priority for them as they are generally more concerned about fishery regulations:
“Some [fishers] feel times of spawning aggregations are changing. There have been some changes to queen conch
regulations associated with changes on spawning behavior – changes that were perceived by the fishers. In general
18
I do not get any word from fishers directly regarding concerns about climate change. They are more concerned
about the regulations” (Government).
“Some of them know that climate change impacts the health of the fisheries but the majority of them do not see
the correlation. They seem to be more worried about existent regulations that limit them from harvesting fish
especially during spawning periods” (NGO).
“[Climate change is] not a priority [for fishers]. The[ir] priority is catching more fish and not getting regulated”
(NGO).
“I haven't seen many fishers at meetings, symposia, or fora regarding climate change. Nor have I heard them
bringing the topic at meetings” (Government).
On the other hand, some key informants mentioned the strong connection fishers have to the marine
environment to explain that they are not only aware of the changes but they understand they are occurring due
to climate change:
“Puerto Rican fishers recognize and are concerned about climate change since they are out on the sea every day
and are experiencing the changes in temperature, currents, resource degradation and its effects on fisheries”
(Researcher).
“[Fishers] are worried. They see the changes because they go into the water. They talk about changes like the
presence of more algae or ones that didn’t exist here before” (Fishery).
Key informant opinions differed with regard to aspects of fishers’ collaborations within the community as well as
with government and decision-makers. Some interviewees affiliated with the government, NGOs, and
researchers had a strong opinion that, generally, fishers do not wish to collaborate:
“Fishers are individualists. If there is a crisis they come together to get the government to fix it and give them more
money. Otherwise it is hard to get fishers together” (NGO).
“Good luck! Fishers are lone wolves and they are infamous for not working together. They are keen on their
independence, being their own boss, working alone is one of the reasons they get into the occupation to begin
with” (Government).
“It has been my experience that [fishers] don't unite. Many are just trying to protect their own interest”
(Government).
Other key informants acknowledged the importance of fishery industry leadership in the decision making
process:
“When backed by a strong community leader they can and do work together to solve problems. The fishery is their
livelihood and they are very well aware of what is at stake” (Government).
“There are leaders among fishers that could be very important resources dealing with fishery problems and the
reduction of its impacts” (Researcher).
On the other hand, key informants in the fishery sector perceive fishers as keen to collaborate amongst
themselves and with the government but they do not perceive decision-makers to be facilitating collaborations:
“It is very difficult and frustrating to work with the government. They open one door and close another” (Fishery).
“The coop fishers work together to create proposals to help better develop the fishery but the government does
not listen to them” (Fishery).
19
“The government is always against the fishers. We could work together if the government is willing to reach an
agreement with the fishers” (Fishery).
Those in the fishery sector also mentioned lack of assistance and support from the government:
“Fishers try to talk to the government but they don’t trust them. They make promises but do nothing. We pay fees
to use the locker rooms, we pay water and electricity and we don’t get any help from the government” (Fishery).
“The money comes in but if you don’t go directly to them you won’t see anything. Now there is no more money for
boats, tools, no more help, no more funds” (Fishery).
“Farmers get a great deal of assistance from the government (subsidies, aid to buy equipment) but the fishers do
not get any assistance and, in fact, the government poses a number of different obstacles to the development of
the fishery in Puerto Rico”(Fishery).
Fishery industry stakeholders also mention the lack of accessibility to and distance of decision-makers as being
an impediment to collaboration and a better relationship between fishers and those involved in fisheries
management:
“They make decisions sitting on a chair in their air-conditioned offices. They don’t know about the problems. They
don’t talk to the fishers. When they do, the rules are already made” (Fishery).
“No good communication [between fishers and government]. We have to go there one by one to get information,
they don’t come here. They are fair to us when we go there, but we need to go there” (Fishery).
The importance of enabling more collaboration between fishers and decision-makers was brought up by some
key informants:
“There is a wealth of knowledge and information in local ecological knowledge that can be brought to the table by
fishers. In turn, there is a lot that fishers can learn from scientists. Combining these two areas of expertise,
managers can be given the tools to develop functional, effective and locally targeted management plans. I strongly
believe that the only way fishery problems can be solved is by government and fishers working together”
(Government).
One NGO key informant expressed concern for impediments to collaboration including issues raised by key
informants in the fishery sector:
“Fishers can and should be more involved in decision making processes regarding fisheries management. However,
sometimes it is difficult for fishers to participate as the process becomes too bureaucratic; the way information is
conveyed to them is too complex or it gets to them too late in the process and they cannot effectively participate
in solving fishery problems. Other times the fishers do not want to participate as they don’t trust the authorities in
charge of management” (NGO).
Words used by key informants to describe the relationship between fishers and the government agencies
involved in decision making in the fishery sector include distant, skeptical, strained, polite, harsh, hostile,
complicated, untrustworthy, unreliable, politicized, and unbalanced. Key informants explained that there is lack
of communication and understanding between the two parties:
“Fishers distrust fishery managers/decision makers. They feel like any action managers make is to prevent them
from fishing and hence leave them without jobs. They don’t understand or don’t want to understand that
regulations need to be in place in order to have a sustainable fishery in the future. While managers don’t put much
effort on informing, educating and engaging fishers on the issues being discussed” (NGO).
Key informants expressed their opinion on whether or not they perceived the fishery management process in
Puerto Rico to be fair. While many had mixed opinions most in the fishery sector perceived decisions as unfair:
20
“So many laws against fishing. Now to fish for different species you need to pay for licenses. It’s the law, you can’t
catch them. They don’t give you warnings, like tickets, they fine, they want to wash you away” (Fishery).
“They are not fair because the fishers are not involved in the decisions” (Fishery).
Other key informants expressed different opinions:
“The goal is to restore fish populations and in order to do that we can’t afford to focus on fishers’ incomes. We
have to reduce effort” (Government).
“It cannot be fair. The system is designed to either cut fishers or cut fish” (Research).
One key informant reflected on the impacts that distrust and conflict between fishers and managers can have on
the fishery management process:
“I think one of the biggest problems in fisheries is precisely that conflicts between fishers and managers are not
effectively resolved which turns into distrust from the fishers towards the system and in a lot of cases they violate
the regulations” (NGO).
Views of key informants on strategies to improve the relationship and resolve conflict between fishers and
government and other parties involved in fisheries management in Puerto Rico can be categorized as strategies
to improve communication. As summarized by one key informant:
“When the fishers know the fishery managers directly and can discuss reasons why the policies or decisions are
made is when I see less conflicts and disputes with these two groups” (NGO).
Surveys with Fishers
Characteristics of the Sample
The average age of the fishers surveyed was 50.5 years and the average education level measured in years of
formal education was 9 years. The majority of fishers (72%, N=152) were married and had an average household
size of 3. Fishers had on average 36 years of fishing experience (Table 2).
Table 2. Descriptive statistics of demographic variables.
Variable N Min Max Mean St. Dev.
Age 212 18 88 50.46 13.962 Education 210* 0 18 9.13 3.721 Household size 212 1 7 3.01 1.372 Fishing experience 212 2 80 35.92 16.067
*Different sample size due to missing data
Table 3 displays descriptive statistics for demographic variables by region. Statistically significant differences
were observed for comparisons between the different regions for all demographic variables except for fishing
experience (Table 4).
21
Table 3. Descriptive statistics of demographic variables by region.
Region Variable N Minimum Maximum Mean St. Dev.
East Coast Age 54 23 79 52.43 14.766 Education 54 0 18 8.70 4.133 Household size 54 1 7 2.78 1.462 Fishing Experience 54 4 72 36.67 18.306
Southeast Coast Age 28 18 74 48.96 15.695 Education 28 6.00 16.00 8.5000 3.71683 Household size 28 1 5 2.43 1.230 Fishing Experience 28 7 64 34.21 15.885
Northeast Coast Age 42 21 88 54.76 13.709 Education 40 6.00 18.00 11.7000 3.18812 Household size 42 1 6 2.79 1.298 Fishing Experience 42 7 80 40.38 16.645
Southwest Coast Age 88 23 74 47.67 12.451 Education 88 0.00 14.00 8.4318 3.20128 Household size 88 1 6 3.45 1.277 Fishing Experience 88 2 62 33.88 14.069
Table 4. ANOVA comparing demographic variables between regions.
Variable Sum of Squares df Mean Square F p
Age 1733.388 3 577.796 3.050 .030
Education 328.016 3 109.339 8.777 .000
Household size 31.877 3 10.626 6.054 .001
Fishing experience 1315.393 3 438.464 1.716 .165
Post-hoc analyses show that age was statistically significantly different only between the Northeast and the
Southwest coasts with the former presenting a higher average age (54.8) than the later (47.7) (Figure 3).
Figure 3. Regional comparison of fishers’ average age in years.
22
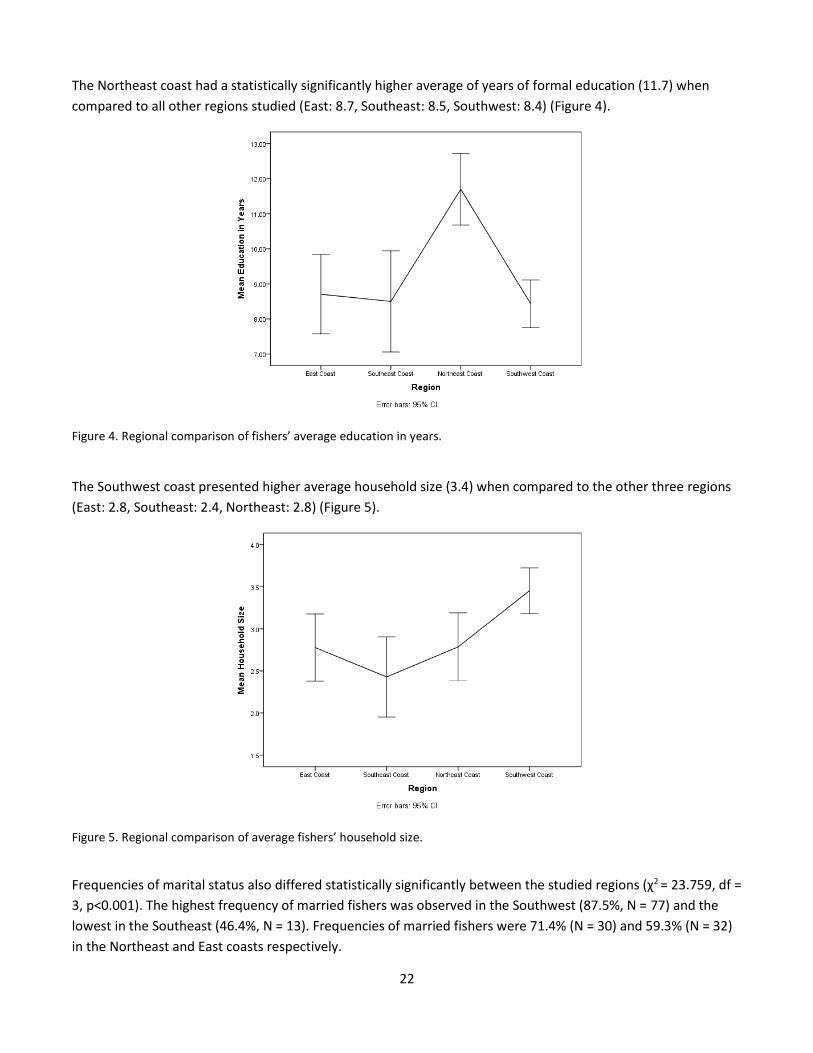
The Northeast coast had a statistically significantly higher average of years of formal education (11.7) when
compared to all other regions studied (East: 8.7, Southeast: 8.5, Southwest: 8.4) (Figure 4).
Figure 4. Regional comparison of fishers’ average education in years.
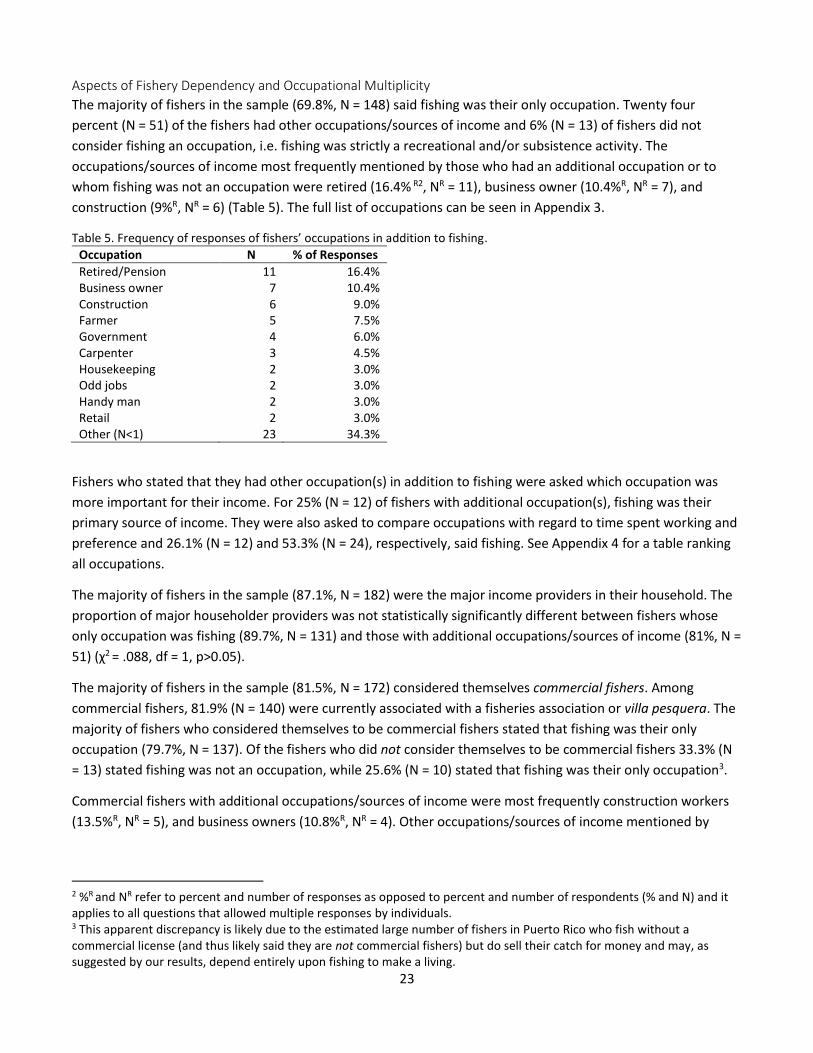
The Southwest coast presented higher average household size (3.4) when compared to the other three regions
(East: 2.8, Southeast: 2.4, Northeast: 2.8) (Figure 5).
Figure 5. Regional comparison of average fishers’ household size.
Frequencies of marital status also differed statistically significantly between the studied regions (χ2 = 23.759, df =
3, p<0.001). The highest frequency of married fishers was observed in the Southwest (87.5%, N = 77) and the
lowest in the Southeast (46.4%, N = 13). Frequencies of married fishers were 71.4% (N = 30) and 59.3% (N = 32)
in the Northeast and East coasts respectively.
23
Aspects of Fishery Dependency and Occupational Multiplicity
The majority of fishers in the sample (69.8%, N = 148) said fishing was their only occupation. Twenty four
percent (N = 51) of the fishers had other occupations/sources of income and 6% (N = 13) of fishers did not
consider fishing an occupation, i.e. fishing was strictly a recreational and/or subsistence activity. The
occupations/sources of income most frequently mentioned by those who had an additional occupation or to
whom fishing was not an occupation were retired (16.4% R2, NR = 11), business owner (10.4%R, NR = 7), and
construction (9%R, NR = 6) (Table 5). The full list of occupations can be seen in Appendix 3.
Table 5. Frequency of responses of fishers’ occupations in addition to fishing.
Occupation N % of Responses
Retired/Pension 11 16.4% Business owner 7 10.4% Construction 6 9.0% Farmer 5 7.5% Government 4 6.0% Carpenter 3 4.5% Housekeeping 2 3.0% Odd jobs 2 3.0% Handy man 2 3.0% Retail 2 3.0% Other (N<1) 23 34.3%
Fishers who stated that they had other occupation(s) in addition to fishing were asked which occupation was
more important for their income. For 25% (N = 12) of fishers with additional occupation(s), fishing was their
primary source of income. They were also asked to compare occupations with regard to time spent working and
preference and 26.1% (N = 12) and 53.3% (N = 24), respectively, said fishing. See Appendix 4 for a table ranking
all occupations.
The majority of fishers in the sample (87.1%, N = 182) were the major income providers in their household. The
proportion of major householder providers was not statistically significantly different between fishers whose
only occupation was fishing (89.7%, N = 131) and those with additional occupations/sources of income (81%, N =
51) (χ2 = .088, df = 1, p>0.05).
The majority of fishers in the sample (81.5%, N = 172) considered themselves commercial fishers. Among
commercial fishers, 81.9% (N = 140) were currently associated with a fisheries association or villa pesquera. The
majority of fishers who considered themselves to be commercial fishers stated that fishing was their only
occupation (79.7%, N = 137). Of the fishers who did not consider themselves to be commercial fishers 33.3% (N
= 13) stated fishing was not an occupation, while 25.6% (N = 10) stated that fishing was their only occupation3.
Commercial fishers with additional occupations/sources of income were most frequently construction workers
(13.5%R, NR = 5), and business owners (10.8%R, NR = 4). Other occupations/sources of income mentioned by
2 %R and NR refer to percent and number of responses as opposed to percent and number of respondents (% and N) and it applies to all questions that allowed multiple responses by individuals. 3 This apparent discrepancy is likely due to the estimated large number of fishers in Puerto Rico who fish without a commercial license (and thus likely said they are not commercial fishers) but do sell their catch for money and may, as suggested by our results, depend entirely upon fishing to make a living.

24
more than one commercial fisher (NR = 2, 5.4%R) were retired, housekeeper, carpenter, handy man, and
government worker.
Regional differences were observed with regard to aspects of fishery dependence and occupation multiplicity.
The frequency of fishers with other occupations in addition to fishing differed between the four regions studied
(χ2 = 129.554, df = 6, p<0.001). The greatest difference was observed between the Northeast and the Southwest
coasts. While in the Northeast the majority of fishers either had other occupations/sources of income in
addition to fishing (60%, N = 25) or did not consider fishing to be an occupation (31%, N = 13), in the Southwest
only one fisher stated to have another occupation in addition to fishing. In the East and Southeast coasts the
frequencies of fishers who stated to have other occupations/sources of income in addition to fishing were 26%
(N = 14) and 39% (N = 11) respectively. The only region where fishers surveyed stated fishing was not an
occupation was the Northeast coast.
A regional difference was also observed with regard to the types of occupations/sources of income fishers had in
addition to fishing. In the Northeast coast the most frequently mentioned occupations/sources of income were
business owner (15%R, NR = 4), government worker (11.5%R, NR = 3), and retired (7%R, NR = 2). In the East coast
the most common occupations were construction worker (23.5%R, NR = 4), housekeeper and odd jobs (each with
12%R, NR = 2) and in the Southeast coast the most frequent additional occupation was farmer (36%R, NR = 4). See
Appendix 5 for a complete list of occupations by region.
In the Southwest coast fishing was the only source of income for 98.9% (N = 87) of the fishers surveyed. In the
Northeast 9.5% (N = 4) of the fishers stated fishing was their primary source of income while in the East and
Southeast coasts the frequencies were 74% (N = 40) and 60.7% (N = 17) (Figure 6).
Figure 6. Regional differences with regard to the percentage of fishers for whom fishing was a primary source of income.
While the majority of fishers were the major household providers in all regions, with more than 70% of ‘yes’
responses, in the Southwest and the Southeast coasts frequencies were statistically significantly higher (89%, N
= 85 and 98%, N = 43, respectively, χ2=19.068, df=3, p<0.001) than the Northeast (72.5%, N = 29) and the East
(79.6%, N = 25).
0
10
20
30
40
50
60
70
80
90
100
Southwest East Southeast Northeast
% F
ish
ing
as P
rim
ary
Sou
rce
of
Inco
me
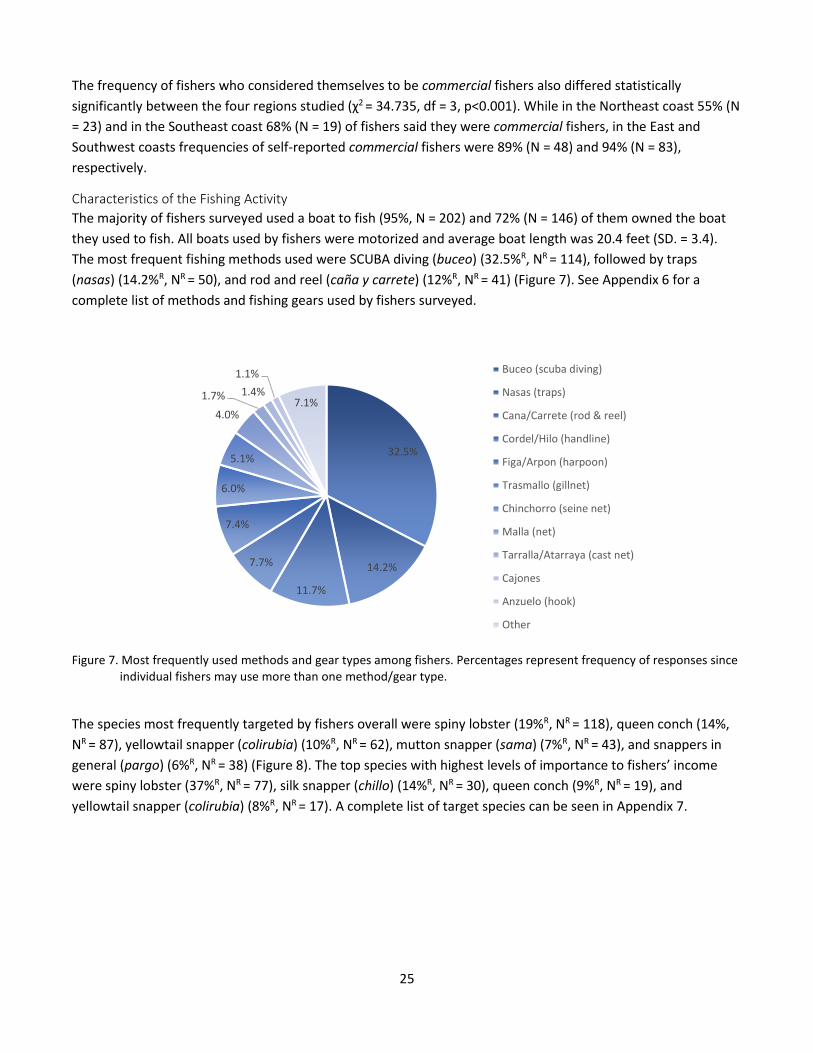
25
The frequency of fishers who considered themselves to be commercial fishers also differed statistically
significantly between the four regions studied (χ2 = 34.735, df = 3, p<0.001). While in the Northeast coast 55% (N
= 23) and in the Southeast coast 68% (N = 19) of fishers said they were commercial fishers, in the East and
Southwest coasts frequencies of self-reported commercial fishers were 89% (N = 48) and 94% (N = 83),
respectively.
Characteristics of the Fishing Activity
The majority of fishers surveyed used a boat to fish (95%, N = 202) and 72% (N = 146) of them owned the boat
they used to fish. All boats used by fishers were motorized and average boat length was 20.4 feet (SD. = 3.4).
The most frequent fishing methods used were SCUBA diving (buceo) (32.5%R, NR = 114), followed by traps
(nasas) (14.2%R, NR = 50), and rod and reel (caña y carrete) (12%R, NR = 41) (Figure 7). See Appendix 6 for a
complete list of methods and fishing gears used by fishers surveyed.
Figure 7. Most frequently used methods and gear types among fishers. Percentages represent frequency of responses since individual fishers may use more than one method/gear type.
The species most frequently targeted by fishers overall were spiny lobster (19%R, NR = 118), queen conch (14%,
NR = 87), yellowtail snapper (colirubia) (10%R, NR = 62), mutton snapper (sama) (7%R, NR = 43), and snappers in
general (pargo) (6%R, NR = 38) (Figure 8). The top species with highest levels of importance to fishers’ income
were spiny lobster (37%R, NR = 77), silk snapper (chillo) (14%R, NR = 30), queen conch (9%R, NR = 19), and
yellowtail snapper (colirubia) (8%R, NR = 17). A complete list of target species can be seen in Appendix 7.
32.5%
14.2%
11.7%
7.7%
7.4%
6.0%
5.1%
4.0%
1.7% 1.4%
1.1%
7.1%
Buceo (scuba diving)
Nasas (traps)
Cana/Carrete (rod & reel)
Cordel/Hilo (handline)
Figa/Arpon (harpoon)
Trasmallo (gillnet)
Chinchorro (seine net)
Malla (net)
Tarralla/Atarraya (cast net)
Cajones
Anzuelo (hook)
Other
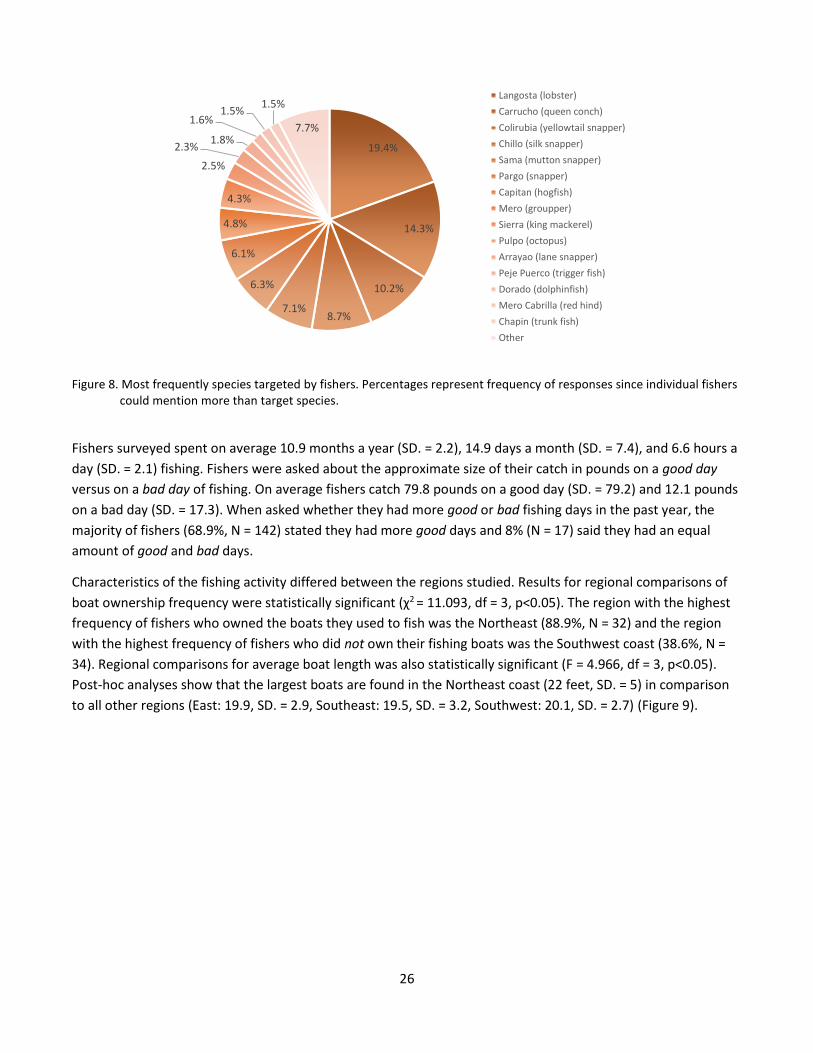
26
Figure 8. Most frequently species targeted by fishers. Percentages represent frequency of responses since individual fishers could mention more than target species.
Fishers surveyed spent on average 10.9 months a year (SD. = 2.2), 14.9 days a month (SD. = 7.4), and 6.6 hours a
day (SD. = 2.1) fishing. Fishers were asked about the approximate size of their catch in pounds on a good day
versus on a bad day of fishing. On average fishers catch 79.8 pounds on a good day (SD. = 79.2) and 12.1 pounds
on a bad day (SD. = 17.3). When asked whether they had more good or bad fishing days in the past year, the
majority of fishers (68.9%, N = 142) stated they had more good days and 8% (N = 17) said they had an equal
amount of good and bad days.
Characteristics of the fishing activity differed between the regions studied. Results for regional comparisons of
boat ownership frequency were statistically significant (χ2 = 11.093, df = 3, p<0.05). The region with the highest
frequency of fishers who owned the boats they used to fish was the Northeast (88.9%, N = 32) and the region
with the highest frequency of fishers who did not own their fishing boats was the Southwest coast (38.6%, N =
34). Regional comparisons for average boat length was also statistically significant (F = 4.966, df = 3, p<0.05).
Post-hoc analyses show that the largest boats are found in the Northeast coast (22 feet, SD. = 5) in comparison
to all other regions (East: 19.9, SD. = 2.9, Southeast: 19.5, SD. = 3.2, Southwest: 20.1, SD. = 2.7) (Figure 9).
19.4%
14.3%
10.2%
8.7%7.1%
6.3%
6.1%
4.8%
4.3%
2.5%
2.3%1.8%
1.6%1.5%
1.5%
7.7%
Langosta (lobster)
Carrucho (queen conch)
Colirubia (yellowtail snapper)
Chillo (silk snapper)
Sama (mutton snapper)
Pargo (snapper)
Capitan (hogfish)
Mero (groupper)
Sierra (king mackerel)
Pulpo (octopus)
Arrayao (lane snapper)
Peje Puerco (trigger fish)
Dorado (dolphinfish)
Mero Cabrilla (red hind)
Chapin (trunk fish)
Other
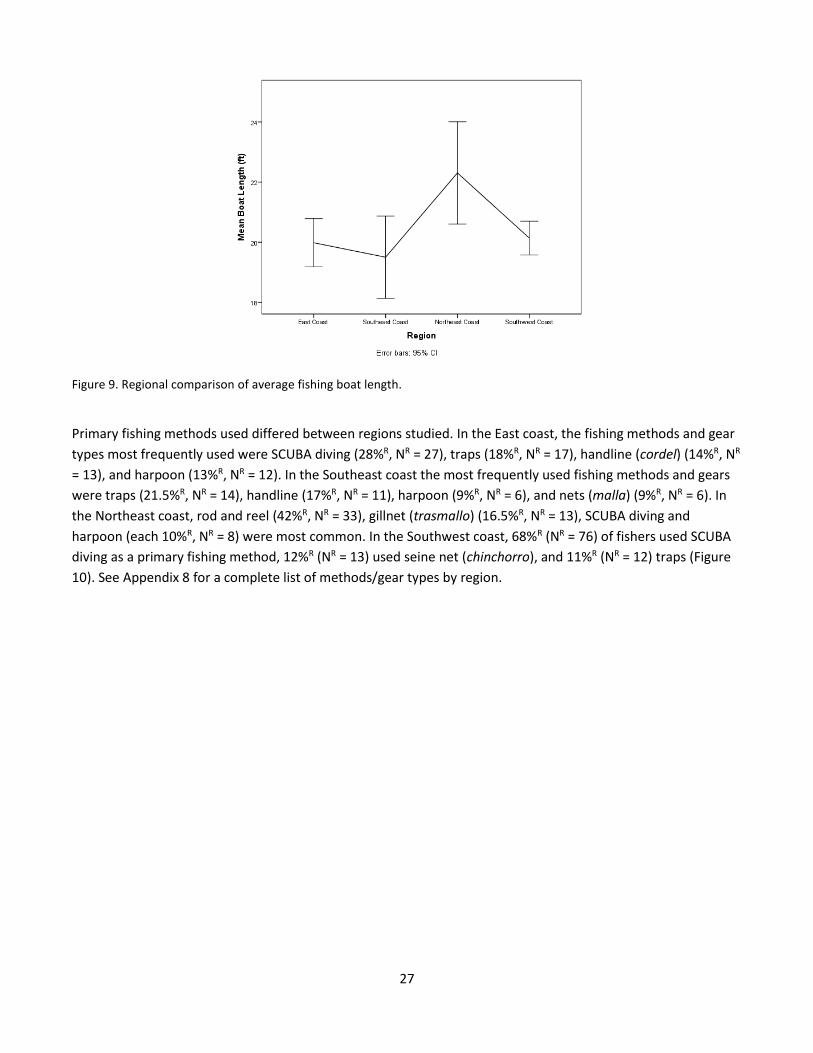
27
Figure 9. Regional comparison of average fishing boat length.
Primary fishing methods used differed between regions studied. In the East coast, the fishing methods and gear
types most frequently used were SCUBA diving (28%R, NR = 27), traps (18%R, NR = 17), handline (cordel) (14%R, NR
= 13), and harpoon (13%R, NR = 12). In the Southeast coast the most frequently used fishing methods and gears
were traps (21.5%R, NR = 14), handline (17%R, NR = 11), harpoon (9%R, NR = 6), and nets (malla) (9%R, NR = 6). In
the Northeast coast, rod and reel (42%R, NR = 33), gillnet (trasmallo) (16.5%R, NR = 13), SCUBA diving and
harpoon (each 10%R, NR = 8) were most common. In the Southwest coast, 68%R (NR = 76) of fishers used SCUBA
diving as a primary fishing method, 12%R (NR = 13) used seine net (chinchorro), and 11%R (NR = 12) traps (Figure
10). See Appendix 8 for a complete list of methods/gear types by region.
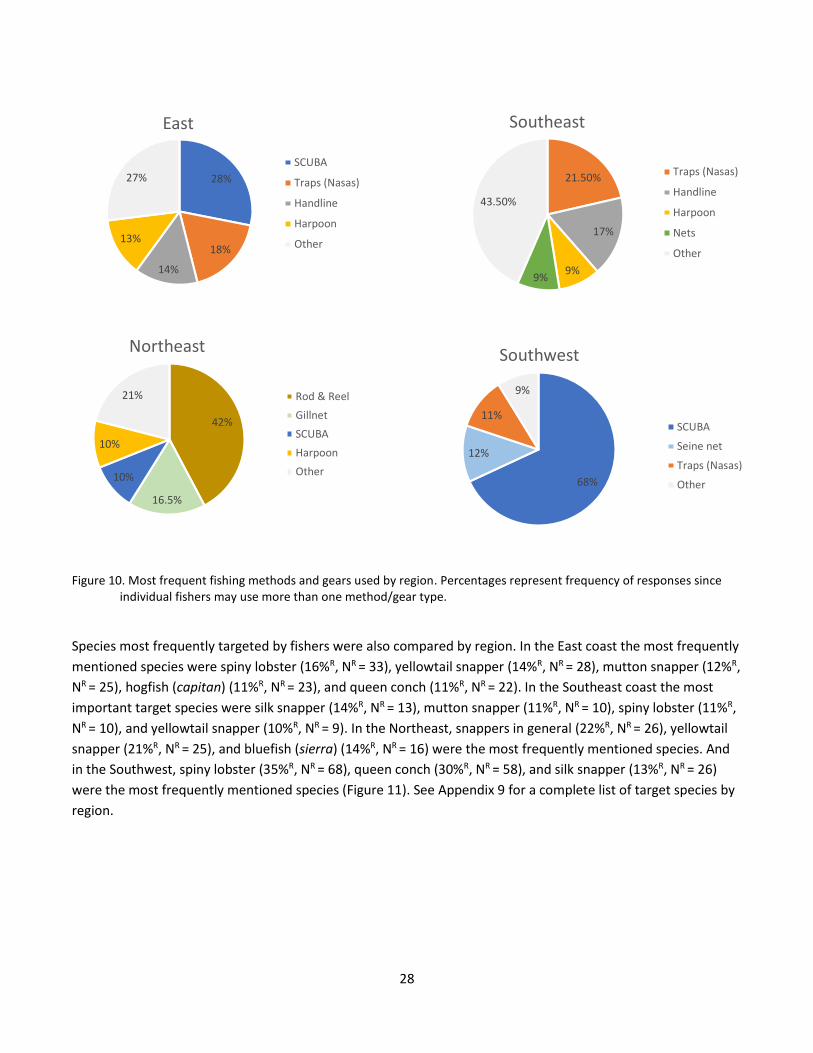
28
Figure 10. Most frequent fishing methods and gears used by region. Percentages represent frequency of responses since individual fishers may use more than one method/gear type.
Species most frequently targeted by fishers were also compared by region. In the East coast the most frequently
mentioned species were spiny lobster (16%R, NR = 33), yellowtail snapper (14%R, NR = 28), mutton snapper (12%R,
NR = 25), hogfish (capitan) (11%R, NR = 23), and queen conch (11%R, NR = 22). In the Southeast coast the most
important target species were silk snapper (14%R, NR = 13), mutton snapper (11%R, NR = 10), spiny lobster (11%R,
NR = 10), and yellowtail snapper (10%R, NR = 9). In the Northeast, snappers in general (22%R, NR = 26), yellowtail
snapper (21%R, NR = 25), and bluefish (sierra) (14%R, NR = 16) were the most frequently mentioned species. And
in the Southwest, spiny lobster (35%R, NR = 68), queen conch (30%R, NR = 58), and silk snapper (13%R, NR = 26)
were the most frequently mentioned species (Figure 11). See Appendix 9 for a complete list of target species by
region.
21.50%
17%
9%9%
43.50%
Southeast
Traps (Nasas)
Handline
Harpoon
Nets
Other
28%
18%
14%
13%
27%
East
SCUBA
Traps (Nasas)
Handline
Harpoon
Other
42%
16.5%
10%
10%
21%
Northeast
Rod & Reel
Gillnet
SCUBA
Harpoon
Other68%
12%
11%
9%
Southwest
SCUBA
Seine net
Traps (Nasas)
Other

29
Figure 11. Most frequent target species by region. Percentages represent frequency of responses since individual fishers may use more than one method/gear type.
Target species were also compared by region for species most frequently mentioned as the most important for
fishers’ incomes. In the East coast the top species were spiny lobster (28%R, NR = 15), queen conch (22%R, NR =
12), and yellowtail snapper (18.5%R, NR = 10). In the Southeast coast the top species contributing to fishers’
incomes were silk snapper (32%R, NR = 9), queen conch, lane snapper (arrayao) and whitemouth croaker
(corvino) (each at 11%R, NR = 3). In the Northeast the most valuable species were snappers in general (32%R, NR =
13), and bluefish and yellowtail snapper (each at 17%R, NR = 7). In the Southwest the top species most frequently
mentioned as the most important for fishers’ income were spiny lobster (67%R, NR = 58) and silk snapper (21%R,
NR = 18).
Regional comparisons regarding fishing effort in terms of months a year, days a month, and hours a day fishing
were all statistically significant (Table 6).
Table 6. ANOVA comparing fishing effort between regions.
Fishing Effort Sum of Squares df Mean Square F p
Months/Year 539.389 3 179.796 85.069 .000 Days/Month 2495.454 3 831.818 19.074 .000 Hours/Day 267.552 3 89.184 26.920 .000
16%
14%
12%
11%11%
36%
East Spiny lobster
Yellowtail snapper(colirubia)Mutton snapper (sama)
Hogfish (capitan)
Queen conch
Other
14%
11%
11%
10%
54%
Southeast
Silk snapper (chillo)
Mutton snapper (sama)
Spiny lobster
Yellowtail snapper(colirubia)
Other
22%
21%
14%
43%
Northeast
Snapper (pargo)
Yellowtail snapper(colirubia)
Bluefish (sierra)
Other
35%
30%
13%
22%
Southwest
Spiny lobster
Queen conch
Silk snapper (chillo)
Other
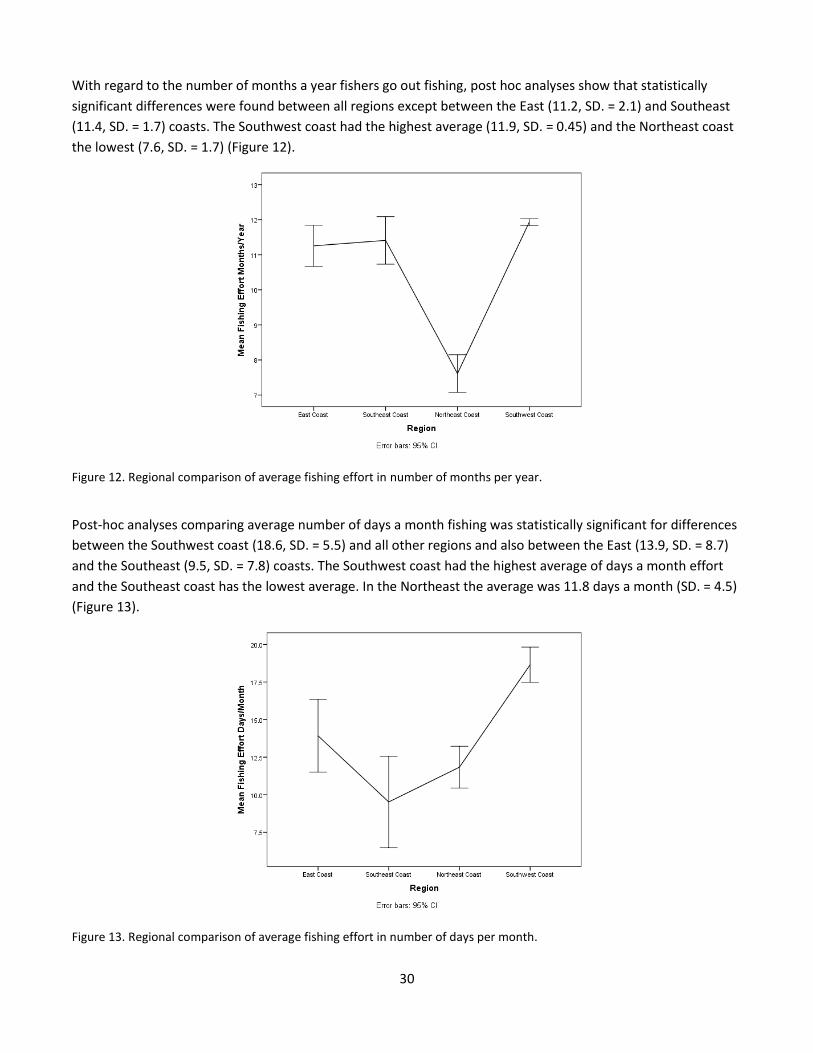
30
With regard to the number of months a year fishers go out fishing, post hoc analyses show that statistically
significant differences were found between all regions except between the East (11.2, SD. = 2.1) and Southeast
(11.4, SD. = 1.7) coasts. The Southwest coast had the highest average (11.9, SD. = 0.45) and the Northeast coast
the lowest (7.6, SD. = 1.7) (Figure 12).
Figure 12. Regional comparison of average fishing effort in number of months per year.
Post-hoc analyses comparing average number of days a month fishing was statistically significant for differences
between the Southwest coast (18.6, SD. = 5.5) and all other regions and also between the East (13.9, SD. = 8.7)
and the Southeast (9.5, SD. = 7.8) coasts. The Southwest coast had the highest average of days a month effort
and the Southeast coast has the lowest average. In the Northeast the average was 11.8 days a month (SD. = 4.5)
(Figure 13).
Figure 13. Regional comparison of average fishing effort in number of days per month.

31
Post-hoc analyses of fishing effort in terms of hours a day spent fishing was statistically significant for
comparisons between all regions except when the East (6.7, SD. = 2.1) and Southeast (6.9, SD. = 1.6) coasts were
compared. The highest average for hours spent fishing a day was found in the Northeast (8.5, SD. = 2.7) and the
lowest average was found in the Southwest (5.4, SD. = 0.95) (Figure 14).
Figure 14. Regional comparison of average fishing effort in hours per day.
Analysis of variance (ANOVA) comparing the approximate amount fishers reported catching on a good day and
on a bad day by region were statistically significant. Post-hoc analysis of the amount caught on a good day show
that differences are found between the Southwest coast (50.4, SD. = 20.9) and all other regions except for the
Northeast (82.6, SD. = 57.5). The lowest average was found in the Southwest coast and the highest in the
Southeast (115.7, SD. = 105.5). Analysis for amount caught on a bad day shows statistically significant
differences between the Southwest coast (4.8, SD. = 4.5) and all other regions. The Southwest coast had the
lowest average while the East coast had the highest average of pounds landed on a bad day (20 lb, SD. = 26).
Averages in the Northeast and Southeast were 14.1 (SD. = 17.3) and 16.2 (SD. = 12.7) respectively (Figure 15).
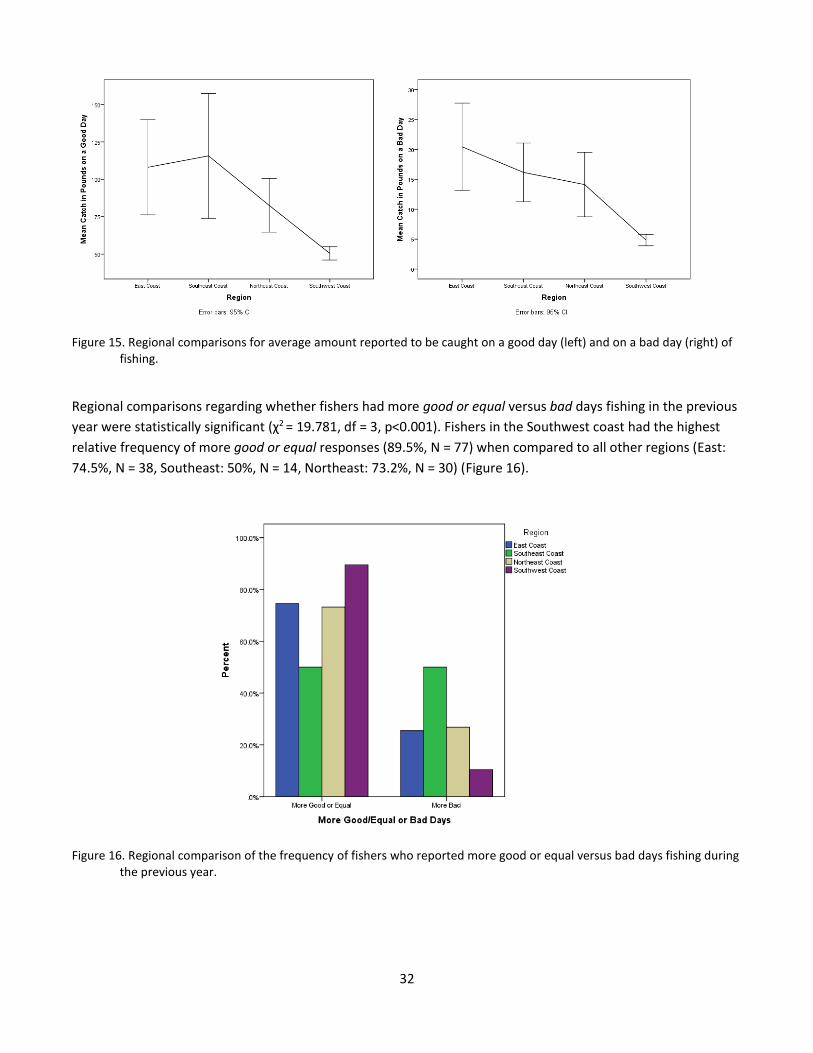
32
Figure 15. Regional comparisons for average amount reported to be caught on a good day (left) and on a bad day (right) of fishing.
Regional comparisons regarding whether fishers had more good or equal versus bad days fishing in the previous
year were statistically significant (χ2 = 19.781, df = 3, p<0.001). Fishers in the Southwest coast had the highest
relative frequency of more good or equal responses (89.5%, N = 77) when compared to all other regions (East:
74.5%, N = 38, Southeast: 50%, N = 14, Northeast: 73.2%, N = 30) (Figure 16).
Figure 16. Regional comparison of the frequency of fishers who reported more good or equal versus bad days fishing during the previous year.
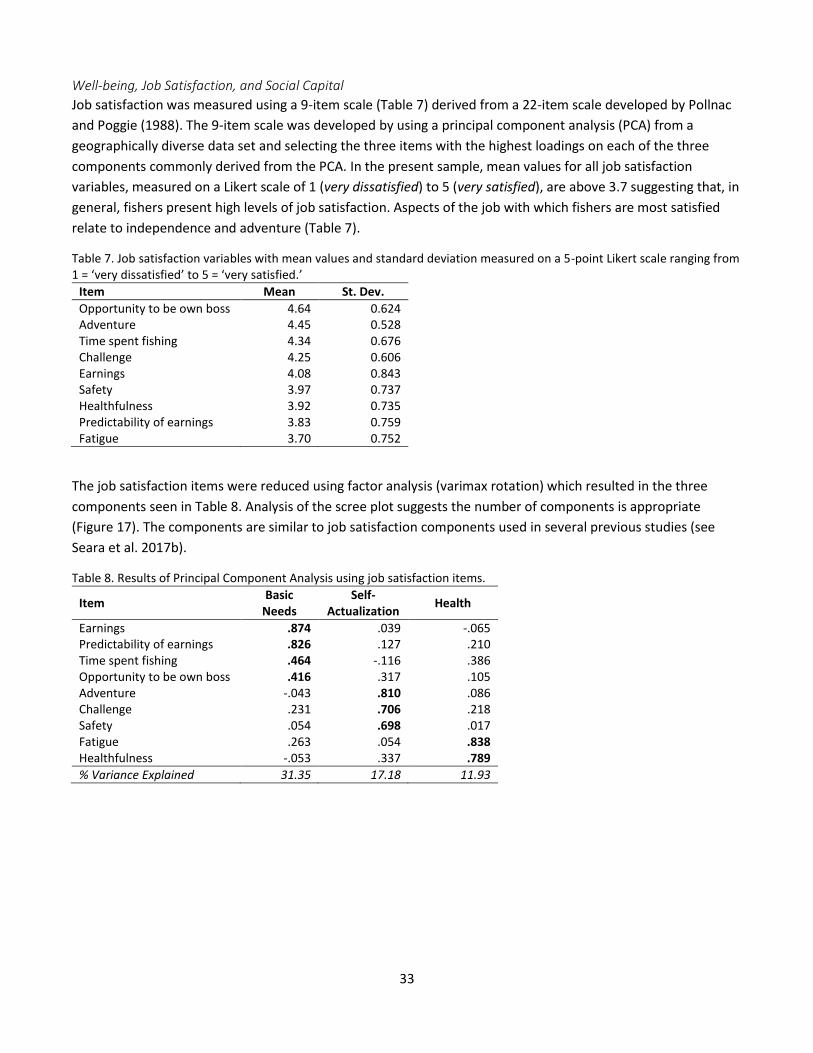
33
Well-being, Job Satisfaction, and Social Capital
Job satisfaction was measured using a 9-item scale (Table 7) derived from a 22-item scale developed by Pollnac
and Poggie (1988). The 9-item scale was developed by using a principal component analysis (PCA) from a
geographically diverse data set and selecting the three items with the highest loadings on each of the three
components commonly derived from the PCA. In the present sample, mean values for all job satisfaction
variables, measured on a Likert scale of 1 (very dissatisfied) to 5 (very satisfied), are above 3.7 suggesting that, in
general, fishers present high levels of job satisfaction. Aspects of the job with which fishers are most satisfied
relate to independence and adventure (Table 7).
Table 7. Job satisfaction variables with mean values and standard deviation measured on a 5-point Likert scale ranging from 1 = ‘very dissatisfied’ to 5 = ‘very satisfied.’
Item Mean St. Dev.
Opportunity to be own boss 4.64 0.624 Adventure 4.45 0.528 Time spent fishing 4.34 0.676 Challenge 4.25 0.606 Earnings 4.08 0.843 Safety 3.97 0.737 Healthfulness 3.92 0.735 Predictability of earnings 3.83 0.759 Fatigue 3.70 0.752
The job satisfaction items were reduced using factor analysis (varimax rotation) which resulted in the three
components seen in Table 8. Analysis of the scree plot suggests the number of components is appropriate
(Figure 17). The components are similar to job satisfaction components used in several previous studies (see
Seara et al. 2017b).
Table 8. Results of Principal Component Analysis using job satisfaction items.
Item Basic
Needs Self-
Actualization Health
Earnings .874 .039 -.065 Predictability of earnings .826 .127 .210 Time spent fishing .464 -.116 .386 Opportunity to be own boss .416 .317 .105 Adventure -.043 .810 .086 Challenge .231 .706 .218 Safety .054 .698 .017 Fatigue .263 .054 .838 Healthfulness -.053 .337 .789
% Variance Explained 31.35 17.18 11.93
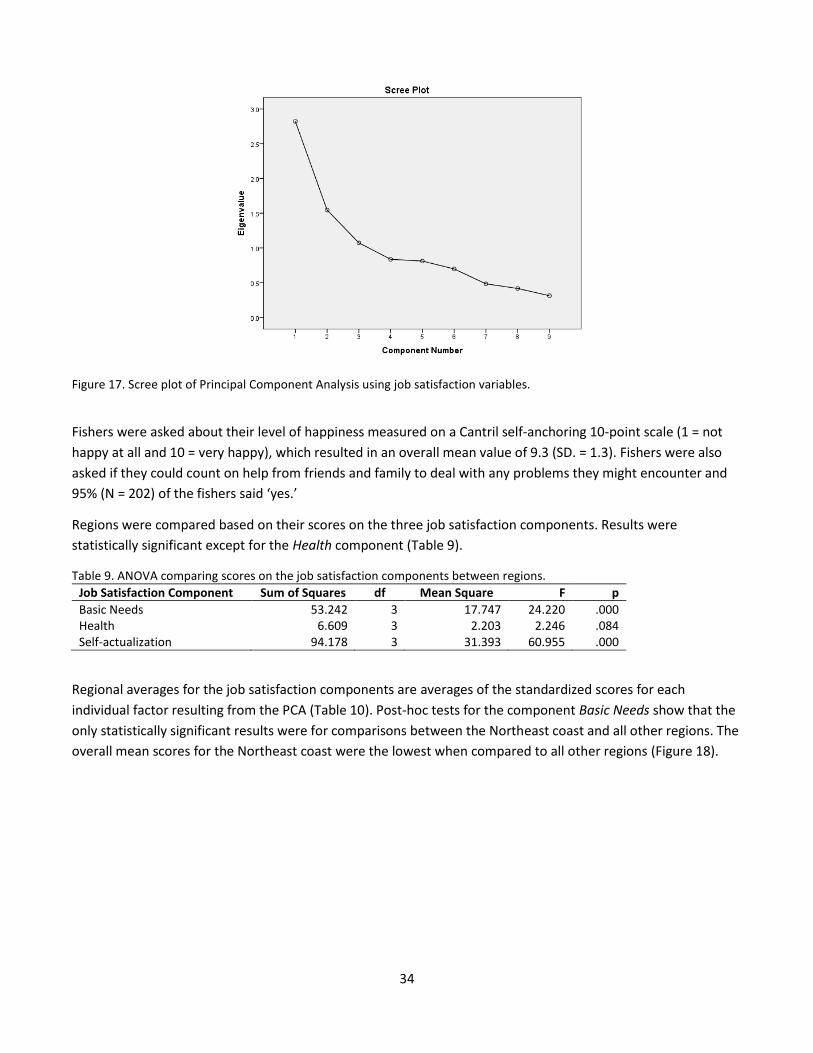
34
Figure 17. Scree plot of Principal Component Analysis using job satisfaction variables.
Fishers were asked about their level of happiness measured on a Cantril self-anchoring 10-point scale (1 = not
happy at all and 10 = very happy), which resulted in an overall mean value of 9.3 (SD. = 1.3). Fishers were also
asked if they could count on help from friends and family to deal with any problems they might encounter and
95% (N = 202) of the fishers said ‘yes.’
Regions were compared based on their scores on the three job satisfaction components. Results were
statistically significant except for the Health component (Table 9).
Table 9. ANOVA comparing scores on the job satisfaction components between regions.
Job Satisfaction Component Sum of Squares df Mean Square F p
Basic Needs 53.242 3 17.747 24.220 .000 Health 6.609 3 2.203 2.246 .084 Self-actualization 94.178 3 31.393 60.955 .000
Regional averages for the job satisfaction components are averages of the standardized scores for each
individual factor resulting from the PCA (Table 10). Post-hoc tests for the component Basic Needs show that the
only statistically significant results were for comparisons between the Northeast coast and all other regions. The
overall mean scores for the Northeast coast were the lowest when compared to all other regions (Figure 18).
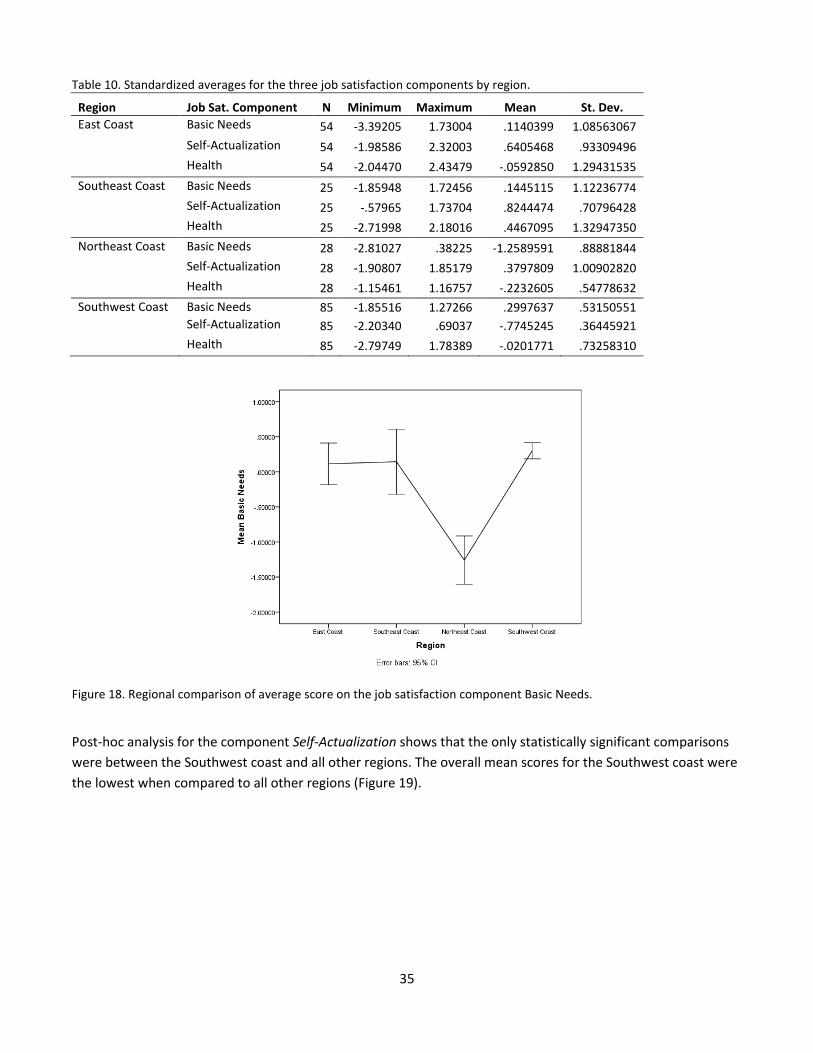
35
Table 10. Standardized averages for the three job satisfaction components by region.
Region Job Sat. Component N Minimum Maximum Mean St. Dev.
East Coast Basic Needs 54 -3.39205 1.73004 .1140399 1.08563067
Self-Actualization 54 -1.98586 2.32003 .6405468 .93309496
Health 54 -2.04470 2.43479 -.0592850 1.29431535
Southeast Coast Basic Needs 25 -1.85948 1.72456 .1445115 1.12236774
Self-Actualization 25 -.57965 1.73704 .8244474 .70796428
Health 25 -2.71998 2.18016 .4467095 1.32947350
Northeast Coast Basic Needs 28 -2.81027 .38225 -1.2589591 .88881844
Self-Actualization 28 -1.90807 1.85179 .3797809 1.00902820
Health 28 -1.15461 1.16757 -.2232605 .54778632
Southwest Coast Basic Needs 85 -1.85516 1.27266 .2997637 .53150551
Self-Actualization 85 -2.20340 .69037 -.7745245 .36445921
Health 85 -2.79749 1.78389 -.0201771 .73258310
Figure 18. Regional comparison of average score on the job satisfaction component Basic Needs.
Post-hoc analysis for the component Self-Actualization shows that the only statistically significant comparisons
were between the Southwest coast and all other regions. The overall mean scores for the Southwest coast were
the lowest when compared to all other regions (Figure 19).
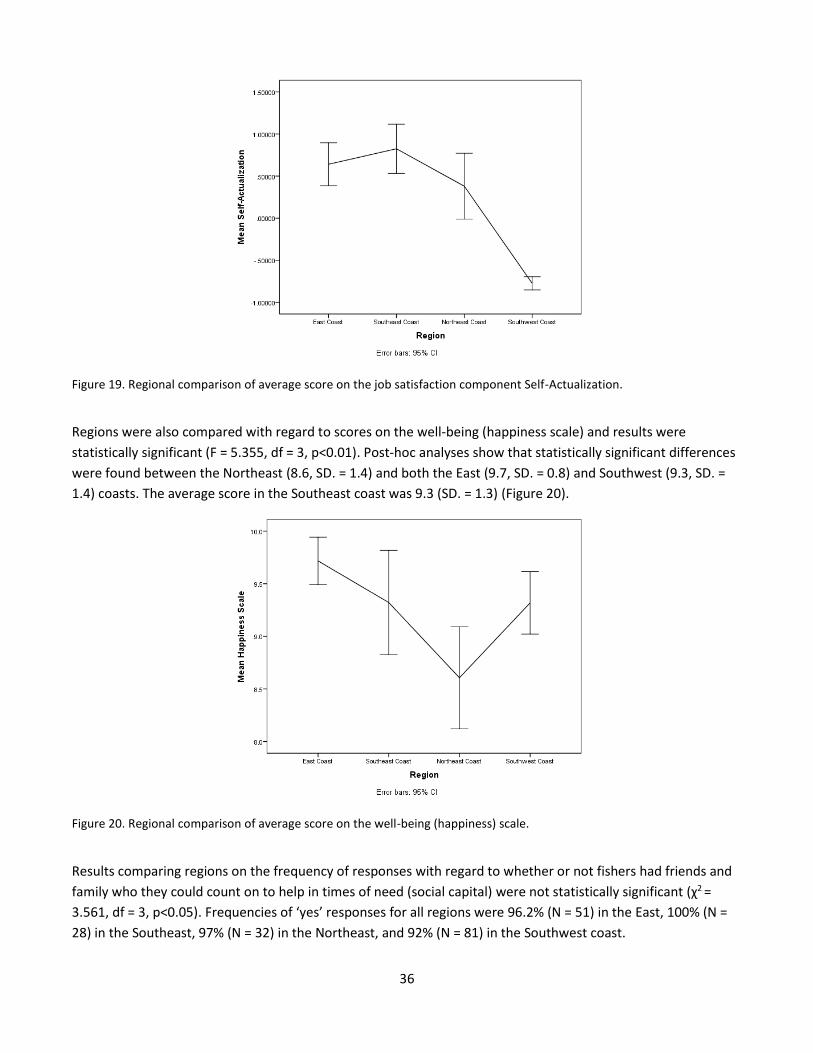
36
Figure 19. Regional comparison of average score on the job satisfaction component Self-Actualization.
Regions were also compared with regard to scores on the well-being (happiness scale) and results were
statistically significant (F = 5.355, df = 3, p<0.01). Post-hoc analyses show that statistically significant differences
were found between the Northeast (8.6, SD. = 1.4) and both the East (9.7, SD. = 0.8) and Southwest (9.3, SD. =
1.4) coasts. The average score in the Southeast coast was 9.3 (SD. = 1.3) (Figure 20).
Figure 20. Regional comparison of average score on the well-being (happiness) scale.
Results comparing regions on the frequency of responses with regard to whether or not fishers had friends and
family who they could count on to help in times of need (social capital) were not statistically significant (χ2 =
3.561, df = 3, p<0.05). Frequencies of ‘yes’ responses for all regions were 96.2% (N = 51) in the East, 100% (N =
28) in the Southeast, 97% (N = 32) in the Northeast, and 92% (N = 81) in the Southwest coast.

37
Perceptions of the Health of Fishery Resources and Environmental Awareness
Results indicate that, in general, fishers perceive the fishery resources in Puerto Rico to be healthy. On a scale of
1 (very bad) to 5 (very good), responses on the status of fishery resources averaged 3.51 (SD. = 0.84), with 57.9%
(N = 122) of the fishers indicating resources to be in good or in very good shape (Table 11). When asked if
resources are currently in worse, equal, or better shape (scale of 1 to 3) when compared to 10 years ago, the
average was 1.70 (SD. = 0.63), with 51.7% (N = 109) of the fishers stating resources are equal and 39.3% (N = 83)
stating they are worse. The most frequent reasons stated by fishers for resources to have worsened during the
past decade belong to the following topics: pollution (40.4%R, NR = 42), overexploitation (19.2%R, NR = 20),
changes in climate (15.4%R, NR = 16), government regulations (6.7%R NR = 7), and environmental degradation
(5.9%R, NR = 6). See Appendix 10 for a detailed list of responses.
Table 11. Fishers perceptions on the current status of fishery resources asked on a Likert scale ranging from 1 = ‘in very bad shape’ to 5 = ‘in very good shape.’
Status of Fishery Resources N %
In very bad shape 0 0.0 In bad shape 31 14.7 In neither good nor bad shape 58 27.5 In good shape 106 50.2 In very good shape 16 7.6 Total 211 100.0
A list of 10 items (Table 12) were used to assess aspects of environmental awareness among fishers by asking
their level of agreement with each item on a 5-point Likert scale ranging from 1 (strongly disagree) to 5 (strongly
agree), reversed for negatively worded items. Mean scores were above three for all items with the exception of
the item concerning whether or not fishers agreed that the presence of houses near the coast had an effect on
the fishery. Items with the highest scores concerned the need to take care of the land and sea to safeguard
sustainability and the impacts of coral death on fishing (see Table 12 for all mean scores). A Total Environmental
Awareness scale ranging from 10 to 50 was created by summing up the responses to all 10 items.
Table 12. Environmental awareness variables with mean values and standard deviation measured on a 5-point Likert scale ranging from 1 = ‘strongly disagree’ to 5 = ‘strongly agree’ except for items marked with an asterisk for which scale was reversed.
Item Mean St. Dev.
We have to take care of the land and the sea or they will not provide for us in the future. 4.43 .496 If the corals die it will make a difference for fishing. 4.41 .628 If our community works together we will be able to protect our resources 4.23 .704 Tourism around/near the coast can have an effect on the fish. 3.38 1.105 Agriculture around/near the coast can have an effect on the fish. 3.11 1.036 Industry around/near the coast can have an effect on the fish. 4.04 .897 Houses around/near the coast can have an effect on the fish. 2.91 1.142 *If we throw our garbage on the beach, the ocean takes it away and it causes no harm. 4.34 .848 Unless mangroves are protected we will not have any fish to catch. 4.17 .766 *There are so many fish in the ocean that no matter how many we catch, there will always be enough for our needs.
3.44 1.255
Regional analysis of variance comparing fishers’ perspectives on both the status of fishery resources and change
in the state of resources in the past decade (Table 13) were statistically significant (Table 14).
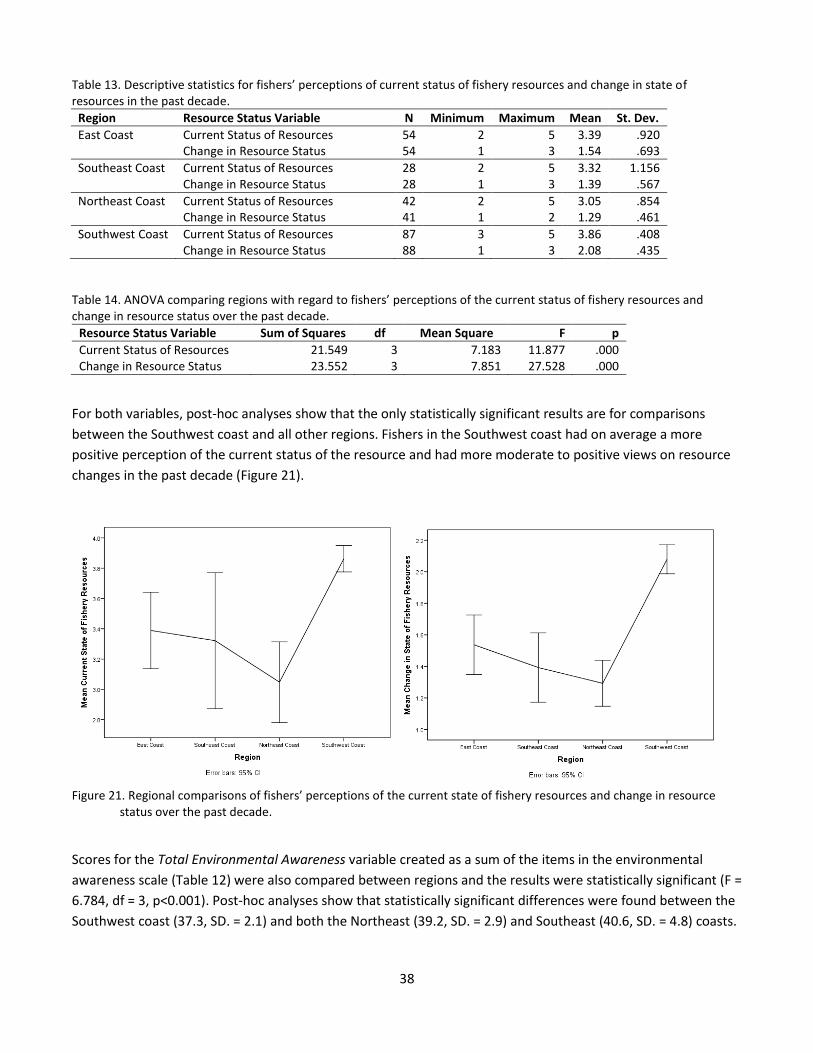
38
Table 13. Descriptive statistics for fishers’ perceptions of current status of fishery resources and change in state of resources in the past decade.
Region Resource Status Variable N Minimum Maximum Mean St. Dev.
East Coast Current Status of Resources 54 2 5 3.39 .920 Change in Resource Status 54 1 3 1.54 .693
Southeast Coast Current Status of Resources 28 2 5 3.32 1.156 Change in Resource Status 28 1 3 1.39 .567
Northeast Coast Current Status of Resources 42 2 5 3.05 .854 Change in Resource Status 41 1 2 1.29 .461
Southwest Coast Current Status of Resources 87 3 5 3.86 .408 Change in Resource Status 88 1 3 2.08 .435
Table 14. ANOVA comparing regions with regard to fishers’ perceptions of the current status of fishery resources and change in resource status over the past decade.
Resource Status Variable Sum of Squares df Mean Square F p
Current Status of Resources 21.549 3 7.183 11.877 .000 Change in Resource Status 23.552 3 7.851 27.528 .000
For both variables, post-hoc analyses show that the only statistically significant results are for comparisons
between the Southwest coast and all other regions. Fishers in the Southwest coast had on average a more
positive perception of the current status of the resource and had more moderate to positive views on resource
changes in the past decade (Figure 21).
Figure 21. Regional comparisons of fishers’ perceptions of the current state of fishery resources and change in resource status over the past decade.
Scores for the Total Environmental Awareness variable created as a sum of the items in the environmental
awareness scale (Table 12) were also compared between regions and the results were statistically significant (F =
6.784, df = 3, p<0.001). Post-hoc analyses show that statistically significant differences were found between the
Southwest coast (37.3, SD. = 2.1) and both the Northeast (39.2, SD. = 2.9) and Southeast (40.6, SD. = 4.8) coasts.
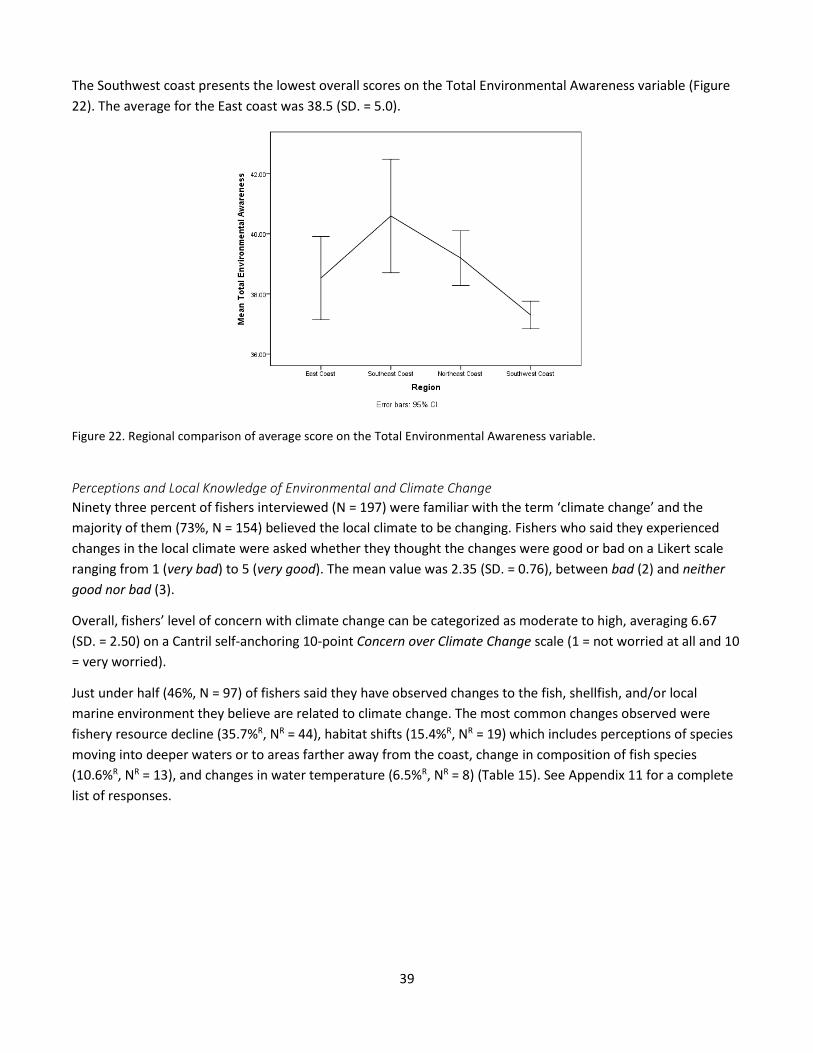
39
The Southwest coast presents the lowest overall scores on the Total Environmental Awareness variable (Figure
22). The average for the East coast was 38.5 (SD. = 5.0).
Figure 22. Regional comparison of average score on the Total Environmental Awareness variable.
Perceptions and Local Knowledge of Environmental and Climate Change
Ninety three percent of fishers interviewed (N = 197) were familiar with the term ‘climate change’ and the
majority of them (73%, N = 154) believed the local climate to be changing. Fishers who said they experienced
changes in the local climate were asked whether they thought the changes were good or bad on a Likert scale
ranging from 1 (very bad) to 5 (very good). The mean value was 2.35 (SD. = 0.76), between bad (2) and neither
good nor bad (3).
Overall, fishers’ level of concern with climate change can be categorized as moderate to high, averaging 6.67
(SD. = 2.50) on a Cantril self-anchoring 10-point Concern over Climate Change scale (1 = not worried at all and 10
= very worried).
Just under half (46%, N = 97) of fishers said they have observed changes to the fish, shellfish, and/or local
marine environment they believe are related to climate change. The most common changes observed were
fishery resource decline (35.7%R, NR = 44), habitat shifts (15.4%R, NR = 19) which includes perceptions of species
moving into deeper waters or to areas farther away from the coast, change in composition of fish species
(10.6%R, NR = 13), and changes in water temperature (6.5%R, NR = 8) (Table 15). See Appendix 11 for a complete
list of responses.

40
Table 15. Frequencies of fisher’s’ responses regarding changes observed in the marine environment as a result of climate change.
Changes NR %R
Fishery resource decline 44 35.70% Habitat shifts 19 15.40% Change in composition of fish species 13 10.6% Change in water temperature 8 6.5% Increased fishing effort 7 5.70% Invasive species 6 4.80% More bad weather conditions 4 3.3% Dead/Bleached Corals 4 3.30% Change in currents 3 2.4% Other (<2%) 15 12.34%
Fishers who said they have noticed changes in the marine environment they believed to be a result of climate
change were asked if they had to change any aspects of their fishing activity to adapt to the changes observed.
The majority (62.5%, N = 60) said ‘yes.’ The most frequent adaptations mentioned by fishers were changing
fishing grounds (42.5%R, NR = 34), gear changes (15%R, NR = 12), and fishing in deeper waters (11.3%R, NR = 9) and
farther away from shore (8.8%R, NR = 7) (Table 16). See Appendix 12 for a complete list of responses.
Table 16. Adaptations strategies adopted by fishers in response to changes observed in marine resource and environment.
Adaptation strategy N R %R
Change fishing grounds 34 42.5
Change/Diversify gear 12 15.0
Fish in deeper water 9 11.3
Fish farther away from shore 7 8.8
Change time of day to fish 4 5.0
Change target species 3 3.8
Use better equipment/Technology 2 2.5
Increase effort 2 2.5
Other (N<1) 5 8.8
The majority of fishers (81%, N = 170) said they were not familiar with any regulations in Puerto Rico to address
climate change. Regulations most frequently mentioned by fishers include laws to address pollution (41.3%R, NR
= 19) and fishery closures (39.1%R, NR = 18). Fishers who stated they were aware of regulations to address
climate change impacts in Puerto Rico were asked if they agreed with them and 74.3% (N = 31) said ‘yes.’ The
majority of fishers (80%, N = 37) believed people to generally comply with these regulations.
Fishers were asked about their opinion on whether or not a series of different factors associated with
anthropogenic impacts and climate change are a threat to fisheries. The factors with the highest frequency of
‘yes’ responses were pollution (92.9%, N = 197), coral bleaching (84.4%, N = 178), and increase in sea
temperature (59.7%, N = 126). The factors with which fishers were least concerned about as far as how they
might affect their fishing activity are increase in air temperature (21.8%, N = 46) and droughts (17.5%, N = 37)
(Table 17 and Figure 23).

41
Table 17. Frequency of ‘yes’ responses to climate change and anthropogenic factors fishers believe are affecting their fishing activity.
Factors % ‘yes’
Responses N
Pollution 92.9 197 Coral Bleaching 84.4 178 Increase in Water Temperature 59.7 126 Overfishing 36.8 78 Increase in Frequency of Storms 34.4 73 Increase in Seaweed 32.9 69 Sea Level Rise 31.9 67 Change in Animal Behavior 30.0 63 Increase in Air Temperature 21.8 46 Increase in Droughts 17.5 37
Figure 23. Frequency of ‘yes’ responses to climate change and anthropogenic factors fishers believe are affecting their fishing activity.
The sum of dichotomous responses (no = 0 and yes = 1) to the 10 factors in Table 17 were used to create a scale
of perceptions on Anthropogenic Impacts ranging from zero to 10. The overall mean value was 4.4 (SD. = 2.4),
i.e., individual fishers on average perceive 4.4 out of 10 anthropogenic and climate change factors to be
affecting their fishing activity.
The different regions studied were compared with regard to fishers’ perceptions on whether or not the local
climate has been changing. Results were statistically significant with the greatest difference in frequencies
occurring between responses for the Southwest coast when compared to the other regions which share similar
distribution of positive and negative responses. In the Southwest coast almost half of the fishers (47.7%, N = 42)
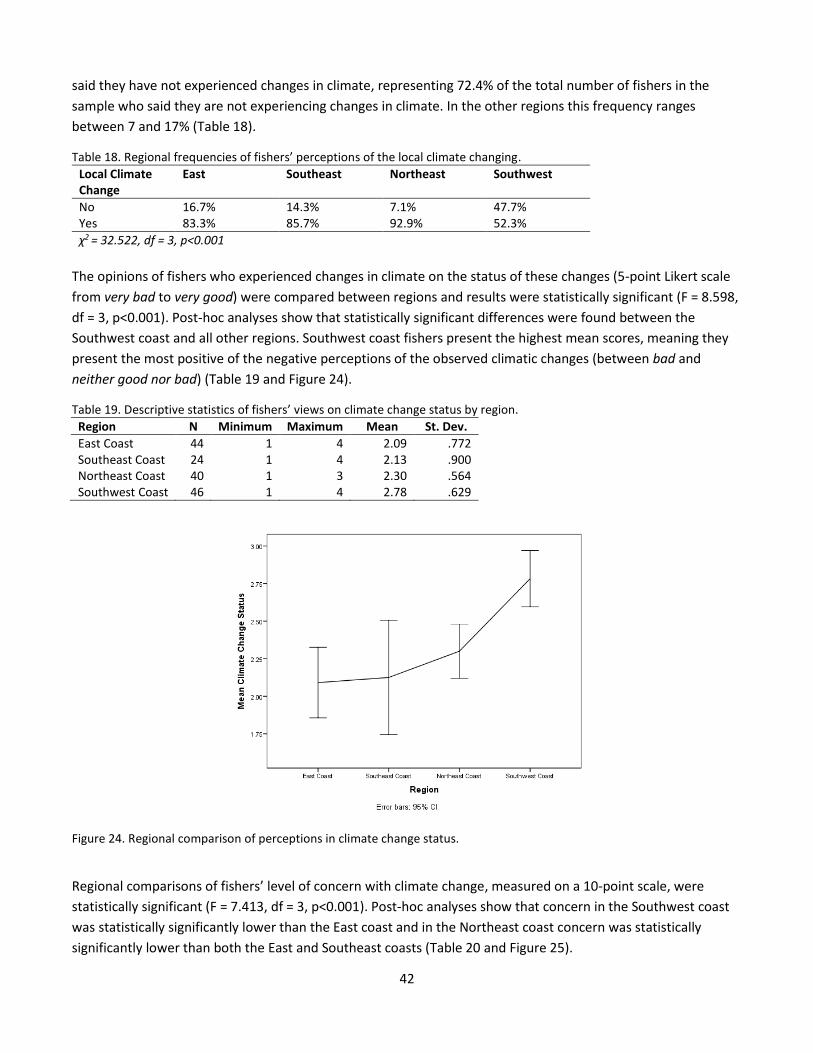
42
said they have not experienced changes in climate, representing 72.4% of the total number of fishers in the
sample who said they are not experiencing changes in climate. In the other regions this frequency ranges
between 7 and 17% (Table 18).
Table 18. Regional frequencies of fishers’ perceptions of the local climate changing.
Local Climate Change
East Southeast Northeast Southwest
No 16.7% 14.3% 7.1% 47.7% Yes 83.3% 85.7% 92.9% 52.3%
χ2 = 32.522, df = 3, p<0.001
The opinions of fishers who experienced changes in climate on the status of these changes (5-point Likert scale
from very bad to very good) were compared between regions and results were statistically significant (F = 8.598,
df = 3, p<0.001). Post-hoc analyses show that statistically significant differences were found between the
Southwest coast and all other regions. Southwest coast fishers present the highest mean scores, meaning they
present the most positive of the negative perceptions of the observed climatic changes (between bad and
neither good nor bad) (Table 19 and Figure 24).
Table 19. Descriptive statistics of fishers’ views on climate change status by region.
Region N Minimum Maximum Mean St. Dev.
East Coast 44 1 4 2.09 .772 Southeast Coast 24 1 4 2.13 .900 Northeast Coast 40 1 3 2.30 .564 Southwest Coast 46 1 4 2.78 .629
Figure 24. Regional comparison of perceptions in climate change status.
Regional comparisons of fishers’ level of concern with climate change, measured on a 10-point scale, were
statistically significant (F = 7.413, df = 3, p<0.001). Post-hoc analyses show that concern in the Southwest coast
was statistically significantly lower than the East coast and in the Northeast coast concern was statistically
significantly lower than both the East and Southeast coasts (Table 20 and Figure 25).
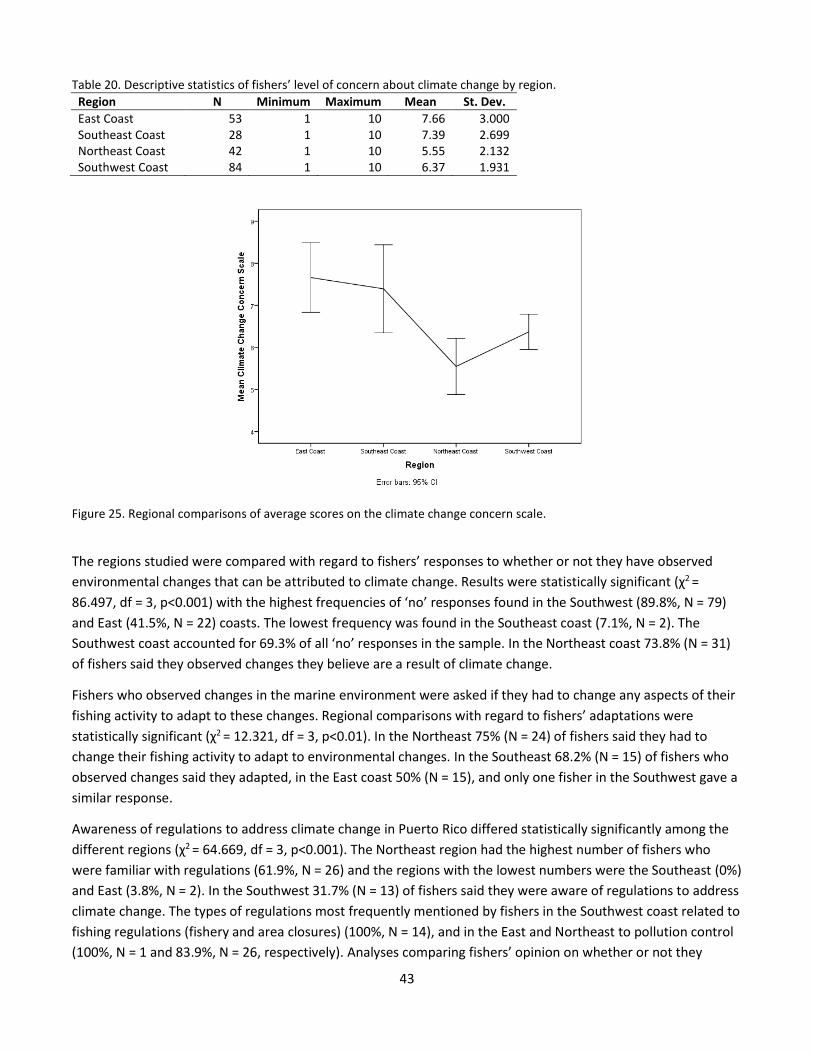
43
Table 20. Descriptive statistics of fishers’ level of concern about climate change by region.
Region N Minimum Maximum Mean St. Dev.
East Coast 53 1 10 7.66 3.000 Southeast Coast 28 1 10 7.39 2.699 Northeast Coast 42 1 10 5.55 2.132 Southwest Coast 84 1 10 6.37 1.931
Figure 25. Regional comparisons of average scores on the climate change concern scale.
The regions studied were compared with regard to fishers’ responses to whether or not they have observed
environmental changes that can be attributed to climate change. Results were statistically significant (χ2 =
86.497, df = 3, p<0.001) with the highest frequencies of ‘no’ responses found in the Southwest (89.8%, N = 79)
and East (41.5%, N = 22) coasts. The lowest frequency was found in the Southeast coast (7.1%, N = 2). The
Southwest coast accounted for 69.3% of all ‘no’ responses in the sample. In the Northeast coast 73.8% (N = 31)
of fishers said they observed changes they believe are a result of climate change.
Fishers who observed changes in the marine environment were asked if they had to change any aspects of their
fishing activity to adapt to these changes. Regional comparisons with regard to fishers’ adaptations were
statistically significant (χ2 = 12.321, df = 3, p<0.01). In the Northeast 75% (N = 24) of fishers said they had to
change their fishing activity to adapt to environmental changes. In the Southeast 68.2% (N = 15) of fishers who
observed changes said they adapted, in the East coast 50% (N = 15), and only one fisher in the Southwest gave a
similar response.
Awareness of regulations to address climate change in Puerto Rico differed statistically significantly among the
different regions (χ2 = 64.669, df = 3, p<0.001). The Northeast region had the highest number of fishers who
were familiar with regulations (61.9%, N = 26) and the regions with the lowest numbers were the Southeast (0%)
and East (3.8%, N = 2). In the Southwest 31.7% (N = 13) of fishers said they were aware of regulations to address
climate change. The types of regulations most frequently mentioned by fishers in the Southwest coast related to
fishing regulations (fishery and area closures) (100%, N = 14), and in the East and Northeast to pollution control
(100%, N = 1 and 83.9%, N = 26, respectively). Analyses comparing fishers’ opinion on whether or not they
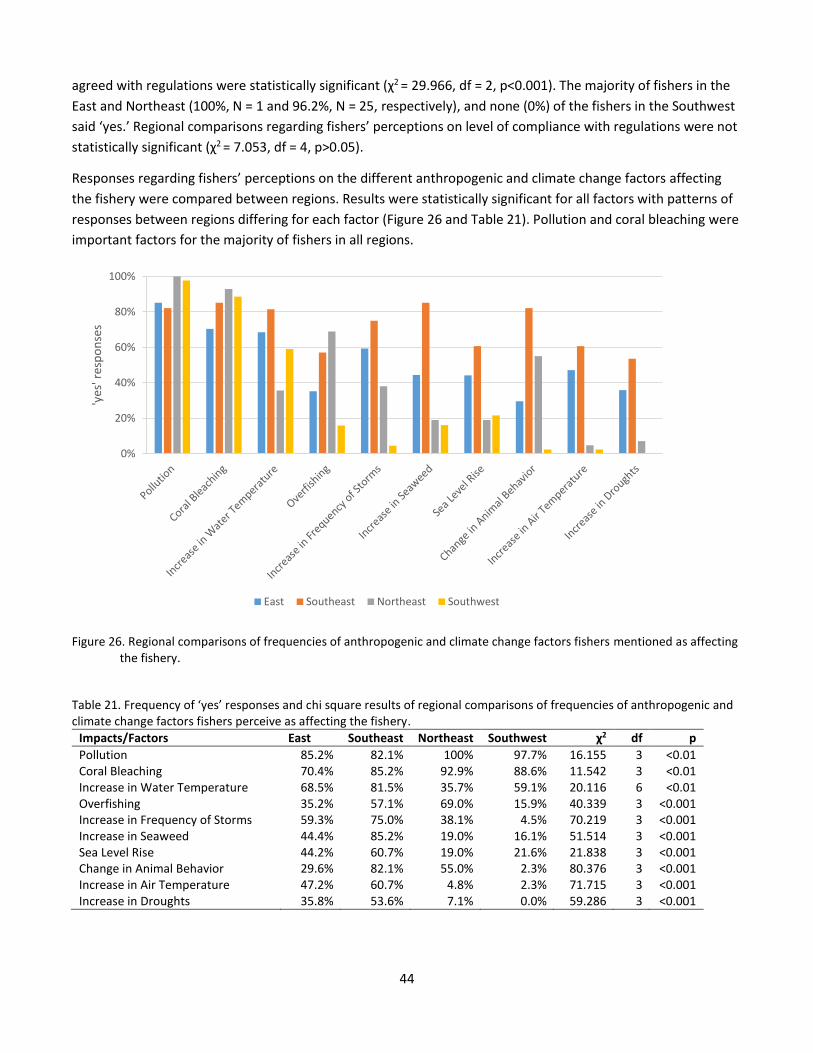
44
agreed with regulations were statistically significant (χ2 = 29.966, df = 2, p<0.001). The majority of fishers in the
East and Northeast (100%, N = 1 and 96.2%, N = 25, respectively), and none (0%) of the fishers in the Southwest
said ‘yes.’ Regional comparisons regarding fishers’ perceptions on level of compliance with regulations were not
statistically significant (χ2 = 7.053, df = 4, p>0.05).
Responses regarding fishers’ perceptions on the different anthropogenic and climate change factors affecting
the fishery were compared between regions. Results were statistically significant for all factors with patterns of
responses between regions differing for each factor (Figure 26 and Table 21). Pollution and coral bleaching were
important factors for the majority of fishers in all regions.
Figure 26. Regional comparisons of frequencies of anthropogenic and climate change factors fishers mentioned as affecting the fishery.
Table 21. Frequency of ‘yes’ responses and chi square results of regional comparisons of frequencies of anthropogenic and climate change factors fishers perceive as affecting the fishery.
Impacts/Factors East Southeast Northeast Southwest χ2 df p
Pollution 85.2% 82.1% 100% 97.7% 16.155 3 <0.01 Coral Bleaching 70.4% 85.2% 92.9% 88.6% 11.542 3 <0.01 Increase in Water Temperature 68.5% 81.5% 35.7% 59.1% 20.116 6 <0.01 Overfishing 35.2% 57.1% 69.0% 15.9% 40.339 3 <0.001 Increase in Frequency of Storms 59.3% 75.0% 38.1% 4.5% 70.219 3 <0.001 Increase in Seaweed 44.4% 85.2% 19.0% 16.1% 51.514 3 <0.001 Sea Level Rise 44.2% 60.7% 19.0% 21.6% 21.838 3 <0.001 Change in Animal Behavior 29.6% 82.1% 55.0% 2.3% 80.376 3 <0.001 Increase in Air Temperature 47.2% 60.7% 4.8% 2.3% 71.715 3 <0.001 Increase in Droughts 35.8% 53.6% 7.1% 0.0% 59.286 3 <0.001
0%
20%
40%
60%
80%
100%
'yes
' res
po
nse
s
East Southeast Northeast Southwest
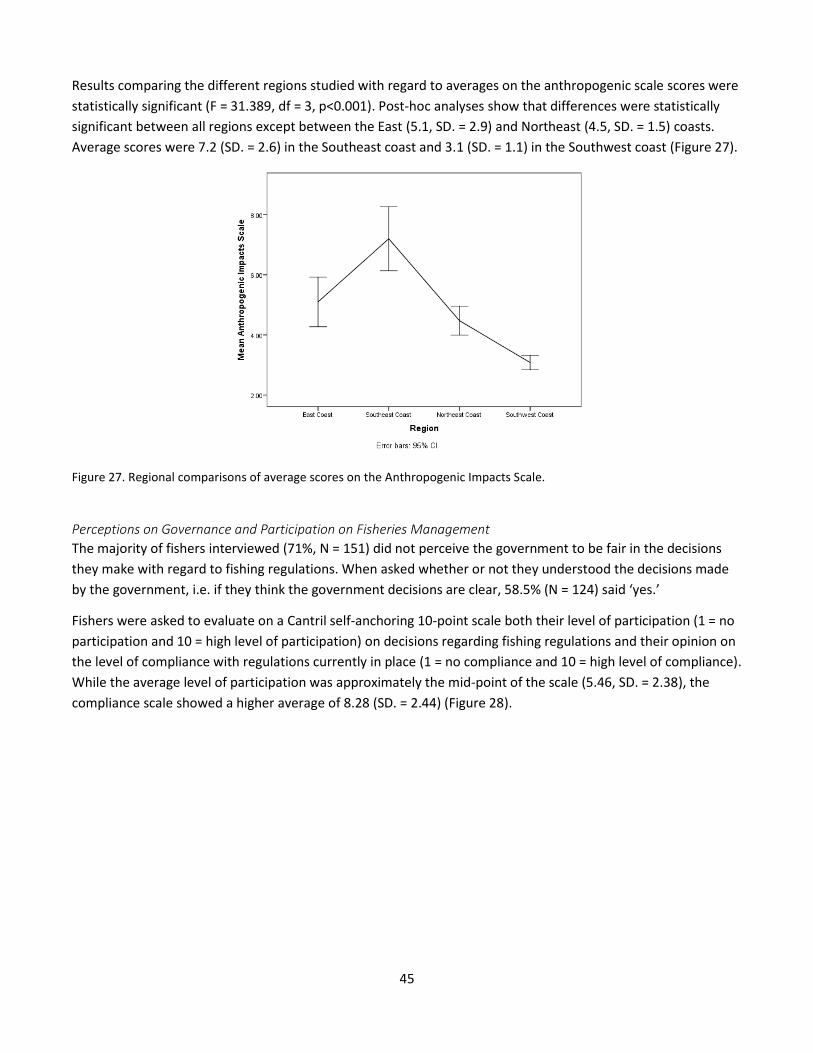
45
Results comparing the different regions studied with regard to averages on the anthropogenic scale scores were
statistically significant (F = 31.389, df = 3, p<0.001). Post-hoc analyses show that differences were statistically
significant between all regions except between the East (5.1, SD. = 2.9) and Northeast (4.5, SD. = 1.5) coasts.
Average scores were 7.2 (SD. = 2.6) in the Southeast coast and 3.1 (SD. = 1.1) in the Southwest coast (Figure 27).
Figure 27. Regional comparisons of average scores on the Anthropogenic Impacts Scale.
Perceptions on Governance and Participation on Fisheries Management
The majority of fishers interviewed (71%, N = 151) did not perceive the government to be fair in the decisions
they make with regard to fishing regulations. When asked whether or not they understood the decisions made
by the government, i.e. if they think the government decisions are clear, 58.5% (N = 124) said ‘yes.’
Fishers were asked to evaluate on a Cantril self-anchoring 10-point scale both their level of participation (1 = no
participation and 10 = high level of participation) on decisions regarding fishing regulations and their opinion on
the level of compliance with regulations currently in place (1 = no compliance and 10 = high level of compliance).
While the average level of participation was approximately the mid-point of the scale (5.46, SD. = 2.38), the
compliance scale showed a higher average of 8.28 (SD. = 2.44) (Figure 28).
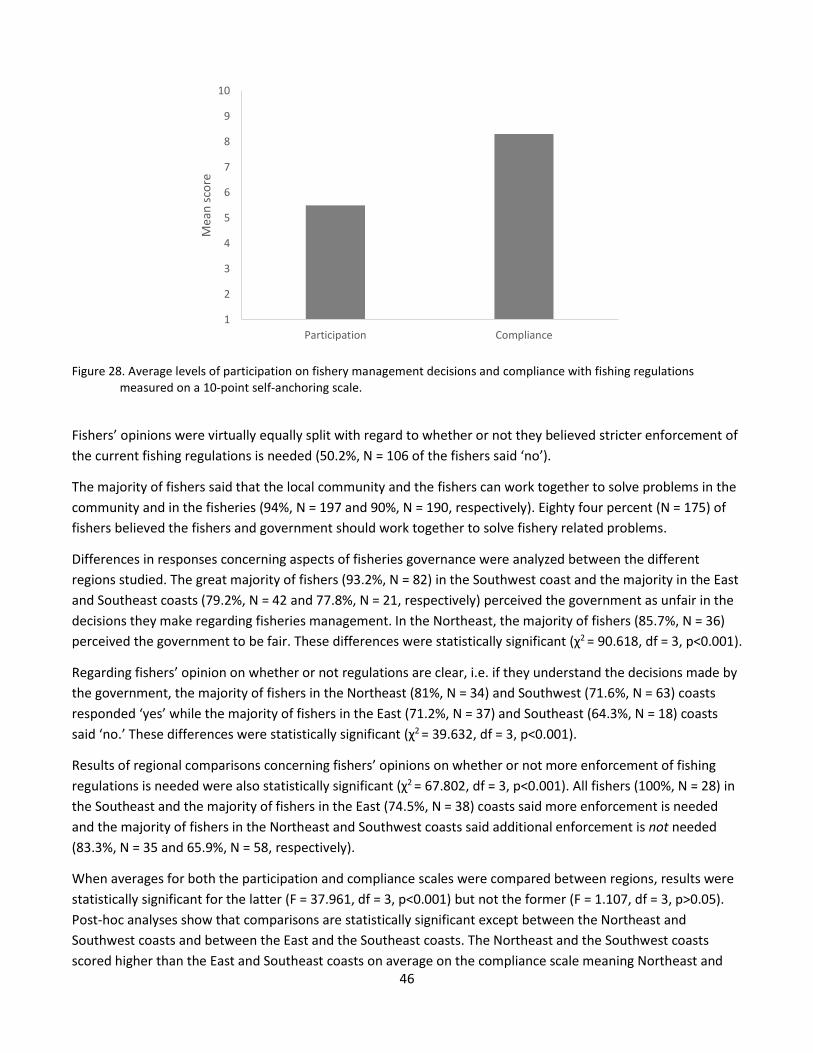
46
Figure 28. Average levels of participation on fishery management decisions and compliance with fishing regulations measured on a 10-point self-anchoring scale.
Fishers’ opinions were virtually equally split with regard to whether or not they believed stricter enforcement of
the current fishing regulations is needed (50.2%, N = 106 of the fishers said ‘no’).
The majority of fishers said that the local community and the fishers can work together to solve problems in the
community and in the fisheries (94%, N = 197 and 90%, N = 190, respectively). Eighty four percent (N = 175) of
fishers believed the fishers and government should work together to solve fishery related problems.
Differences in responses concerning aspects of fisheries governance were analyzed between the different
regions studied. The great majority of fishers (93.2%, N = 82) in the Southwest coast and the majority in the East
and Southeast coasts (79.2%, N = 42 and 77.8%, N = 21, respectively) perceived the government as unfair in the
decisions they make regarding fisheries management. In the Northeast, the majority of fishers (85.7%, N = 36)
perceived the government to be fair. These differences were statistically significant (χ2 = 90.618, df = 3, p<0.001).
Regarding fishers’ opinion on whether or not regulations are clear, i.e. if they understand the decisions made by
the government, the majority of fishers in the Northeast (81%, N = 34) and Southwest (71.6%, N = 63) coasts
responded ‘yes’ while the majority of fishers in the East (71.2%, N = 37) and Southeast (64.3%, N = 18) coasts
said ‘no.’ These differences were statistically significant (χ2 = 39.632, df = 3, p<0.001).
Results of regional comparisons concerning fishers’ opinions on whether or not more enforcement of fishing
regulations is needed were also statistically significant (χ2 = 67.802, df = 3, p<0.001). All fishers (100%, N = 28) in
the Southeast and the majority of fishers in the East (74.5%, N = 38) coasts said more enforcement is needed
and the majority of fishers in the Northeast and Southwest coasts said additional enforcement is not needed
(83.3%, N = 35 and 65.9%, N = 58, respectively).
When averages for both the participation and compliance scales were compared between regions, results were
statistically significant for the latter (F = 37.961, df = 3, p<0.001) but not the former (F = 1.107, df = 3, p>0.05).
Post-hoc analyses show that comparisons are statistically significant except between the Northeast and
Southwest coasts and between the East and the Southeast coasts. The Northeast and the Southwest coasts
scored higher than the East and Southeast coasts on average on the compliance scale meaning Northeast and
1
2
3
4
5
6
7
8
9
10
Participation Compliance
Mea
n s
core
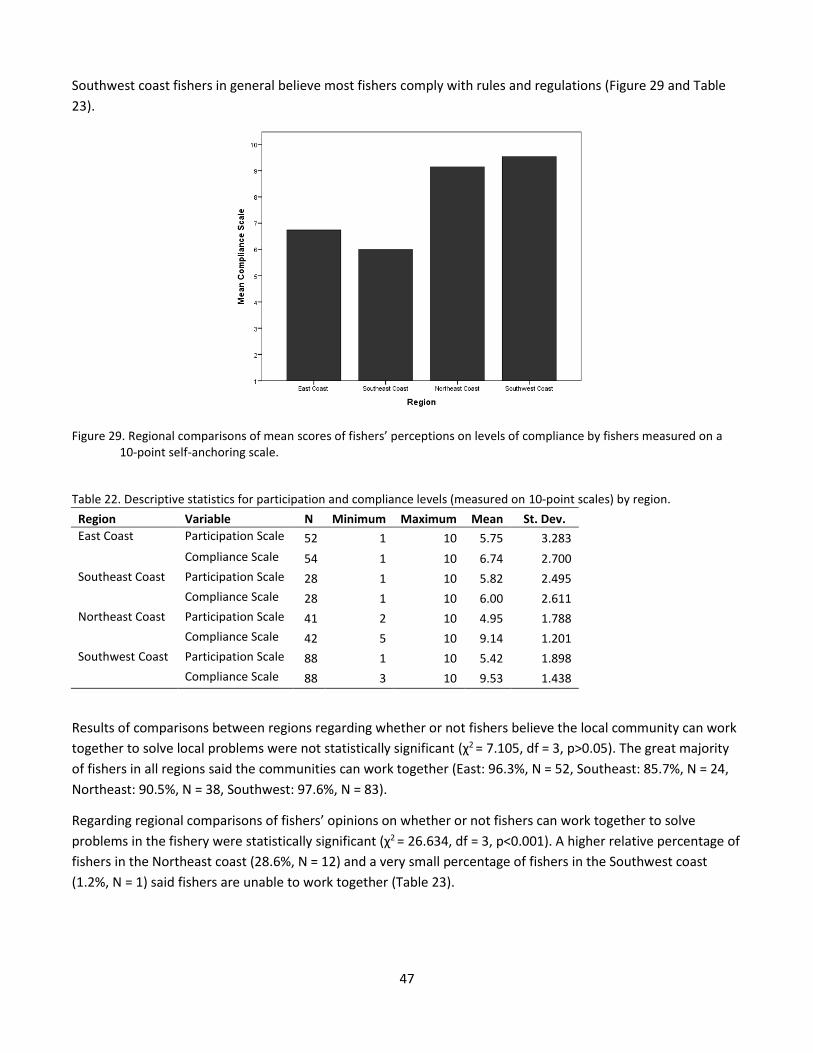
47
Southwest coast fishers in general believe most fishers comply with rules and regulations (Figure 29 and Table
23).
Figure 29. Regional comparisons of mean scores of fishers’ perceptions on levels of compliance by fishers measured on a 10-point self-anchoring scale.
Table 22. Descriptive statistics for participation and compliance levels (measured on 10-point scales) by region.
Region Variable N Minimum Maximum Mean St. Dev.
East Coast Participation Scale 52 1 10 5.75 3.283
Compliance Scale 54 1 10 6.74 2.700
Southeast Coast Participation Scale 28 1 10 5.82 2.495
Compliance Scale 28 1 10 6.00 2.611
Northeast Coast Participation Scale 41 2 10 4.95 1.788
Compliance Scale 42 5 10 9.14 1.201
Southwest Coast Participation Scale 88 1 10 5.42 1.898
Compliance Scale 88 3 10 9.53 1.438
Results of comparisons between regions regarding whether or not fishers believe the local community can work
together to solve local problems were not statistically significant (χ2 = 7.105, df = 3, p>0.05). The great majority
of fishers in all regions said the communities can work together (East: 96.3%, N = 52, Southeast: 85.7%, N = 24,
Northeast: 90.5%, N = 38, Southwest: 97.6%, N = 83).
Regarding regional comparisons of fishers’ opinions on whether or not fishers can work together to solve
problems in the fishery were statistically significant (χ2 = 26.634, df = 3, p<0.001). A higher relative percentage of
fishers in the Northeast coast (28.6%, N = 12) and a very small percentage of fishers in the Southwest coast
(1.2%, N = 1) said fishers are unable to work together (Table 23).
48
Table 23. Regional comparisons of the frequency of ‘yes’ responses to whether or not fishers can work together to solve problems in the fishery.
Region % ‘yes’ N
East Coast 94.40% 51 Southeast Coast 89.30% 25 Northeast Coast 71.40% 30 Southwest Coast 98.80% 84
Results of the regional comparisons regarding fishers opinions on whether or not fishers and the government
should work together to solve problems in the fishery were statistically significant (χ2 = 11.500, df = 3, p<0.01). A
relative higher incidence of Southwest coast fishers do not believe fishers and government should work together
(Table 24).
Table 24. Regional comparisons of the frequency of fishers’ responses to whether or not fishers and government should work together to solve problems in the fishery.
Region % ‘yes’ N
East Coast 92.60% 50 Southeast Coast 82.10% 23 Northeast Coast 92.90% 39 Southwest Coast 74.10% 63
Discussion Results of surveys with 212 fishers in different communities in Puerto Rico representing the East, Southeast,
Southwest, and Northeast coastal regions suggest that levels of dependency on fishery resources among Puerto
Rican fishers is significant, as a large portion of the sample either depended entirely on fishing for a living or
derived most of their income from fishing. The great majority of fishers were also the major household providers
suggesting that income and nutrition from fishing are important to support Puerto Rican families and coastal
communities at large.
Regional analyses suggest that the socio-economic impacts of fishing differ between fishing communities in
different parts of the island. In the Southwest coast fishers tended to be more dependent on fisheries for
income and also said more frequently they were the major household providers for larger households on
average when compared to the other regions. While these results suggest higher levels of fishery dependency
among Southwest coast fishers, this region had the majority of fishers who did not own their fishing boats but
rather worked as crew for local pescaderias, thus, having less control over the means of production and being
more vulnerable to losing access to their livelihood. This could explain the lower scores on the self-actualization
component of job satisfaction in this region when compared to all others. Nonetheless, Puerto Rican fishers, in
general, presented high levels of job satisfaction and scored high on the happiness scale suggesting that fisheries
are not only important as a source of income and nutrition but it is also significant for fishers’ social and
psychological well-being. Qualitative data collected during this study provide insight into the aspects of the
occupation that drive this significant attachment:
“When I get under water and I see all the beautiful colorful fish I have no worries, no problems. It all goes away”
(Naguabo fisher).
“Fishing is like my therapy. If I stop fishing it will be bad for my health” (La Parguera fisher).
49
Our findings suggest that Puerto Rican fishers have relatively high levels of environmental awareness and many
are concerned about the impacts of climate change and other anthropogenic impacts on the marine
environment and the fishery resources. While the overall perception of the current status of fishery resources is
that stocks are in somewhat good shape, most fishers perceive the resources to have declined in the past
decade. Fishers believe that the most important reasons for this decline are pollution, overexploitation, changes
in climate, and the negative effects of regulations. Regional differences also influenced fishers’ views on the
health of the resources. On the Southwest coast, fishers tended to have more positive views on the state of the
fishery resources. Fishers in this region target mostly spiny lobster and queen conch and generally do not target
reef fish species more commonly targeted in the other regions. This difference in target species may have driven
the regional differences observed in fishers’ perceptions of the health of the resources. However, the Southwest
region also presented the lowest levels of environmental awareness and lowest scores on the anthropogenic
impact scale when compared to the other regions. These findings suggest that fishers’ overall perceptions of the
effects of human activities on the environment are likely tied to their perceptions of the health of the fishery
resources. In the Southwest, fishers were also the least concerned about overfishing when compared to the
other regions. This potential link between fishers’ environmental awareness and their perceptions of the health
of the resources provides potential opportunities for outreach and education strategies to further sustainability
goals by focusing on increasing environmental and anthropogenic impact awareness in general among fishers.
Although regional differences were found with regard to fishers’ perceptions of the impacts of different
anthropogenic and climate change related factors, fishers in all regions were overwhelmingly concerned about
the impacts of pollution and coral bleaching affecting their fishing activity. One of the items with the highest
scores on the environmental awareness scale relate to fishers perceptions of the importance of coral reefs for
the health of the fishery resources. Fishers were also generally concerned about warmer sea temperatures.
Fishers in Puerto Rico depend greatly on reef and reef dependent species and the majority of them dive into
these habitats to fish, allowing them to observe and closely experience changes and impacts to the reefs and
surrounding areas.
Environmental impacts most frequently associated with climate change by fishers were fish stock decline,
habitat shifts including fish and shellfish moving farther from the coast and into deeper waters, change in
composition of species, and increase in water temperature. Although it is difficult to differentiate fishers’
perceptions of the different causes of the changes observed, e.g. climate change impacts versus overfishing,
changes observed by fishers are in line with observed and predicted climate change impacts on marine
ecosystems and organisms. Thus, our findings suggest that many fishers have an understanding of and are able
to link changes in climate to changes in the marine environment affecting the fisheries.
These changes experienced by fishers have led to adaptations such as changes in fishing grounds, specifically
having to fish in deeper water and farther away from the shore. Fishers also mentioned the need to change or
diversify gear to increase productivity and target different species. Adaptations that involve traveling farther
from the coast and fishing in deeper waters present potential risks especially for SCUBA divers, and in particular
the risk of decompression sickness. It is interesting to note that aspects of the job relating to safety,
healthfulness, and fatigue were generally the job satisfaction items with which fishers had the lowest scores,
possibly reflecting concern over risks associated with the activities that could be further accentuated by the
adaptations mentioned. Considering that most fishers are major household providers, these increased risks to
fishers’ safety and health further compound the vulnerability of their families and communities.
50
Findings of this study regarding aspects of fisheries governance suggest that in general fishers perceive their
participation levels in decision-making as moderate, and most fishers believe more collaboration between
fishers and government authorities is needed to improve fishery management strategies. The region where
fishers had the most negative perceptions of the potential for fishers and government collaborations was the
Southwest. Anecdotal data collected during the course of this study from conversations with fishers and other
fishery stakeholders from the Southwest region provide some insight that help explain these findings. According
to the information obtained, fishers in the region have negative perceptions of past interactions with
government agencies which, in their view, used information obtained from fishers but did little to give
continuation to collaborations and to involve fishers in future management decisions. Although we do not have
enough information to infer on these mentioned past events, it is important to point out that the negative
perceptions and overall distrust of the fishers was sufficient in this case to create barriers for future
collaborations. This is particularly important since the overall majority of fishers interviewed do not perceive the
fishery management decisions in Puerto Rico to be fair indicating that fishers may be less inclined to agree or
accept regulations adopted.
Findings from the surveys conducted with fishers provide insight into issues raised during the key informant
interviews. Although our data does not provide information on the overall dependence of Puerto Rican coastal
communities on fisheries, it suggests that for individual fishers fishing is an important source of income,
nutrition, and well-being in general despite the perceptions of some stakeholders that fishers do not depend on
the activity for a living. Although previous research has shown that occupational multiplicity is an important
characteristic of Puerto Rican fishing communities, there is enough evidence to suggest, including our findings,
that fisheries and coastal-based resource extraction constitute important components of the cultural and socio-
economic context of most coastal communities (see Garcia-Quijano et al. 2015). It is also important to point out,
that diversity of livelihood and income is an important aspect linked to increased resilience of natural resource
users in the face of natural seasonal changes and long-term environmental transformations.
Results of the survey effort also suggest that environmental and especially climate change awareness among
fishers is higher than as perceived by some of the key informants representing government and other
institutions working directly and indirectly with fisheries management. These findings, coupled with fishers
overall willingness to collaborate with decision-makers in management decisions, suggest that opportunities
exist for collaborative strategies focused on addressing challenges in the fisheries, particularly those challenges
that are prioritized by all or most stakeholder groups. Our findings suggest that pollution, impacts of climate
change, coral reef degradation, and improving communication between fishers and fisheries management
authorities constitute common priorities among all stakeholders. These convergent topics provide opportunities
to initiate and further increase collaborations and strategies to conserve and safeguard the sustainability of
coral reef and fishery resources and the well-being of Puerto Rican coastal communities.
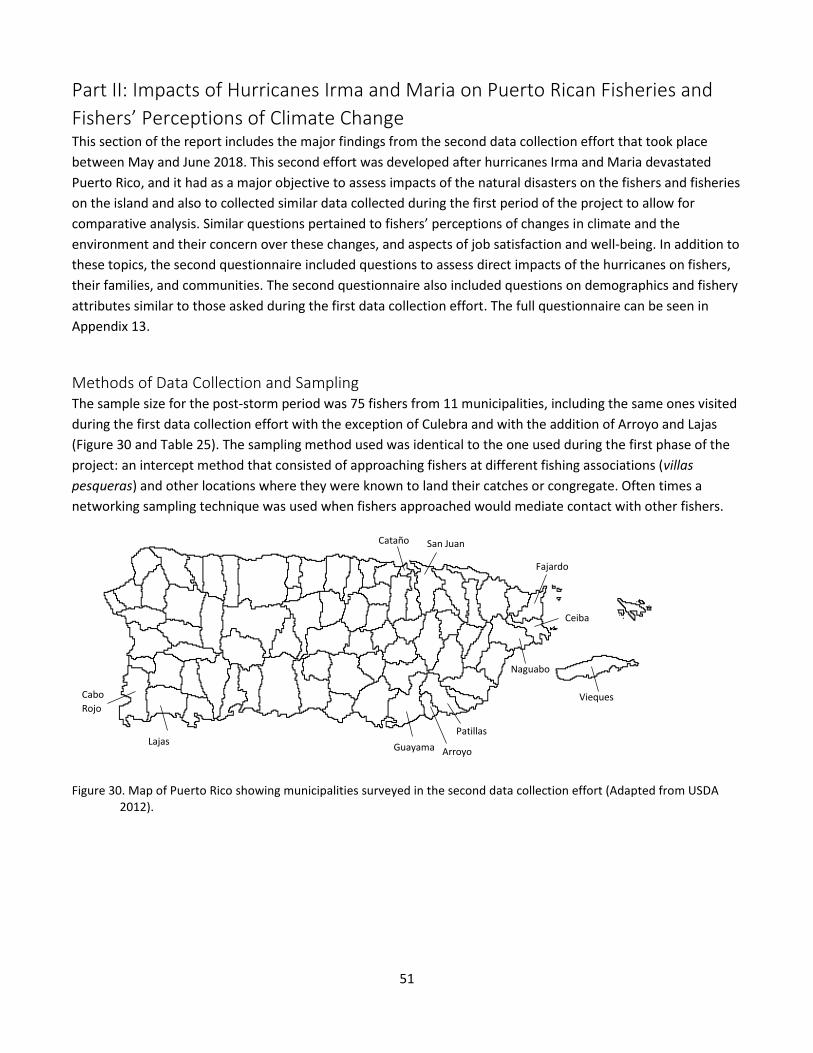
51
Part II: Impacts of Hurricanes Irma and Maria on Puerto Rican Fisheries and
Fishers’ Perceptions of Climate Change This section of the report includes the major findings from the second data collection effort that took place
between May and June 2018. This second effort was developed after hurricanes Irma and Maria devastated
Puerto Rico, and it had as a major objective to assess impacts of the natural disasters on the fishers and fisheries
on the island and also to collected similar data collected during the first period of the project to allow for
comparative analysis. Similar questions pertained to fishers’ perceptions of changes in climate and the
environment and their concern over these changes, and aspects of job satisfaction and well-being. In addition to
these topics, the second questionnaire included questions to assess direct impacts of the hurricanes on fishers,
their families, and communities. The second questionnaire also included questions on demographics and fishery
attributes similar to those asked during the first data collection effort. The full questionnaire can be seen in
Appendix 13.
Methods of Data Collection and Sampling The sample size for the post-storm period was 75 fishers from 11 municipalities, including the same ones visited
during the first data collection effort with the exception of Culebra and with the addition of Arroyo and Lajas
(Figure 30 and Table 25). The sampling method used was identical to the one used during the first phase of the
project: an intercept method that consisted of approaching fishers at different fishing associations (villas
pesqueras) and other locations where they were known to land their catches or congregate. Often times a
networking sampling technique was used when fishers approached would mediate contact with other fishers.
Figure 30. Map of Puerto Rico showing municipalities surveyed in the second data collection effort (Adapted from USDA 2012).
Vieques Cabo
Rojo
San Juan
Fajardo
Ceiba
Guayama
Patillas
Cataño
Naguabo
Arroyo Lajas
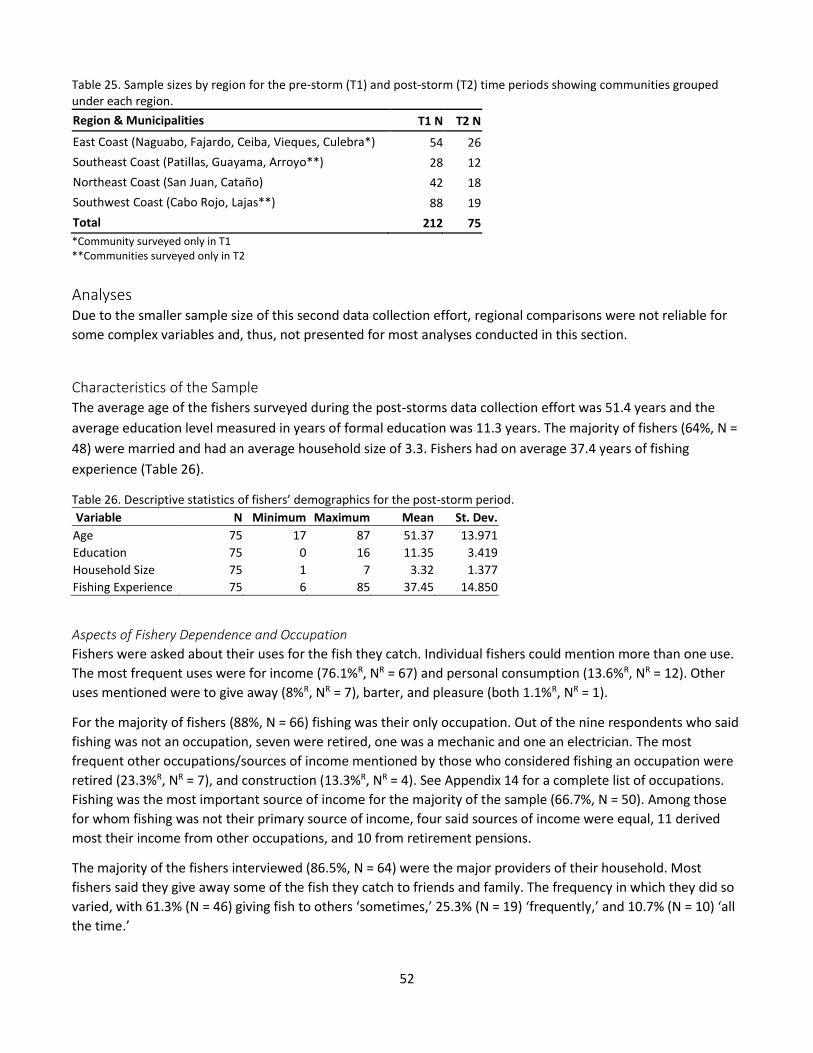
52
Table 25. Sample sizes by region for the pre-storm (T1) and post-storm (T2) time periods showing communities grouped under each region.
Region & Municipalities T1 N T2 N
East Coast (Naguabo, Fajardo, Ceiba, Vieques, Culebra*) 54 26
Southeast Coast (Patillas, Guayama, Arroyo**) 28 12
Northeast Coast (San Juan, Cataño) 42 18
Southwest Coast (Cabo Rojo, Lajas**) 88 19
Total 212 75
*Community surveyed only in T1 **Communities surveyed only in T2
Analyses Due to the smaller sample size of this second data collection effort, regional comparisons were not reliable for
some complex variables and, thus, not presented for most analyses conducted in this section.
Characteristics of the Sample The average age of the fishers surveyed during the post-storms data collection effort was 51.4 years and the
average education level measured in years of formal education was 11.3 years. The majority of fishers (64%, N =
48) were married and had an average household size of 3.3. Fishers had on average 37.4 years of fishing
experience (Table 26).
Table 26. Descriptive statistics of fishers’ demographics for the post-storm period.
Variable N Minimum Maximum Mean St. Dev.
Age 75 17 87 51.37 13.971
Education 75 0 16 11.35 3.419
Household Size 75 1 7 3.32 1.377
Fishing Experience 75 6 85 37.45 14.850
Aspects of Fishery Dependence and Occupation
Fishers were asked about their uses for the fish they catch. Individual fishers could mention more than one use.
The most frequent uses were for income (76.1%R, NR = 67) and personal consumption (13.6%R, NR = 12). Other
uses mentioned were to give away (8%R, NR = 7), barter, and pleasure (both 1.1%R, NR = 1).
For the majority of fishers (88%, N = 66) fishing was their only occupation. Out of the nine respondents who said
fishing was not an occupation, seven were retired, one was a mechanic and one an electrician. The most
frequent other occupations/sources of income mentioned by those who considered fishing an occupation were
retired (23.3%R, NR = 7), and construction (13.3%R, NR = 4). See Appendix 14 for a complete list of occupations.
Fishing was the most important source of income for the majority of the sample (66.7%, N = 50). Among those
for whom fishing was not their primary source of income, four said sources of income were equal, 11 derived
most their income from other occupations, and 10 from retirement pensions.
The majority of the fishers interviewed (86.5%, N = 64) were the major providers of their household. Most
fishers said they give away some of the fish they catch to friends and family. The frequency in which they did so
varied, with 61.3% (N = 46) giving fish to others ‘sometimes,’ 25.3% (N = 19) ‘frequently,’ and 10.7% (N = 10) ‘all
the time.’
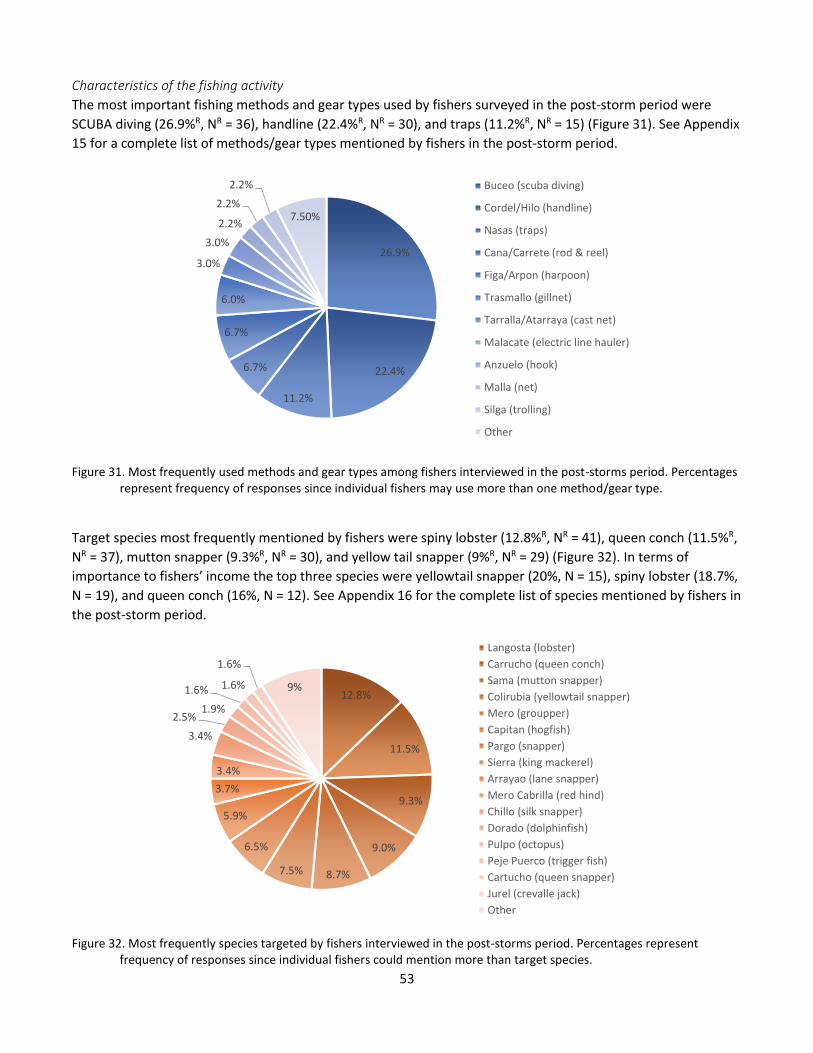
53
Characteristics of the fishing activity
The most important fishing methods and gear types used by fishers surveyed in the post-storm period were
SCUBA diving (26.9%R, NR = 36), handline (22.4%R, NR = 30), and traps (11.2%R, NR = 15) (Figure 31). See Appendix
15 for a complete list of methods/gear types mentioned by fishers in the post-storm period.
Figure 31. Most frequently used methods and gear types among fishers interviewed in the post-storms period. Percentages represent frequency of responses since individual fishers may use more than one method/gear type.
Target species most frequently mentioned by fishers were spiny lobster (12.8%R, NR = 41), queen conch (11.5%R,
NR = 37), mutton snapper (9.3%R, NR = 30), and yellow tail snapper (9%R, NR = 29) (Figure 32). In terms of
importance to fishers’ income the top three species were yellowtail snapper (20%, N = 15), spiny lobster (18.7%,
N = 19), and queen conch (16%, N = 12). See Appendix 16 for the complete list of species mentioned by fishers in
the post-storm period.
Figure 32. Most frequently species targeted by fishers interviewed in the post-storms period. Percentages represent frequency of responses since individual fishers could mention more than target species.
26.9%
22.4%
11.2%
6.7%
6.7%
6.0%
3.0%
3.0%
2.2%
2.2%
2.2%
7.50%
Buceo (scuba diving)
Cordel/Hilo (handline)
Nasas (traps)
Cana/Carrete (rod & reel)
Figa/Arpon (harpoon)
Trasmallo (gillnet)
Tarralla/Atarraya (cast net)
Malacate (electric line hauler)
Anzuelo (hook)
Malla (net)
Silga (trolling)
Other
12.8%
11.5%
9.3%
9.0%
8.7%7.5%
6.5%
5.9%
3.7%
3.4%
3.4%
2.5%1.9%
1.6% 1.6%
1.6%
9%
Langosta (lobster)
Carrucho (queen conch)
Sama (mutton snapper)
Colirubia (yellowtail snapper)
Mero (groupper)
Capitan (hogfish)
Pargo (snapper)
Sierra (king mackerel)
Arrayao (lane snapper)
Mero Cabrilla (red hind)
Chillo (silk snapper)
Dorado (dolphinfish)
Pulpo (octopus)
Peje Puerco (trigger fish)
Cartucho (queen snapper)
Jurel (crevalle jack)
Other
54
Average length of boats used by fishers was 20.2 feet (SD. = 3.0). The majority of fishers interviewed (66.2%, N =
49) owned the boat they use for fishing. Those who did not own their fishing boats were asked if the boat
owners had more than one fishing boat and the majority (68%, N = 17) said ‘no.’
Fishers were asked about their perceptions on the impacts of human activities on the environment and the
climate by asking their agreement on a 5-point Likert scale ranging from 1 (strongly disagree) to 5 (strongly
agree), reversed for negatively worded items, with the three statements seen in Table 27 along with mean
values of responses to each variable. Mean values over 3 indicate that, for the most part, fishers believe that
human activities influence the environment and climate.
Table 27. Perceptions on the impacts of human activities on the environment and the climate measured on a 5-point Likert scale ranging from 1 = ‘strongly disagree’ to 5 = ‘strongly agree’ except for items marked with an asterisk for which scale was reversed.
Human Impact Variable N Minimum Maximum Mean St. Dev.
Human activities influence the coastal and marine environment.
75 1 5 3.85 1.171
Human activities influence the climate 75 1 5 3.37 1.271
There is no point in planning for the future; what happens, happens and we cannot do anything about it*
75 1 5 3.68 1.164
Impacts of Hurricanes Irma and Maria on Fishers and Fisheries With regard to hurricane damage, respondents were asked whether their house, fishing gear, boat, or other
personal items were lost or damaged. If there was loss or damage they were asked to rank the level of damage
on a 4-point Likert scale with the levels minor, moderate, severe, or complete, respective scores being 1 through
4, with no loss or damage scored as zero.
Overall, a little over one half of the respondents reported damage to their house or fishing gear (both 52%, N =
39). Almost half (49.3%, N = 37) reported loss or damage for other personal items, and about one-fourth (24.7%,
N = 18) said their boat was damaged or lost. Mean values for damage level reported for each item is in Table 28.
The belonging with the highest overall damage level was gear.
Table 28. Mean value of damage level for different personal belonging measured on a scale of 1 to 4 from minor to complete damage.
Belonging Damaged or Lost N Minimum Maximum Mean St. Dev.
House 39 1 4 2.26 1.093 Gear 39 0 4 2.87 1.196 Boat 18 1 4 2.56 1.199 Other Personal Belongings 37 1 4 2.27 1.146
Two scales were constructed based on the questions concerning loss and damage. The first (scale 1) is the total
number of the four evaluated items (house, gear, boat, other) resulting in a score ranging from 0 to 4
(Cronbach’s alpha = 0.54), and the second (scale 2), composed of the sum of the severity ranks for the items
with a scale with a possible minimum value of zero and a maximum of 16 (Cronbach’s alpha = 0.68). Between
regions differences for these two scales were statistically significant with fishers in the East and Northeast coasts
scoring higher than the other two regions (Table 29).

55
Table 29. Between region differences in total number and severity level indices of damages and losses from the hurricanes.
Region Scale 1 Scale 2
East Coast 2.200 6.040
Southeast Coast 1.545 4.364
Northeast Coast 2.222 4.722
Southwest Coast 0.947 2.211
Kruskal-Wallis 12.927 11.233
p 0.005 0.011
There was also a question concerning physical injury to the interviewee or his/her family. Fortunately only three
interviewees reported injury: one from the East coast and two from the Northeast coast. Finally, only three
family members were reported to have received injury from the storm: two from the Northeast and one from
the Southwest coast.
Those who reported any loss, damage, or injury were asked if they received any help or assistance and from
whom. Sixty fishers answered this questions and 36% (N = 22) of them said they received assistance. The most
frequently mentioned source of assistance by fishers interviewed was FEMA/DUA4 (53.1%R, NR = 17). Some
fishers (21.9%R, NR = 7) mentioned that they sought assistance from the government (e.g. FEMA) but at the time
of the interview had not yet received it. Other sources of assistance mentioned were government in general (NR
= 5), NGOs (NR = 2), and other people (NR = 1).
Respondents who reported losses and damages were asked to rate their current level of recovery from the
storms on a Cantril self-anchoring 10-point (1 = not recovered at all and 10 = completely recovered). The overall
average was 5.54 (SD. = 3.1) indicating medium (a little over 50%) level of recovery. When asked about what
factors or people had been most important for their recovery, ‘friends’ and ‘family’ combined accounted for
29.5%R (NR = 18) of responses. Other frequent responses were ‘myself’ (19.7%R, NR = 12), i.e. the respondent’s
self-sufficiency was the most helpful aspect for their recovery, and ‘no help received’ (18%R, NR = 11). See
Appendix 17 for a complete list of responses.
Fishers who reported damages and losses were also asked if there were any impediments to their recovery, and
if there were, they were asked to list the impediments. Sixty four individuals responded to this question, and
34% (N = 22) said they experienced impediments. The most frequently mentioned impediments to recovery
were no access to or lack of materials (25.8%R, NR = 8), inability to fish or damage to fishing infrastructure, and
damage to infrastructure in general (e.g. no electricity) (both 22.6%R, NR = 7). Other impediments to recovery
mentioned were lingering bad weather (NR = 4), personal issues (NR = 3), and no access or lack of money (NR = 2).
The majority of fishers interviewed (68.9%, N = 51) said they did not consider leaving Puerto Rico after the
storms. The most frequent reasons provided for staying were “don’t want to leave” (44.9%R, NR = 22) or “there is
no need to leave” (18.4%R, NR = 9). For those who considered leaving Puerto Rico after the storms, reasons were
mostly idiosyncratic (see Appendix 18 for a complete list). Reasons mentioned by more than one fisher were lack
of electricity (NR = 4), and not being able to fish (NR = 2) or no income after the storms (NR = 2). Three fishers said
they left Puerto Rico right after the storms and returned.
Many of the fishers interviewed (42.5%, N = 31) had friends and/or family who exited the fishery after the
hurricanes. They were asked about what these former fishers were currently doing for a living and the most
4 Disaster Unemployment Assistance
56
frequent responses were that they emigrated (43.6%R, NR = 17) or are working in construction (17.9%R, NR = 7)
(Table 30).
Table 30. Current status or jobs of people known to fishers who have exited the fishery occupation after the hurricanes.
Current status/job NR % of Responses
Emigrated 17 43.6% Work in construction 7 17.9% Don't know 4 10.2% Odd jobs 2 5.1% Retired/Social security 2 5.1% Farming/Animal husbandry 2 5.1% Other 2 5.1% Looking for jobs 1 2.6% Work for private sector 1 2.6% Landscaping 1 2.6%
Fishers were asked to rate their perceptions on the status of the fishery resources on a scale of 1 to 5 (1 = in very
bad shape and 5 = in very good shape). Almost half of the fishers (45.5%, N = 34) said the resources are in bad or
very bad shape (Table 31). They were also asked to compare the status of resources before the storms and at
the time the interview occurred. The majority of fishers (70.3%, N = 52) said the resources were in worse shape
than before the hurricanes (Table 32).
Table 31. Fishers’ perceptions on the current status of fishery resources asked on a Likert scale of 1 (very bad shape) to 5 (very good shape).
Current Status of Resources N %
In very bad shape 14 18.667 In bad shape 20 26.667 In neither good nor bad shape 26 34.667 In good shape 12 16.000 In very good shape 3 4.000
Table 32. Fishers’ perceptions comparing the status of resources before and after the hurricanes.
Status of Resources N %
Worse 52 70.270 Same 19 25.676 Better 3 4.054
Almost half of the fishers interviewed (48.6%, N = 36) said they go out fishing less frequently since the
hurricanes (Table 33). The most frequently mentioned reasons affecting fishers’ ability to go out after the storms
were weather conditions in general (30.2%R, NR = 13), and bad ocean conditions (marejadas) (11.6%R, NR = 5). A
complete list of reasons for changes in fishing frequency can be seen in Appendix 19.
Table 33. Percent of responses about frequency with which fishers go out fishing since the storms.
Frequency N Percent
Less 36 48.6 Same 29 39.2 More 9 12.2 Total 74 100.0

57
The majority of fishers interviewed (80.8%, N = 59) said they did not change target species nor gear type (90.4%,
N = 66) as a result of the hurricanes. For the few fishers who had to change target species the reasons
mentioned by more than one fisher were because there is less fish (N = 3) and not catching land crab (jueyes)
since the storms (N = 2). Reasons for changing gear type were particular to each individual interviewed. Lists of
all reasons given for changing target species and gear types after the storms can be seen in Appendix 20.
Some of the fishers (31.5%, N = 23) had to change the locations where they fish after the hurricanes.
Explanations and reasons most frequently given by fishers were the need to fish farther from the coast (31.3%,
N = 10), fishing in deeper waters (21.9%, N = 7), and changes in ocean bottom (tossing of “stones,” damage to
corals and seagrass) (18.8%, N = 6). A complete list of explanations and reasons for changing fishing grounds are
in Appendix 21.
The hurricanes affected the amount of fish that fishers give away to family and friends for 43.8% (N = 32) of the
fishers interviewed. Three fishers said they gave more fish away after the hurricanes. All others said the
hurricanes reduced the amount of fish they give away for various reasons including being unable to go out as
often to fish or because they needed the money more. A complete list of reasons can be seen in Appendix 22.
Fishers’ Perceptions of Environmental and Climate Change Before and After Hurricane Impacts
Comparisons between the pre- and post-storms periods with regard to fishers’ perceptions of the health of the
fishery resources at the time each survey took place were statistically significant (U = 4183, p<0.001). In the
post-storms period, fishers perceived the resources to be in worse shape on average (Table 34).
Table 34. Comparisons of fishers’ perceptions on the health of the resource (scale of 1 to 5) before and after the storms.
Period N Minimum Maximum Mean St. Dev.
Pre-storms 211 2 5 3.51 .836 Post-storms 75 1 5 2.60 1.090
Changes in perceptions on whether or not fishers experienced changes in climate were observed between the
two time periods studied. A higher relative percentage of fishers said they experienced changes in climate
during the post-storms period (89.3%, N = 67) when compared to the pre-storms period (72.6%, N = 154) (χ2 =
8.717, df = 1, p<0.01).
Perceptions of the status of climatic changes observed as well as levels of concern about changes observed were
also statistically significantly different between the two time periods studied (Table 35). In the post-storms
period, fishers perceived climatic changes as worse and were more worried about changes when compared to
the pre-storms period.
Table 35. Comparisons of fishers’ perceptions on the status of climatic changes observed (scale of 1 to 5) and concern about changes (scale of 1 to 10) in the pre- and post-storms periods.
Variable Period N Min. Max. Mean St.
Dev. Mann-
Whitney U p
Climate Change Status Pre 154 1 4 2.36 .756 3914.000 p<0.01 Post 68 1 3 2.00 .691
Climate Change Concern Scale Pre 207 1 10 6.67 2.500 4718.000 p<0.001 Post 75 1 10 8.31 2.661
Fishers’ perceptions of different climate change and anthropogenic factors affecting the fishery also differed
when the pre- and post-storms periods were compared (Figure 33). The only factor that presented a statistically

58
significant decrease in the post-storms period with regard to the frequency of fishers who stated that it affects
their fishing activity was coral bleaching. However, the total frequency of fishers who said coral bleaching to be
affecting the fishery in the post-storms was close to 70%. Factors that presented a statistically significant
increase in the post-storms were increase in frequency and severity of storms, increase in seaweed, sea level
rise, increase in air temperature, and droughts (Figure 33 and Table 36). Analysis comparing the overall score on
the Anthropogenic Impact scale of 1 to 10 created by summing the factors in Table 36 shows a statistically
significant increase in average scores in the post-storms when compared to the pre-storms period (Table 37).
Figure 33. Comparisons of frequencies of anthropogenic and climate change factors fishers mentioned as affecting the fishery before and after the hurricanes.
Table 36. Frequency of ‘yes’ responses and chi square results of comparisons of frequencies of anthropogenic and climate change factors fishers perceive as affecting the fishery before and after the hurricanes.
Impacts/Factors Pre-storm Post-storm χ2 df p
Pollution 92.9 91.7 0.124 1 >0.05 Coral Bleaching 84.4 69.3 7.935 1 <0.01 Increase in Water Temperature 60.0 66.7 1.040 1 >0.05 Overfishing 36.8 43.2 0.964 1 >0.05 Increase in Frequency of Storms 34.4 78.1 41.702 1 <0.001 Increase in Seaweed 32.9 49.3 6.287 1 <0.05 Sea Level Rise 31.9 45.2 4.194 1 <0.05 Change in Animal Behavior 30.0 34.2 0.456 1 >0.05 Increase in Air Temperature 21.8 48.6 19.269 1 <0.001 Increase in Droughts 17.5 31.1 6.048 1 <0.05
0
20
40
60
80
100
% o
f ‘y
es’ r
esp
on
ses
Pre-storms Post-storms
**
**
***
* *
*
***
**
* p<0.05
**p<0.01
*** p<0.001
59
Table 37. Comparison of scores on the Anthropogenic Impact scale (1 to 10) between the pre- and post-storms period.
Period N Minimum Maximum Mean St. Dev.
Time 1 202 0.00 10.00 4.3663 2.40117
Time 2 66 0.00 10.00 5.5455 2.17101
U = 4481, p<0.001
Analyses comparing pre- and post-storms periods with regard to the job satisfaction components and happiness scale values can be found in Table 38. Comparisons were statistically significant for the Basic Needs and Health components, with fishers scoring lower on both components during the post-storms when compared to the pre-storms period.
Table 38. Comparisons of pre- and post-hurricanes job satisfaction and happiness mean scores.
Variable Period N Mean St. Dev. t df p
Basic Needs Pre 192 0.175 0.897
Post 66 -0.520 1.106 5.103 256 <0.001
Self-actualization Pre 192 -0.038 0.968
Post 66 0.185 1.077 -1.566 256 >0.05
Health Pre 192 0.087 0.949
Post 66 -0.364 1.073 3.218 256 0.001
Happiness Scale Pre 202 9.307 1.291
Post 74 9.459 1.435 -0.843 274 >0.05
Discussion Surveys with 75 fishers in different communities in the Northeast, East, Southeast, and Southwest regions of
Puerto Rico eight months after hurricane Maria made landfall (May – June 2018) provided valuable information
regarding the impacts of the storms (Irma and Maria) on fishers and fisheries on the island and allowed for
comparisons between the two time periods that reveal important information about the effects of coastal
hazards on coastal communities’ perceived vulnerability to change.
Similar to findings in part one of this report, most fishers in the sample depended heavily on fisheries as a source
of income and nutrition for themselves and their families, and for the majority of them fishing was their only
occupation. In addition to their direct dependence on fisheries, findings suggest that fisheries is also an
important source of nutrition for members of the coastal communities at large, as most fishers interviewed said
they frequently give away fish to friends and family.
Although spiny lobster and queen conch were also the most significant target species among fishers interviewed
during the second data collection effort, the relative contributions of other species of finfish including many
species of reef fish were higher. This may be explained by different relative contributions of fishers from
different regions between the first and second time periods as well as seasonality.
While the environmental awareness indicators used in the pre-storms period were not replicated during the
second data collection, aspects of fisheries perceptions of the human impacts on the environment and the
climate were assessed. Results indicate that, overall, fishers present moderate to high levels of awareness
regarding the impacts of human activities on the marine environment and the climate.
60
In terms of the direct impacts of the hurricanes on the fishers and fisheries of Puerto Rico, the most significant
possessions to sustain damage or loss were fishers’ houses and fishing gear. Gear losses were most significant in
terms of severity with a high number of fishers reporting moderate to severe damage on average. Qualitative
data obtained during the second data collection effort suggests that the most frequent gear damage or losses
occurred to fishers who lost their traps during the storms. Trap fishers in Puerto Rico typically place their traps
on the ocean bottom and dive to them to retrieve fish and shellfish as opposed to lifting them out of the water.
Thus, even in the event of a hurricane, traps are not removed and secured, increasing the risk of damage and
losses. Direct impacts of the storms in terms of frequency and severity of damage and losses were higher among
fishers in the East and Northeast coasts. This makes sense since communities in these regions were more
directly exposed and sustained more force from the hurricanes in general when compare to other parts of the
island.
Even eight months after hurricane Maria, levels of recovery reported by fishers can be characterized as
moderate. Although many fishers said they received assistance from FEMA/DUA, when asked about the most
important factors helping in their recovery, most fishers said that friends and family as well as their own self-
sufficiency were most significant. Fishers interviewed reported that some of their fellow fishers left Puerto Rico
after the storm. For those who stayed and did not consider leaving the most important reason for doing so was
their attachment to their homeland and communities as opposed to external impediments.
About half of the fishers interviewed said the storms affected the frequency with which they go out fishing as
well as their ability to give fish away to family and friends. Those fishing less after the storms said that lingering
bad weather and ocean conditions were the main reasons preventing them from going out as frequently.
Analysis of meteorological conditions could be used in future analyses of this data to test whether these findings
reflect objective or subjective perceptions of the impacts of the storms on the ability of fishers to go out at their
desired frequency.
Fishers in general reported no changes in target species or methods and gear types used. The most frequently
mentioned changes in the fishery after the storms were changes in fishing location. Fishers said they had to shift
fishing grounds to farther and deeper areas and many attributed location changes to the impacts of the storms
on the ocean bottom such as corals and seagrass beds destruction. Although results of the pre-storms data
collection suggest that fishers were already changing fishing grounds into farther and deeper waters to adapt to
change, it is possible that the impacts of the storms on coastal reefs and resources further contributed to the
issue.
Fishers interviewed during the post-storms period generally perceived the fishery resources to be in worse
shape when compared to before the impacts of the hurricanes. Data collected before and after the hurricanes
asking fishers to rate the health of fishery resources at the time the survey took place support this perception as
results show that fishers in the pre-storms period rated the fishery resources to be statistically significantly
healthier when compared to the post-storms period.
Other aspects of fishers’ perceptions of environmental and climatic changes differed significantly between the
pre- and post-storms periods. Overall perceptions that the climate is changing, changes to the marine
environment and species related to climate change, as well as concern for these changes all increased between
the pre- and post-storms periods. Specific factors related to anthropogenic and climate change impacts,
especially increase in frequency and intensity of storms, also became more important as factors affecting the
fisheries in the post-storms period. These findings suggest that fishers’ experiences during the recent natural
61
disasters had a significant effect on aspects of their perceived vulnerability to climate and environmental change
in general.
Comparisons between the pre- and post-storms assessments suggest that the hurricanes impacted fishers’ levels
of satisfaction with the Basic Needs and Health components of job satisfaction. Reported storm impacts on
fishers’ ability to fish and obtain income likely explain the decrease in satisfaction with Basic Needs, which
relates to income and independence. Lower scores on the Health component, which includes aspects of
healthfulness and fatigue, may be explained by the reported changes in fishing grounds, which is likely to
increase travel time, and potential changes in fishing effort to adapt to changed conditions. Despite the
significant impacts of the storms on fishers and fisheries in Puerto Rico, results of this study show that aspects of
the occupation relating to self-actualization as well as fishers’ happiness levels were not affected by these
natural disasters. These findings emphasize the notion that fishers derive a great deal of social and psychological
well-being from fisheries and this aspect of the occupation is likely to contribute positively to their resilience to
change and adversity.

62
Outreach Strategies
Introduction Research has shown that successful communication strategies utilized to increase stakeholder and community
understanding consist of a range of dissemination tools and include research summaries, policy briefs, electronic
and web-based outreach tools, and oral presentations (Mitton et al. 2007). This section of the report focuses on
the communication strategies utilized to share results of this study in order to increase stakeholder and
community understanding and support for coral reef fisheries health and well-being. In addition to the more
traditional methods of dissemination which included presentations at scientific conferences5 and the submission
of manuscripts, results of this project have also been shared more directly with Puerto Rico and Caribbean
community and fishery stakeholders through invitations to present at the Climate Change Summit organized by
Vice-President of the Senate Larry Seilhamer at the Puerto Rico Capital Building6, and at the Caribbean Fisheries
Management Council general meeting7. This report is also presented in a format favorable for the dissemination
of findings to different stakeholders, more specifically the scientific community and policy makers. One
particular concern we have had from the start of the development of this project regards communication and
outreach directly to the fishers in a format also appropriate for reaching the general public. In this section of the
report, the strategy we used for communicating findings with fishers is emphasized, since there is not much
information available on the best methods for communicating research findings to fishers. It was discovered
early in this research that traditional means such as written material, oral presentations, and formal meetings
were not the most effective strategies and, therefore, we decided to utilize a visual strategy, via video format, as
the primary dissemination tool.
A video format was selected because it is considered a powerful communication tool and can present
information that may be difficult to communicate in traditional format. Videos can provide messages about
issues of value to stakeholders in a more accessible format and reach a more diverse audience. Video formats
can prevent missed opportunities to share information when only print-based materials or scheduled
presentations are provided. Videos can also incorporate infographics, defined as a visualization of data, as a
method to communicate information to a targeted audience in a format that is easier to comprehend (Smiciklas,
2012). We also wanted to incorporate a participatory approach to the development of this outreach tool. To
accomplish that, we developed a method of ground truthing the video prior to its finalization by visiting
different fishing communities and sharing the initial draft of the video. During this process we asked fishers to
provide input and feedback that could be incorporated into the final version of the video. The details of the
methodology used to develop and ground truth the video outreach strategy is outlined below.
Methodology The video script was developed to specifically communicate with fishers and the general public as the target
audience. The script included: an introduction to the project, results for attributes of the fishers interviewed
including major species targeted and gear utilized, fishers’ perceptions of climate change and aspects of fisheries
5 Including to date oral presentations at: The Society for Applied Anthropology Annual Meeting, Santa Fe NM (2017), The Coastal & Estuarine Research Federation Biannual Meeting, Providence RI (2017), The Tenth International Conference on Climate Change: Impacts & Responses, Berkeley CA (2018), The 7th International Conference on Environmental Future: Humans and Island Environments, Honolulu, HI (2018), and The Society for Applied Anthropology Annual Meeting, Philadelphia PA (2018). 6 San Juan, June 2018. 7 US Virgin Islands, August 2018.
63
governance, and a conclusion. The video script in English is presented below in full. The video was also created
and made available in Spanish.
The Script
Introduction: Coral reefs are considered one of the most diverse and productive ecosystems on Earth. Healthy
coral reefs are essential to the people of Puerto Rico. Many generations of fishers have depended on coral reef
organisms to provide income and household nutrition. However, the coral reef ecosystems in Puerto Rico are
under threat due to a number of human impacts including climate change. Our changing climate has resulted in
warmer ocean temperatures which cause coral bleaching and potential coral death. The loss of coral affects
other species that depend on the reef, and also the fishers, their livelihoods, and way of life.
Attributes of fishers: To gain knowledge about Puerto Rico fishers’ perceptions of environmental change,
specifically about our changing climate, researchers spent the summer of 2016 interviewing 212 local fishers.
Individuals interviewed lived and fished in different geographic regions and included 54 from the East coast, 28
from the South coast, 42 from the North coast, and 88 from the West coast. 3.5 out of 5 fishers interviewed
considered themselves to be full-time commercial fishers, 1.2 out of 5 were part-time fishers, and less than 1
out of 5 were recreational fishers. The average age of the fishers interviewed was 50 and the average fishing
experience was 36 years.
Major species targeted and gear used: In order to determine if the fishers felt their occupations were being
impacted by climate change, the researchers asked a number of questions about their professions including
questions about targeted species, gear utilized, and the geographic areas where they fished. In the West, target
species fishers said most frequently to be the most important for their incomes were spiny lobster and silk
snapper, and fishers most frequently used scuba diving, seine nets, and traps to capture these species. In the
North, the most valuable species were snappers in general, specifically the yellowtail snapper, and king mackerel
and the most important gear types were rod and reel, gillnet, scuba diving, and harpoon. Along the East coast,
the most valuable target species for income were spiny lobster, queen conch, and yellowtail snapper, and the
most frequent gears used were scuba diving, traps, handline, and harpoon. Along the South coast the top
species contributing to fishers’ incomes were silk snapper, queen conch, lane snapper, and whitemouth croaker
and fishers most frequently used traps, handline, and nets to capture these species. Researchers consulted with
coral reef fishery biologists who suspect that warming waters may extend the spawning seasons for some
species, specifically conch and red hind.
Perceptions of climate change: 3.6 out of 5 fishers believe that the climate in Puerto Rico is changing, and their
concern with climate change is considered moderate to high. Some fishers reported that they had to make
changes in their fishery because of climate change. Such changes include: changing fishing grounds, changing
the type of gear or species they target, fishing in deeper water or fishing further away from the shore, having to
change the time of day they fish, needing better equipment, and having to increase their effort. The fishers
interviewed also felt that the fisheries were at risk due to other environmental stressors. 4.6 out of 5 of the
fishers feel that the fishery is at risk due to pollution, 4.2 out of 5 of the fishers think coral bleaching is a threat,
and 3 out of 5 believe increasing sea temperatures are affecting the fishery. A majority of fishers also felt that if
corals die, it will be bad for fishing.

64
Governance: The majority of the fishers (4.2 out of 5) believe that fishers and government authorities should
work together to manage the fishery resources. However, fishers feel that currently they are not able to
participate and provide their input when decisions are made.
Conclusion: Climate change is a serious threat to coral reefs and marine organisms. Fishers are concerned about
climate change because this threat can affect their jobs and their livelihoods. The fishers we interviewed have a
strong passion for what they do and they are aware that threats such as pollution and coral bleaching must be
addressed. Scientists and managers are also concerned about these threats. Solutions will require collaboration
between fishers, government agencies, and scientists and also other stakeholders and members of the
community. Each one of these parties have important knowledge that must be shared and used to create better
strategies to protect the coral reef ecosystems and conserve and manage fishery resources. By working
together, we can all contribute to a healthier future for the environment and the people of Puerto Rico.
Video Design
A collaborative approach was taken with the graphic design department at the University of New Haven in
Connecticut, who supported the project and agreed to incorporate a video assignment as a major term project
for an upper level course. Student groups were given the charge to develop custom graphics, infographics, and
animations to complement the script. Other parameters included minimal text and a five-minute time frame.
After viewing all preliminary projects at the end of the 2017 spring term, one senior student was selected to
complete the final project to be piloted in Puerto Rico during the summer of 2017. University faculty members,
both native Puerto Ricans, agreed to translate the script and narrate in Spanish.
As part of our outreach effort and participatory approach, we returned to Puerto Rico for 14 days during the
summer of 2017, visiting the four different regions and villas pesqueras sampled during the first data collection
phase and piloted the animation video with the aid of a tablet computer. The objective was to obtain fishers’
perceptions and feedback on the video content as well as their reception of this method as a means of
information dissemination and a tool for generating discussion. The video was shown face-to-face to individuals
and sometimes in a focus group format. Based on discussions with fishers, the video script and graphics were
modified to incorporate some of the necessary changes identified from the feedback received. A final version of
the video is available here.
Results
Participatory Approach
A total of 32 fishers watched the video, 13 individually and 19 in a focus group format, including 8 in the
Northeast, 10 in the East, 7 in the Southeast, and 7 in the Southwest. The video was well received by every fisher
who viewed it. Words used by fishers to describe the video include truthful, good, and powerful (muy fuerte).
Several fishers stated it was an effective way of communicating information. Fishers commented that it was
important and interesting to learn about fishers in other regions, targeted species, and gear utilized. Fishers
stated that viewing the video made them feel connected to a larger community of fishers, many who expressed
similar concerns. For instance one fisher stated “the video gives us a voice.” A sense of pride was observed
when, for instance, a fisher pointed at the screen to indicate his region, and others shared pictures or personal
videos of an impressive catch afterwards. A common recommendation expressed by several fishers was the
need to include other stakeholders in the video segment about collaboration. While the fishers and the
government are often considered key stakeholders, there are many others to consider, including the people
who want to eat fresh fish at a restaurant. A fisher stated:
65
“They all should be included in the video. We all love to eat fresh fish but nobody wants to let us fish.”
Another indicator of video approval was fishers who enthusiastically gave their e-mail addresses so that they
could receive a link and share the video with other fishers, friends, and family. This happened with fishers who
held high committee positions (vice president, president, secretary) within the villa pesqueras as well as those
who did not.
Ground Truthing
The process of showing the video initiated discussion about the findings and other issues and concerns the
fishers had. The video script was designed to report the findings of fishers’ perceptions of climate change and
several agreed that this was the most important aspect of the video. Fishers that SCUBA dive reiterated that
they see a lot of dead, dying, and bleached corals. The fishers felt the video validated their local ecological
knowledge by sharing how long and how often they are around the coral reefs:
“I have seen the changes in the environment in the last ten years.”
“We see the changes out there every day.”
“We have knowledge but they are not interested.”’
A majority of fishers also expressed concern about the impacts of pollution affecting the local ecosystems,
specifically the reefs, and how this impacts their livelihoods. Pollution was characterized as litter, chemicals
released during dredging (in the Northeast), sewage, and engine oil. Increased Sargassum, the invasion of
lionfish (Pterois volitans and Pterois miles), and the use of gillnets were other concerns. These concerns were
perceived as having a negative effect on the coral reefs and fisheries. Other stakeholders (e.g. boaters) were
discussed including damage from individuals who anchor recreational vessels at reefs:
“Too many pleasure boats in the water polluting and damaging the corals with their anchors.”
Tension between commercial and recreational fishers was another concern mentioned by several fishers who
viewed the video. These two “communities” are considered separate and while several fishers stated they did
not believe there was a great deal of conflict between the two, there is, at times, animosity. Recreational fishers
do not need to obtain a license, pay for permits, or provide information about their catches (statistics). While
licensed commercial fishers have to adhere to limits and regulation, recreational fishers do not. Recreational
fishers may sell their catch, even when they know they are not supposed to. A few fishers mentioned that when
recreational fishers sell the catch for less than the market price, it has a negative effect on the commercial
fishers. Some fishers also mentioned tensions between the tourism sector, fishers, and government interests,
especially in the East where there is conflict over coastal land use.
Fishers expressed a willingness to collaborate with decision-makers in management decisions. One fisher
commented this was the most important aspect of the video. Several fishers stated it was difficult to deal with
the government. Changes in government staff, strict regulations, and regulations that change every few years
were reasons expressed. Fishers also commented on the commercial licensing system which magnifies the
challenges faced because it is bureaucratic and can be difficult to obtain. Regulations, especially fishery closures
were considered positive and helped the resource, especially for conch and spiny lobster limits. However,
regulation limits on incidental catch (bycatch), especially for deep water fish that were discarded dead, were
considered unfair.

66
Conclusions Communicating information between stakeholders in a relatable format can inform, generate important
discussion, and result in stronger stakeholder relationships. Results of the video effort indicate that fishers are
supportive of visual learning methods as a strategy for information sharing. In fact, a majority of fishers
expressed an interest in learning the results of this interview and survey data. This method of information
sharing may be met with higher acceptance and compliance by fishers, thus resulting in more effective
management for increasing sustainability and well-being in fishing communities.
67
Policy Recommendations A socioeconomic assessment of individuals engaged in fishing activities in Puerto Rico’s coral reef areas was
completed in order to obtain information valuable for addressing the challenges associated with fisheries
management and coral reef conservation under climate change. This section of the report provides
management and policy recommendations that focus on supporting resilience and well-being at the local scale
while safeguarding the sustainability of coral reef fishery resources. We utilized a participatory approach to
conducting this socioeconomic assessment, therefore ensuring that stakeholders’ major priorities and concerns
were effectively considered and addressed. While we have addressed policy considerations and provided
information useful for the application of our findings into fisheries policy and management throughout our final
report and other outreach materials, the following represent some of our specific recommendations:
A. Maximize involvement of fishers in the policy decision making process. Stakeholders’ involvement should
be participatory and take into account local ecological knowledge.
Fishers have expressed a willingness to collaborate with decision-makers in management decisions, but find
it difficult. As evidence by conversations with our stakeholders, fishers feel they do not have a voice when
decision-makers are identifying problems and developing solutions. When a group of stakeholders expect
their voices will be ignored, they may be less likely to be involved in the planning process. We recommend
implementing strategies to increase involvement and meaningful engagement of the individuals most
affected by these issues. Strategies should be put in place to reach the fishing communities more broadly as
opposed to those individual fishers who already attend meetings and are more vocal in the decision-making
process. While those individuals can be important leaders in the policy process, it is important not to
alienate others. During key informant interviews and conversations with fishers, it became clear that many
of them view decision makers, managers, scientists, and government agents as distant and removed.
Increasing involvement includes:
Creating opportunities for face-to-face communication with fishers from each region. We recommend
that more face-to-face communications should take place at the villas pesqueras.
Developing strategies to allow fishers to share their knowledge and concerns. Periodic interactions
through annual surveys and interviews, informal meetings, and the establishment of a more direct line
of communication for fishers would increase opportunities to engage in active participation.
B. Develop strategies to increase collaboration between stakeholders by focusing on unifying concerns
identified as important issues by different groups of stakeholders.
Interactions between policy makers, scientists, government officials, and fishers typically occur to address
issues that are fishery related. Yet, as evidenced by our key informant interviews, different stakeholder
groups share concerns about a number of broader environmental issues including algal blooms, pollution,
and coral bleaching. When opportunities arise, we recommend utilizing common issues of concern to
increase collaboration among various stakeholders. Measures that focus on areas of agreement can
facilitate communication, help build trust, and lead to circumstances more favorable to address issues of
more divergent nature.

68
C. Develop a plan to increase adaptation and resilience of Puerto Rico’s fishers and coastal communities to
climate change.
Environmental and especially climate change awareness among fishers is higher than perceived by some of
the key informants we interviewed who represent government and other institutions working directly and
indirectly with fisheries management. Fishers are aware of and concerned about the impacts of
environmental change on their overall well-being. One of our key informants, a president of a fishing
association, stated that very little has been done to understand the impacts of climate change on fishers and
fishing communities and that Puerto Rico and the Caribbean at large are in urgent need of a plan for
adapting to the impacts of climate change. Other stakeholders shared concerned about the lack of
preparation and designated adaptation strategies in place for fishers and coastal communities. For these
reasons, we recommend that a strategic plan for climate change adaptation, that is specific to fishing and
coastal communities, is developed in collaboration with fishers and fishery stakeholders.
D. Reassess the fishery licensing system to better reflect local fishing practices.
Fishers do not perceive the current licensing system to be adequate and in line with their actual practices.
The current licensing system in Puerto Rico requires that fishers provide proof of income deriving from
fishing in the form of tax documentation in order to be considered eligible for either part- or full-time fishing
licenses. As shown by previous research (see Garcia-Quijano et al. 2015, Griffith and Valdes-Pizzini 2002) and
evidenced by our findings, the fishery sector in Puerto Rico has been historically characterized by
occupational multiplicity with many fishers practicing the activity to complement their income and overall
well-being. This practice may be in conflict with the current licensing system, therefore unintentionally
creating an incentive for unlicensed and, thus, under- or unreported fishing activity. Further, recreational
fishers currently do not need a license to fish in Puerto Rico. Commercial fishers are aware that many
unlicensed fishers often sell their catch. During interviews, some stakeholders in the fishery sector stated
that, although they perceive this system as unfair, they understand that some people need to fish and they
are often unable to obtain a license either because they are unable to document their activities or because
they do not fish frequently enough to qualify for a commercial license. One owner of a fish market we
interviewed stated that about half of the fishers selling fish to his market do not have licenses, but he said
he knows that they depend on this income and therefore he accepts it.
One of the most significant challenges previously identified as hindering the adequate management of
fisheries in Puerto Rico (Garcia-Quijano 2009) is the lack of trust between fishers and government agencies
responsible for managing the fisheries. Friction between the two parties can lead to lack of support and non-
compliance by resource users which consequently affects the quality of the data provided which, in turn,
impacts the effectiveness of the management strategies implemented. Reassessing the licensing system to
better account for local practices and occupational multiplicity would be an important step to improve the
relationship between fishers and management authorities and will likely also better reporting and statistics,
thus improving fishery management strategies in Puerto Rico.
69
E. Incorporate more diversified strategies to share knowledge with fishers on a regular basis.
During the course of this study we talked to many fishers who expressed willingness to share more
information with researchers and managers. However, many perceive that, when they do, outcomes of this
process are not adequately shared with them. We encountered instances in which this perception led to
fishers believing that the government authorities use the information shared by fishers to create rules and
regulations to hurt them and, thus, many no longer wish to partake in collaborations with managers or
researchers. We believe implementing better and more consistent strategies to communicate and report
findings to fishers is important for the development and maintenance of a more trustful and fruitful
relationship. For instance, in this research we used a video format as the primary dissemination tool and we
found this to be an adequate way to communicate results and initiate conversations about such results with
the fishers. Different communication tools can help present information that may be difficult to
communicate in more traditional format. Strategies that can provide information about issues of value to
stakeholders delivered in an accessible format help prevent missed opportunities to share information.
70
References Appeldoorn, R. S. 2008. Transforming reef fisheries management: Application of an ecosystem-based approach
in the USA Caribbean. Environmental Conservation 35 (3): 232-241.
Appeldoorn, R., J. Beets, J. Bohnsack, S. Bolden, D. Matos, S. Meyers, A. Rosario, Y. Sadovy, and W. Tobias. 1992. Shallow water reef fish stock assessment for the U.S. Caribbean. NOAA Technical Memorandum NMFS/SEFSC/304. 70 p.
Appeldoorn, R., P. Yoshioka, D. Ballantine. 2009. Coral reef ecosystem studies: Integrating science and management in the Caribbean. Caribbean Journal of Science 45 (2-3): 134-137.
Baker A. C., C. J. Starger, T. R. McClanahan, and P. W. Glynn. 2004. Corals' adaptive response to climate change. Nature 430: 741.
Baker A. C., P. W. Glynn, and B. Riegl. 2008. Climate change and coral reef bleaching: An ecological assessment of long-term impacts, recovery trends and future outlook. Estuarine, Coastal, and Shelf Science 80: 435-471.
Baker, A. C. 2014. Climate Change: Many Ways to Beat the Heat for Reef Corals. Current Biology 24 (24): R1166-R1168.
Binkley, M. 1995. Risks, dangers, and rewards in the Nova Scotia offshore fishermen. Montreal: McGill-Queen’s University Press.
Burke, L., K. Reytar, M. Spalding, and A. Perry. 2011. Reefs at Risk Revisited. Washington, DC, USA: World Resources Institute.
Crawford, B. 2002. "Seaweed Farming: And Alternative Livelihood for Small-Scale Fishers?" University of Rhode Island, Online at: www.crc.uri.edu/download/Alt_Livelihood.pdf.
Doney, S. C. 2006. The dangers of ocean acidification. Scientific American 294 (3): 58-65.
García-Quijano C. G. 2009. Managing Complexity: Ecological Knowledge and Success in Puerto Rican Small-Scale Fisheries. Human Organization 68 (1): 1-17.
Garcia-Quijano, C., J. J. Poggie, A. Pitchon, and M. Del Pozo. 2015. Coastal resource foraging, life satisfaction, and well-being in Southeastern Puerto Rico. Journal of Anthropological Research 71(2): 145-167.
Glynn, P.W. 1993. Coral reef bleaching: ecological perspectives. Coral Reefs 12: 1-17.
Griffith, D., and M. Valdes- Pizzini. 2002. Fishers at work, workers at sea – A Puerto Rican journey through labor and refuge. Philadelphia, PA: Temple University Press. 265 p.
Hernández-Delgado E. A., M. Shivlani, and A. M. Sabat. 2014. Ecosystem-Based and Community-Based Model Integration to Designate Coral Reef No-Take Marine Protected Areas: A Case Study from Puerto Rico. Natural Resources 5: 538-560.
Heron, S., J. Morgan, M. Eakin, and W. Skirving. 2008. Hurricanes and their Effects on Coral Reefs in Wilkinson, C., D. Souter (Eds), Status of Caribbean coral reefs after bleaching and hurricanes in 2005. Global Coral Reef Monitoring Network, and Reef and Rainforest Research Centre, Townsville, 152 p.
Hoegh-Guldberg, O. 1999. Climate change, coral bleaching and the future of the world's coral reefs. Marine and Freshwater Research 50 (8): 839-866.
Hoegh-Guldberg, O., P. J. Mumby, A. J. Hooten, R. S. Steneck, P. Greenfield, E. Gomez, C. D. Harvell, P. F. Sale, A. J. Edwards, K. Caldeira, N. Knowlton, C. M. Eakin, R. Iglesias-Prieto, N. Muthiga, R. H. Bradbury, A. Dubi, and M. E. Hatziolos. 2007. Coral Reefs under Rapid Climate Change and Ocean Acidification, Science 318: 1737-1742.

71
Hughes T. P., M. J. Rodrigues, D. R. Bellwood, D. Ceccarelli, O. Hoegh-Guldberg, L. McCook, N. Moltschaniwskyj, M. S. Pratchett, R. S. Steneck, B. Willis. 2007. Phase Shifts, Herbivory, and the Resilience of Coral Reefs to Climate Change. Current Biology 17 (4): 360-365.
Hughes, T. P., A. H. Baird, D. R. Bellwood, M. Card, S. R. Connolly, C. Folke, R. Grosberg, O. Hoegh-Guldberg, J. B. C. Jackson, J. Kleypas, J. M. Lough P. Marshall, M. Nystrom, S. R. Palumbi, J. M. Pandolfi, B. Rosen, and J. Roughgarden. 2003. Climate Change, Human Impacts, and the Resilience of Coral Reefs. Science 301: 929-933.
Karl, T.R., J.M. Melillo, and T.C. Peterson (eds.). 2009. Global Climate Change Impacts in the United States. Cambridge University Press, New York, 196 pp.
Kleypas, J. A., R. W. Buddemeier, D. Archer, J. Gattuso, C. Langdon, and B. N. Opdyke. 1999. Geochemical consequences of increased atmospheric carbon dioxide on coral reefs. Science 284 (5411): 118-120.
Marshall, N. A., D. M. Fenton, P. A. Marshall, and S. G. Suton. 2007. How resource dependency can influence social resilience within a primary resource industry. Rural Ecology 72(3): 359-390.
Matos-Caraballo, D. 2009. Lessons Learned from the Puerto Rico’s Commercial Fishery, 1988 – 2008. Proceedings of the Gulf and Caribbean Fisheries Institute 61: 123-129.
Matos-Caraballo, D. and J. J. Agar. 2011. Census of Active Commercial Fishermen in Puerto Rico: 2008. Marine Fisheries Review 73 (1): 13-27.
McCay, B. J., S. Brandt, and C. F. Creed. 2011. Human dimensions of climate change and fisheries in a coupled system: The Atlantic surfclam case. ICES Journal of Marine Science 68 (6): 1354-1367.
Melillo, J.M., T.C. Richmond, and G.W. Yohe (eds). 2014. Climate Change Impacts in the United States: The Third National Climate Assessment. U.S. Global Change Research Program, 841 pp.
Mitton, C., C.E. Adair, E. McKenzie, S.B. Patten, and P.B. Waye. 2007. Knowledge transfer and exchange: review and synthesis of the literature. Milbank Q, 85 :729 - 68
Moberg, F., and C. Folke. 1999. Ecological goods and services of coral reef ecosystems. Ecological Economics 29: 215-233.
Mora, C. 2008. A Clear Human Footprint in the Coral Reefs of the Caribbean. Proceedings of the Royal Society B 275 (1636): 767-775.
Morelock, J., W.R. Ramirez, A.W. Bruckner, and C. Milton. 2005. Status of Coral Reefs Southwest Puerto Rico. Online at: http://www.aoml.noaa.gov/general/lib/CREWS/Cleo/PuertoRico/prpdfs/morelock-statuscoral.pdf
Mumby P. J., A. Hastings, and H. J. Edwards .2007. Thresholds and the resilience of Caribbean coral reefs. Nature 450: 98-101.
Mumby, P. J., A. J. Edwards, J. E. Arias-González, K. C. Lindeman, P. G. Blackwell, A. Gall, M. I. Gorczynska, A. R. Harborne, C. L. Pescod, H. Renken, C. C. C. Wabnitz, and G. Llewellyn. 2004. Mangroves Enhance the Biomass of Coral Reef Fish Communities in the Caribbean Nature 427: 533-536.
Mumby, P. J., N. H. Wolff, Y. Bozec, I. Chollett, and P. Halloran. 2014. Operationalizing the resilience of coral reefs in an era of Climate Change. Conservation Letters 7(3): 176-187.
Nellemann, C., S. Hain, and J. Alder. 2008. In Dead Water: Merging of Climate Change with Pollution, Over-Harvest, and Infestations in the World’s Fishing Grounds. GRID-Arendal, Norway: United Nations Environment Programme.
NOAA (National Oceanic and Atmospheric Administration). 2018. Coral Reef Information System. Online at: https://www.coris.noaa.gov/portals/puertorico.html

72
NOEP (National Oceans Economics Program). 2014. State of the U.S. Ocean and Coastal Economies. Online at:
https://webgate.ec.europa.eu/maritimeforum/sites/maritimeforum/files/NOEP_National_Report_2014.pdf
Pinsky, M.L., and N.J. Mantua. 2014. Emerging adaptation approaches for climate-ready fisheries management. Oceanography 27(4), 146-159.
Pollnac, R. B. and John J. Poggie. 2008. Happiness, well-being, and psychocultural adaptation to the stresses associates with marine fishing. Human Ecology Review 15(2): 194-200.
Pollnac, R. B. T. Seara, and L. L. Colburn. 2015. Aspects of fishery management, job satisfaction, and well-being among commercial fishermen in the Northeast Region of the United States. Society & Natural Resources 28(1): 75-92.
Pollnac, R. B., and John J. Poggie. 1988. The structure of job satisfaction among New England fishermen and its application to fisheries management policy. American Anthropologist 90(4): 888-901.
Pollnac, R. B., R. S. Pomeroy, and I. H. T. Harkes. 2001. Fishery policy and job satisfaction in three Southeast Asian fisheries. Ocean & Coastal Management 44(7-8): 531-544.
Pollnac, R. B., S. Abbott-Jamieson, C. Smith, M. Miller, P. Clay, and B. Oles. 2008. Toward a model for fisheries social impact assessment. Marine Fisheries Review 68(1-4): 1-18.
Seara, T., R. Pollnac, J. Poggie, C. Garcia-Quijano, I. Monnereau, and V. Ruiz. 2017a. Fishing as therapy: Impacts
on job satisfaction and implications for fishery management. Ocean & Coastal Management 141: 1-9.
Seara, T., R. Pollnac, and J. Poggie. 2017b. Changes in Job Satisfaction through Time in Two Major New England
Fishing Ports. Journal of Happiness Studies 18 (6): 1625-1640.
Smiciklas, M. 2012. The Power of Infographics: Using pictures to communicate and connect with your audiences. Indianapolis,Indiana,Que Publishing, 199 pp.
Smith, C., and P. M. Clay. 2010. Measuring Subjective and Objective Well-Being: Examples from Five Commercial Fisheries. Human Organization 69(2):158-168.
Sumaila, U.R., W.W.L. Cheung, V.W.Y. Lam, D. Pauly, and S. Herrick. 2011. Climate change impacts on the biophysics and economics of world fisheries. Nature Climate Change 1, 449-456.
Tonioli, F. and J. Agar. 2009. Extending the Bajo de Sico, Puerto Rico, seasonal closure: An examination of small-scale fishermen's perceptions of possible socio-economic impacts on fishing practices, families and community. Marine Fisheries Review 71 (2): 15-23.
USDA. 2012. 2012 Census Publications. Retrieved from: https://www.agcensus.usda.gov/Publications/2012/Online_Resources/County_Profiles/Puerto_Rico/
Valdés-Pizzini, M., C. G. García-Quijano, and M. T. Schärer-Umpierre. 2012. Connecting humans and ecosystems in tropical fisheries: Social sciences and the Ecosystem-Based Fisheries Management in Puerto Rico and the Caribbean. Caribbean Studies 40 (2): 95-128.
Wilkinson, C., D. Souter. 2008. Status of Caribbean coral reefs after bleaching and hurricanes in 2005. Global Coral Reef Monitoring Network, and Reef and Rainforest Research Centre, Townsville, 152 p.
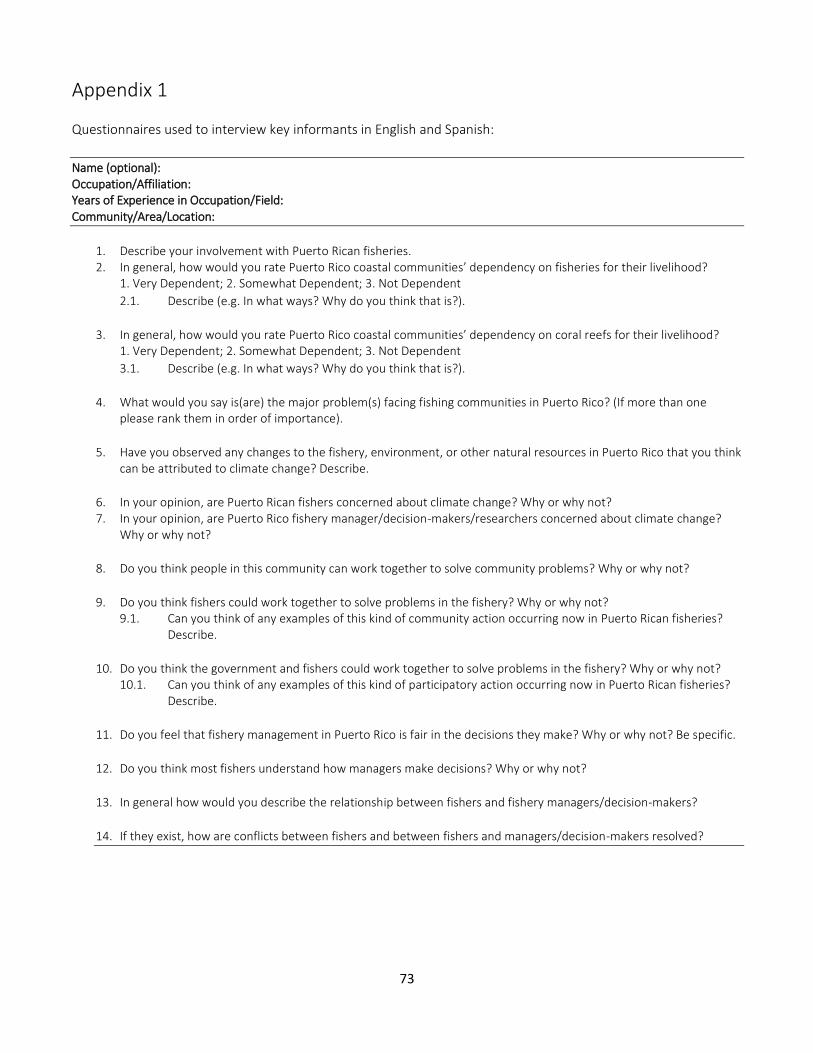
73
Appendix 1 Questionnaires used to interview key informants in English and Spanish:
Name (optional): Occupation/Affiliation: Years of Experience in Occupation/Field: Community/Area/Location:
1. Describe your involvement with Puerto Rican fisheries. 2. In general, how would you rate Puerto Rico coastal communities’ dependency on fisheries for their livelihood?
1. Very Dependent; 2. Somewhat Dependent; 3. Not Dependent
2.1. Describe (e.g. In what ways? Why do you think that is?).
3. In general, how would you rate Puerto Rico coastal communities’ dependency on coral reefs for their livelihood? 1. Very Dependent; 2. Somewhat Dependent; 3. Not Dependent
3.1. Describe (e.g. In what ways? Why do you think that is?).
4. What would you say is(are) the major problem(s) facing fishing communities in Puerto Rico? (If more than one please rank them in order of importance).
5. Have you observed any changes to the fishery, environment, or other natural resources in Puerto Rico that you think can be attributed to climate change? Describe.
6. In your opinion, are Puerto Rican fishers concerned about climate change? Why or why not? 7. In your opinion, are Puerto Rico fishery manager/decision-makers/researchers concerned about climate change?
Why or why not?
8. Do you think people in this community can work together to solve community problems? Why or why not?
9. Do you think fishers could work together to solve problems in the fishery? Why or why not? 9.1. Can you think of any examples of this kind of community action occurring now in Puerto Rican fisheries?
Describe.
10. Do you think the government and fishers could work together to solve problems in the fishery? Why or why not? 10.1. Can you think of any examples of this kind of participatory action occurring now in Puerto Rican fisheries?
Describe.
11. Do you feel that fishery management in Puerto Rico is fair in the decisions they make? Why or why not? Be specific.
12. Do you think most fishers understand how managers make decisions? Why or why not?
13. In general how would you describe the relationship between fishers and fishery managers/decision-makers?
14. If they exist, how are conflicts between fishers and between fishers and managers/decision-makers resolved?
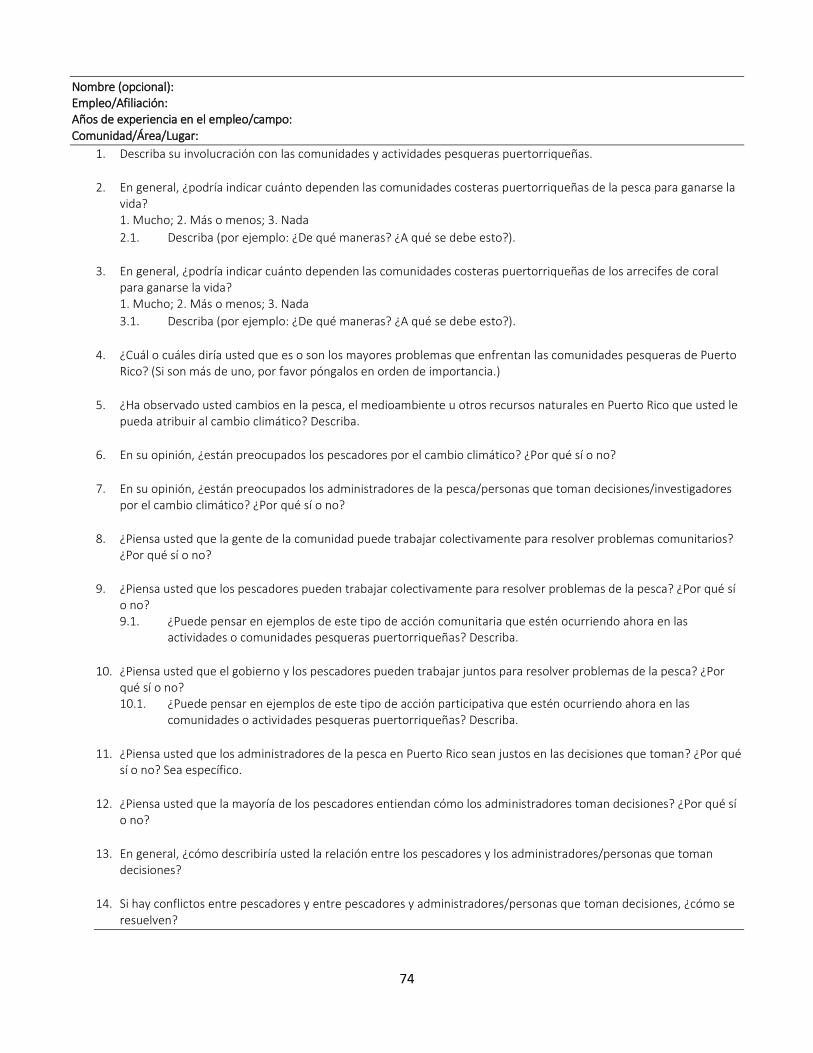
74
Nombre (opcional): Empleo/Afiliación: Años de experiencia en el empleo/campo: Comunidad/Área/Lugar:
1. Describa su involucración con las comunidades y actividades pesqueras puertorriqueñas.
2. En general, ¿podría indicar cuánto dependen las comunidades costeras puertorriqueñas de la pesca para ganarse la vida? 1. Mucho; 2. Más o menos; 3. Nada
2.1. Describa (por ejemplo: ¿De qué maneras? ¿A qué se debe esto?).
3. En general, ¿podría indicar cuánto dependen las comunidades costeras puertorriqueñas de los arrecifes de coral para ganarse la vida? 1. Mucho; 2. Más o menos; 3. Nada
3.1. Describa (por ejemplo: ¿De qué maneras? ¿A qué se debe esto?).
4. ¿Cuál o cuáles diría usted que es o son los mayores problemas que enfrentan las comunidades pesqueras de Puerto Rico? (Si son más de uno, por favor póngalos en orden de importancia.)
5. ¿Ha observado usted cambios en la pesca, el medioambiente u otros recursos naturales en Puerto Rico que usted le pueda atribuir al cambio climático? Describa.
6. En su opinión, ¿están preocupados los pescadores por el cambio climático? ¿Por qué sí o no?
7. En su opinión, ¿están preocupados los administradores de la pesca/personas que toman decisiones/investigadores por el cambio climático? ¿Por qué sí o no?
8. ¿Piensa usted que la gente de la comunidad puede trabajar colectivamente para resolver problemas comunitarios? ¿Por qué sí o no?
9. ¿Piensa usted que los pescadores pueden trabajar colectivamente para resolver problemas de la pesca? ¿Por qué sí o no? 9.1. ¿Puede pensar en ejemplos de este tipo de acción comunitaria que estén ocurriendo ahora en las
actividades o comunidades pesqueras puertorriqueñas? Describa.
10. ¿Piensa usted que el gobierno y los pescadores pueden trabajar juntos para resolver problemas de la pesca? ¿Por qué sí o no? 10.1. ¿Puede pensar en ejemplos de este tipo de acción participativa que estén ocurriendo ahora en las
comunidades o actividades pesqueras puertorriqueñas? Describa.
11. ¿Piensa usted que los administradores de la pesca en Puerto Rico sean justos en las decisiones que toman? ¿Por qué sí o no? Sea específico.
12. ¿Piensa usted que la mayoría de los pescadores entiendan cómo los administradores toman decisiones? ¿Por qué sí o no?
13. En general, ¿cómo describiría usted la relación entre los pescadores y los administradores/personas que toman decisiones?
14. Si hay conflictos entre pescadores y entre pescadores y administradores/personas que toman decisiones, ¿cómo se resuelven?
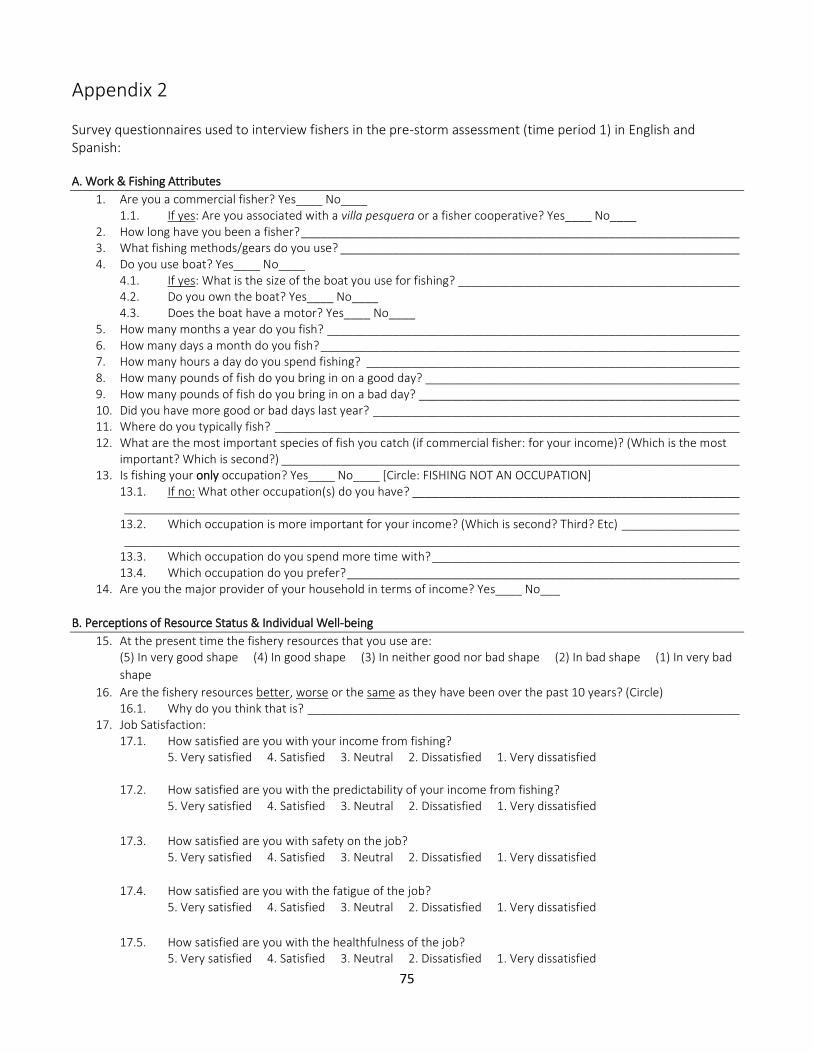
75
Appendix 2
Survey questionnaires used to interview fishers in the pre-storm assessment (time period 1) in English and Spanish: A. Work & Fishing Attributes
1. Are you a commercial fisher? Yes____ No____ 1.1. If yes: Are you associated with a villa pesquera or a fisher cooperative? Yes____ No____
2. How long have you been a fisher? ___________________________________________________________________ 3. What fishing methods/gears do you use? _____________________________________________________________ 4. Do you use boat? Yes____ No____
4.1. If yes: What is the size of the boat you use for fishing? ___________________________________________ 4.2. Do you own the boat? Yes____ No____ 4.3. Does the boat have a motor? Yes____ No____
5. How many months a year do you fish? _______________________________________________________________ 6. How many days a month do you fish? ________________________________________________________________ 7. How many hours a day do you spend fishing? _________________________________________________________ 8. How many pounds of fish do you bring in on a good day? ________________________________________________ 9. How many pounds of fish do you bring in on a bad day? _________________________________________________ 10. Did you have more good or bad days last year? ________________________________________________________ 11. Where do you typically fish? _______________________________________________________________________ 12. What are the most important species of fish you catch (if commercial fisher: for your income)? (Which is the most
important? Which is second?) ______________________________________________________________________ 13. Is fishing your only occupation? Yes____ No____ [Circle: FISHING NOT AN OCCUPATION]
13.1. If no: What other occupation(s) do you have? __________________________________________________ ______________________________________________________________________________________________ 13.2. Which occupation is more important for your income? (Which is second? Third? Etc) __________________ ______________________________________________________________________________________________ 13.3. Which occupation do you spend more time with? _______________________________________________ 13.4. Which occupation do you prefer? ____________________________________________________________
14. Are you the major provider of your household in terms of income? Yes____ No___
B. Perceptions of Resource Status & Individual Well-being
15. At the present time the fishery resources that you use are: (5) In very good shape (4) In good shape (3) In neither good nor bad shape (2) In bad shape (1) In very bad
shape
16. Are the fishery resources better, worse or the same as they have been over the past 10 years? (Circle) 16.1. Why do you think that is? __________________________________________________________________
17. Job Satisfaction: 17.1. How satisfied are you with your income from fishing?
5. Very satisfied 4. Satisfied 3. Neutral 2. Dissatisfied 1. Very dissatisfied
17.2. How satisfied are you with the predictability of your income from fishing? 5. Very satisfied 4. Satisfied 3. Neutral 2. Dissatisfied 1. Very dissatisfied
17.3. How satisfied are you with safety on the job? 5. Very satisfied 4. Satisfied 3. Neutral 2. Dissatisfied 1. Very dissatisfied
17.4. How satisfied are you with the fatigue of the job? 5. Very satisfied 4. Satisfied 3. Neutral 2. Dissatisfied 1. Very dissatisfied
17.5. How satisfied are you with the healthfulness of the job? 5. Very satisfied 4. Satisfied 3. Neutral 2. Dissatisfied 1. Very dissatisfied
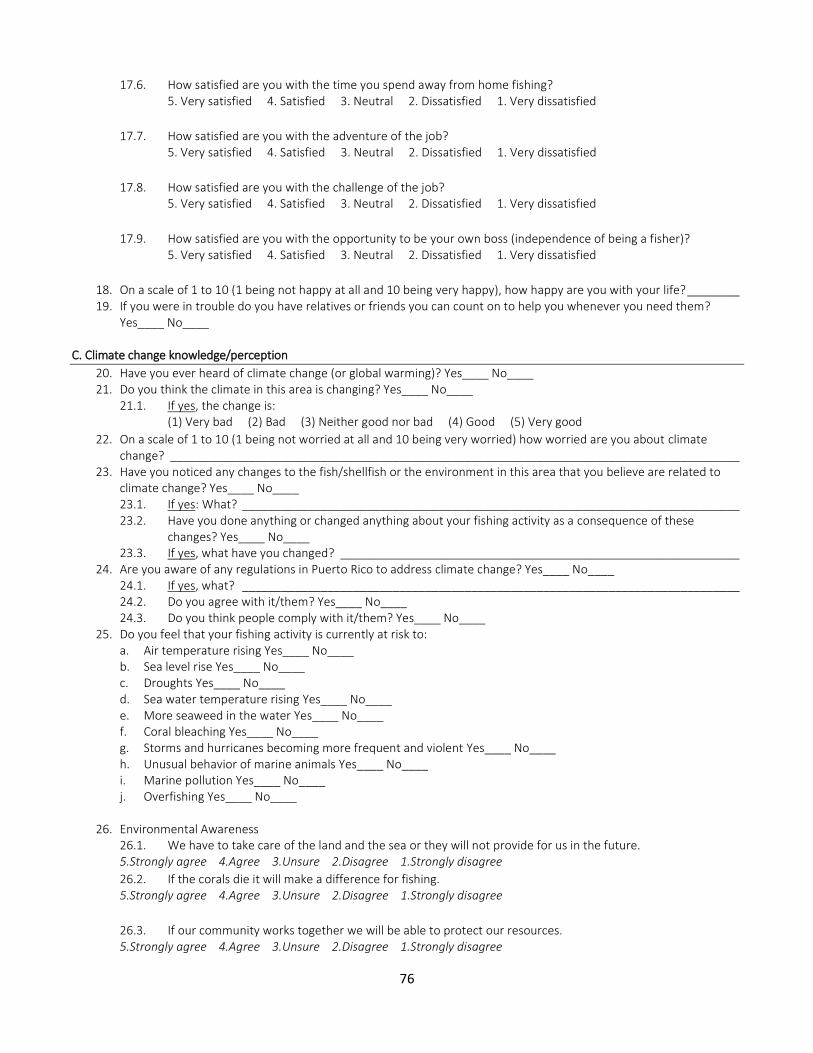
76
17.6. How satisfied are you with the time you spend away from home fishing? 5. Very satisfied 4. Satisfied 3. Neutral 2. Dissatisfied 1. Very dissatisfied
17.7. How satisfied are you with the adventure of the job? 5. Very satisfied 4. Satisfied 3. Neutral 2. Dissatisfied 1. Very dissatisfied
17.8. How satisfied are you with the challenge of the job? 5. Very satisfied 4. Satisfied 3. Neutral 2. Dissatisfied 1. Very dissatisfied
17.9. How satisfied are you with the opportunity to be your own boss (independence of being a fisher)? 5. Very satisfied 4. Satisfied 3. Neutral 2. Dissatisfied 1. Very dissatisfied
18. On a scale of 1 to 10 (1 being not happy at all and 10 being very happy), how happy are you with your life? ________ 19. If you were in trouble do you have relatives or friends you can count on to help you whenever you need them?
Yes____ No____ C. Climate change knowledge/perception
20. Have you ever heard of climate change (or global warming)? Yes____ No____ 21. Do you think the climate in this area is changing? Yes____ No____
21.1. If yes, the change is: (1) Very bad (2) Bad (3) Neither good nor bad (4) Good (5) Very good
22. On a scale of 1 to 10 (1 being not worried at all and 10 being very worried) how worried are you about climate change? _______________________________________________________________________________________
23. Have you noticed any changes to the fish/shellfish or the environment in this area that you believe are related to climate change? Yes____ No____ 23.1. If yes: What? ____________________________________________________________________________ 23.2. Have you done anything or changed anything about your fishing activity as a consequence of these
changes? Yes____ No____ 23.3. If yes, what have you changed? _____________________________________________________________
24. Are you aware of any regulations in Puerto Rico to address climate change? Yes____ No____ 24.1. If yes, what? ____________________________________________________________________________ 24.2. Do you agree with it/them? Yes____ No____ 24.3. Do you think people comply with it/them? Yes____ No____
25. Do you feel that your fishing activity is currently at risk to: a. Air temperature rising Yes____ No____ b. Sea level rise Yes____ No____ c. Droughts Yes____ No____ d. Sea water temperature rising Yes____ No____ e. More seaweed in the water Yes____ No____ f. Coral bleaching Yes____ No____ g. Storms and hurricanes becoming more frequent and violent Yes____ No____ h. Unusual behavior of marine animals Yes____ No____ i. Marine pollution Yes____ No____ j. Overfishing Yes____ No____
26. Environmental Awareness
26.1. We have to take care of the land and the sea or they will not provide for us in the future. 5.Strongly agree 4.Agree 3.Unsure 2.Disagree 1.Strongly disagree
26.2. If the corals die it will make a difference for fishing. 5.Strongly agree 4.Agree 3.Unsure 2.Disagree 1.Strongly disagree
26.3. If our community works together we will be able to protect our resources. 5.Strongly agree 4.Agree 3.Unsure 2.Disagree 1.Strongly disagree
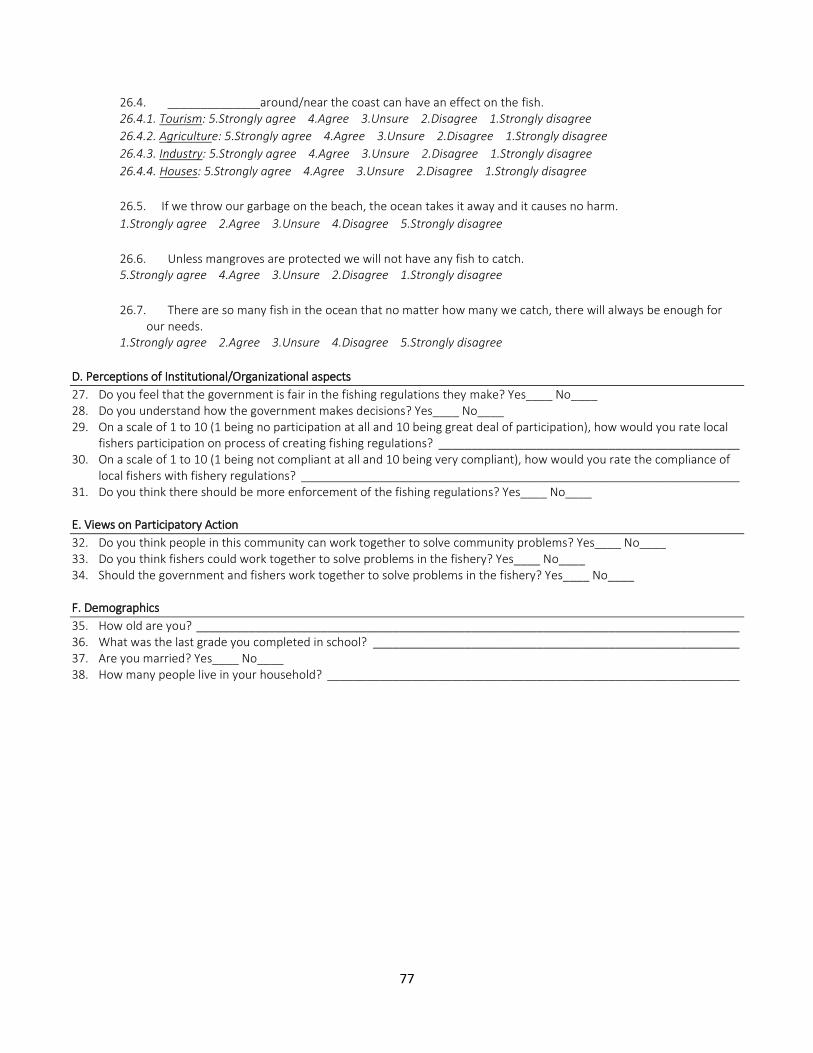
77
26.4. ______________around/near the coast can have an effect on the fish. 26.4.1. Tourism: 5.Strongly agree 4.Agree 3.Unsure 2.Disagree 1.Strongly disagree
26.4.2. Agriculture: 5.Strongly agree 4.Agree 3.Unsure 2.Disagree 1.Strongly disagree
26.4.3. Industry: 5.Strongly agree 4.Agree 3.Unsure 2.Disagree 1.Strongly disagree
26.4.4. Houses: 5.Strongly agree 4.Agree 3.Unsure 2.Disagree 1.Strongly disagree
26.5. If we throw our garbage on the beach, the ocean takes it away and it causes no harm.
1.Strongly agree 2.Agree 3.Unsure 4.Disagree 5.Strongly disagree
26.6. Unless mangroves are protected we will not have any fish to catch. 5.Strongly agree 4.Agree 3.Unsure 2.Disagree 1.Strongly disagree
26.7. There are so many fish in the ocean that no matter how many we catch, there will always be enough for our needs.
1.Strongly agree 2.Agree 3.Unsure 4.Disagree 5.Strongly disagree
D. Perceptions of Institutional/Organizational aspects
27. Do you feel that the government is fair in the fishing regulations they make? Yes____ No____ 28. Do you understand how the government makes decisions? Yes____ No____ 29. On a scale of 1 to 10 (1 being no participation at all and 10 being great deal of participation), how would you rate local
fishers participation on process of creating fishing regulations? ______________________________________________ 30. On a scale of 1 to 10 (1 being not compliant at all and 10 being very compliant), how would you rate the compliance of
local fishers with fishery regulations? ___________________________________________________________________ 31. Do you think there should be more enforcement of the fishing regulations? Yes____ No____ E. Views on Participatory Action
32. Do you think people in this community can work together to solve community problems? Yes____ No____ 33. Do you think fishers could work together to solve problems in the fishery? Yes____ No____ 34. Should the government and fishers work together to solve problems in the fishery? Yes____ No____ F. Demographics
35. How old are you? ___________________________________________________________________________________ 36. What was the last grade you completed in school? ________________________________________________________ 37. Are you married? Yes____ No____ 38. How many people live in your household? _______________________________________________________________
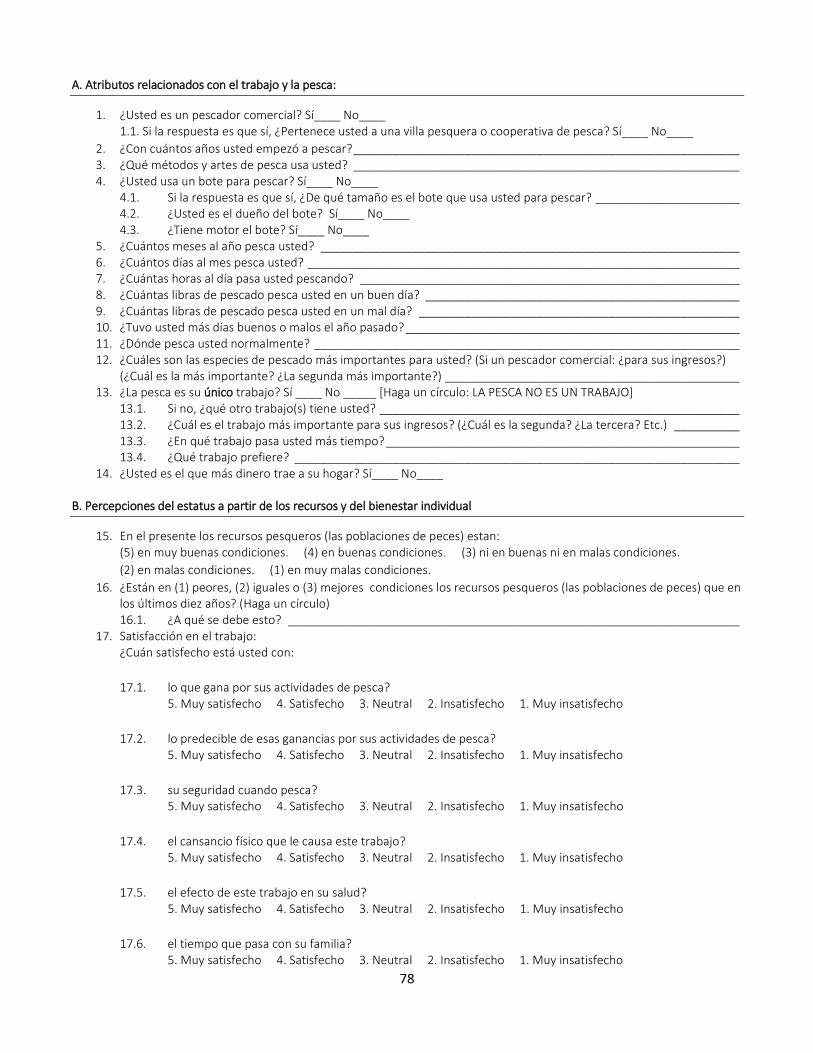
78
A. Atributos relacionados con el trabajo y la pesca:
1. ¿Usted es un pescador comercial? Sí____ No____ 1.1. Si la respuesta es que sí, ¿Pertenece usted a una villa pesquera o cooperativa de pesca? Sí____ No____
2. ¿Con cuántos años usted empezó a pescar? ___________________________________________________________ 3. ¿Qué métodos y artes de pesca usa usted? ___________________________________________________________ 4. ¿Usted usa un bote para pescar? Sí____ No____
4.1. Si la respuesta es que sí, ¿De qué tamaño es el bote que usa usted para pescar? ______________________ 4.2. ¿Usted es el dueño del bote? Sí____ No____ 4.3. ¿Tiene motor el bote? Sí____ No____
5. ¿Cuántos meses al año pesca usted? ________________________________________________________________ 6. ¿Cuántos días al mes pesca usted? __________________________________________________________________ 7. ¿Cuántas horas al día pasa usted pescando? __________________________________________________________ 8. ¿Cuántas libras de pescado pesca usted en un buen día? ________________________________________________ 9. ¿Cuántas libras de pescado pesca usted en un mal día? _________________________________________________ 10. ¿Tuvo usted más días buenos o malos el año pasado? ___________________________________________________ 11. ¿Dónde pesca usted normalmente? _________________________________________________________________ 12. ¿Cuáles son las especies de pescado más importantes para usted? (Si un pescador comercial: ¿para sus ingresos?)
(¿Cuál es la más importante? ¿La segunda más importante?) _____________________________________________ 13. ¿La pesca es su único trabajo? Sí ____ No _____ [Haga un círculo: LA PESCA NO ES UN TRABAJO]
13.1. Si no, ¿qué otro trabajo(s) tiene usted? _______________________________________________________ 13.2. ¿Cuál es el trabajo más importante para sus ingresos? (¿Cuál es la segunda? ¿La tercera? Etc.) __________ 13.3. ¿En qué trabajo pasa usted más tiempo? ______________________________________________________ 13.4. ¿Qué trabajo prefiere? ____________________________________________________________________
14. ¿Usted es el que más dinero trae a su hogar? Sí____ No____
B. Percepciones del estatus a partir de los recursos y del bienestar individual
15. En el presente los recursos pesqueros (las poblaciones de peces) estan: (5) en muy buenas condiciones. (4) en buenas condiciones. (3) ni en buenas ni en malas condiciones.
(2) en malas condiciones. (1) en muy malas condiciones.
16. ¿Están en (1) peores, (2) iguales o (3) mejores condiciones los recursos pesqueros (las poblaciones de peces) que en los últimos diez años? (Haga un círculo) 16.1. ¿A qué se debe esto? _____________________________________________________________________
17. Satisfacción en el trabajo: ¿Cuán satisfecho está usted con:
17.1. lo que gana por sus actividades de pesca? 5. Muy satisfecho 4. Satisfecho 3. Neutral 2. Insatisfecho 1. Muy insatisfecho
17.2. lo predecible de esas ganancias por sus actividades de pesca? 5. Muy satisfecho 4. Satisfecho 3. Neutral 2. Insatisfecho 1. Muy insatisfecho
17.3. su seguridad cuando pesca? 5. Muy satisfecho 4. Satisfecho 3. Neutral 2. Insatisfecho 1. Muy insatisfecho
17.4. el cansancio físico que le causa este trabajo? 5. Muy satisfecho 4. Satisfecho 3. Neutral 2. Insatisfecho 1. Muy insatisfecho
17.5. el efecto de este trabajo en su salud? 5. Muy satisfecho 4. Satisfecho 3. Neutral 2. Insatisfecho 1. Muy insatisfecho
17.6. el tiempo que pasa con su familia? 5. Muy satisfecho 4. Satisfecho 3. Neutral 2. Insatisfecho 1. Muy insatisfecho

79
17.7. el disfrute de la aventura de este trabajo? 5. Muy satisfecho 4. Satisfecho 3. Neutral 2. Insatisfecho 1. Muy insatisfecho
17.8. los retos de este trabajo? 5. Muy satisfecho 4. Satisfecho 3. Neutral 2. Insatisfecho 1. Muy insatisfecho
17.9. la oportunidad de ser su propio jefe (la independencia que le da el trabajo)? 5. Muy satisfecho 4. Satisfecho 3. Neutral 2. Insatisfecho 1. Muy insatisfecho
18. En una escala del 1 al 10 (con el 1 significando no feliz para nada y el 10 muy feliz), ¿cuán feliz está usted con su vida?_____ _____________________________________________________________________________________
19. Si usted tuviera un problema, ¿tiene familiares o amigos con los que pueda contar para que lo ayuden en cualquier momento que los necesite? Sí____ No____
C. Percepción o conocimiento del cambio climático
20. ¿Ha oído usted del cambio climático (o del calentamiento global)? Sí ____ No____ 21. ¿Piensa usted que el clima de esta área está cambiando? Sí ____ No ____
21.1. Si la respuesta es que sí, el cambio es: (1) muy malo (2) malo (3) ni bueno ni malo (4) bueno (5) muy bueno
22. En una escala del 1 al 10 (con el 1 significando no preocupado para nada y el 10 muy preocupado), ¿cuán preocupado está usted por el cambio climático? _____
23. ¿Ha notado usted cambios en los peces, mariscos o el ambiente de esta área que desde su punto de vista puedan estar relacionados con el cambio climático (o calentamiento global)? Sí ____ No ____ 23.1. Si la respuesta es que sí, ¿qué cambios ha notado? ______________________________________________ 23.2. Si la respuesta (23) es que sí, ¿ha hecho algo o cambiado algún aspecto de sus actividades de pesca como
resultado de los cambios de la pregunta anterior? Sí ____ No ____ 23.3. Si la respuesta (23) es que sí, ¿qué cambios ha hecho? ___________________________________________
24. ¿Sabe usted de algún reglamento en Puerto Rico para responder al cambio climático? Sí ____ No ____ 24.1. Si la respuesta es que sí, ¿de qué reglamento o reglamentos sabe usted? ___________________________ 24.2. ¿Está de acuerdo con él/ellos? Sí ____ No____ 24.3. ¿Cree usted que la gente lo/los obedece? Sí____ No____
25. ¿Le parece a usted que la pesca está en peligro debido: k. al aumento de la temperatura del aire? Sí____ No____ l. al aumento de los niveles del mar? Sí____ No____ m. a la sequía? Sí ____ No____ n. al aumento en la temperatura del agua del mar? Sí____ No____ o. al aumento de algas marinas? Sí____ No____ p. al emblanquecimiento de los corales? Sí____ No____ q. al aumento en la frecuencia y la violencia de las tormentas y los huracanes? Sí____ No____ r. a los cambios de comportamiento en animales marinos? Sí____ No____ s. a la contaminación marina? Sí____ No____ t. a la sobrepesca? Sí____ No____
26. Ética Ambiental: 26.1. Tenemos que cuidar la tierra y el mar o ellos no nos van a dar sustento en el futuro. 5.Totalmente de acuerdo 4.De acuerdo 3.Ni de acuerdo ni en desacuerdo 2.En desacuerdo 1.Totalmente en
desacuerdo
26.2. Si mueren los corales la pesca será afectada. 5.Totalmente de acuerdo 4.De acuerdo 3.Ni de acuerdo ni en desacuerdo 2.En desacuerdo 1.Totalmente en
desacuerdo
26.3. Si la comunidad trabaja junta, vamos a poder proteger nuestros recursos naturales. 5.Totalmente de acuerdo 4.De acuerdo 3.Ni de acuerdo ni en desacuerdo 2.En desacuerdo 1.Totalmente en
desacuerdo
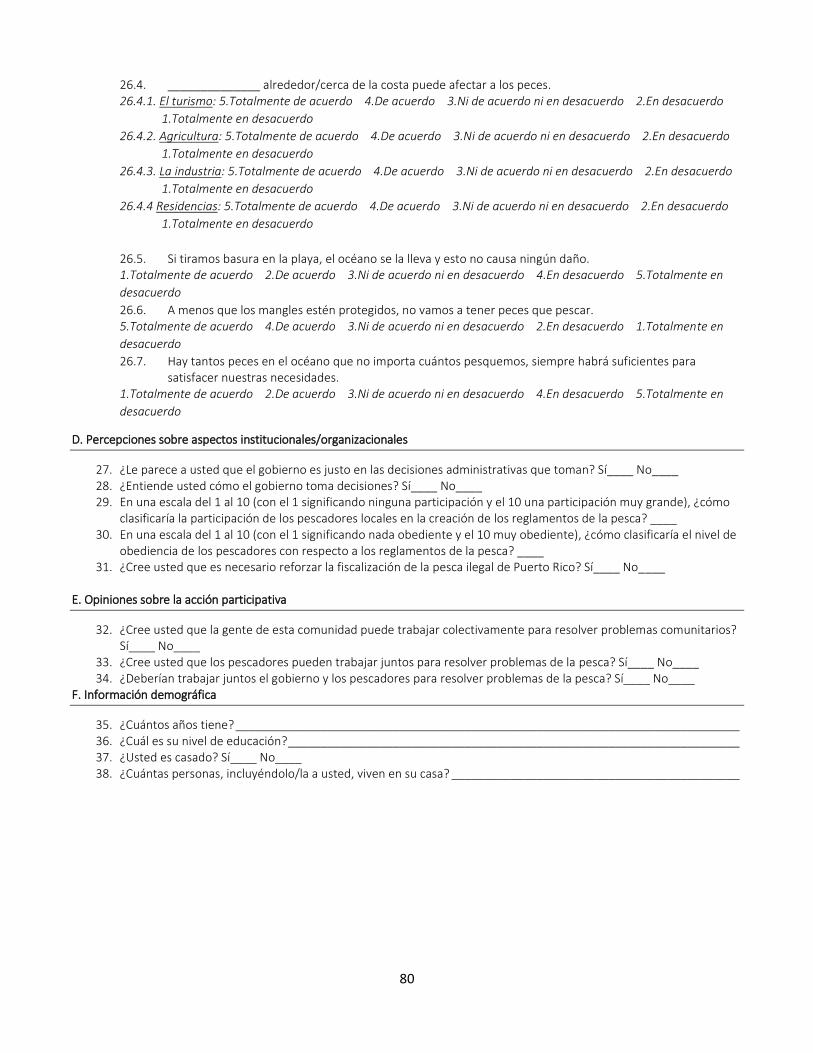
80
26.4. ______________ alrededor/cerca de la costa puede afectar a los peces. 26.4.1. El turismo: 5.Totalmente de acuerdo 4.De acuerdo 3.Ni de acuerdo ni en desacuerdo 2.En desacuerdo
1.Totalmente en desacuerdo
26.4.2. Agricultura: 5.Totalmente de acuerdo 4.De acuerdo 3.Ni de acuerdo ni en desacuerdo 2.En desacuerdo
1.Totalmente en desacuerdo
26.4.3. La industria: 5.Totalmente de acuerdo 4.De acuerdo 3.Ni de acuerdo ni en desacuerdo 2.En desacuerdo
1.Totalmente en desacuerdo
26.4.4 Residencias: 5.Totalmente de acuerdo 4.De acuerdo 3.Ni de acuerdo ni en desacuerdo 2.En desacuerdo
1.Totalmente en desacuerdo
26.5. Si tiramos basura en la playa, el océano se la lleva y esto no causa ningún daño. 1.Totalmente de acuerdo 2.De acuerdo 3.Ni de acuerdo ni en desacuerdo 4.En desacuerdo 5.Totalmente en
desacuerdo
26.6. A menos que los mangles estén protegidos, no vamos a tener peces que pescar. 5.Totalmente de acuerdo 4.De acuerdo 3.Ni de acuerdo ni en desacuerdo 2.En desacuerdo 1.Totalmente en
desacuerdo
26.7. Hay tantos peces en el océano que no importa cuántos pesquemos, siempre habrá suficientes para satisfacer nuestras necesidades.
1.Totalmente de acuerdo 2.De acuerdo 3.Ni de acuerdo ni en desacuerdo 4.En desacuerdo 5.Totalmente en
desacuerdo
D. Percepciones sobre aspectos institucionales/organizacionales
27. ¿Le parece a usted que el gobierno es justo en las decisiones administrativas que toman? Sí____ No____ 28. ¿Entiende usted cómo el gobierno toma decisiones? Sí____ No____ 29. En una escala del 1 al 10 (con el 1 significando ninguna participación y el 10 una participación muy grande), ¿cómo
clasificaría la participación de los pescadores locales en la creación de los reglamentos de la pesca? ____ 30. En una escala del 1 al 10 (con el 1 significando nada obediente y el 10 muy obediente), ¿cómo clasificaría el nivel de
obediencia de los pescadores con respecto a los reglamentos de la pesca? ____ 31. ¿Cree usted que es necesario reforzar la fiscalización de la pesca ilegal de Puerto Rico? Sí____ No____
E. Opiniones sobre la acción participativa
32. ¿Cree usted que la gente de esta comunidad puede trabajar colectivamente para resolver problemas comunitarios? Sí____ No____
33. ¿Cree usted que los pescadores pueden trabajar juntos para resolver problemas de la pesca? Sí____ No____ 34. ¿Deberían trabajar juntos el gobierno y los pescadores para resolver problemas de la pesca? Sí____ No____
F. Información demográfica
35. ¿Cuántos años tiene? _____________________________________________________________________________ 36. ¿Cuál es su nivel de educación? _____________________________________________________________________ 37. ¿Usted es casado? Sí____ No____ 38. ¿Cuántas personas, incluyéndolo/la a usted, viven en su casa? ____________________________________________
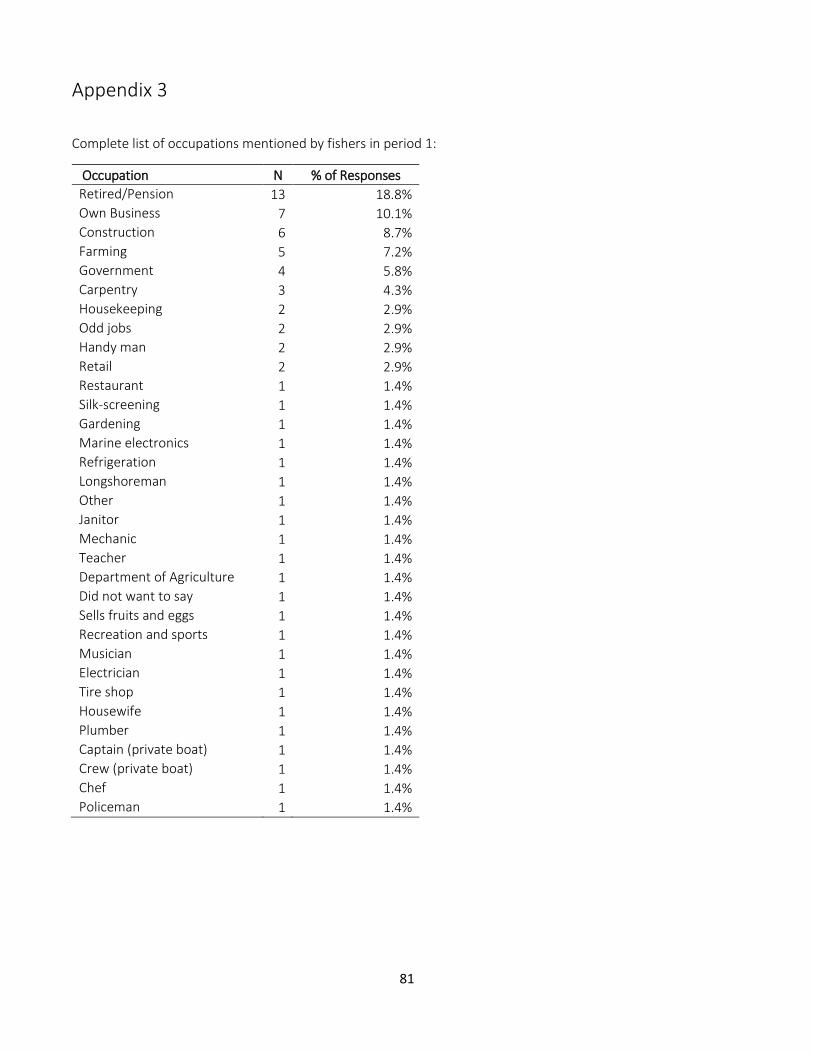
81
Appendix 3
Complete list of occupations mentioned by fishers in period 1:
Occupation N % of Responses
Retired/Pension 13 18.8%
Own Business 7 10.1%
Construction 6 8.7%
Farming 5 7.2%
Government 4 5.8%
Carpentry 3 4.3%
Housekeeping 2 2.9%
Odd jobs 2 2.9%
Handy man 2 2.9%
Retail 2 2.9%
Restaurant 1 1.4%
Silk-screening 1 1.4%
Gardening 1 1.4%
Marine electronics 1 1.4%
Refrigeration 1 1.4%
Longshoreman 1 1.4%
Other 1 1.4%
Janitor 1 1.4%
Mechanic 1 1.4%
Teacher 1 1.4%
Department of Agriculture 1 1.4%
Did not want to say 1 1.4%
Sells fruits and eggs 1 1.4%
Recreation and sports 1 1.4%
Musician 1 1.4%
Electrician 1 1.4%
Tire shop 1 1.4%
Housewife 1 1.4%
Plumber 1 1.4%
Captain (private boat) 1 1.4%
Crew (private boat) 1 1.4%
Chef 1 1.4%
Policeman 1 1.4%

82
Appendix 4
Complete list of occupations mentioned by fishers in period 1 in terms of time spent and preference:
Occupation Time N % of Responses
Fishing 12 26.1
Business owner 4 8.7
Equal 3 6.5
Farmer 3 6.5
Carpenter 3 6.5
Works for government 3 6.5
Construction 2 4.3
Other 2 4.3
Restaurant 1 2.2
Gardener 1 2.2
Refrigeration 1 2.2
Longshoreman 1 2.2
Janitor 1 2.2
Teacher 1 2.2
Department of Agriculture 1 2.2
Sells fruits and eggs 1 2.2
Recreation and sports 1 2.2
Electrician 1 2.2
Tier shop 1 2.2
Plumber 1 2.2
Captain (private boat) 1 2.2
Crew (private boat) 1 2.2
Occupation Preference N %
Equal 5 11.1
Fishing 24 53.3
Business owner 3 6.7 Gardner 1 2.2
Marine electronics 1 2.2 Farmer 2 4.4
Other 1 2.2
Janitor 1 2.2
Teacher 1 2.2
Carpenter 2 4.4
Works for government 2 4.4 Electrician 1 2.2
Plumber 1 2.2
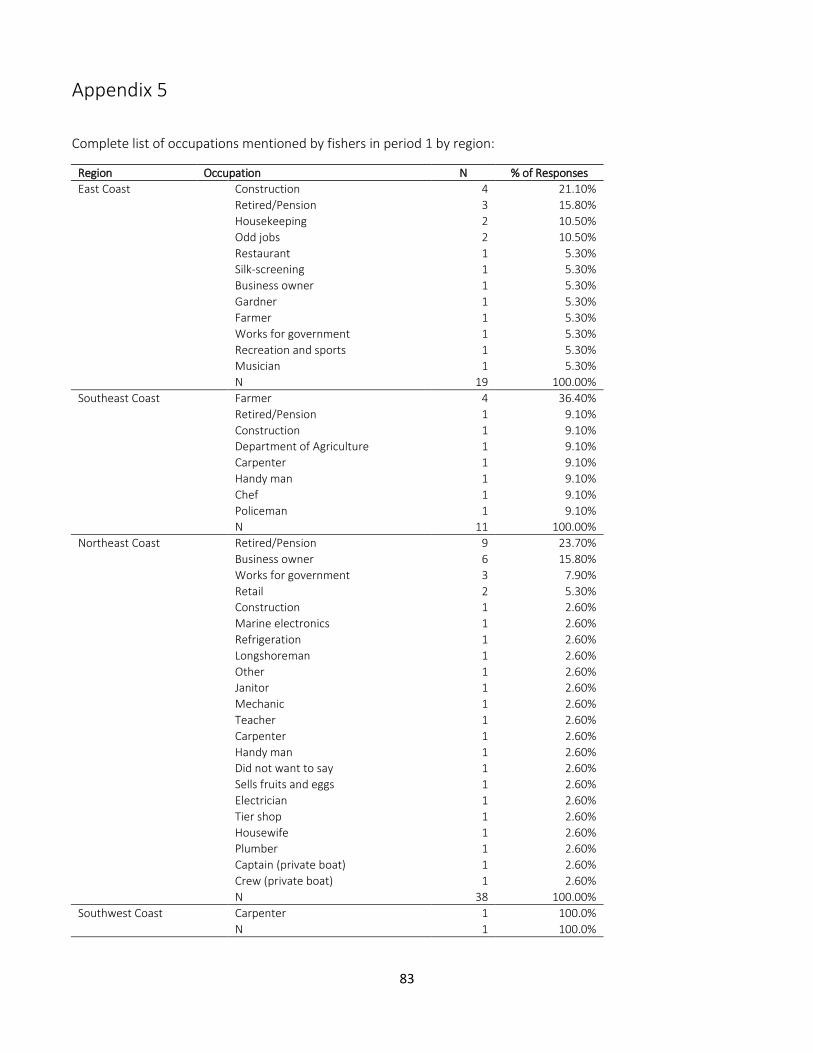
83
Appendix 5
Complete list of occupations mentioned by fishers in period 1 by region:
Region Occupation N % of Responses
East Coast Construction 4 21.10%
Retired/Pension 3 15.80%
Housekeeping 2 10.50%
Odd jobs 2 10.50%
Restaurant 1 5.30%
Silk-screening 1 5.30%
Business owner 1 5.30%
Gardner 1 5.30%
Farmer 1 5.30%
Works for government 1 5.30%
Recreation and sports 1 5.30%
Musician 1 5.30%
N 19 100.00%
Southeast Coast Farmer 4 36.40%
Retired/Pension 1 9.10%
Construction 1 9.10%
Department of Agriculture 1 9.10%
Carpenter 1 9.10%
Handy man 1 9.10%
Chef 1 9.10%
Policeman 1 9.10%
N 11 100.00%
Northeast Coast Retired/Pension 9 23.70%
Business owner 6 15.80%
Works for government 3 7.90%
Retail 2 5.30%
Construction 1 2.60%
Marine electronics 1 2.60%
Refrigeration 1 2.60%
Longshoreman 1 2.60%
Other 1 2.60%
Janitor 1 2.60%
Mechanic 1 2.60%
Teacher 1 2.60%
Carpenter 1 2.60%
Handy man 1 2.60%
Did not want to say 1 2.60%
Sells fruits and eggs 1 2.60%
Electrician 1 2.60%
Tier shop 1 2.60%
Housewife 1 2.60%
Plumber 1 2.60%
Captain (private boat) 1 2.60%
Crew (private boat) 1 2.60%
N 38 100.00%
Southwest Coast Carpenter 1 100.0%
N 1 100.0%
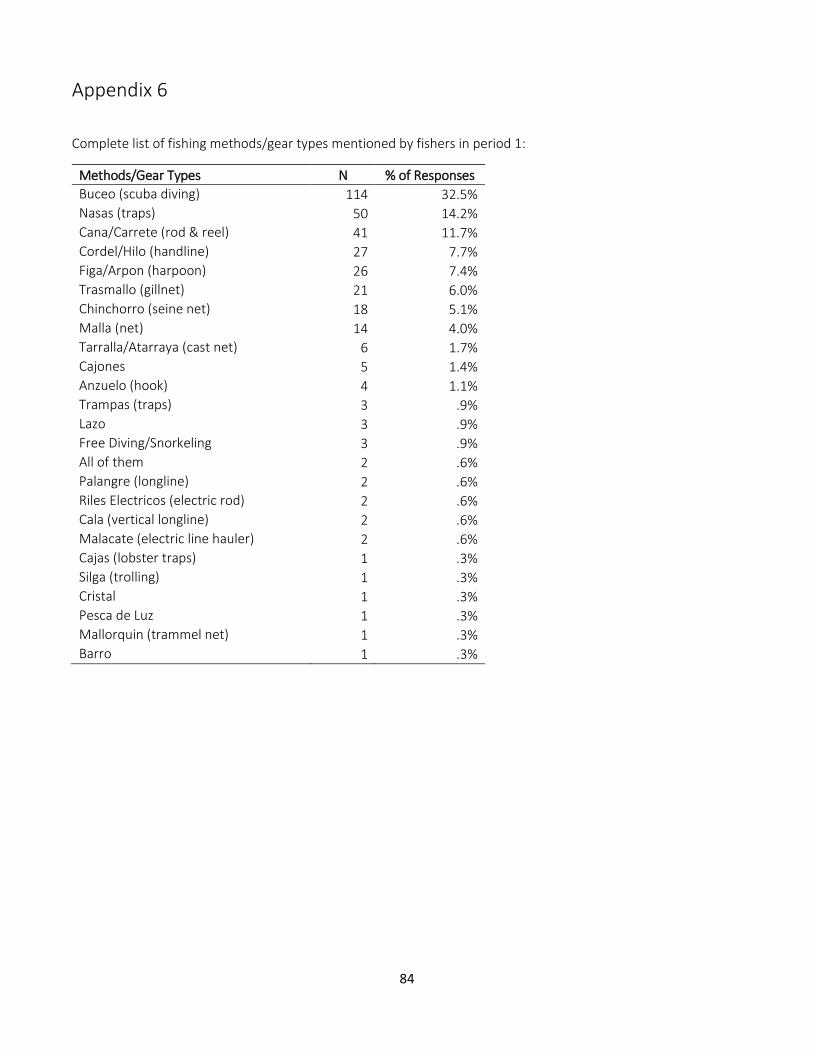
84
Appendix 6
Complete list of fishing methods/gear types mentioned by fishers in period 1:
Methods/Gear Types N % of Responses
Buceo (scuba diving) 114 32.5%
Nasas (traps) 50 14.2%
Cana/Carrete (rod & reel) 41 11.7%
Cordel/Hilo (handline) 27 7.7%
Figa/Arpon (harpoon) 26 7.4%
Trasmallo (gillnet) 21 6.0%
Chinchorro (seine net) 18 5.1%
Malla (net) 14 4.0%
Tarralla/Atarraya (cast net) 6 1.7%
Cajones 5 1.4%
Anzuelo (hook) 4 1.1%
Trampas (traps) 3 .9%
Lazo 3 .9%
Free Diving/Snorkeling 3 .9%
All of them 2 .6%
Palangre (longline) 2 .6%
Riles Electricos (electric rod) 2 .6%
Cala (vertical longline) 2 .6%
Malacate (electric line hauler) 2 .6%
Cajas (lobster traps) 1 .3%
Silga (trolling) 1 .3%
Cristal 1 .3%
Pesca de Luz 1 .3%
Mallorquin (trammel net) 1 .3%
Barro 1 .3%
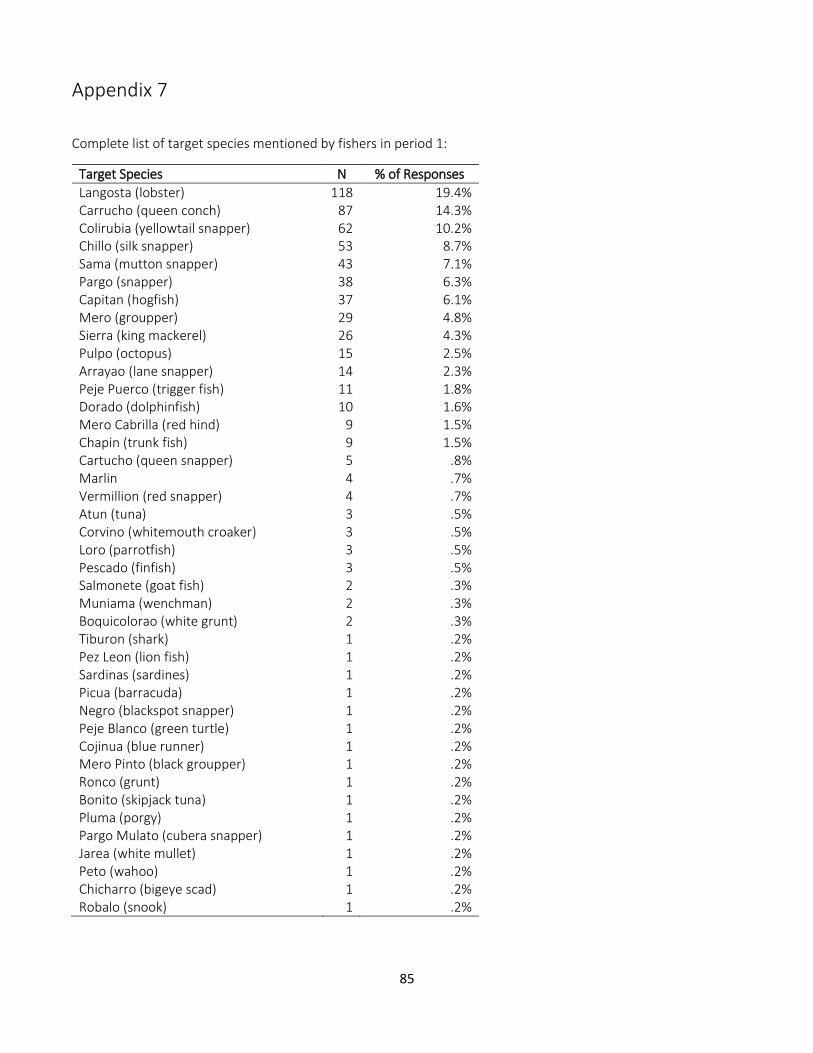
85
Appendix 7
Complete list of target species mentioned by fishers in period 1:
Target Species N % of Responses
Langosta (lobster) 118 19.4% Carrucho (queen conch) 87 14.3% Colirubia (yellowtail snapper) 62 10.2% Chillo (silk snapper) 53 8.7% Sama (mutton snapper) 43 7.1% Pargo (snapper) 38 6.3% Capitan (hogfish) 37 6.1% Mero (groupper) 29 4.8% Sierra (king mackerel) 26 4.3% Pulpo (octopus) 15 2.5% Arrayao (lane snapper) 14 2.3% Peje Puerco (trigger fish) 11 1.8% Dorado (dolphinfish) 10 1.6% Mero Cabrilla (red hind) 9 1.5% Chapin (trunk fish) 9 1.5% Cartucho (queen snapper) 5 .8% Marlin 4 .7% Vermillion (red snapper) 4 .7% Atun (tuna) 3 .5% Corvino (whitemouth croaker) 3 .5% Loro (parrotfish) 3 .5% Pescado (finfish) 3 .5% Salmonete (goat fish) 2 .3% Muniama (wenchman) 2 .3% Boquicolorao (white grunt) 2 .3% Tiburon (shark) 1 .2% Pez Leon (lion fish) 1 .2% Sardinas (sardines) 1 .2% Picua (barracuda) 1 .2% Negro (blackspot snapper) 1 .2% Peje Blanco (green turtle) 1 .2% Cojinua (blue runner) 1 .2% Mero Pinto (black groupper) 1 .2% Ronco (grunt) 1 .2% Bonito (skipjack tuna) 1 .2% Pluma (porgy) 1 .2% Pargo Mulato (cubera snapper) 1 .2% Jarea (white mullet) 1 .2% Peto (wahoo) 1 .2% Chicharro (bigeye scad) 1 .2% Robalo (snook) 1 .2%

86
Appendix 8
Complete list of fishing methods/gear types mentioned by fishers in period 1 by region:
Region Method/Gear Type N % of Responses
East Coast Buceo (scuba diving) 27 28.4%
Nasas (traps) 17 17.9%
Cordel/Hilo (handline) 13 13.7%
Figa/Arpon (harpoon) 12 12.6%
Cana/Carrete (rod & reel) 4 4.2%
Cajones 4 4.2%
Trasmallo (gillnet) 4 4.2%
Lazo 3 3.2%
Trampas (traps) 2 2.1%
Tarralla/Atarraya (cast net) 2 2.1%
Malla (net) 2 2.1%
Free Diving/Snorkeling 1 1.1%
Anzuelo (hook) 1 1.1%
Malacate (electric line hauler) 1 1.1%
Chinchorro (seine net) 1 1.1%
Barro 1 1.1%
N 95 100.0%
Southeast Coast Nasas (traps) 14 21.5%
Cordel/Hilo (handline) 11 16.9%
Figa/Arpon (harpoon) 6 9.2%
Malla (net) 6 9.2%
Cana/Carrete (rod & reel) 4 6.2%
Trasmallo (gillnet) 4 6.2%
Chinchorro (seine net) 4 6.2%
Buceo (scuba diving) 3 4.6%
Anzuelo (hook) 3 4.6%
All of them 2 3.1%
Palangre (longline) 1 1.5%
Cajones 1 1.5%
Cajas (lobster traps) 1 1.5%
Cala (vertical longline) 1 1.5%
Malacate (electric line hauler) 1 1.5%
Silga (trolling) 1 1.5%
Cristal 1 1.5%
Pesca de Luz 1 1.5%
N 65 100.0%
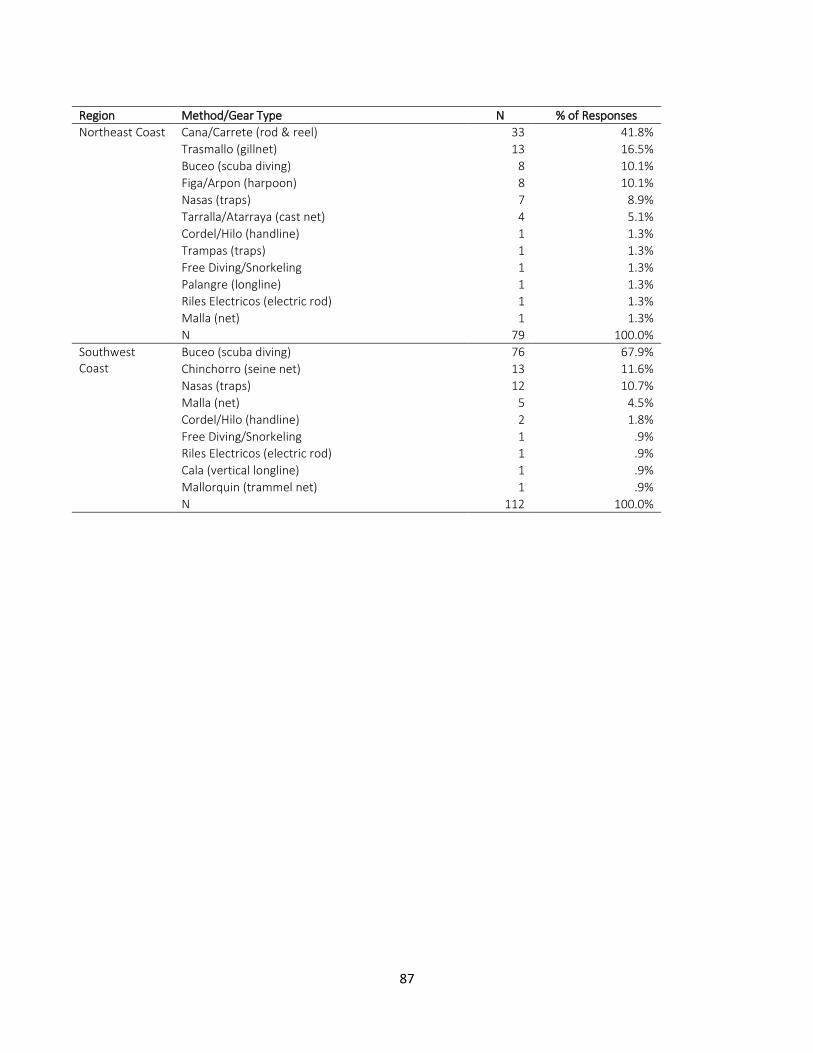
87
Region Method/Gear Type N % of Responses
Northeast Coast Cana/Carrete (rod & reel) 33 41.8%
Trasmallo (gillnet) 13 16.5%
Buceo (scuba diving) 8 10.1%
Figa/Arpon (harpoon) 8 10.1%
Nasas (traps) 7 8.9%
Tarralla/Atarraya (cast net) 4 5.1%
Cordel/Hilo (handline) 1 1.3%
Trampas (traps) 1 1.3%
Free Diving/Snorkeling 1 1.3%
Palangre (longline) 1 1.3%
Riles Electricos (electric rod) 1 1.3%
Malla (net) 1 1.3%
N 79 100.0%
Southwest Coast
Buceo (scuba diving) 76 67.9%
Chinchorro (seine net) 13 11.6%
Nasas (traps) 12 10.7%
Malla (net) 5 4.5%
Cordel/Hilo (handline) 2 1.8%
Free Diving/Snorkeling 1 .9%
Riles Electricos (electric rod) 1 .9%
Cala (vertical longline) 1 .9%
Mallorquin (trammel net) 1 .9%
N 112 100.0%
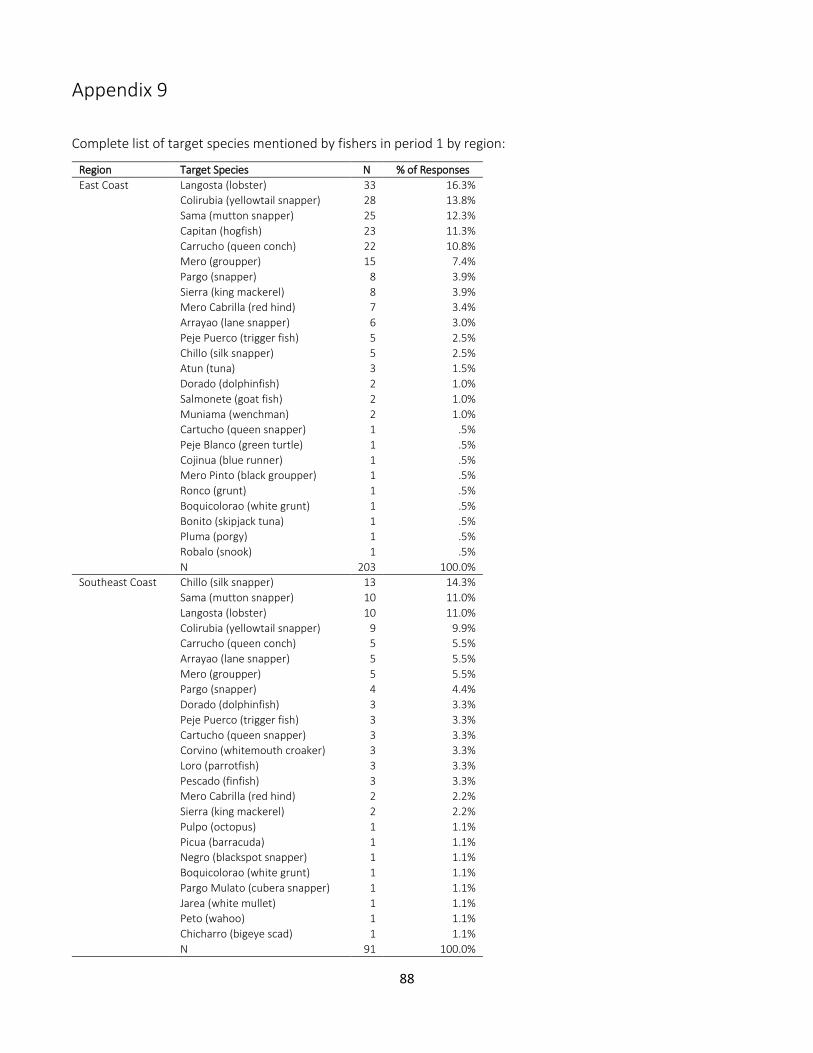
88
Appendix 9
Complete list of target species mentioned by fishers in period 1 by region:
Region Target Species N % of Responses
East Coast Langosta (lobster) 33 16.3%
Colirubia (yellowtail snapper) 28 13.8%
Sama (mutton snapper) 25 12.3%
Capitan (hogfish) 23 11.3%
Carrucho (queen conch) 22 10.8%
Mero (groupper) 15 7.4%
Pargo (snapper) 8 3.9%
Sierra (king mackerel) 8 3.9%
Mero Cabrilla (red hind) 7 3.4%
Arrayao (lane snapper) 6 3.0%
Peje Puerco (trigger fish) 5 2.5%
Chillo (silk snapper) 5 2.5%
Atun (tuna) 3 1.5%
Dorado (dolphinfish) 2 1.0%
Salmonete (goat fish) 2 1.0%
Muniama (wenchman) 2 1.0%
Cartucho (queen snapper) 1 .5%
Peje Blanco (green turtle) 1 .5%
Cojinua (blue runner) 1 .5%
Mero Pinto (black groupper) 1 .5%
Ronco (grunt) 1 .5%
Boquicolorao (white grunt) 1 .5%
Bonito (skipjack tuna) 1 .5%
Pluma (porgy) 1 .5%
Robalo (snook) 1 .5%
N 203 100.0%
Southeast Coast Chillo (silk snapper) 13 14.3%
Sama (mutton snapper) 10 11.0%
Langosta (lobster) 10 11.0%
Colirubia (yellowtail snapper) 9 9.9%
Carrucho (queen conch) 5 5.5%
Arrayao (lane snapper) 5 5.5%
Mero (groupper) 5 5.5%
Pargo (snapper) 4 4.4%
Dorado (dolphinfish) 3 3.3%
Peje Puerco (trigger fish) 3 3.3%
Cartucho (queen snapper) 3 3.3%
Corvino (whitemouth croaker) 3 3.3%
Loro (parrotfish) 3 3.3%
Pescado (finfish) 3 3.3%
Mero Cabrilla (red hind) 2 2.2%
Sierra (king mackerel) 2 2.2%
Pulpo (octopus) 1 1.1%
Picua (barracuda) 1 1.1%
Negro (blackspot snapper) 1 1.1%
Boquicolorao (white grunt) 1 1.1%
Pargo Mulato (cubera snapper) 1 1.1%
Jarea (white mullet) 1 1.1%
Peto (wahoo) 1 1.1%
Chicharro (bigeye scad) 1 1.1%
N 91 100.0%
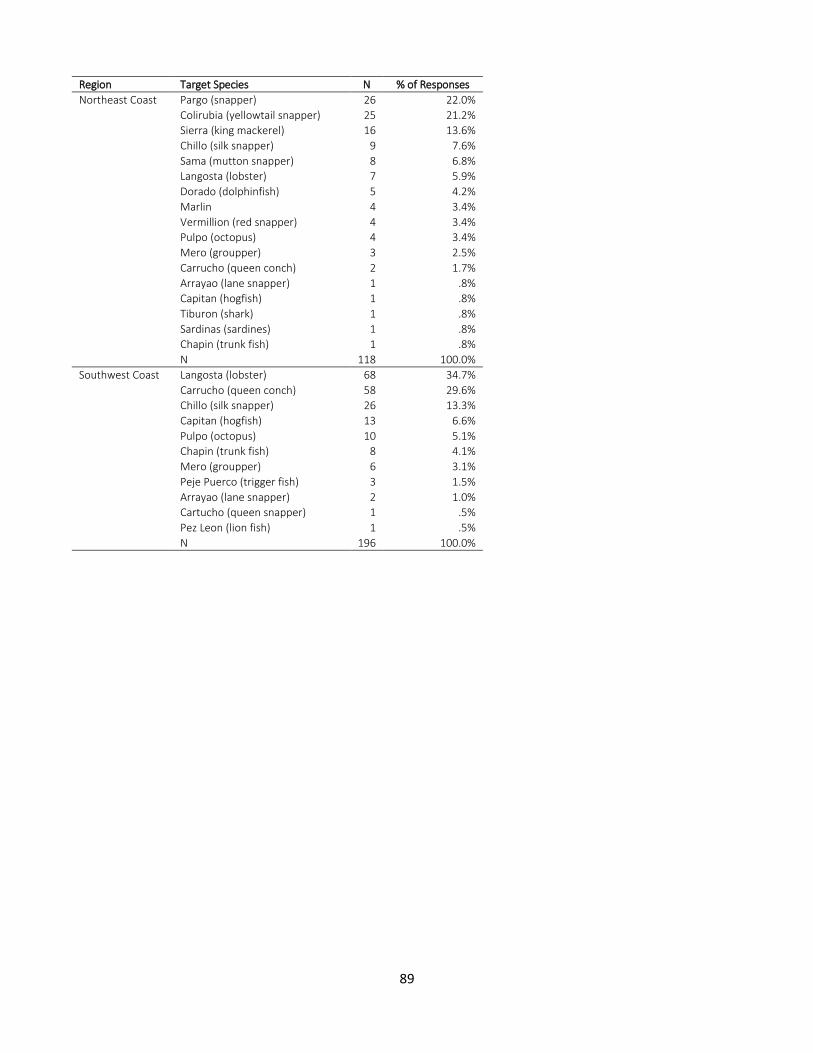
89
Region Target Species N % of Responses
Northeast Coast Pargo (snapper) 26 22.0%
Colirubia (yellowtail snapper) 25 21.2%
Sierra (king mackerel) 16 13.6%
Chillo (silk snapper) 9 7.6%
Sama (mutton snapper) 8 6.8%
Langosta (lobster) 7 5.9%
Dorado (dolphinfish) 5 4.2%
Marlin 4 3.4%
Vermillion (red snapper) 4 3.4%
Pulpo (octopus) 4 3.4%
Mero (groupper) 3 2.5%
Carrucho (queen conch) 2 1.7%
Arrayao (lane snapper) 1 .8%
Capitan (hogfish) 1 .8%
Tiburon (shark) 1 .8%
Sardinas (sardines) 1 .8%
Chapin (trunk fish) 1 .8%
N 118 100.0%
Southwest Coast Langosta (lobster) 68 34.7%
Carrucho (queen conch) 58 29.6%
Chillo (silk snapper) 26 13.3%
Capitan (hogfish) 13 6.6%
Pulpo (octopus) 10 5.1%
Chapin (trunk fish) 8 4.1%
Mero (groupper) 6 3.1%
Peje Puerco (trigger fish) 3 1.5%
Arrayao (lane snapper) 2 1.0%
Cartucho (queen snapper) 1 .5%
Pez Leon (lion fish) 1 .5%
N 196 100.0%

90
Appendix 10
Reasons mentioned by fishers for decline in fishery resources in period 1:
Reason Stated N % of Responses
Pollution (water) 14 34.1%
Global warming 6 14.6%
Overfishing 2 4.9%
Environmental changes 2 4.9%
Marina pollution 2 4.9%
Overexploitation by foreign fishers 1 2.4%
Human impacts (anchors, tourism, population) 1 2.4%
More boats 1 2.4%
Fishery closures (vedas) 1 2.4%
Government/regulations 1 2.4%
Lack of resources 1 2.4%
Weather conditions 1 2.4%
Lower abundance of resources 1 2.4%
Compliance 1 2.4%
Invasive species 1 2.4%
Fewer fish 1 2.4%
River pollution 1 2.4%
Trash in water 1 2.4%
Algal blooms 1 2.4%
More fish 1 2.4%
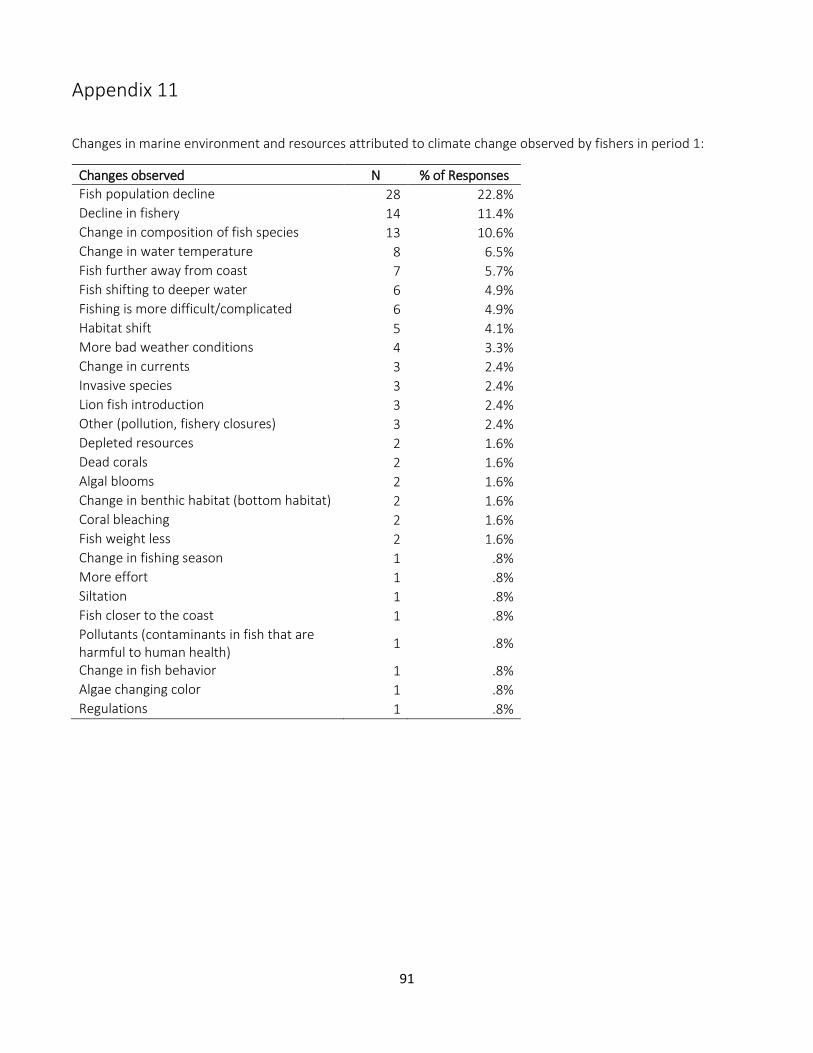
91
Appendix 11
Changes in marine environment and resources attributed to climate change observed by fishers in period 1:
Changes observed N % of Responses
Fish population decline 28 22.8%
Decline in fishery 14 11.4%
Change in composition of fish species 13 10.6%
Change in water temperature 8 6.5%
Fish further away from coast 7 5.7%
Fish shifting to deeper water 6 4.9%
Fishing is more difficult/complicated 6 4.9%
Habitat shift 5 4.1%
More bad weather conditions 4 3.3%
Change in currents 3 2.4%
Invasive species 3 2.4%
Lion fish introduction 3 2.4%
Other (pollution, fishery closures) 3 2.4%
Depleted resources 2 1.6%
Dead corals 2 1.6%
Algal blooms 2 1.6%
Change in benthic habitat (bottom habitat) 2 1.6%
Coral bleaching 2 1.6%
Fish weight less 2 1.6%
Change in fishing season 1 .8%
More effort 1 .8%
Siltation 1 .8%
Fish closer to the coast 1 .8%
Pollutants (contaminants in fish that are harmful to human health)
1 .8%
Change in fish behavior 1 .8%
Algae changing color 1 .8%
Regulations 1 .8%
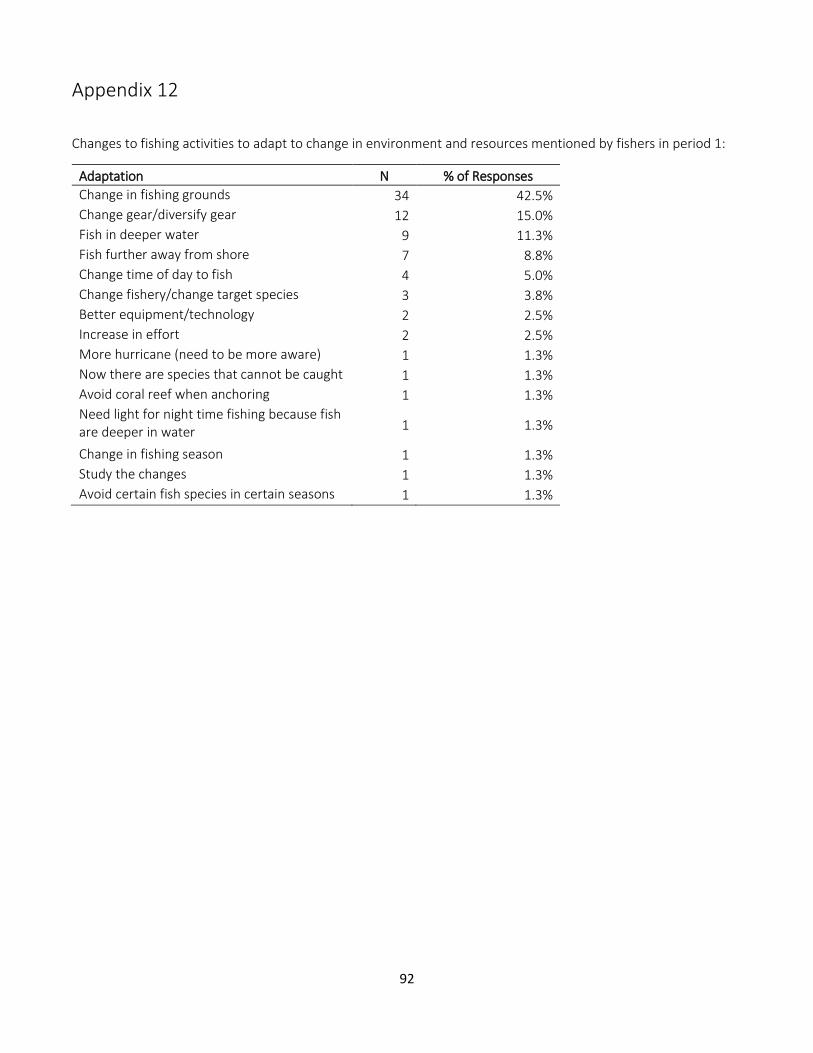
92
Appendix 12
Changes to fishing activities to adapt to change in environment and resources mentioned by fishers in period 1:
Adaptation N % of Responses
Change in fishing grounds 34 42.5%
Change gear/diversify gear 12 15.0%
Fish in deeper water 9 11.3%
Fish further away from shore 7 8.8%
Change time of day to fish 4 5.0%
Change fishery/change target species 3 3.8%
Better equipment/technology 2 2.5%
Increase in effort 2 2.5%
More hurricane (need to be more aware) 1 1.3%
Now there are species that cannot be caught 1 1.3%
Avoid coral reef when anchoring 1 1.3%
Need light for night time fishing because fish are deeper in water 1 1.3%
Change in fishing season 1 1.3%
Study the changes 1 1.3%
Avoid certain fish species in certain seasons 1 1.3%

93
Appendix 13 Survey questionnaires used to interview fishers in the post-storm assessment (time period 2) in English and Spanish. A. Work & Fishing Attributes
1. Do you fish? Yes____ No____ (If no, use community survey) 2. What do you do with the fish you catch? _____________________________________________________________ 3. What is your occupation? Fisher____ Other: __________________________________________________________ 4. Do you have other occupation(s)? ___________________________________________________________________ 5. Which is more important for your income? (Which is second? Third? Etc.) __________________________________ 6. Or how old were you when you first began fishing? _____________________________________________________ 7. What fishing methods/gears do you use? _____________________________________________________________ 8. What is the length of the boat you use for fishing? _____________________________________________________
8.1. Do you own the boat? Yes____ No____ 8.1.1. If no, does the boat owner have more than one boat? Yes____ No____
8.1.1.1. If yes, how many? _____________________________________________________________ 9. What are the most important species of fish/shellfish you catch (if commercial fisher: for your income)?
(Which is the most important? Which is second?) ______________________________________________________ 10. Are you the major provider of your household in terms of income? Yes____ No___ 11. Do you give any fish that you catch to family and friends? (If already mentioned in question 2, ask: How frequently…)
(1) Never (2) Sometimes (3) Frequently (4) All time
B. Perceptions of Resource Status & Individual Job satisfaction and Well-being
12. At the present time the fishery resources that you use are: (5) In very good shape (4) In good shape (3) In neither good nor bad shape (2) In bad shape (1) In very bad
shape
13. Are the fishery resources (1) worse, the (2) same, or (3) better as they were before hurricanes Irma and Maria? 13.1. If worse or better, why do you think that is? ___________________________________________________
14. Job Satisfaction: 14.1. How satisfied are you with your income from fishing?
5. Very satisfied 4. Satisfied 3. Neutral 2. Dissatisfied 1. Very dissatisfied
14.2. How satisfied are you with the predictability of your income from fishing? 5. Very satisfied 4. Satisfied 3. Neutral 2. Dissatisfied 1. Very dissatisfied
14.3. How satisfied are you with safety on the job? 5. Very satisfied 4. Satisfied 3. Neutral 2. Dissatisfied 1. Very dissatisfied
14.4. How satisfied are you with the fatigue of the job? 5. Very satisfied 4. Satisfied 3. Neutral 2. Dissatisfied 1. Very dissatisfied
14.5. How satisfied are you with the healthfulness of the job? 5. Very satisfied 4. Satisfied 3. Neutral 2. Dissatisfied 1. Very dissatisfied
14.6. How satisfied are you with the time you spend away from home fishing? 5. Very satisfied 4. Satisfied 3. Neutral 2. Dissatisfied 1. Very dissatisfied
14.7. How satisfied are you with the adventure of the job? 5. Very satisfied 4. Satisfied 3. Neutral 2. Dissatisfied 1. Very dissatisfied
14.8. How satisfied are you with the challenge of the job? 5. Very satisfied 4. Satisfied 3. Neutral 2. Dissatisfied 1. Very dissatisfied
94
14.9. How satisfied are you with the opportunity to be your own boss (independence of being a fisher)? 5. Very satisfied 4. Satisfied 3. Neutral 2. Dissatisfied 1. Very dissatisfied
15. Would you advise a young person to go into fishing today? Yes____ No___ 16. On a scale of 1 to 10 (1 = not happy at all and 10 = very happy), how happy are you with your life? _______________
C. Climate change knowledge/perception
17. Do you think the climate in this area is changing? Yes____ No____ (If no, go to question 18) 17.1. If yes, what changes have you noticed? _______________________________________________________ 17.2. In your opinion, the fact that the climate is changing is:
(1) Very bad (2) Bad (3) Neither good nor bad (4) Good (5) Very good
17.3. What do you think is causing these climatic changes? ____________________________________________ 18. On a scale of 1 to 10 (1 = not worried at all and 10 = very worried) how worried are you about climate change? ____
19. Have you noticed any changes in with regard to the fish/shellfish or the marine environment in this area that you believe are related to climate change? Yes____ No____ (If no, go to question 20) 19.1. If yes: What changes? _____________________________________________________________________ 19.2. Have you done anything or changed anything about your fishing activity as a consequence of these
changes? Yes____ No____ 19.3. If yes, what have you changed? _____________________________________________________________
20. Are you aware of any regulations in Puerto Rico to address climate change? Yes____ No____ 20.1. If yes, what regulation(s)? _________________________________________________________________
21. Do you think legislation to address climate change should be implemented in Puerto Rico? Yes____ No____ 21.1. Why or why not? _________________________________________________________________________
22. Do you feel that your fishing activity is currently at risk due to: a. Air temperature rising Yes____ No____ b. Sea level rise Yes____ No____ c. Droughts Yes____ No____ d. Sea water temperature rising Yes____ No____ e. More seaweed in the water Yes____ No____ f. Coral bleaching Yes____ No____ g. Storms and hurricanes becoming more frequent and violent Yes____ No____ h. Unusual behavior of marine animals Yes____ No____ i. Marine pollution Yes____ No____ j. Overfishing Yes____ No____
23. Human activities do not influence the coastal and marine environment. 1.Strongly agree 2.Agree 3.Unsure 4.Disagree 5.Strongly disagree
24. Human activities do not influence the climate. 1.Strongly agree 2.Agree 3.Unsure 4.Disagree 5.Strongly disagree
25. There is no point in planning for the future; what happens, happens and we cannot do anything about it. 1.Strongly agree 2.Agree 3.Unsure 4.Disagree 5.Strongly disagree
D. Aspects of Impact and Recovery from Recent Storm Events
26. With regard to your house, was anything damaged or lost due to hurricanes Irma and Maria? Yes____ No____ 26.1. If damage occurred, was it: (1) Minor damage (2) Moderate damage (3) Severe damage (4) Complete
damage
95
27. Were any of your fishing gear damaged or lost due to hurricanes Irma and Maria? Yes____ No____ 27.1. If damage occurred, was it: (1) Minor damage (2) Moderate damage (3) Severe damage (4) Complete
damage
28. Was your boat damaged or lost due to hurricanes Irma and Maria? Yes____ No____ 28.1. If damage occurred, was it: (1) Minor damage (2) Moderate damage (3) Severe damage (4) Complete
damage
29. Were any other personal possessions damaged or lost due to hurricanes Irma and Maria? Yes____ No____ 29.1. If damage occurred, was it: (1) Minor damage (2) Moderate damage (3) Severe damage (4) Complete
damage
30. Were you physically injured during the hurricanes? Yes____ No____ 31. Was anybody in your family injured during the hurricanes? Yes____ No____
31.1. If yes, how many? ________________________________________________________________________ 32. If any loss, damage, or injury occurred, have you received any assistance or help in your recovery? Yes____ No____
32.1.1. If yes, who provided the assistance/help? _________________________________________________ 33. On a scale of 1 to 10 (1 = not recovered at all and 10 = completely recovered) how would you rate your
level or recovery from the hurricanes today? _________________________________________________________ 34. What or who was most helpful for you recovery efforts? ________________________________________________ 35. Were there any impediments to your recovery? Yes____ No____
35.1. If yes, what? _____________________________________________________________________________ 36. Did you consider leaving Puerto Rico after the hurricanes? Yes____ No____
36.1. Why or why not? _________________________________________________________________________ 37. Do you go out to fish more or less since the hurricanes? More___ Less___ Same___
37.1. If more or less, why? ______________________________________________________________________ 38. Have you changed target species since the hurricanes? Yes____ No____
38.1. If yes, how? (What species did you catch before that you do not catch now and vice versa?) ____________ 39. Have you changed gear type/fishing method since the hurricanes? Yes____ No____
39.1. If yes, how and why? ______________________________________________________________________ 40. Have you changed your fishing location since the hurricanes? Yes____ No____
40.1. If yes, how and why? _____________________________________________________________________ 41. If answered yes to question 11: Have the hurricanes influenced how much fish you give away to family and
friends? Yes____ No____ 41.1. If yes, how? _____________________________________________________________________________
42. Do you have any family members or friends who were fishers and had to exit the fishery due to the hurricanes? Yes____ No____ 42.1. If yes, what are they doing now for income? ___________________________________________________
E. Demographics
43. How old are you? ________________________________________________________________________________ 44. What was the last grade you completed in school? _____________________________________________________ 45. Are you married? Yes____ No____ 46. How many people live in your household? ____________________________________________________________
96
A. Atributos relacionados con el trabajo y la pesca:
1. ¿Usted pesca? Sí____ No____ (Si la respuesta es no, use la encuesta de la comunidad) 2. ¿Qué hace con los pescados que coge? ______________________________________________________________ 3. ¿Cuál es su trabajo? Pescador____ Otro: _____________________________________________________________ 4. ¿Tiene otra ocupación además de [____]? ____________________________________________________________ 5. ¿Cuál es el trabajo más importante para sus ingresos? (¿Cuál es la segunda? ¿La tercera? Etc.) __________________ 6. ¿Con cuántos años usted empezó a pescar? ___________________________________________________________ 7. ¿Qué métodos y artes de pesca usa usted? ___________________________________________________________ 8. ¿De qué tamaño es el bote que usa usted para pescar?__________________________________________________
8.1. ¿Usted es el dueño del bote? Sí____ No____ 8.1.1. Si la respuesta es que no, ¿el dueño del bote tiene más de un bote? Sí____ No____
8.1.1.1. Si la respuesta es que si, ¿Cuántos? _______________________________________________ 9. ¿Cuáles son las especies de pescado más importantes para usted? (Si un pescador comercial: ¿para sus
ingresos?) (¿Cuál es la más importante? ¿La segunda más importante?) ____________________________________ 10. ¿Usted es el que más dinero trae a su hogar? Sí____ No____ 11. ¿Le das de los pescados que atrapa a familiares y amigos? (Si se mencionó en la pregunta 2, pregunte: ¿con qué
frecuencia?) (2) Nunca (2) Algunas veces (3) Frecuentemente (4) Todo el tiempo
B. Percepciones del estatus a partir de los recursos y del bienestar individual
12. En el presente los recursos pesqueros (las poblaciones de peces) están: (5) en muy buenas condiciones. (4) en buenas condiciones. (3) ni en buenas ni en malas condiciones.
(2) en malas condiciones. (1) en muy malas condiciones.
13. ¿Están en (1) peores, (2) iguales o (3) mejores condiciones los recursos pesqueros (las poblaciones de peces) que antes de los huracanes Irma y María? 13.1. Si la contestación fue peor o mejor, ¿qué usted piensa que provocó este cambio? _____________________
14. ¿Cuán satisfecho está usted con: 14.1. lo que gana por sus actividades de pesca?
5. Muy satisfecho 4. Satisfecho 3. Neutral 2. Insatisfecho 1. Muy insatisfecho
14.2. lo predecible de esas ganancias por sus actividades de pesca? 5. Muy satisfecho 4. Satisfecho 3. Neutral 2. Insatisfecho 1. Muy insatisfecho
14.3. su seguridad cuando pesca? 5. Muy satisfecho 4. Satisfecho 3. Neutral 2. Insatisfecho 1. Muy insatisfecho
14.4. el cansancio físico que le causa este trabajo? 5. Muy satisfecho 4. Satisfecho 3. Neutral 2. Insatisfecho 1. Muy insatisfecho
14.5. el efecto de este trabajo en su salud? 5. Muy satisfecho 4. Satisfecho 3. Neutral 2. Insatisfecho 1. Muy insatisfecho
14.6. el tiempo que pasa con su familia? 5. Muy satisfecho 4. Satisfecho 3. Neutral 2. Insatisfecho 1. Muy insatisfecho
14.7. el disfrute de la aventura de este trabajo? 5. Muy satisfecho 4. Satisfecho 3. Neutral 2. Insatisfecho 1. Muy insatisfecho
14.8. los retos de este trabajo? 5. Muy satisfecho 4. Satisfecho 3. Neutral 2. Insatisfecho 1. Muy insatisfecho
14.9. la oportunidad de ser su propio jefe (la independencia que le da el trabajo)? 5. Muy satisfecho 4. Satisfecho 3. Neutral 2. Insatisfecho 1. Muy insatisfecho
15. En este momento, ¿le aconsejaría a un joven a trabajar en la industria pesquera? Sí____ No___

97
16. En una escala del 1 al 10 (con el 1 significando no feliz para nada y el 10 muy feliz), ¿cuán feliz está usted con su vida?_____
C. Percepción del cambio climático
17. ¿Piensa usted que el clima de esta área está cambiando? Sí ____ No ____ (Si la respuesta es no, pase a la pregunta 18) 17.1. Si la respuesta es que sí, ¿Qué cambios ha notado? _____________________________________________ 17.2. En su opinión, el hecho de que el clima está cambiando es:
(1) Muy malo (2) Malo (3) Ni bueno ni malo (4) Bueno (5) Muy bueno
17.3. ¿Qué usted piensa que está causando estos cambios climáticos? __________________________________ 18. En una escala del 1 al 10 (con el 1 significando no preocupado para nada y el 10 muy preocupado), ¿cuán
preocupado está usted por el cambio climático? _____ 19. ¿Ha notado usted cambios en los peces, mariscos o el ambiente de esta área que desde su punto de vista puedan
estar relacionados con el cambio climático (o calentamiento global)? Sí ____ No ____ 19.1. Si la respuesta es que sí, ¿qué cambios ha notado? ______________________________________________ 19.2. Si la respuesta (23) es que sí, ¿ha hecho algo o cambiado algún aspecto de sus actividades de pesca como
resultado de los cambios de la pregunta anterior? Sí ____ No ____ 19.3. Si la respuesta (23) es que sí, ¿qué cambios ha hecho? ___________________________________________
20. ¿Sabe usted de algún reglamento en Puerto Rico para responder al cambio climático? Sí ____ No ____ 20.1. Si la respuesta es que sí, ¿de qué reglamento o reglamentos sabe usted? ___________________________
21. ¿Cree que se debe implementar en Puerto Rico alguna legislación para enfrentar el cambio climático? Sí____ No____ 21.1. ¿Por qué o por qué no? ____________________________________________________________________
22. ¿Le parece a usted que la pesca está en peligro debido: a. al aumento de la temperatura del aire? Sí____ No____ b. al aumento de los niveles del mar? Sí____ No____ c. a la sequía? Sí ____ No____ d. al aumento en la temperatura del agua del mar? Sí____ No____ e. al aumento de algas marinas? Sí____ No____ f. al emblanquecimiento de los corales? Sí____ No____ g. al aumento en la frecuencia y la violencia de las tormentas y los huracanes? Sí____ No____ h. a los cambios de comportamiento en animales marinos? Sí____ No____ i. a la contaminación marina? Sí____ No____ j. a la sobrepesca? Sí____ No____
(Voy a leerle una serie de preguntas y me gustaría saber si está de acuerdo o en desacuerdo con ellas)
23. Las actividades humanas no afectan el medio ambiente costero y marino. 1.Totalmente de acuerdo 2.De acuerdo 3.Ni de acuerdo ni en desacuerdo 4.En desacuerdo 5.Totalmente en
desacuerdo
24. Las actividades humanas no afectan el clima. 1.Totalmente de acuerdo 2.De acuerdo 3.Ni de acuerdo ni en desacuerdo 4.En desacuerdo 5.Totalmente en
desacuerdo
25. No tiene sentido planificar para el futuro; lo que sucede, sucede, y no podemos hacer nada al respecto. 1.Totalmente de acuerdo 2.De acuerdo 3.Ni de acuerdo ni en desacuerdo 4.En desacuerdo 5.Totalmente en
desacuerdo
D. Aspectos de impacto y recuperación de los recientes eventos de tormenta
26. Con respecto a su casa, ¿hubo algún daño o perdida debido a los huracanes Irma y María? Sí____ No____ 26.1. Si la respuesta es que sí, ¿el daño fue: (1) Menor (2) Moderado (3) Severo (4) Completamente dañado
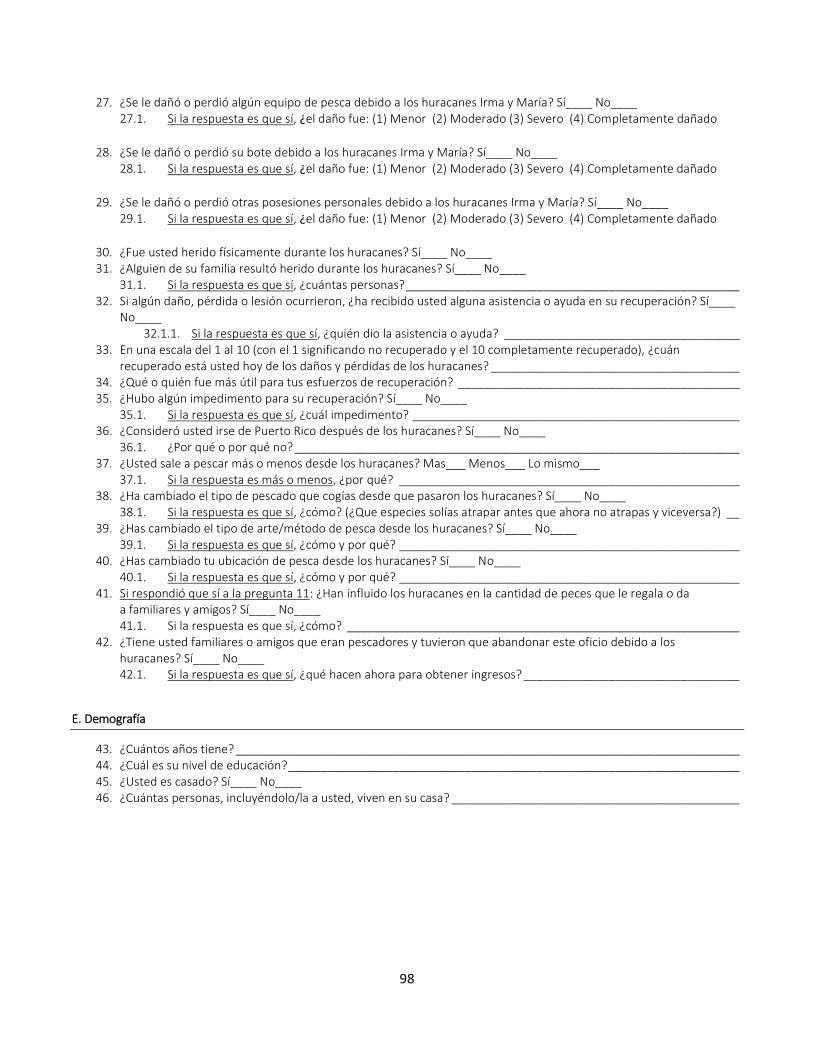
98
27. ¿Se le dañó o perdió algún equipo de pesca debido a los huracanes Irma y María? Sí____ No____ 27.1. Si la respuesta es que sí, ¿el daño fue: (1) Menor (2) Moderado (3) Severo (4) Completamente dañado
28. ¿Se le dañó o perdió su bote debido a los huracanes Irma y María? Sí____ No____ 28.1. Si la respuesta es que sí, ¿el daño fue: (1) Menor (2) Moderado (3) Severo (4) Completamente dañado
29. ¿Se le dañó o perdió otras posesiones personales debido a los huracanes Irma y María? Sí____ No____ 29.1. Si la respuesta es que sí, ¿el daño fue: (1) Menor (2) Moderado (3) Severo (4) Completamente dañado
30. ¿Fue usted herido físicamente durante los huracanes? Sí____ No____ 31. ¿Alguien de su familia resultó herido durante los huracanes? Sí____ No____
31.1. Si la respuesta es que sí, ¿cuántas personas? ___________________________________________________ 32. Si algún daño, pérdida o lesión ocurrieron, ¿ha recibido usted alguna asistencia o ayuda en su recuperación? Sí____
No____ 32.1.1. Si la respuesta es que sí, ¿quién dio la asistencia o ayuda? ____________________________________
33. En una escala del 1 al 10 (con el 1 significando no recuperado y el 10 completamente recuperado), ¿cuán recuperado está usted hoy de los daños y pérdidas de los huracanes? ______________________________________
34. ¿Qué o quién fue más útil para tus esfuerzos de recuperación? ___________________________________________ 35. ¿Hubo algún impedimento para su recuperación? Sí____ No____
35.1. Si la respuesta es que sí, ¿cuál impedimento? __________________________________________________ 36. ¿Consideró usted irse de Puerto Rico después de los huracanes? Sí____ No____
36.1. ¿Por qué o por qué no? ____________________________________________________________________ 37. ¿Usted sale a pescar más o menos desde los huracanes? Mas___ Menos___ Lo mismo___
37.1. Si la respuesta es más o menos, ¿por qué? ____________________________________________________ 38. ¿Ha cambiado el tipo de pescado que cogías desde que pasaron los huracanes? Sí____ No____
38.1. Si la respuesta es que sí, ¿cómo? (¿Que especies solías atrapar antes que ahora no atrapas y viceversa?) __ 39. ¿Has cambiado el tipo de arte/método de pesca desde los huracanes? Sí____ No____
39.1. Si la respuesta es que sí, ¿cómo y por qué? ____________________________________________________ 40. ¿Has cambiado tu ubicación de pesca desde los huracanes? Sí____ No____
40.1. Si la respuesta es que sí, ¿cómo y por qué? ____________________________________________________ 41. Si respondió que sí a la pregunta 11: ¿Han influido los huracanes en la cantidad de peces que le regala o da
a familiares y amigos? Sí____ No____ 41.1. Si la respuesta es que sí, ¿cómo? ____________________________________________________________
42. ¿Tiene usted familiares o amigos que eran pescadores y tuvieron que abandonar este oficio debido a los huracanes? Sí____ No____ 42.1. Si la respuesta es que sí, ¿qué hacen ahora para obtener ingresos? _________________________________
E. Demografía
43. ¿Cuántos años tiene? _____________________________________________________________________________ 44. ¿Cuál es su nivel de educación? _____________________________________________________________________ 45. ¿Usted es casado? Sí____ No____ 46. ¿Cuántas personas, incluyéndolo/la a usted, viven en su casa? ____________________________________________
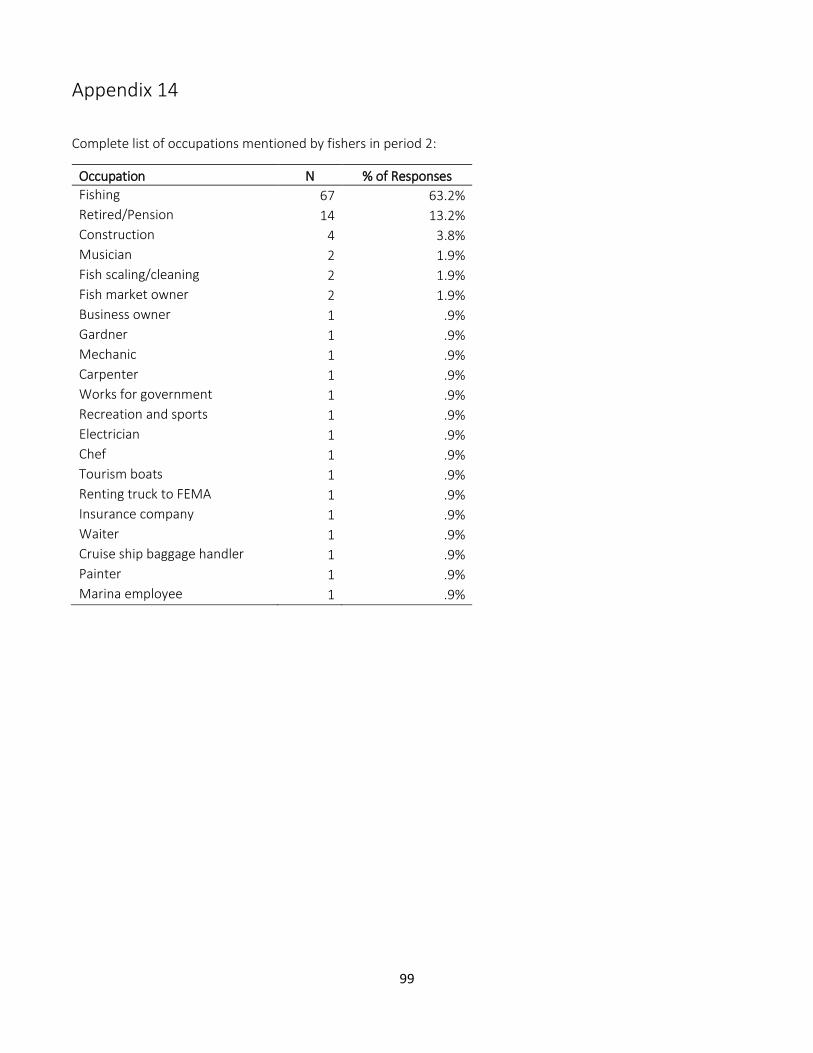
99
Appendix 14
Complete list of occupations mentioned by fishers in period 2:
Occupation N % of Responses
Fishing 67 63.2%
Retired/Pension 14 13.2%
Construction 4 3.8%
Musician 2 1.9%
Fish scaling/cleaning 2 1.9%
Fish market owner 2 1.9%
Business owner 1 .9%
Gardner 1 .9%
Mechanic 1 .9%
Carpenter 1 .9%
Works for government 1 .9%
Recreation and sports 1 .9%
Electrician 1 .9%
Chef 1 .9%
Tourism boats 1 .9%
Renting truck to FEMA 1 .9%
Insurance company 1 .9%
Waiter 1 .9%
Cruise ship baggage handler 1 .9%
Painter 1 .9%
Marina employee 1 .9%
100
Appendix 15
Complete list of fishing methods/gear types mentioned by fishers in period 2:
Methods/Gear Types N % of Responses
Buceo (scuba diving) 36 26.9%
Cordel/Hilo (handline) 30 22.4%
Nasas (traps) 15 11.2%
Cana/Carrete (rod & reel) 9 6.7%
Figa/Arpon (harpoon) 9 6.7%
Trasmallo (gillnet) 8 6.0%
Tarralla/Atarraya (cast net) 4 3.0%
Malacate (electric line hauler) 4 3.0%
Anzuelo (hook) 3 2.2%
Malla (net) 3 2.2%
Silga (trolling) 3 2.2%
Free Diving/Snorkeling 2 1.5%
Mallorquin (trammel net) 2 1.5%
Trolling 2 1.5%
Trampas (traps) 1 .7%
Lazo 1 .7%
Cajones 1 .7%
Balaju 1 .7%
101
Appendix 16
Complete list of target species mentioned by fishers in period 2:
Target Species N % of Responses
Langosta (lobster) 41 12.8% Carrucho (queen conch) 37 11.5% Sama (mutton snapper) 30 9.3% Colirubia (yellowtail snapper) 29 9.0% Mero (groupper) 28 8.7% Capitan (hogfish) 24 7.5% Pargo (snapper) 21 6.5% Sierra (king mackerel) 19 5.9% Arrayao (lane snapper) 12 3.7% Mero Cabrilla (red hind) 11 3.4% Chillo (silk snapper) 11 3.4% Dorado (dolphinfish) 8 2.5% Pulpo (octopus) 6 1.9% Peje Puerco (trigger fish) 5 1.6% Cartucho (queen snapper) 5 1.6% Jurel (crevalle jack) 5 1.6% Loro (parrotfish) 4 1.2% Cojinua (blue runner) 4 1.2% Robalo (snook) 4 1.2% Corvino (whitemouth croaker) 2 .6% Pescado (finfish) 2 .6% Boquicolorao (white grunt) 2 .6% Pluma (porgy) 2 .6% Atun (tuna) 1 .3% Tiburon (shark) 1 .3% Salmonete (goat fish) 1 .3% Pez Leon (lion fish) 1 .3% Sardinas (sardines) 1 .3% Picua (barracuda) 1 .3% Peto (wahoo) 1 .3% Jueye (land crab) 1 .3% Carey (hawksbill turtle) 1 .3%
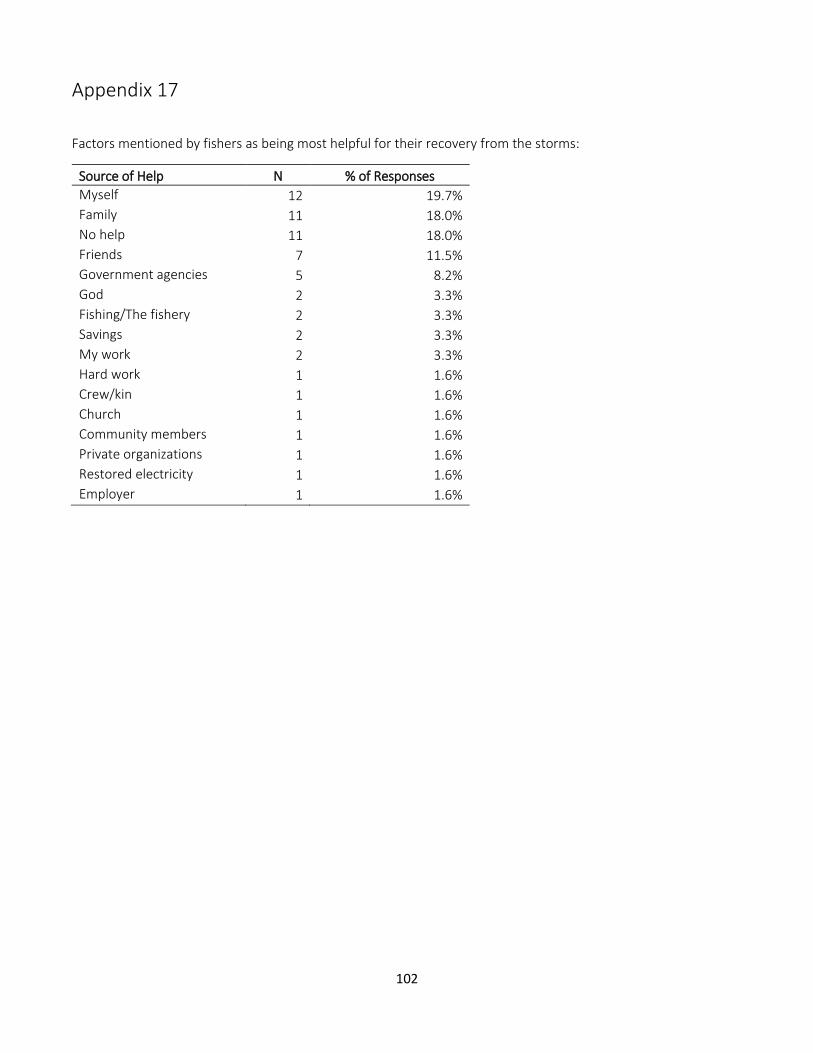
102
Appendix 17
Factors mentioned by fishers as being most helpful for their recovery from the storms:
Source of Help N % of Responses
Myself 12 19.7%
Family 11 18.0%
No help 11 18.0%
Friends 7 11.5%
Government agencies 5 8.2%
God 2 3.3%
Fishing/The fishery 2 3.3%
Savings 2 3.3%
My work 2 3.3%
Hard work 1 1.6%
Crew/kin 1 1.6%
Church 1 1.6%
Community members 1 1.6%
Private organizations 1 1.6%
Restored electricity 1 1.6%
Employer 1 1.6%
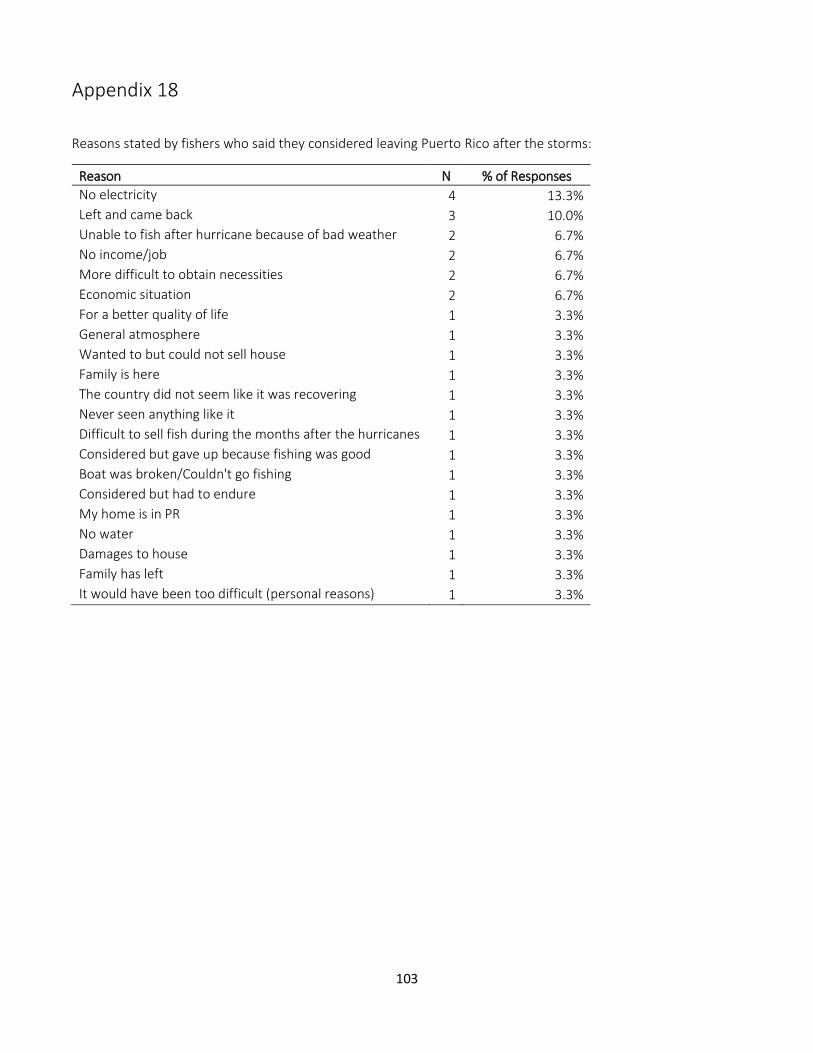
103
Appendix 18
Reasons stated by fishers who said they considered leaving Puerto Rico after the storms:
Reason N % of Responses
No electricity 4 13.3%
Left and came back 3 10.0%
Unable to fish after hurricane because of bad weather 2 6.7%
No income/job 2 6.7%
More difficult to obtain necessities 2 6.7%
Economic situation 2 6.7%
For a better quality of life 1 3.3%
General atmosphere 1 3.3%
Wanted to but could not sell house 1 3.3%
Family is here 1 3.3%
The country did not seem like it was recovering 1 3.3%
Never seen anything like it 1 3.3%
Difficult to sell fish during the months after the hurricanes 1 3.3%
Considered but gave up because fishing was good 1 3.3%
Boat was broken/Couldn't go fishing 1 3.3%
Considered but had to endure 1 3.3%
My home is in PR 1 3.3%
No water 1 3.3%
Damages to house 1 3.3%
Family has left 1 3.3%
It would have been too difficult (personal reasons) 1 3.3%

104
Appendix 19
Factors mentioned by fishers as reasons for fishing less after the storms:
Factor N % of Responses
Weather related 13 30.2%
Marejadas/Bad ocean conditions 5 11.6%
Winds/Changes in wind patterns 4 9.3%
Impacts of hurricane on sea bottom 4 9.3%
Boat is/was damaged/lost 3 7.0%
Because there is less fish 3 7.0%
Damage to pier/Fishing infrastructure/villa pesquera 3 7.0%
Sales declines because there was less people to buy 1 2.3%
Got hurt after hurricane fixing a tree and cannot fish 1 2.3%
Went to the US after hurricane and back recently 1 2.3%
Has been busy helping family rebuild 1 2.3%
Don't know why 1 2.3%
Impacts of hurricanes on fishery 1 2.3%
Age 1 2.3%
Sargassum 1 2.3%
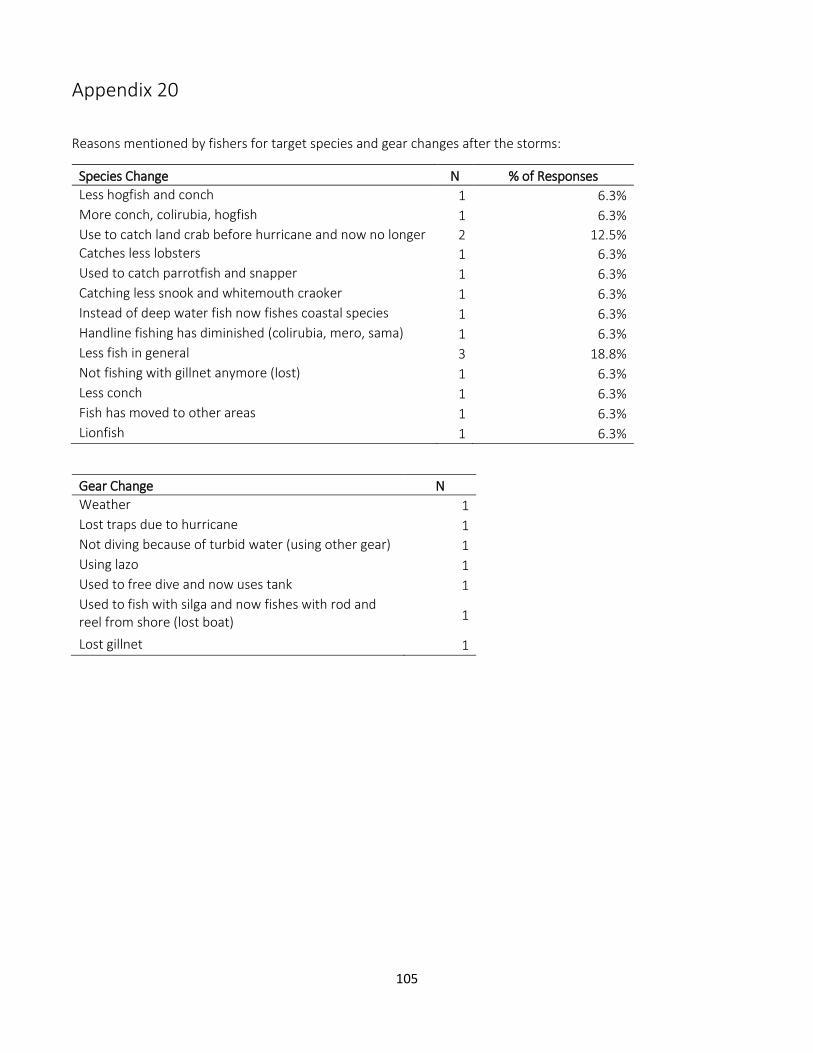
105
Appendix 20
Reasons mentioned by fishers for target species and gear changes after the storms:
Species Change N % of Responses
Less hogfish and conch 1 6.3%
More conch, colirubia, hogfish 1 6.3%
Use to catch land crab before hurricane and now no longer 2 12.5% Catches less lobsters 1 6.3%
Used to catch parrotfish and snapper 1 6.3%
Catching less snook and whitemouth craoker 1 6.3%
Instead of deep water fish now fishes coastal species 1 6.3%
Handline fishing has diminished (colirubia, mero, sama) 1 6.3%
Less fish in general 3 18.8%
Not fishing with gillnet anymore (lost) 1 6.3%
Less conch 1 6.3%
Fish has moved to other areas 1 6.3%
Lionfish 1 6.3%
Gear Change N
Weather 1
Lost traps due to hurricane 1
Not diving because of turbid water (using other gear) 1
Using lazo 1
Used to free dive and now uses tank 1
Used to fish with silga and now fishes with rod and reel from shore (lost boat) 1
Lost gillnet 1
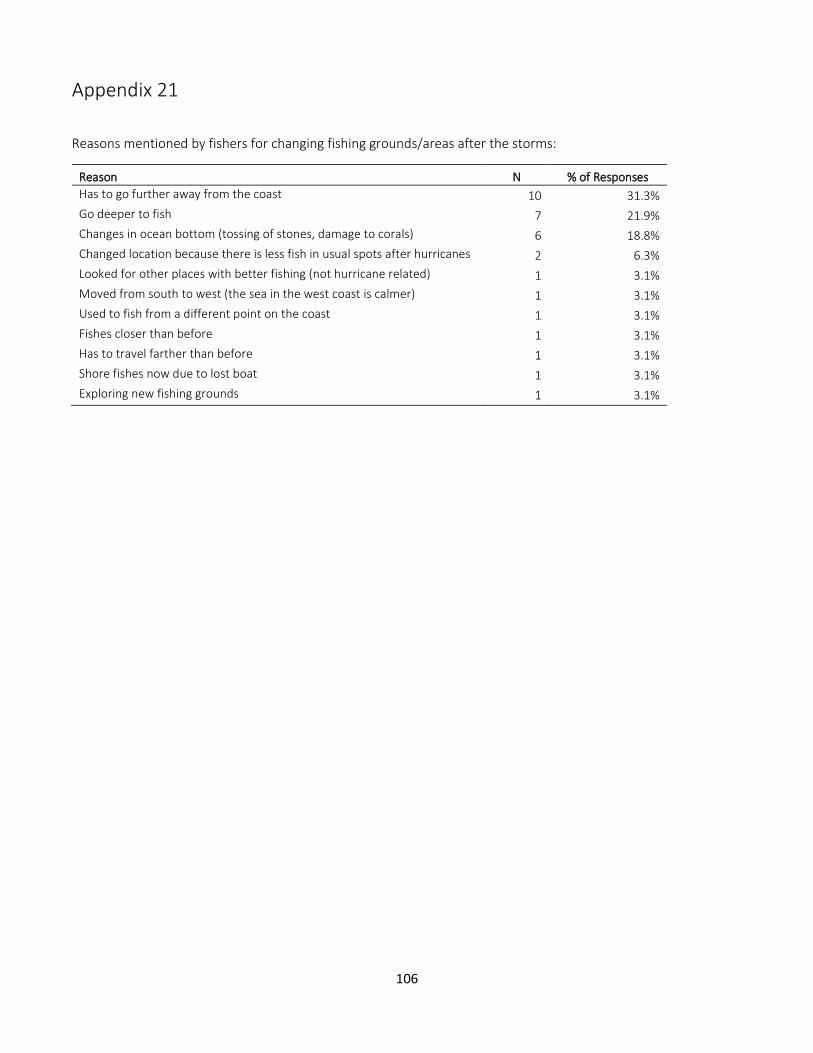
106
Appendix 21
Reasons mentioned by fishers for changing fishing grounds/areas after the storms:
Reason N % of Responses
Has to go further away from the coast 10 31.3%
Go deeper to fish 7 21.9%
Changes in ocean bottom (tossing of stones, damage to corals) 6 18.8%
Changed location because there is less fish in usual spots after hurricanes 2 6.3%
Looked for other places with better fishing (not hurricane related) 1 3.1%
Moved from south to west (the sea in the west coast is calmer) 1 3.1%
Used to fish from a different point on the coast 1 3.1%
Fishes closer than before 1 3.1%
Has to travel farther than before 1 3.1%
Shore fishes now due to lost boat 1 3.1%
Exploring new fishing grounds 1 3.1%
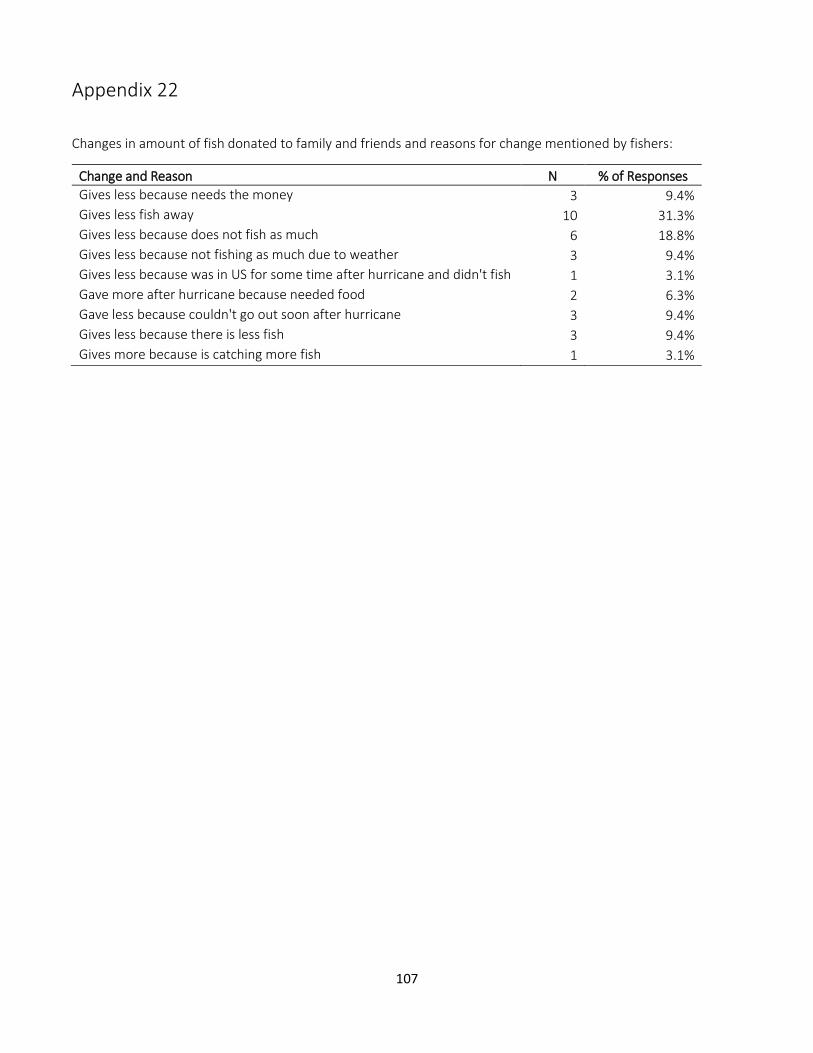
107
Appendix 22
Changes in amount of fish donated to family and friends and reasons for change mentioned by fishers:
Change and Reason N % of Responses
Gives less because needs the money 3 9.4%
Gives less fish away 10 31.3%
Gives less because does not fish as much 6 18.8%
Gives less because not fishing as much due to weather 3 9.4%
Gives less because was in US for some time after hurricane and didn't fish 1 3.1%
Gave more after hurricane because needed food 2 6.3%
Gave less because couldn't go out soon after hurricane 3 9.4%
Gives less because there is less fish 3 9.4%
Gives more because is catching more fish 1 3.1%