SOCIAL SPENDING AND INCOME REDISTRIBUTION IN … · 2013-09-02 · SOCIAL SPENDING AND INCOME...
28
Transcript of SOCIAL SPENDING AND INCOME REDISTRIBUTION IN … · 2013-09-02 · SOCIAL SPENDING AND INCOME...

2
SOCIAL SPENDING AND INCOME REDISTRIBUTION IN ARGENTINA DURING THE 2000S: THE RISING ROLE OF NONCONTRIBUTORY PENSIONS
Nora Lustig and Carola Pessino*
CEQ Working Paper No. 5
JANUARY 2013
Revised: AUGUST 2013
ABSTRACT
Between 2003 and 2009, Argentina’s social spending as a share of GDP increased by 7.6 percentage points. Benefit incidence analysis for 2003, 2006, and 2009 suggests that the contribution of cash transfers to the reduction of disposable income inequality and poverty rose markedly between 2006 and 2009, primarily due to the introduction of a new noncontributory pension program – known as “the pension moratorium” – in 2004. The redistributive impact of the expansion of public spending on education and health was also sizeable and equalizing, but to a lesser degree. An assessment of fiscal funding sources puts the sustainability of the redistributive policies into question, unless nonsocial spending is significantly cut.
Keywords: social spending, benefit incidence, inequality, poverty, Argentina
JEL Codes: D31, H22, I38
* This paper is an extended version of Lustig and Pessino (2012). Nora Lustig is Samuel Z. Stone Professor of Latin American Economics, Tulane University (Department of Economics; Stone Center for Latin American Studies and CIPR); nonresident fellow, Center for Global Development and Inter-American Dialogue. Carola Pessino is Senior Researcher, Department of Economics at the Universidad del CEMA, Argentina and Visiting Fellow of the Center for Global Development, Washington, DC. Both authors are very grateful to Jim Alm and an anonymous referee for excellent comments and to Nicole Florack , Emily Travis and Juan Carlos Monterrey for excellent research assistantship.

3
1. INTRODUCTION
In 2002, Argentina was in a deep economic crisis. Thanks to a sharp increase in the price of soybeans on the global market that same year, however, the crisis was short-lived. Starting in 2003, Argentina’s GDP began to grow at unprecedented rates. The spectacular economic recovery coincided with the return of a traditional justicialista regime to the presidency.1 Justicialismo (or Peronism as it is also known)—first instituted by Juan Domingo Peron in the 1940s--is a mass movement with strong populist underpinnings. True to its roots, the new government has engaged in fiscal expansion and redistribution policies on a large scale. Between 2003 and 2009, the Argentine government’s primary consolidated spending 2 grew by 13.5 percentage points to reach 40.6 percent of GDP. Social spending accounts for about 56 percent of the increase, nonsocial spending for about 37 percent, and contributory pensions for about 7 percent. Within the social spending category, the increase is roughly evenly distributed among noncontributory pensions, government spending on education and health, and other forms of social spending (see Table 1).
What has been the redistributive impact of such an extraordinary expansion in government spending? Using the Encuesta Permanente de Hogares3 --hereafter EPH--for 2003, 2006, and 2009, we applied standard benefit incidence analysis to analyze the impact of social spending on poverty and inequality and how this has changed over time. This article also includes a brief examination of how the expansion in public spending has been financed and whether it is sustainable. It does not incorporate behavioral, life-cycle, or general equilibrium effects. In spite of these limitations, this study is one of the most thorough incidence analyses for Argentina’s social spending for the period considered.4 Furthermore, since our incidence analysis covers three years, we are able to assess the marginal effects of the changes in social policy introduced during this period.
The article is organized as follows. Section 2 presents a summary of Argentina’s social and nonsocial spending. Section 3 presents the main results of the incidence analysis. Section 4 discusses the fiscal sustainability of Argentina’s growing public spending, and Section 5 summarizes the main conclusions. It should be noted that a detailed description of the common methodology used in all the papers of this special issue is included in Lustig and Higgins (2013) and Lustig, Pessino and Scott (2013).
1 Nestor Kirchner from the Partido Justicialista was elected president in 2003 and was succeeded by his wife Cristina Fernandez de Kirchner in 2007. 2 Primary spending here includes consolidated spending by federal, state and municipal governments, and the City of Buenos Aires (Ciudad Autonoma de Buenos Aires) and excludes debt servicing. 3 Collected by the Instituto Nacional de Estadísticas y Censos (INDEC) of Argentina. 4 The pioneer study was Petrei (1987), followed among others by DGSC (1994), DGSC(1999), Gasparini (1999) and DGSC (2002).

4
TABLE 1. GOVERNMENT SPENDING BY CATEGORY (AS A PERCENT OF GDP): 2003, 2006, AND 2009
2003 2006 2009 Change 2009-
2003 (% pts) Share of the increase (in %)
Gross Nat Inc/capita (PPP US$) 8,180 11,740 14,230 Total Government Spending a 29.5% 32.9% 43.2% 13.7% -- Primary Government Spending b 27.1% 30.7% 40.6% 13.5% 100.0% Social Spending c 13.0% 15.4% 20.6% 7.6% 56.1% Social Spending (In Incidence Analysis Benchmark) d 7.3% 8.3% 11.8% 4.5% 33.4%
Total Cash Transfers 2.0% 2.0% 3.7% 1.7% 12.6% Cash Transfers (excluding all pensions)
1.3% 0.7% 0.8% -0.5% -4.0%
Non-Contributory Pensions 0.7% 1.2% 2.9% 2.2% 16.6% Morator ium Pens ions 0.4% 0.8% 2.4% 2.0% 14.4% Total In Kind Transfers 5.3% 6.3% 8.1% 2.8% 20.8% Education 3.4% 4.3% 5.6% 2.1% 15.6% Health Primary Case 1.9% 2.0% 2.6% 0.7% 5.2% Other Social Spending (Not in Incidence Analysis) e
5.7% 7.1% 8.8% 3.1% 22.7%
Non-Social Spending f 7.9% 9.6% 12.8% 4.9% 36.5% Indirect Subsidies 2.5% 3.8% 5.6% 3.1% 23.3% Other Non-Social Spending g 5.4% 5.9% 7.2% 1.8% 13.2% Contributory Pensions (In Sensitivity Analysis) 6.2% 5.7% 7.2% 1.0% 7.4%
Debt Servicing 2.4% 2.2% 2.6% 0.2% 1.3% Memo item: TOTAL Pensions 6.8% 6.9% 10.0% 3.2% 23.9% Contributory 6.2% 5.7% 7.2% 1.0% 7.4% Non-Contributory 0.7% 1.2% 2.9% 2.2% 16.6% Financing of Total Government Spending 29.5% 32.9% 43.2% 13.7% 100.0%
Total Government “Actual” and “Creative” Revenues
30.4% 34.5% 41.0% 10.6% 77.3%
Total Government Tax Collection 23.4% 27.4% 31.4% 8.0% 58.3% Total Government “Actual” Non Tax Revenue 6.8% 6.6% 7.6% 0.8% 6.1%
Total Government “Creative” Non Tax Revenue 0.2% 0.5% 2.0% 1.8% 12.9%
Official “Creative” Public Sector Borrowing -0.9% -1.6% 2.2% 3.1% 22.7% “Actual” Public Sector Borrowing Requirements
-0.7% -1.1% 4.1% 4.9% 35.7%
Source: Authors’ calculations based on Direccion Nacional de Gasto Publico, Ministry of Economy Argentina, ANSES and the methodology to impute moratorium pensions from the text Notes: a. Total Government Spending = Primary Government Spending + Debt Services (interests and Amortizations) b. Primary Government Spending = Social Spending (w/o Contributory Pensions) + Non Social Spending (w/o Contributory Pensions) + Contributory Pensions c. Social Spending =Social Spending Incidence Benchmark + Other Social Spending d. Social Spending Incidence Benchmark = Cash Transfers (excluding pensions)+Non-Contributory Pensions + Education + Health e. Other Social Spending = Health Insurance for formal workers (Obras Sociales)+ Health Insurance for formal workers retired (PAMI)+Social Assistance (Obras Sociales) + Social Assistance (PAMI)+Nutrition Program+ Family Assignments+ Other Federal, Provincial and Municipal Social Assistance Spending + Water and Sanitation + Housing + Other Urban Services + Culture (other Education)

5
f. Non-Social Spending = Indirect Subsidies + Other Non-Social Spending g. Other Non-Social Spending = Government Administration
2. SOCIAL SPENDING IN ARGENTINA: A BIRD’S EYE VIEW
The categories for which we were able to undertake the incidence analysis include main cash transfers, noncontributory pensions, and public spending on education and primary healthcare; hereafter we shall refer to the sum of these categories as Social Spending. In our benchmark scenario, contributory pensions are included under net market income. Since, as discussed in Lustig and Higgins (2013), contributory pensions are a mix of deferred consumption and government transfers, we also carried out the benefit incidence analysis with contributory pensions included under government transfers to check the sensitivity of our results. In what follows, we present a brief description of each category included in the incidence analysis.
i Direct Cash Transfers
Direct Cash Transfers (excluding noncontributory pensions) include the following programs: Jefes y Jefas de Hogar Desocupados (JJHD, unemployed heads of households); Ingreso para el Desarrollo Humano (IDH, income for human development); Familias para la Inclusión Social (family allowances for socal inclusion) until 2006 and after 2006, scholarship programs, unemployment insurance, and Asignación Universal por Hijo (AUH; universal per child allowance ). The total amount spent on these cash transfers as a share of GDP was 1.3 percent in 2003, 0.7 percent in 2006 and 0.8 percent in 20095. It should be noted that the year 2003 was somewhat unusual. As a result of the 2001-2002 macroeconomic crisis, unemployment had risen to 17.2 percent and poverty rates had peaked. To alleviate the situation, cash transfers to the unemployed were significantly expanded. With economic recovery and the accompanying decline in unemployment, these programs were scaled back. In what follows, we present a brief description of each category included in the incidence analysis.
i. Jefes y Jefas de Hogar Desocupados (JJHD) (Unemployed Male and Female Heads of Household) is a workfare program launched in 2002 in response to the 2001-2002 crisis (theoretically, conditional on being unemployed, but enforcement has been rather weak). It consists of a monthly payment of $150 (equivalent to US$52 in 2003) until the beneficiary finds a job in the formal sector or is transferred to a new program. The target population is comprised of unemployed household heads with dependents (children aged less than eighteen or people who are incapacitated), regardless of whether the family lives in poverty. In contrast to its predecessor, the Trabajar program, JJHD does not have an explicitly stated poverty focus (Galasso and Ravallion 2004); however, JJHD is much larger so one would expect its poverty reducing impact to be quite bigger than Trabajar’s.
Spending on the program was approximately equal to 1 percent of GDP in 2003 and decreased to 0.03 percent of GDP in 2009. In 2009, there were approximately 450,000 beneficiaries, according to official records. 5 Budget data for the categories discussed in this paper was obtained from various official sources: The Ministry of the Economy and Public Works, The Chief of Cabinet of Ministers, the Ministry of Social Development and ANSES’s websites, as well as the publications cited in this article. Regretfully, the Argentine government does not publish the information on spending by detailed categories all in one place so they need to be constructed by using different sources that report spending program by program.
6
ii. Programa Familias para la Inclusion Social (Families Program for Social Inclusion) is a conditional cash transfer (CCT) launched in 2006. The target population is household heads with less than complete secondary education and with two or more children younger than nineteen (or handicapped of any age). The target population is mostly restricted to previous beneficiaries of JJHD and IDH. 6
Female household heads are the prime beneficiaries of the subsidy; in case of their absence, the father is the recipient. The heads receive a monthly payment of $155 with one child and $30 more for each additional child, up to a maximum of $305 (equivalent to US$100 in 2006) which corresponds to a household with six children younger than nineteen years of age. There is no time limit to the reception of the benefit unless, when adding the income of the rest of family, income exceeds the legal minimum wage. The subsidy is conditional on fulfilling the vaccination calendar and on all children attending or finishing secondary school. With the creation of AUH, it is expected that the Familias program will be gradually phased-out as beneficiaries are moved to the new AUH (described immediately below).
The number of beneficiaries was equal to 695,177 families in 2009, according to official records. Spending on the program was equal to 0.08 percent in 2003 (in IDH) and 0.05 percent of GDP in 2009.
iii. Asignacion Universal por Hijo (AUH) (Universal Child Allowance) is a large-scale targeted conditional cash transfer (CCT), launched in November 2009. The target population is families with children (aged eighteen or younger) whose household head is unemployed or working in the informal sector, and who do not receive another form of family allowance. If employed in the informal sector, the income should be below the minimum wage. The transfer is set at $180 (equivalent to US$49 in 2009) a month per child (until a maximum of five children) to every beneficiary household. Of this amount, $30 per month per child is retained until it is demonstrated that the school and vaccination requirements are met.
According to official records, in 2010 there were 1.87 million household (3.5 million children) enrolled in the program. Spending was 7,164 million pesos in 2010 or approximately 0.6 percent of 2009 GDP.
iv. Scholarship Programs (Programa Nacional de Becas Estudiantiles (PNBE) para la Inclusion Social) is a set of programs originally launched in 1997 as the Programa Nacional de Becas Estudiantiles (PNBE) that expanded in 2002 in response to the 2001-2002 crisis and has since added different types of scholarships for special groups, including scholarships to bring children back to school, scholarships for children in rural schools, inclusion of children with judicial processes, and scholarships for technical training, among others. The scholarships are meant to increase school retention, primarily in secondary school among poor families; beneficiary households should earn incomes of $1,200 (equivalent to US$327 in 2009) or below. The scholarship consists of a yearly transfer of $900 (US$245 in 2009).
Spending on the PNBE program was approximately equal to 0.04 percent of GDP in 2003 and decreased to 0.02 percent of GDP in 2009. In 2009, there were approximately 500,000 beneficiaries, according to official
6 Since new beneficiaries were not allowed in this program initially, the conditions of eligibility apart from belonging first to JJHD or Familias was not clearly set beyond mentioning the educational requirement or the “vulnerability or poorness” of the household.
7
records.7
v. Unemployment Insurance (Seguro de Desempleo) is a contributory program launched in 1993. There is a basic unemployment benefit that is calculated as half of the best remuneration in the last six months of employment, but which cannot exceed $300 per month (US$82 in 2009), or be less than $150 per month (US$41 in 2009). The duration of the unemployment benefits is determined based on the time a person has been employed and contributing to the social security system in the three years prior to the occurrence of unemployment. Insurance for Training and Employment (Seguro de Capacitacion y Empleo) is a noncontributory program launched in 2004 for unemployed individuals that transfers $225 per month in 2009 (US$61 in 2009). Beneficiaries must complete their schooling or be enrolled in specialization courses or training programs.
Spending on these programs was approximately equal to 0.23 percent of GDP in 2003 and decreased to 0.08 percent of GDP in 2009. In 2009, there were approximately 147,000 beneficiaries of the contributory unemployment insurance according to official records.8
ii Noncontributory Pensions
Traditionally, noncontributory pensions or social assistance pensions have existed in Argentina since 1948. However, in our analysis we also include as noncontributory the so-called Moratoria Previsional (the pension moratorium ), introduced in 2004-2005, that allowed workers of retirement age to receive a pension regardless of whether they had completed the full 30 years of required social security contributions through formal employment9. It should be noted that in Argentina’s official classification, only the first are called noncontributory pensions. However, this is inaccurate. Moratorium pensions are much closer to noncontributory pensions than to formal sector social security contributory pensions. For this reason this article considers both traditional social assistance pensions and the pension moratoriums to be noncontributory pensions.
i. Pensiones Graciables y Asistenciales (Social Assistance Noncontributory Pension) include old-age pensions and other special benefits, some of which have been in place since 1948. The transfers are set to be equal to or below the minimum level of contributory pensions, depending on a series of criteria. In December 2009, the average monthly social assistance old-age pension was equal to $723 (equivalent to US$195 in 2009) and for other types of pensions the average was equal to $1,011(equivalent to US$272 in 2009).
From December 2002 to 2009 the total of social assistance pension beneficiaries increased from 332,144 to
7 See Rosas (2007) on the description of the scholarship programs and estimated amount of benefits and beneficiaries. The number of the total beneficiaries and budget of all the scholarship programs that increased in diversity since 2004 is not documented well and hence is not included. Therefore, these amounts are underestimating the total amount of scholarships received by students, especially in 2006 and 2009. 8 See Boletin Estadistico de la Seguridad Social 2010 (ANSES). The number of beneficiaries of the Seguro de Capacitacion y Empleo could not be found in any of the many sources that were consulted. 9 Law 25.994/04 of Previsional Inclusion and Decree 1454-05 extended the expired Moratorium Law 24476 from 1995. While the 2004 law expired in 2007, the 2005 decree is still ‘active’ and applies to individuals who contributed between January 1, 1955 and September 30, 1993. The number of beneficiaries will decline over time and eventually reach zero as thee is a fixed date after which it will no longer apply.
8
719,597.10 Spending on the program was 0.2 percent and 0.5 percent of GDP in 2003 and 2009, respectively.
ii. Moratoria Previsional (Pension Moratorium) consists of noncontributory or partially contributory – as explained further below – pensions and was launched through the passage of two laws in 2004 and 2005.11 While the first law expired in 2007, the second continues through the present.
The target population is women aged sixty or older and men sixty-five or older who have not fulfilled the requirement necessary to receive contributory pensions after thirty years of contributions to the system. Beneficiaries must pay back part of what they should have contributed; the amount is subtracted from the pension during the first five years in which benefits are paid. An eligible individual that never contributed to the system will receive approximately $395 per month (US$107 in 2009) for the first five years – an amount that is equivalent to 51 percent (49 percent is the maximum deduction allowed) of the moratorium pension of approximately $770 per month (US$208 in 2009). After five years, he or she will start to receive the full amount of the moratorium pension.
The number of beneficiaries was negligible in 2003 (mostly surviving from previous moratorium laws in the nineties), about 200,000 in 2006 and, at the end of 2009, there were approximately 2,200,000 beneficiaries. The number of beneficiaries of the pension moratorium will decline over time and eventually reach zero since the moratorium applies only to people who were born before 1975. Spending on the moratorium program was approximately 0.4 percent of GDP in 2003 and 2.4 percent in 2009.12
iii Contributory Pensions
The contributory pension system was launched in 1904 but underwent a series of fundamental changes in the twentieth century, and especially during the last twenty years. In particular, in 1994 the pay-as-you-go system was replaced by a mixed system with both a public pay-as-you-go pillar and a private individual accounts pillar. The individual accounts, already negatively impacted during the 2001-200213 crisis were nationalized in December 2008, resulting in nearly US$30 billion dollars of assets belonging to individuals being confiscated and transferred to the state-run social security administration (Administracion Nacional de la Seguridad Social (ANSES). The current system is similar to the previous pay-as-you-go pillar, where the pension consists of a basic pension plus an additional pension based on earnings over the last ten years. The latter is not related to the amounts accumulated in the individual accounts so a number of people lost a significant portion of their savings due to this change in the pension system. The eligibility requirements of the ‘new’ system did not change.
Since 2003, the contributory pension system has had a roughly constant number of beneficiaries, on the
10 According to Boletin Estadistico de la Seguridad Social 2010 (ANSES). 11 These are the Law 25.994/04 of Previsional Inclusion and Decree 1454-05 that extended an expired Moratorium Law 24476 from 1995. While the 2004 law expired in 2007, the second is still ‘alive’ and applies to individuals who contributed between January 1, 1955 and September 30, 1993. 12 Since the official budget does not discriminate between moratorium and nonmoratorium pensions, the estimation is based on the number of moratorium benefits times 95 percent of the minimum pension. 13 Under this system, the insured had a choice between the public insurance and a system of individual pension accounts, managed by private institutions known by their acronym in Spanish as AFJPs. With the macroeconomic crisis of 2001-2002, Argentina’s government lost access to funding through the international market and the AFJPs were forced to buy US$2.3 billion low-interest government bonds on which the government defaulted in 2002.

9
order of 3.3 million. Spending on the contributory program was approximately 6.2 percent of GDP in 2003, 5.7 percent in 2006 and 7.2 percent in 2009. In 2003 and 2006, the pay-as-you-go component of this spending was not fully funded by the contributions to the system but had a deficit of 2.3 percent and 1.4 percent of GDP, respectively. The deficit has been funded through taxes.
iv Education and Health
Education is a responsibility shared by the national government, the provincial and federal district governments and private institutions. The public education system includes primary, secondary and tertiary schooling. In 2009 it accounted for 76 percent of elementary school enrollment, 72 percent of secondary school enrollment, and 73 percent of post-secondary enrollment (superior and university). At present, preschool (for five-year-olds), elementary school and secondary school attendance is mandatory. As a percent of GDP, public spending on education equaled 3.4 percent in 2003, 4.3 percent in 2006 and 5.6 percent in 2009.
Health spending analyzed here includes spending on public health services (in hospitals and other public health facilities) and spending on public health campaigns. This definition of health spending does not include Obras Sociales or PAMI spending, which is mostly funded through workers’ contributions. As a percent of GDP, public spending on health was equal to 1.9 percent in 2003, 2.0 percent in 2006 and 2.6 percent in 2009. (The rest of public spending on health is included in Other Social Spending in Table 1).
3. DATA AND METHODOLOGICAL HIGHLIGHTS
All the calculations presented here are made on the basis of data from the household surveys (EPH) collected by INDEC in 2003 (2nd Semester), 2006 (2nd Semester) and 2009 (1st Semester) 14. The EPH’s sample includes over 90,000 individuals and reports individual characteristics, labor force participation, employment/unemployment, and labor and non-labor income of all household members by source, including several cash transfer programs from the government. The survey covers urban areas only and is representative of 62 percent of the total population; the excluded population is mainly small urban areas and the rural sector. Although the survey does not include rural areas, we – as well as most studies for Argentina – are assuming that this will not affect our conclusions in any significant way. Using a one-time nationally representative survey, Fiszbein, Giovagnoli, and Aduriz (2003) found that “…even though the incidence of poverty/indigence is, as expected, much higher in rural areas, the addition of rural areas in the estimation does not have a significant effect on national rates given the relative size of the two groups” (148).
Regarding the impact on income distribution, we really do not know if we can assume that results would remain unaffected if rural areas were included. Our view here is that with EPH we get a fairly accurate assessment of the situation of two-thirds of the population in Argentina and that if it were possible to include rural areas our results might change, but not in a systematic way. In other countries in Latin America, excluding rural areas would result in systematically lower market income poverty rates, lower coverage of social programs and higher market income inequality. We would tend to underestimate the
14 For more details see http://www.indec.gov.ar/.
10
redistributive effort of the government if rural areas were not included.15 If Argentina is assumed to be similar to the other countries, then here we are probably underestimating the redistributive impact of fiscal policy, rather than the other way around. Our results would be a lower bound. However, Argentina is mainly an urban country (90 percent of the population lives in urban areas) with a relatively small share of indigenous population and a high coverage of social programs in both urban and rural areas.16 Hence, we may not be underestimating the redistributive effect of fiscal policy after all.
We do not scale-up the income data from the survey to national accounts when estimating the redistributive impact of imputed public spending because Argentina does not report measures of disposable income in its national accounts.17 However, we did check if scaling-up using total private consumption (instead of disposable income which does not exist) as a control total would affect the results from 2009. We found that the final income Gini with scaling-up was equal to 0.371 instead of 0.366, a small difference especially when compared to the decline from disposable income Gini to final income Gini found here. Given the intense controversy surrounding official estimates of inflation—which led to the government being censured by the IMF in February 2013--, this paper uses inflation rates calculated by Bevacqua and Salvatore (2009) in all its calculations. 18
The allocation and amount of several of the direct cash transfers is directly identified based on the information reported by households in response to specific questions. This is the case of JJHD, unemployment benefits, and scholarships. Transfers received from IDH and Familias, however, are inferred from a question that asks if the household receives any additional cash transfer program.
In the case of AUH, since it did not exist until November 2009, the benefits have to be simulated. We follow the methodology described in Pessino (2010) that simulates most of the conditions necessary to assess the program, such as the requirement that none of the parents of the children work in the formal sector or receive pensions, except for work in the domestic service, and that informal workers earn less than the minimum wage (basically none of them should be receiving family allowances). But we could not impose conditions dealing with migration and time of residence. We also assume that if families are accepted into AUH, they are automatically dropped from Familias and other programs, as the law requires. Agis, Cañete, and Panigo (2010), however, allows for an “inclusive” option, in which families violate the law and have more than one social program per family, concluding that poverty would then decrease even more. In other
15 See Lustig et al. (2012). 16 For how widespread the coverage of AUH and pension programs is see http://www.anses.gob.ar/blogdeldirector/archives/2474. 17 Not scaling-up has the problem that the redistributive impact of spending categories that are imputed by dividing the reported public spending (from public accounts) by total beneficiaries (from public accounts) could be “exaggerated” whenever the incomes in the survey are (substantially) lower than those in public accounts. For example, let’s say that total household disposable income in the survey is 60 percent of what national accounts report for a (relatively) comparable category of disposable income but disposable income in the survey is not scaled-up. The income in-kind from, let’s say, primary education is scaled-up by definition because it is calculated by dividing public spending on primary education by the number of children enrolled in primary education and this amount is allocated to each household depending on how many of its children are enrolled in primary education. When we do this, the incidence and redistributive impact of public spending on primary education (as well as any other imputed public expenditure) is likely to be blown out of proportion. However, our sensitivity analysis for 2009 suggests that the effect on the final income Gini would be very small. 18 The December/December inflation rates in Bevacqua and Salvador (2009)/official statistics were equal to 10.7/9.8 percent in 2006, 25.7/8.5 percent in 2007, 23.0/7.2 percent in 2008 and 14.8/7.7 percent in 2009. When we started writing this paper, the information on inflation for 2009 (and the rest of the years) was available in the Buenos Aires City website.

11
words, if the law is violated in practice frequently, then our estimate should be viewed as a lower bound (conservative) on the simulated benefits of AUH because we do not permit a household receiving benefits from another cash transfer program to be eligible for AUH. The number of beneficiaries obtained from this simulation country-wide is approximately 1.8 million families. This number coincides with the number of head of households reported by ANSES as receiving the AUH transfers.19
Benefits from noncontributory pensions (which include moratorium and social assistance pensions) could not be independently identified in the surveys; they are lumped together with contributory pensions and therefore must be inferred. Since all the “new” pensioners of the noncontributory pension (i.e., those that were added since the passage of the pension moratorium decrees in 2004) get the minimum pension (of the contributory system) minus the payments required to qualify for the pension, to identify the beneficiaries of the pension moratorium and social assistance pensions together we find the individuals reporting a pension below the minimum contributory pension in each of the years of the survey.20 Hence, reported pensions that are below the minimum contributory pension are subtracted from reported income to obtain net market income, the initial income category for our analysis since we do not analyze the tax side of the fiscal system. It should be noted that this entails a risk because due to the impossibility of distinguishing between the contributory and noncontributory pensions, we may inadvertently also be netting out contributory pensions whose level might be below the minimum, such as the survivor’s pension. Hence, we may be possibly overestimating the number of the net market income poor among the people. However, in terms of the marginal incidence effect of moratorium pensions this problem may be a moot point because the beneficiaries of survivor pensions is not likely to have increased between 2003 and 2009, so attributing the change to the expansion of beneficiaries of noncontributory pensions due to mainly the moratorium pensions seems a plausible assumption.
The in-kind transfers in education and health were imputed. The surveys include questions about school attendance by education level, and type of health care coverage. To impute the benefits of education spending, we divide the budget per school level, primary (starting in preschool), secondary, and university and tertiary level, by the number of enrolled students in each level in public school. We exclude other items included in the education budget that are not explicitly aimed at these levels, and hence we did not deduct administrative costs.21
The surveys do not include questions on the use of public health facilities, only if an individual is or is not affiliated with a health provider, so individuals that declare having no health insurance (either private or
19The number of beneficiaries reported by ANSES were around 1.9 million since November 2009 (1.871 million in November 2009 and 1.897 million in March 2012). From Boletin Estadistico de la Seguridad Social, Ministerio de Trabajo, Empleo y Seguridad Social, Secretaria de Seguridad Social, Cuarto Trimestre 2011, 1er Trimestre 2012. 20 Monthly minimum contributory pensions were considered to equal $220 in 2003, $470 in 2006 and $770 in 2009. 21 Budget figures are obtained from the Secretaria de Politica Economica from the Ministry of the Economy http://www.mecon.gov.ar/ and enrollment figures were obtained for primary (including preschool), secondary and tertiary (nonuniversity) school from the Anuario Estadístico Educativo (Several Years) from 2003-2009 from the Direccion Nacional de Informacion y Evaluacion de la Calidad Educativa- Ministerio de Educación, Ciencia y Tecnología de la Nación. Diniece http://diniece.me.gov.ar and for university enrollment from Anuario de Estadisticas Universitarias (Several Years), from the Secretaria de Politicas Universitarias, Ministerio de Educación, Ciencia y Tecnología de la Nación. The estimated benefits were: in 2003, $1,255, $1,701 and $1,907 per year for primary, secondary and tertiary. (university and nonuniversity) level, respectively; in 2006, $2,559, $4,225 and $3,872 per year for primary, secondary and tertiary university level, respectively; and, in 2009 $5,484, $8,527 and $8,443 per year for primary, secondary and tertiary level, respectively.
12
from Obras Sociales) receive the imputed benefit. In this case, the in-kind transfer was obtained from the per capita government expenditure on health from World Health Statistics 2009 (WHO).22
In our incidence analyses, we use three income concepts: net market, disposable, and final income.23 Net market income is total current market income after direct taxes, 24 where market income is equal to the sum of gross (pre-tax) wages and salaries in the formal and informal sectors (also known as earned income); income from capital (dividends, interest, profits, rents, etc.) in the formal and informal sectors (excludes capital gains and gifts); autoconsumption (except in the case of Argentina and Bolivia);25 imputed rent for owner-occupied housing; private transfers (remittances and other private transfers such as alimony); and retirement pensions from the contributory social security system; minus direct personal income taxes on all income sources (included in market income) that are subject to taxation, and all contributions to social security except for the portion going towards pensions.26 Disposable income is equal to the sum of net market income plus government cash transfers. Final income is defined as disposable income plus government transfers in the form of free or subsidized services in education and health. For a detailed description of how each income concept is constructed see the Statistical Appendix, available upon request. 27
4. SOCIAL SPENDING AND INCOME REDISTRIBUTION IN ARGENTINA: MAIN RESULTS
i Evolution of Net Market and Disposable Income Inequality and Poverty
Between 2003 and 2009, both the net market income and the disposable income Gini coefficients and headcount ratios fell quite dramatically (see Table 2). This is true for any of the considered poverty lines, and for both the benchmark and sensitivity analysis. 28 Moreover, when we compare our results with those
22 Per capita government expenditure on health (PPP int.$) can be obtained from World Health Statistics for several years. For 2009 see, http://www.who.int/whosis/whostat/EN_WHS2011_Full.pdf and for earlier years http://apps.who.int/ghodata/?vid=1901. It was multiplied by PPP each year, to obtain an estimated in-kind transfer of $422 for 2003, $789 for 2006 and $1,365 for 2009. This cost was similar to the cost of one of the least expensive health insurance programs provided in the Province of Buenos Aires by Instituto de Obra Médico Asistencial (IOMA), (the public health provider of the Province of Buenos Aires) of a little more than 1,200 pesos per capita per year in 2009. On the high end, private insurance companies least expensive plans charged $2,100 per year. This shows that the cost estimated by WHO seems to be somewhere in between the costs of various providers that could offer health insurance to the poor in 2009, so we deemed it appropriate and adopted it for this study. 23 For more details on concepts and definitions, see Lustig and Higgins (2013). 24 Taxes include social security contributions in the benchmark analysis. 25 Argentina does not include a question on autoconsumption and in the case of Bolivia the results with autoconsumption are specious (e.g., Bolivia ends up with the same distribution of income as Uruguay and a lower rural poverty than Mexico) so we opted to not use them. 26 Since here we are treating contributory pensions as part of market income, the portion of the contributions to social security going towards pensions is treated as ‘saving.’ 27 The studies exclude corporate and international trade taxes, and spending categories such as infrastructure investment on urban services and rural roads that benefit the poor. 28 The results for the sensitivity analysis are in the unpublished appendix available upon request. .

13
of other sources, we find similar levels and exactly the same trends.29
TABLE 2. GINI AND HEADCOUNT INDEX FOR DIFFERENT INCOME CONCEPTS: ARGENTINA 2003, 2006, AND 2009
2003 2006 2009
Net Market Incomea
Disposable Income
Final Income
Net Market Income
Disposable Income
Final Income
Net Market Income
Disposable Income
Final Income
Benchmark caseb Gini 0.553 0.520 0.435 0.512 0.487 0.399 0.489 0.447 0.366
Effectiveness Indicator 3.0 2.9 2.5 2.7 2.3 2.1 Headcount index (%) $2.50 PPP/day 28.3% 23.2% -.- 13.5% 9.7% -.- 13.0% 5.5% -.- Effectiveness Indicator 9.0 14.4 15.6
$4.00 PPP/day 41.5% 38.2% -.- 22.7% 18.8% -.- 21.9% 14.4% -.- Effectiveness Indicator 4.0 8.8 9.3 Official National Extreme 30.6% 25.9% -.- 15.9% 11.8% -.- 9.6% 2.8% -.- Effectiveness Indicator 7.7 13.2 19.1 Official National Moderate 56.5% 54.7% -.- 38.3% 35.5% -.- 22.6% 15.7% -.-
Effectiveness Indicator 1.6 3.7 8.2 FIEL National Extreme 30.6% 25.9% -.- 15.9% 11.8% -.- 18.1% 10.6% -.-
Effectiveness Indicator 7.7 13.2 11.2 FIEL National Moderate 56.5% 54.7% -.- 38.3% 35.5% -.- 36.1% 30.6% -.-
Effectiveness Indicator 1.6 3.7 4.1 Notes:
a. Net market income equals market income minus income taxes and contributions to social security. b. All the indicators were calculated using the data on incomes from household surveys; they were not scaled-up to correspond to national accounts. Source: Authors’ calculations based on Encuesta Permanente de Hogares, 2003 2nd Semester, 2006 2nd semester, 2009 1st semester. As mentioned, 2003 was a year in which inequality and poverty reached historic peaks in the aftermath of the macroeconomic crisis in 2001-2002. This is not the place to discuss the factors behind the secular and transitory causes of inequality and poverty trends in Argentina. The interested reader should consult Gasparini and Cruces (2010). However, one should be aware that here we are analyzing changes in social policy during an unusual period. The severe macroeconomic crisis was followed by an unprecedented
29 For example, SEDLAC’s disposable income Gini coefficients and headcount ratios for the US$2.50 PPP and US$4 PPP per day poverty lines differ very slightly from the ones calculated here (SEDLAC 2012). (The comparison is in the unpublished appendix available upon request.) The only year for which the comparison of levels is not possible is 2009 because we included the simulated AUH transfer in our calculations of inequality and poverty. Since in 2009 AUH did not exist, SEDLAC’s numbers could not have included this transfer. As expected, our poverty rates are smaller than SEDLAC’s for 2009; our disposable income Gini is lower too, which is consistent with the fact that AUH is progressive in absolute terms (more on this below).

14
commodity-led boom and, after peaking in 2003, inequality and poverty fell rapidly. In spite of this fall, in 2009, the Gini coefficient reached a level similar to that of 1992 and the headcount ratio for “extreme poverty” (poverty line equal to US$2.50 per day) was still slightly above the one prevailing in 1992 (see SEDLAC 2012). Nevertheless, witnessing a decline in inequality and poverty is certainly good news. In terms of redistributive effectiveness, Table 2 shows that the government has been able to generate more poverty reduction per amount spent over time but the effectiveness of such expenditure in reducing inequality has declined. This reflects an increase in the budget share of noncontributory pensions and a decrease in the share of programs targeted especially to the poor, such as JJHD, Familias and AUH.
ii Social Policy vs. Market Forces
We look now at the extent to which the observed declines in the disposable income Gini coefficients (and headcount ratios) were due to a reduction in net market income inequality (poverty) or to the increase in the size and progressivity of social spending (which we can call the “redistribution component”). To calculate the contribution of the “redistribution component,” we simply subtract the change in the net market income Gini (headcount ratio) between any pair of years from the change in the disposable income Gini (headcount ratio) between the same end points. The difference is the portion of the change in the disposable income Gini (headcount ratio) between two points in time that can be attributed to a change in the redistribution component. Expressed mathematically, let 𝐺!! and 𝐺!! be the market and disposable income Ginis (headcount ratios) in
year t, respectively; and, 𝐺!!’ . and 𝐺!!’ be the market and disposable income Ginis (headcount ratios) in year t’. Let’s define 𝑅! and 𝑅!’ as the portion of disposable income Gini (headcount ratio) attributable to redistribution efforts. We can then write: 𝐺!! ≡ 𝐺!! - 𝑅! (1)
and
𝐺!!’ ≡ 𝐺!!’ -𝑅!’ (2)
Subtracting (2) from (1) yields:
(𝐺!!’ − 𝐺!!) ≡ (𝐺!!’ − 𝐺!! ) – (𝑅!’ − 𝑅!) (3)
or,
𝑅!’ − 𝑅! ≡ (𝐺!!’ − 𝐺!! ) – (𝐺!!’ − 𝐺!!) (4)
So, 𝑅!’ − 𝑅! is the portion of the change in the disposable income Gini (headcount ratio) between two points in time that can be attributed to a change in the redistribution component (in comparison to the change in the market income Gini (headcount ratio)).
15
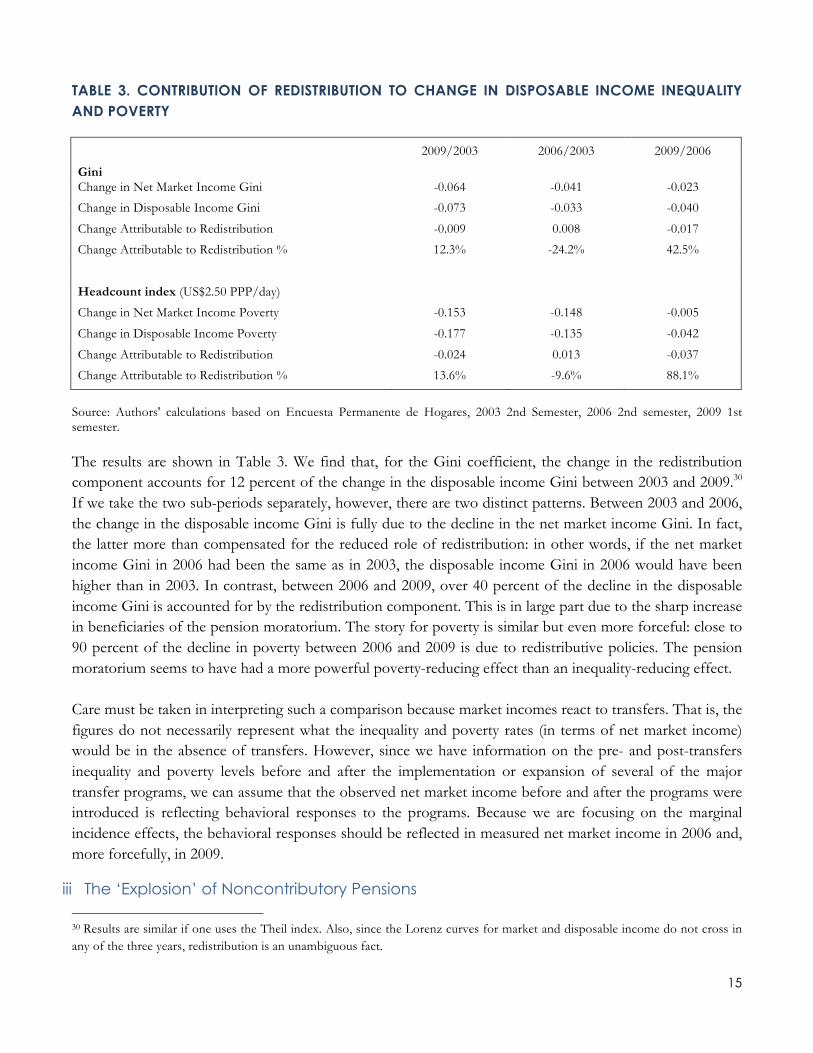
TABLE 3. CONTRIBUTION OF REDISTRIBUTION TO CHANGE IN DISPOSABLE INCOME INEQUALITY AND POVERTY
2009/2003 2006/2003 2009/2006
Gini Change in Net Market Income Gini -0.064 -0.041 -0.023
Change in Disposable Income Gini -0.073 -0.033 -0.040
Change Attributable to Redistribution -0.009 0.008 -0.017
Change Attributable to Redistribution % 12.3% -24.2% 42.5%
Headcount index (US$2.50 PPP/day)
Change in Net Market Income Poverty -0.153 -0.148 -0.005
Change in Disposable Income Poverty -0.177 -0.135 -0.042
Change Attributable to Redistribution -0.024 0.013 -0.037
Change Attributable to Redistribution % 13.6% -9.6% 88.1%
Source: Authors' calculations based on Encuesta Permanente de Hogares, 2003 2nd Semester, 2006 2nd semester, 2009 1st semester. The results are shown in Table 3. We find that, for the Gini coefficient, the change in the redistribution component accounts for 12 percent of the change in the disposable income Gini between 2003 and 2009.30 If we take the two sub-periods separately, however, there are two distinct patterns. Between 2003 and 2006, the change in the disposable income Gini is fully due to the decline in the net market income Gini. In fact, the latter more than compensated for the reduced role of redistribution: in other words, if the net market income Gini in 2006 had been the same as in 2003, the disposable income Gini in 2006 would have been higher than in 2003. In contrast, between 2006 and 2009, over 40 percent of the decline in the disposable income Gini is accounted for by the redistribution component. This is in large part due to the sharp increase in beneficiaries of the pension moratorium. The story for poverty is similar but even more forceful: close to 90 percent of the decline in poverty between 2006 and 2009 is due to redistributive policies. The pension moratorium seems to have had a more powerful poverty-reducing effect than an inequality-reducing effect. Care must be taken in interpreting such a comparison because market incomes react to transfers. That is, the figures do not necessarily represent what the inequality and poverty rates (in terms of net market income) would be in the absence of transfers. However, since we have information on the pre- and post-transfers inequality and poverty levels before and after the implementation or expansion of several of the major transfer programs, we can assume that the observed net market income before and after the programs were introduced is reflecting behavioral responses to the programs. Because we are focusing on the marginal incidence effects, the behavioral responses should be reflected in measured net market income in 2006 and, more forcefully, in 2009.
iii The ‘Explosion’ of Noncontributory Pensions 30 Results are similar if one uses the Theil index. Also, since the Lorenz curves for market and disposable income do not cross in any of the three years, redistribution is an unambiguous fact.
16
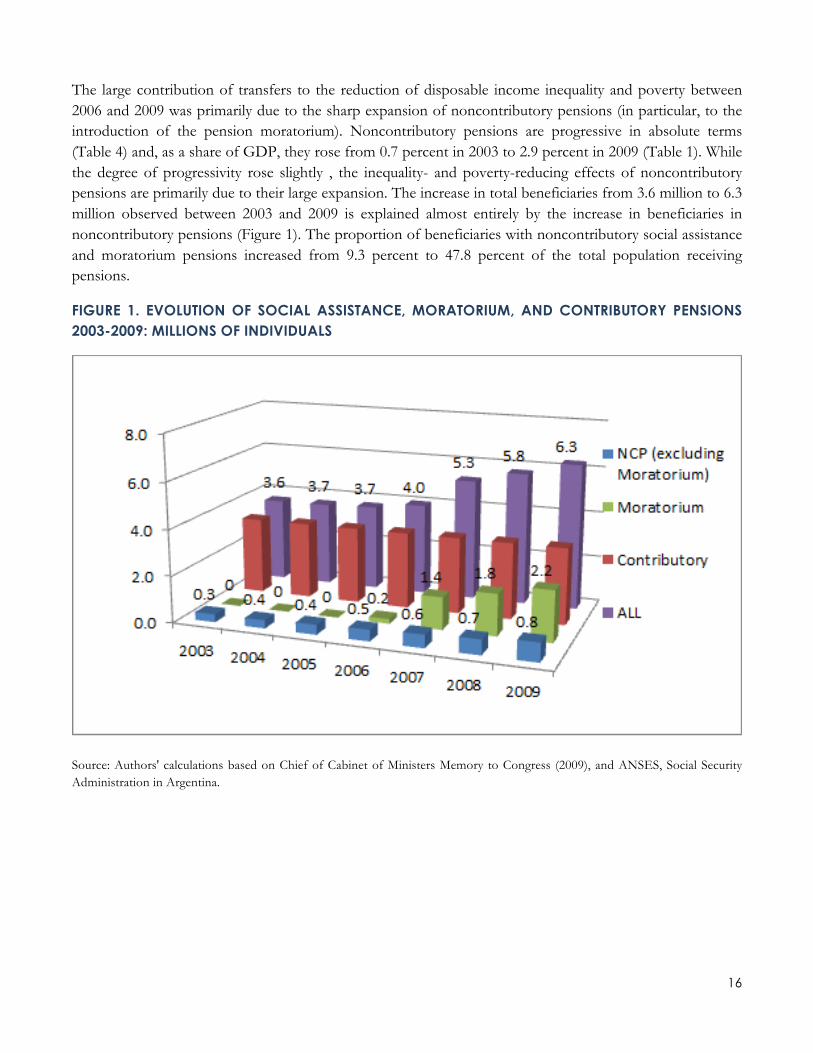
The large contribution of transfers to the reduction of disposable income inequality and poverty between 2006 and 2009 was primarily due to the sharp expansion of noncontributory pensions (in particular, to the introduction of the pension moratorium). Noncontributory pensions are progressive in absolute terms (Table 4) and, as a share of GDP, they rose from 0.7 percent in 2003 to 2.9 percent in 2009 (Table 1). While the degree of progressivity rose slightly , the inequality- and poverty-reducing effects of noncontributory pensions are primarily due to their large expansion. The increase in total beneficiaries from 3.6 million to 6.3 million observed between 2003 and 2009 is explained almost entirely by the increase in beneficiaries in noncontributory pensions (Figure 1). The proportion of beneficiaries with noncontributory social assistance and moratorium pensions increased from 9.3 percent to 47.8 percent of the total population receiving pensions.
FIGURE 1. EVOLUTION OF SOCIAL ASSISTANCE, MORATORIUM, AND CONTRIBUTORY PENSIONS 2003-2009: MILLIONS OF INDIVIDUALS
Source: Authors' calculations based on Chief of Cabinet of Ministers Memory to Congress (2009), and ANSES, Social Security Administration in Argentina.
17
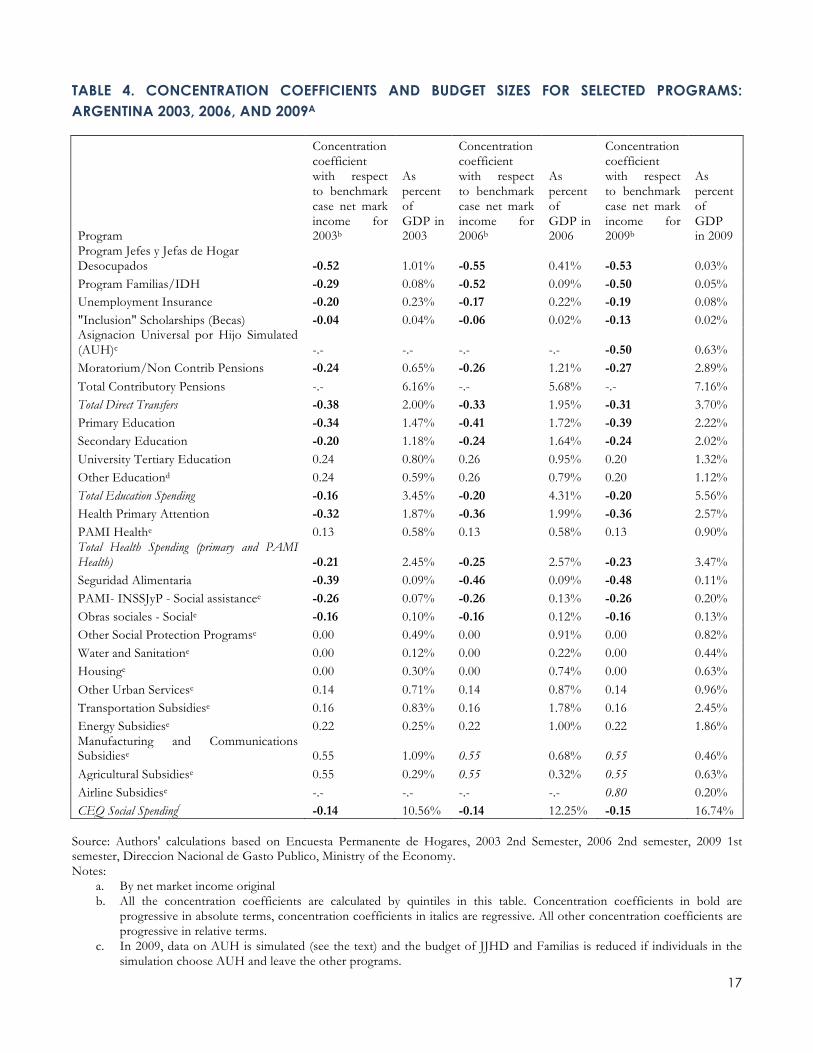
TABLE 4. CONCENTRATION COEFFICIENTS AND BUDGET SIZES FOR SELECTED PROGRAMS: ARGENTINA 2003, 2006, AND 2009A
Program
Concentration coefficient with respect to benchmark case net mark income for 2003b
As percent of GDP in 2003
Concentration coefficient with respect to benchmark case net mark income for 2006b
As percent of GDP in 2006
Concentration coefficient with respect to benchmark case net mark income for 2009b
As percent of GDP in 2009
Program Jefes y Jefas de Hogar Desocupados -0.52 1.01% -0.55 0.41% -0.53 0.03% Program Familias/IDH -0.29 0.08% -0.52 0.09% -0.50 0.05% Unemployment Insurance -0.20 0.23% -0.17 0.22% -0.19 0.08% "Inclusion" Scholarships (Becas) -0.04 0.04% -0.06 0.02% -0.13 0.02% Asignacion Universal por Hijo Simulated (AUH)c -.- -.- -.- -.- -0.50 0.63% Moratorium/Non Contrib Pensions -0.24 0.65% -0.26 1.21% -0.27 2.89% Total Contributory Pensions -.- 6.16% -.- 5.68% -.- 7.16% Total Direct Transfers -0.38 2.00% -0.33 1.95% -0.31 3.70% Primary Education -0.34 1.47% -0.41 1.72% -0.39 2.22% Secondary Education -0.20 1.18% -0.24 1.64% -0.24 2.02% University Tertiary Education 0.24 0.80% 0.26 0.95% 0.20 1.32% Other Educationd 0.24 0.59% 0.26 0.79% 0.20 1.12% Total Education Spending -0.16 3.45% -0.20 4.31% -0.20 5.56% Health Primary Attention -0.32 1.87% -0.36 1.99% -0.36 2.57% PAMI Healthe 0.13 0.58% 0.13 0.58% 0.13 0.90% Total Health Spending (primary and PAMI Health) -0.21 2.45% -0.25 2.57% -0.23 3.47% Seguridad Alimentaria -0.39 0.09% -0.46 0.09% -0.48 0.11% PAMI- INSSJyP - Social assistancee -0.26 0.07% -0.26 0.13% -0.26 0.20% Obras sociales - Sociale -0.16 0.10% -0.16 0.12% -0.16 0.13% Other Social Protection Programse 0.00 0.49% 0.00 0.91% 0.00 0.82% Water and Sanitatione 0.00 0.12% 0.00 0.22% 0.00 0.44% Housinge 0.00 0.30% 0.00 0.74% 0.00 0.63% Other Urban Servicese 0.14 0.71% 0.14 0.87% 0.14 0.96% Transportation Subsidiese 0.16 0.83% 0.16 1.78% 0.16 2.45% Energy Subsidiese 0.22 0.25% 0.22 1.00% 0.22 1.86% Manufacturing and Communications Subsidiese 0.55 1.09% 0.55 0.68% 0.55 0.46% Agricultural Subsidiese 0.55 0.29% 0.55 0.32% 0.55 0.63% Airline Subsidiese -.- -.- -.- -.- 0.80 0.20% CEQ Social Spendingf -0.14 10.56% -0.14 12.25% -0.15 16.74%
Source: Authors' calculations based on Encuesta Permanente de Hogares, 2003 2nd Semester, 2006 2nd semester, 2009 1st semester, Direccion Nacional de Gasto Publico, Ministry of the Economy. Notes:
a. By net market income original b. All the concentration coefficients are calculated by quintiles in this table. Concentration coefficients in bold are
progressive in absolute terms, concentration coefficients in italics are regressive. All other concentration coefficients are progressive in relative terms.
c. In 2009, data on AUH is simulated (see the text) and the budget of JJHD and Familias is reduced if individuals in the simulation choose AUH and leave the other programs.
18
d. Total Education Spending does not include "other Education." e. Indicates that the source of spending was not captured by EPH, and thus it was estimated from other sources. See
Pessino (2012. f. CEQ (Commitment to Equity) Social Spending includes spending on education, health, social assistance and the
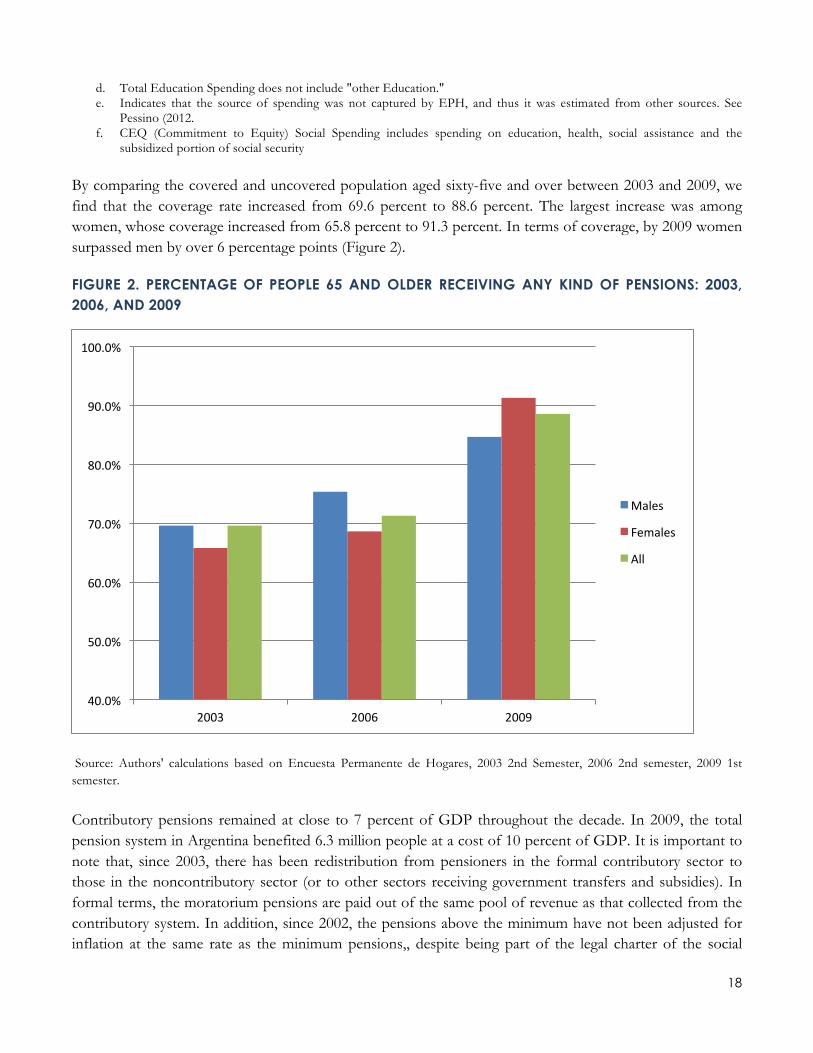
subsidized portion of social security By comparing the covered and uncovered population aged sixty-five and over between 2003 and 2009, we find that the coverage rate increased from 69.6 percent to 88.6 percent. The largest increase was among women, whose coverage increased from 65.8 percent to 91.3 percent. In terms of coverage, by 2009 women surpassed men by over 6 percentage points (Figure 2).
FIGURE 2. PERCENTAGE OF PEOPLE 65 AND OLDER RECEIVING ANY KIND OF PENSIONS: 2003, 2006, AND 2009
Source: Authors' calculations based on Encuesta Permanente de Hogares, 2003 2nd Semester, 2006 2nd semester, 2009 1st semester.
Contributory pensions remained at close to 7 percent of GDP throughout the decade. In 2009, the total pension system in Argentina benefited 6.3 million people at a cost of 10 percent of GDP. It is important to note that, since 2003, there has been redistribution from pensioners in the formal contributory sector to those in the noncontributory sector (or to other sectors receiving government transfers and subsidies). In formal terms, the moratorium pensions are paid out of the same pool of revenue as that collected from the contributory system. In addition, since 2002, the pensions above the minimum have not been adjusted for inflation at the same rate as the minimum pensions,, despite being part of the legal charter of the social
40.0%
50.0%
60.0%
70.0%
80.0%
90.0%
100.0%
2003 2006 2009
Males
Females
All
19
security laws. This has led to a significant erosion of their purchasing power and has resulted in a myriad of lawsuits against the government:31 between December 2002 and December 2009, minimum pensions in real terms increased by 70 percent while average ones rose by only 19 percent, leading to an increase in the ratio of the minimum to average pension from 54 percent to 78 percent during the same period. Although people who receive a pension higher than the minimum are not poor, they are usually not rich either. Many are what we tend to call the lower-middle class. In addition, this trend will create disincentives to contribute to the formal system whenever this can be avoided or eluded.32 Another form of redistribution has occurred in terms of the individuals who had deposited their contributions in the individual accounts that were confiscated in 2008, since when they retire their pension will be determined by the rules that apply to the pay-as-you-go system, regardless of how large the size of their account was at the time of confiscation.
iv The AUH and Other CCTs
All cash transfers programs analyzed here are progressive in absolute terms (table 4). In spite of launching AUH at the end of 2009, the overall share of cash transfers, as a proportion of GDP, was lower in 2009 than in 2003 (table 1). This happened because with the economic recovery and subsequent boom, the emergency employment program was scaled back significantly. However, since GDP was higher in 2009, the cash transfer budget in per capita terms was also higher. This, together with the fact that – as shown in table 4 – the progressivity of the individual programs tended to rise (or be high to begin with such as the case of AUH), means that the contribution of direct cash transfers to inequality and poverty reduction rose.
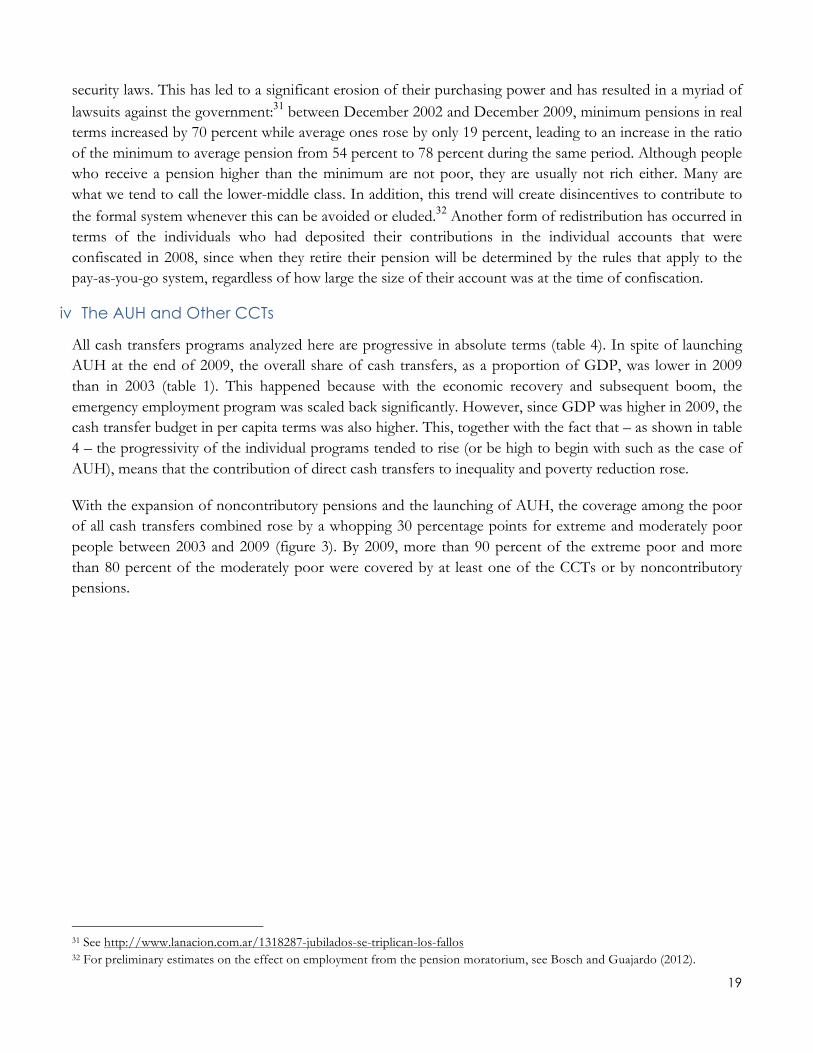
With the expansion of noncontributory pensions and the launching of AUH, the coverage among the poor of all cash transfers combined rose by a whopping 30 percentage points for extreme and moderately poor people between 2003 and 2009 (figure 3). By 2009, more than 90 percent of the extreme poor and more than 80 percent of the moderately poor were covered by at least one of the CCTs or by noncontributory pensions.
31 See http://www.lanacion.com.ar/1318287-jubilados-se-triplican-los-fallos 32 For preliminary estimates on the effect on employment from the pension moratorium, see Bosch and Guajardo (2012).

20
FIGURE 3. PERCENT OF POOR WHO ARE BENEFICIARIES
Source: Authors' calculations based on Encuesta Permanente de Hogares, 2003 2nd Semester, 2006 2nd semester, 2009 1st semester.
v Education and Health
Public spending on education and primary healthcare are progressive in absolute terms.. Spending as a share of GDP (Table 1) and progressivity (Table 4) increased for both over the period under analysis. If education is disaggregated by level, all but tertiary (and above) are progressive in absolute terms; tertiary is progressive in relative terms. The degree of progressivity increased for all levels of schooling between 2003 and 2009, reflecting an increase in coverage among the poor. These auspicious results, however, have their downside. As in other Latin American countries, families who are better-off in Argentina have abandoned the public school system because of its poor quality. Argentina is one of the worst performers in international assessments of quality of education, such as PISA and SERCE, and shows one of the largest gaps in quality between private and public education.
vi Non-social Spending: Indirect Subsidies
Government spending on indirect subsidies such as to agriculture, airlines, manufacturing, energy and public transportation, equaled 5.6 percent of GDP in 2009, over 50 percent more than what is spent on cash transfers (CCTs and noncontributory pensions). Between 2003 and 2009, the proportion spent on indirect subsidies more than doubled (see Table 1). Table 4 shows the concentration coefficients for several categories of indirect subsidies. (The concentration coefficients are estimated from other sources as we did not do an incidence analysis of indirect subsidies ourselves.) Transportation and energy subsidies are progressive only in relative terms. Agricultural, manufacturing and especially airline subsidies are outright
63.06%&
72.89%&
91.86%&
55.45%&
65.81%&
86.56%&
0.00%&
10.00%&
20.00%&
30.00%&
40.00%&
50.00%&
60.00%&
70.00%&
80.00%&
90.00%&
100.00%&
2003& 2006& 2009&
Poor&<2.5&
Poor&<4&
21
regressive. The budget for these three subsidies in 2009 was equal to 1.3 percent of GDP. To put this figure in perspective, the budget for CCTs was equal to 0.8 percent of GDP. Scrapping these regressive subsidies would contribute to the government’s ability to address the problems of fiscal sustainability, to which we now turn.
5. FISCAL SUSTAINABILITY
While a full-blown fiscal sustainability analysis is beyond the scope of this paper, given the extraordinary expansion of primary spending in Argentina in such a short period of time, the question of how this expansion was financed is of great relevance. If one includes only government revenues that are conventionally listed as “above-the-line” items (as per the 2001 IMF Government Financial Statistics Manual33), the fiscal surpluses (excluding debt servicing) were equal to 3.1 percent and 3.3 percent of GDP in 2003 and 2006, respectively. By 2009, this surplus turned into a deficit equal to 1.5 percent of GDP as shown in the lower panel of Table 1. Because official government revenue statistics include items that should not be treated as above-the-line sources of fiscal revenues , the official reported surpluses are larger: 3.3 percent in 2003, 3.8 percent in 2006 and 0.4 percent in 2009. Including debt servicing, the Public Sector Borrowing Requirements (PSBR), 34 excluding unorthodox, below-the-line sources of revenue, was equal to -0.7 percent in 2003, -1.1 percent in 2006 and 4.1 percent in 2009 (recall that if preceded by a negative sign it means a surplus). Including the unorthodox sources of revenue, PSBR for 2009 was equal to 2.2 percent. 35
Since Argentina defaulted on its debt payments to international creditors during the crisis of 2001-2002, it does not have access to external sources of funding, obliging the government to finance spending through “normal” taxes, borrowing from public enterprises and unorthodox alternatives (which in Argentine parlance are called “creative financing”) such as the inflation tax. “Normal” tax revenues rose from 23.4 percent of GDP in 2003 to 31.4 percent of GDP in 2009. There were three main sources. First, a tax on financial transactions implemented during the crisis of 2001-2002 has become permanent and went from zero in 2000 to 1.8 percent of GDP in 2009.36 Second, an increase on the tax rate on primary exports together with the rise in commodity prices led to an increase in revenues from .01 percent of GDP in 2000, to 2.5 percent in 2003 to 2.8 percent in 2009. Third, employee contributions to the nationalized social security system increased from 4.5 percent of GDP in 2007 to 6.7 percent in 2009, an increase of 2.2 percentage points of GDP. Overall, during the period from 2000 to 2009, taxes increased by 9.9 percentage points of GDP, and 80 percent of this increase is accounted for by three forms of taxation: the financial
33 See http://www.imf.org/external/pubs/ft/gfs/manual/. 34 Authors’ calculations based on data from Oficina Nacional de Presupuesto y Susbsecretaria de Ingresos Publicos de la Secretaria de Hacienda y la Secretaria de Politica Economica, Ministerio de Economia y Obras y Servicios Publicos and Castineira (2010).. 35 It is important to note that the rise in the fiscal deficit is not just a consequence of counter-cyclical fiscal policies during the Great Recession in 2009. As the deficit continued to increase after 2009, the Argentine government had to resort to additional sources of “creative financing,” For example, decreeing the creation of a US$6.6 million fund with the so-called excess reserves of the Central Bank. When this measure was blocked by the courts, the government ‘created’ another fund – the so-called “un-indebting fund” – by which the Central Bank was obligated to transfer US$4.2 million to the Argentine Treasury. This fund was utilized to finance the deficit in 2010 and 2011 (see Argañaraz and Brugiafreddo,(2012). 36 See Fenochietto, Pessino and Crivelli (2012) for the impact of the Bank Transactions Tax on Deposits in Argentina.
22
transactions tax (18 percent), export taxes (28 percent) and Social Security taxes (34 percent).37 All of these can have distortionary effects in that they may discourage investment decisions that would otherwise promote growth. In addition, the export tax is highly sensitive to commodity prices.
By 2009 tax revenues were not sufficient to cover the greatly increased levels of public spending, so the government had to resort to more unorthodox sources. These include: (1) the interest earned on the fund created with the assets that used to be in the individualized social security accounts (34 percent), (2) the profits accrued to the Central Bank (22 percent) –what many authors refer to as the tax, and (3) special drawing rights from the IMF (44 percent), which strictly speaking should be treated as a zero interest loan and not revenue. However, after 2009 (3) was no longer available, and this led the federal government to tap international reserves and profits from the Central Bank. One should also note that the inflation tax is much higher than the official inflation statistics would lead one to believe; the latter have averaged about a third of those produced by independent, nonpartisan research institutions (which face fines and lawsuits for publishing inflation data different from the official data).38 Because of its lack of transparency with inflation and other statistics, on February 1st 2013, “Argentina became the first country to be censured by the International Monetary Fund for not providing accurate data on inflation and economic growth under a procedure that can end in expulsion.”39
6. CONCLUSIONS
During the period from 2003 to 2009, the federal government of Argentina increased primary spending by 13.5 percentage points. Social spending expanded considerably more than nonsocial spending and the rise of primary spending was concentrated in the 2006 to 2009 period (Table 1). The redistribution and effectiveness indicators look impressive: Argentina is able to lower inequality and poverty proportionately more than other countries included in this special issue and does so with greater effectiveness (in terms of how much redistribution is obtained per peso spent as a proportion of GDP) (Table 2). Redistributive policies were particularly prominent in the period from 2006 to 2009 (Table 3). This is mainly due to the introduction of the large (quasi) noncontributory pension program – the pension moratorium – which increased the number of old-age pensioners from 4 million to 6.3 million between 2006 and 2009 (with the largest increase taking place among women).
This “golden” picture of Argentine redistribution policies becomes significantly tarnished when one takes note of two things. The redistribution linked to the pension moratorium has been partially funded by retirees receiving above the minimum pension who are themselves part of the lower- and middle-middle
37 Authors’ calculations based on data from Oficina Nacional de Presupuesto y Susbsecretaria de Ingresos Publicos de la Secretaria de Hacienda y la Secretaria de Politica Economica, Ministerio de Economia y Obras y Servicios Publicos and Castineira (2010). 38 On the extreme regressivity of the inflation tax during the 1980s see Canavese, Sosa Escudero, and Alvaredo (1999). This tax did not exist during the 1990s, a point which is sometimes neglected in distributional analysis of that decade. 39 http://www.bloomberg.com/news/2013-02-01/argentina-becomes-first-nation-censured-by-imf-on-inflation-data.html
23
class. The inequality and poverty indicators do not capture these losses because the losses inflicted on the losers are more than compensated for by the rising incomes of the poor. More worrisome, the sharp rise in public spending during the 2000s has been increasingly financed by distortionary taxes, such as those on financial transactions, and unorthodox revenue-raising mechanisms. All in all, this points to the fact that the Argentine government has embarked on a redistribution process that – to some extent – generates unfair losses (to the formal sector retirees) and may not be fiscally sustainable unless expenditure on subsidies in the nonsocial sectors is significantly reduced.
24
REFERENCES
Agis, Emmanuel, Carlos Cañete, and Demian Panigo. 2010. El impacto de la asignación universal por hijo en Argentina. CEIL-PIETTE Working Paper, Buenos Aires: Argentina. ANSES. 2010. Boletín Estadístico de la Seguridad Social: Segundo Semestre 2010. Buenos Aires, Argentina: Dirección Nacional de Programación Económica y Normativa, Ministerio de Trabajo, Empleo y Seguridad Social.
ANSES. 2012. Nueva Metodología 2012. Boletín Estadístico de la Seguridad Social: Cuarto Trimestre 2011 – Primer Trimestre 2012. Buenos Aires, Argentina: Dirección Nacional de Programación Económica, Ministerio de Trabajo, Empleo y Seguridad Social.
ANSES. 2012. ANSES acerca la Seguridad Social a las comunidades indígenas. http://www.anses.gob.ar/blogdeldirector/archives/2474
Argañaraz, Nadin, and María Pía Brugiafreddo. 2012. Balance fiscal definitivo 2011. Escenarios fiscales alternativos para el 2012. Instituto Argentino de Análisis Fiscal (IARAF) Economic Report 147, Córdoba, Argentina.
Bevacqua, Graciela and Nicolás Salvatore. 2009. IPC City. Gacetilla de Prensa. Marzo.
Bosch, Mariano, and Jarret Guajardo. 2012. Labor Market Impacts of Non-Contributory Pensions: The Case of Argentina’s Moratorium. IADB and Save the Children, Washington, D.C.
Canavese, Alfredo, Walter Sosa Escudero, and Facundo Alvaredo. 1999. El Impacto de la inflación sobre la distribución del ingreso: el impuesto inflacionario en la Argentina en la década del ochenta. In La Distribución del Ingreso en la Argentina, 265-289. Buenos Aires, Argentina: FIEL.
Castiñeira, Ramiro. 2010. La Situación Fiscal y el Pago de la Deuda con o sin Fondo del Desendeudamiento. Argentina Macroeconomic Outlook, Econometrica S.A., Buenos Aires: Argentina.Demombynes, Gabriel, and Dorte Verter. 2007. Los pobres invisibles. Un panorama de la pobreza rural en Argentina. World Bank report, Buenos Aires, Argentina.DGSC (Dirección de Gastos Sociales Consolidados). 1994. El Gasto Público Social y su Impacto Redistributivo. Buenos Aires, Argentina: Ministerio de Economía y Obras y Servicios Públicos.
DGSC (Dirección de Gastos Sociales Consolidados). 1999. El impacto redistributivo del Gasto Público en los Sectores Sociales. Resultados Provisorios. Ministerio de Economía y Obras y Servicios Públicos Working Paper, Buenos Aires, Argentina.
DGSC (Dirección de Gastos Sociales Consolidados). 2002. El Impacto Distributivo de la Política Social en la Argentina. Análisis basado en la Encuesta Nacional de Gastos de los Hogares. Ministerio de Economía y Obras y Servicios Públicos Working Paper, Buenos Aires, Argentina.
Fenochietto, Ricardo, Carola Pessino, and Ernesto Crivelli. 2012. Impact of the Bank Transactions on Deposits in Argentina. In Taxation of the Financial Sector, forthcoming, Cambridge, MA: MIT Press.
25
Fiszbein, Ariel, Paula Giovagnoli, and Isidro Adúriz. 2003. El impacto de la crisis argentina en el bienestar de los hogares. CEPAL Revista, Santiago, Chile.
Gasparini, Leonardo, 1999. Incidencia distributiva del gasto público social y de la política tributaria en la Argentina. In La Distribución del Ingreso en la Argentina, 347-370. Buenos Aires, Argentina: FIEL.
Galasso, Emanuela, and Martin Ravallion. 2004. Social Protection in a Crisis: Argentina’s Plan Jefes y Jefas. The World Bank Economic Review 18 (3): 367-399.
Gasparini, Leonardo, and Guillermo Cruces. 2010. Las asignaciones universales por hijo en Argentina: Impacto, discusión, y alternativas. Económica 56 (1): 105-146.
Lustig, Nora, Maynor Cabrera, George Gray-Molina, Sean Higgins, Miguel Jaramillo, Wilson Jiménez, Hilcías Morán, Veronica Paz, Claudiney Pereira, John Scott, and Ernesto Yañez. 2012. Fiscal Policy, Urban-Rural Inequality and Rural Poverty in Bolivia, Brazil, Guatemala, Mexico, and Peru. International Fund for Agricultural Development (IFAD) background paper.
Lustig, Nora, Carola Pessino, and John Scott. 2012. Introduction. Tulane University Mimeo, New Orleans, LA.
Lustig, Nora and Carola Pessino. 2012. Social Spending and Income Redistribution in Argentina During the 2000s: the Rising Role of Noncontributory Pensions. Extended Version. Tulane Economics Working Paper Series. Working Paper No. 1221. November.
Lustig, Nora, Carola Pessino and John Scott. 2013. The Impact of Taxes and Social Spending on Inequality and Poverty in Argentina, Bolivia, Brazil, Mexico, Peru and Uruguay: An Overview. CEQ Working Paper No. 13, April 2013
Pessino, Carola. 2010. Commitment to Equity: An Assessment of Fiscal Policies in Argentina. Unpublished IAD Report, Washington, D.C. and CIPR Report, New Orleans, LA.
Petrei, Humberto. 1987. El gasto público social y sus efectos distributivos. Un examen comparativo 3
Rosas, Maria Ester. 2007. Trabajo infantil y Programas de Transferencias en Efectivo Condicionadas en Argentina, Ministerio de Trabajo y Seguridad Social Argentina.
SEDLAC (CEDLAS and The World Bank). 2012. http://sedlac.econo.unlp.edu.ar/eng/statistics.php, accessed October 7, 2012.
CEQ WORKING PAPER SERIES
WORKING PAPER NO. 1 Lustig, Nora and Sean Higgins. 2013. Commitment to Equity Assessment (CEQ): Estimating the Incidence of Social
Spending, Subsidies and Taxes. Handbook. CEQ Working Paper No. 1, Center for Inter-American Policy and Research and Department of Economics, Tulane University and Inter-American Dialogue, January.
WORKING PAPER NO. 2 Lustig, Nora. 2012. Commitment to Equity: Diagnostic Questionnaire. CEQ Working Paper No. 2, Center for
Inter-American Policy and Research and Department of Economics, Tulane University and Inter-American Dialogue, August.
WORKING PAPER NO. 3 Lustig, Nora and George Gray Molina, Sean Higgins, Miguel Jaramillo, Wilson Jiménez, Veronica Paz,
Claudiney Pereira, Carola Pessino, John Scott, and Ernesto Yañez. 2012. The Impact of Taxes and Social Spending on Inequality and Poverty in Argentina, Bolivia,Brazil, Mexico and Peru: A Synthesis of Results. CEQ Working Paper No. 3, Center for Inter-American Policy and Research and Department of Economics, Tulane University and Inter-American Dialogue, August.
WORKING PAPER NO. 4 Lustig, Nora and Sean Higgins. 2012. Fiscal Incidence, Fiscal Mobility and the Poor: A New Approach. CEQ
Working Paper No. 4, Center for Inter-American Policy and Research and Department of Economics, Tulane University and Inter-American Dialogue, September.
WORKING PAPER NO. 5 Lustig, Nora and Carola Pessino. 2013. Social Spending and Income Redistribution in Argentina in the 2000s: the
Rising Role of Noncontributory Pensions. CEQ Working Paper No. 5, Center for Inter-American Policy and Research and Department of Economics, Tulane University and Inter-American Dialogue, REVISED July 2013.
WORKING PAPER NO. 6 Paz Arauco, Verónica, George Gray Molina, Wilson Jiménez Pozo, and Ernesto Yáñez Aguilar. 2013.
Explaining Low Redistributive Impact in Bolivia. CEQ Working Paper No. 6, Center for Inter-American Policy and Research and Department of Economics, Tulane University and Inter-American Dialogue, January.
WORKING PAPER NO. 7 Higgins, Sean and Claudiney Pereira. 2013. The Effects of Brazil’s High Taxation and Social Spending on the
Distribution of Household Income. CEQ Working Paper No. 7, Center for Inter-American Policy and Research and Department of Economics, Tulane University and Inter-American Dialogue, January.
WORKING PAPER NO. 8 Scott, John. 2013. Redistributive Impact and Efficiency of Mexico’s Fiscal System. CEQ Working Paper No. 8,
Center for Inter-American Policy and Research and Department of Economics, Tulane University and Inter-American Dialogue, January.
WORKING PAPER NO. 9 Jaramillo Baanante, Miguel. 2013. The Incidence of Social Spending and Taxes in Peru. CEQ Working Paper No. 9,
Center for Inter-American Policy and Research and Department of Economics, Tulane University and Inter-American Dialogue, January.
WORKING PAPER NO. 10 Bucheli, Marisa and Nora Lustig, Máximo Rossi and Florencia Amábile. 2013. Social Spending, Taxes, and
Income Redistribution in Uruguay. CEQ Working Paper No. 10, Center for Inter-American Policy and Research and Department of Economics, Tulane University and Inter-American Dialogue, January.
WORKING PAPER NO. 11 Higgins, Sean and Nora Lustig, Julio Ramirez and Billy Swanson. Social Spending, Taxes and Income
Redistribution in Paraguay. CEQ Working Paper No. 11, Center for Inter-American Policy and Research and Department of Economics, Tulane University and Inter-American Dialogue, February.
WORKING PAPER NO. 12 Alvaredo, Facundo and Juliana Londoño Vélez. 2013. High Incomes and Personal Taxation in a Developing
Economy: Colombia 1993-2010. CEQ Working Paper No. 12, Center for Inter-American Policy and Research and Department of Economics, Tulane University and Inter-American Dialogue, March.
WORKING PAPER NO. 13 Lustig, Nora, and Carola Pessino and John Scott. 2013. The Impact of Taxes and Social Spending on Inequality and
Poverty in Argentina, Bolivia, Brazil, Mexico, Peru and Uruguay: An Overview. CEQ Working Paper No. 13, Center for Inter-American Policy and Research and Department of Economics, Tulane University and Inter-American Dialogue, April.
WORKING PAPER NO. 14 Higgins, Sean and Nora Lustig. 2013. Measuring Impoverishment: An Overlooked Dimension of Fiscal Incidence. CEQ
Working Paper No. 14, Center for Inter-American Policy and Research and Department of Economics, Tulane University and Inter-American Dialogue, April.
WORKING PAPER NO. 15 Tanzi, Vito. 2013. Tax Reform in Latin America: A long term assessment. CEQ Working Paper No. 15, Center for
Inter-American Policy and Research and Department of Economics, Tulane University and Inter-American Dialogue, April.
http://www.commitmentoequity.org