Social Inequalities in Europe: Facing the challenge
119
Berlin Social Science Center (WZB) Research Area President’s Project Group Jutta Allmendinger Ellen von den Driesch Social Inequalities in Europe: Facing the challenge Discussion Paper P 2014-005 November 2014
Transcript of Social Inequalities in Europe: Facing the challenge

Berlin Social Science Center (WZB)
Research Area
President’s Project Group
Jutta Allmendinger Ellen von den Driesch
Social Inequalities in Europe: Facing the challenge
Discussion Paper
P 2014-005
November 2014

WZB Berlin Social Science Center Reichpietschufer 50 10785 Berlin Germany www.wzb.eu
Allmendinger, J., Driesch, E. von den 2014 Social Inequalities in Europe: Facing the challenge Berlin: WZB. Discussion Paper P 2014–005.
Discussion papers of the WZB serve to disseminate the research results of work in progress prior to publication to encourage the exchange of ideas and aca-demic debate. Inclusion of a paper in the discussion paper series does not constitute publication and should not limit publication in any other venue. The discussion papers published by the WZB represent the views of the respective authors and not of the institute as a whole. This research was supported by the European Commission and will serve as the basis for a Review to be published by the Commission soon. We owe partic-ular thanks to Philippe Keraudren and Marie Ramot for their helpful com-ments as well as to our research assistants Julia Böhnke, Lisa Ohmes, Sabrina Reiter, Daniel Staemmler, and to our excellent copyeditor Carsten Bösel.
Copyright remains with the authors.
Affiliation of the authors
Jutta Allmendinger WZB Berlin Social Science Center E-Mail: [email protected]
Ellen von den Driesch WZB Berlin Social Science Center E-Mail: [email protected]
Abstract
Social Inequalities in Europe: Facing the challenge
by Jutta Allmendinger and Ellen von den Driesch
This discussion paper describes the extent of social inequalities both within and between
the countries of the European Union. In the first three chapters we address the micro level
of individual life courses: education, employment and income. The following chapters
analyse the societal consequences of inequalities. Chapter 4 looks at the unequal distribu-
tion of financial resources, while chapter 5 addresses the social and political outcomes of
financial inequalities.
In sum, there is mounting scientific evidence that various forms of educational, employ-
ment and financial inequalities increase over time. Moreover, societal exclusion is likely to
lead to forms of political exclusion that is, a depoliticisation of socially excluded groups or
to various forms of political extremism. This is an alarming sign for the future of European
democracies and is in glaring contradiction to the democratic political values of equality
enshrined in the Treaties.
Keywords: Europe, Social inequalities, Income, Education, Employment, Returns to Education
JEL Klassifikation: D31, I24, I26, I30, J21, J31

Outline
Introduction: Social Inequality Matters......................................................................... 1
1. Education and Inequalities: The Need to Reduce Educational Poverty ......... 5
1.1 How do we measure education? And what does educational attainment tell us? ...................................................................................................... 7
1.2 Who gets a chance? Educational attainment in Europe ......................... 7
1.3 Conclusion ............................................................................................................ 17
2. Employment and Inequalities .................................................................................... 19
2.1 From education to employment: or how to fight youth unemployment effectively? .................................................................................. 20
2.2 Employment rates: one objective, many national realities .............. 24
2.3 In search of quality of employment ........................................................... 29
2.4 Conclusion ............................................................................................................ 38
3. Income, Education and Employment ....................................................................... 40
3.1 Education still provides income provided there is education ......... 40
3.2 Income and gender: the need to change family life and income distribution ................................................................................................................. 46
3.3 Conclusion ............................................................................................................ 51
4. Financial Inequalities ................................................................................................... 52
4.1 The large variety of gross and net incomes in EU countries ............ 53
4.2 The challenge of rising income inequality .............................................. 56
4.3 The alarming concentration of wealth in Europe ................................. 63
4.4 On the dark side: poverty in the EU ........................................................... 68
4.5 Material deprivation in Europe .................................................................... 72
4.6 The low-wage sector ......................................................................................... 74
4.7 The working poor .............................................................................................. 79
4.8 Conclusion ............................................................................................................ 85
5. Social and Political Outcomes of Financial Inequalities .................................. 87
5.1 Financial inequality and health ................................................................... 88
5.2 Financial inequality and political outcomes: democracy in threat? ......................................................................................................................................... 92
5.3 Conclusion ............................................................................................................ 96
Conclusion: The Need for the EU to Adopt Policies to Fight Inequalities ....... 97
References............................................................................................................................ 101
1
Introduction: Social Inequality Matters
Europe faces many challenges. On the global stage, the European Union (EU)
has to speak with one voice to counter a plethora of political, military and eco-
nomic crises. Internally, it needs to foster cohesion in spite of the many events
that threaten the European project at its core. In this context, do social issues
matter at all?
If we look at the evolution of the EU over the past decades, substantial pro-
gress has been made in terms of building an internal market and an economic
and monetary union, albeit not without problems, as the 2008 crisis has shown.
But a European social union, even at a small scale, is still out of sight. On the
contrary, the race to economic growth and the liberalisation of labour markets
seem to imperil a common social Europe. It looks actually as if the EU and its
member States were mostly thinking in economic terms, hoping that economic
solutions will fix all social problems at once. Of course the EU has adopted a
number of relevant and ambitious social policies under the Europe 2020 agenda
and more recently, through initiatives like the European Employment Strategy
(European Commission, 2012) and notably the Social Investment Package (Euro-
pean Commission, 2013) which contains a wealth of information and useful poli-
cy recommendations on the social dimension of Europe. However, social policies
in the EU remain by far a national competence and the EU institutions them-
selves can only "encourage" member states to adapt their social policies (see
Titles IX and X of the Treaty on the EU). The overall impact of such efforts is thus
likely to remain limited unless these policies are really adopted and implement-
ed at State level. In a recent survey Frazer et al. (2014: 5) actually observe: "there
is a growing consensus that the social dimension of the Europe 2020 Strategy has
been disappointing".
To negate the importance of social issues is to undermine the foundations of
the EU. The crises that have been shaking Europe have shown that an economic
union is impossible without a social union and that a social investment state is
impossible without a protective welfare state (Vandenbroucke, 2014; Schraad-
Tischler and Kroll, 2014). In the GUSTO European research project, C. Crouch
states that the EU integration requires both, a marketisation and a European
social citizenship process. Marketisation itself leads to insecurity and weakens
EU stability. Hence, the extension of markets increases the need for non-market
institutions (Crouch, 2013; Sandel, 2012).

2
Many politicians and economists believe, and would like us to believe, that
economic growth replaces or diminishes the need for social policies. But, as this
Review will demonstrate, growth in Europe over the last decades has been ac-
companied by an increase in inequalities in many European countries as very
well illustrated for instance by the European research project GINI (Salverda et
al., 2014). Inequalities threaten social cohesion and they also threaten growth. As
Stiglitz (2013) has noted, an unequal distribution of income reduces aggregate
demand and limits economic growth. Poor people have too little money to con-
sume and rich people have too much money to make up for poor people’s low
consumption rates. What is more, there is scientific evidence that in countries
with a high degree of social inequality, many people do not have access to key
resources such as education and employment, even though these people could be
highly productive. By denying these resources to them, valuable human capital,
and hence growth, is destroyed. Furthermore, countries with a high degree of
social inequality need much higher growth rates than countries with low levels
of inequality to be able to reduce poverty in the first place. Or put conversely,
the lower the degree of material inequality in a country, the better is the chance
that economic growth will benefit everyone. ‘High inequality is bad for poverty,
high inequality is bad for poverty reduction, and high inequality is not good for
growth.’ (Hvistendahl, 2014: 835). In this context, the implementation of the call
by President-elect Jean-Claude Juncker for a "fairer" EU deserves attention in
the months to come.
The second important issue is political. After all, the EU Member States and
the EU itself are built on democratic principles, which mean that our European
democracies are looking for and after equality. No serious politician in Europe
has ever said: ‘Democracies should encourage social and economic inequalities!’
This is why rising inequalities in Europe are not only social and economic prob-
lems; they are also potential tests for our democratic systems.
If such concerns are correct, it is essential not only to build institutional
structures for a European social union but also to map social inequalities in Eu-
rope, much in the way researchers in the GINI research project funded by the
European Commission have recently done. Getting a clear picture of the extent
of social inequalities both within and between the countries of the EU is a neces-
sary first step. The second step is to think about policies for addressing these
inequalities. This is exactly what the present Review seeks to accomplish by
drawing on the high quality research work carried out by projects funded by the

3
European Commission and also, very recently, by other researchers from vari-
ous disciplines like sociology (Dubet, 2014), philosophy (Sandel, 2012) and eco-
nomics (Piketty, 2014).
This Review addresses social inequalities both between and within EU Mem-
ber States. Departing from a life course perspective, it first covers three major
pillars: educational attainment (Chapter 1), the extent and quality of employ-
ment (Chapter 2) and the financial returns to education and employment (Chap-
ter 3). In all three chapters, differences by gender and age are systematically
pointed out.1
Chapter 1 addresses inequalities in educational attainment. Education is un-
derstood comprehensively, being measured in both degrees and cognitive com-
petencies. In addition to describing the level of educational attainment and com-
paring educational outcomes within and between the countries of the EU,
Chapter 1 also shows the extent to which the various education measures are
linked to each other. The findings are clear: most EU Member States continue to
have too many people with too little or no education.
Chapter 2 deals with inequalities in employment. First, it covers the transi-
tion from school to work, highlighting the key role that school and vocational
training systems play in this process. It then turns to employment rates and the
conditions under which people are employed in order to further relevant com-
parative analyses. How many hours do people work? Are they employed on
fixed-term contracts or do they have permanent contracts? What are the oppor-
tunities for people with low levels of education and what differences emerge
with respect to gender and age? The evidence is clear: persons with little or no
education are increasingly deprived of opportunities to find work; likewise, the
inclusion of women in the workforce is not as advanced as it should be in many
countries.
Chapter 3 discusses inequalities in financial returns to education and em-
ployment. In a context of educational expansion, the value of education is in-
creasing in most countries and income differentials by educational attainment
are rising as well. And yet, rational explanations of educational investments are
difficult to uphold given the large variety of national situations in the EU; for
1 Unfortunately, a third group will not be given special attention: people with a migration back-ground. Across Europe, we are speaking about very different groups that cannot be easily com-pared or combined due to major differences between these groups. In Germany, for example, the majority of immigrants come from Turkey; in France, from Algeria; in Poland, from Ukraine; in the UK, from Ireland; and in Finland, from Estonia. This makes comparative analyses especially difficult.

4
instance, returns to education are extremely low in most Scandinavian coun-
tries. The financial situation of women remains alarming. Due to their many
other commitments in society, women cannot fully translate their education
into employment. But even if they are employed, their lifetime earnings remain
considerably below those of men.
While the first three Chapters address the micro level of individual life
courses, Chapters 4 and 5 analyse the societal consequences of inequalities.
Chapter 4 thus looks at the standard of living, measured by income and wealth,
and at the unequal distribution of financial resources. It focusses on social im-
balances and hence on those groups of the population most in need of a social
Europe: i.e. individuals who are poor, who work for low wages and who belong to
the category of the working poor.
Chapter 5 addresses the social and political outcomes of financial inequali-
ties. Whereas researchers have provided strong empirical evidence of causal
links between individual poverty and low life expectancy and low political par-
ticipation, the impact of societal inequality on individual life expectancy and
individual voting behaviour has not yet been clarified in a satisfactory manner.
Nevertheless, there is mounting scientific evidence that various forms of educa-
tional, employment and financial exclusion are likely to lead to forms of politi-
cal exclusion that is, a depoliticisation of socially excluded groups or to various
forms of political extremism. This is an alarming sign for the future of European
democracies and is in glaring contradiction to the democratic political values of
equality enshrined in the Treaties.
5
1. Education and Inequalities: The Need to Reduce Educa-
tional Poverty
Education is considered to be crucial for personal growth, employment op-
portunities, good work, good health and a long life, as well as for happiness and
satisfaction. Opening access to education and improving the quality of educa-
tion, therefore, have always been among the most important goals and responsi-
bilities of modern governments. At the European level, the fight against educa-
tional inequalities and educational poverty has taken the shape of various
recommendations to member States to reform their educational systems, nota-
bly by strengthening the acquisition of skills and competences, better integrat-
ing migrant children, improving access to pre-school education and supporting
teachers in their recruitment and careers. Under the Europe 2020 initiative, the
European Commission has also issued several policy recommendations on tack-
ling early school leaving (European Commission, 2011). However, despite much
analysis and many recommendations, educational inequalities on the ground
remain pervasive as the WORKABLE European research project shows.
In fact, as very well demonstrated in several key publications by the
EQUALSOC European research project, education is as much about individual
empowerment as it is about societal and economic needs. Individual empower-
ment means enabling people to become active members of their communities
and society. To this end, cognitive, social and emotional contents are being
passed on in families, personal networks, kindergartens, schools, universities
and companies providing vocational training. Understood in that broad sense,
education enables people to participate in social and political affairs.
Education also responds to new societal and economic needs. In particular,
all European countries have seen their labour markets shift towards high-
skilled jobs while being challenged by massive global competition. At the same
time, European economies are struggling with the transition from growing to
shrinking populations, a rising average age and rising life expectancy as well as
immigration and the concomitant challenges of diversity. Having a well-
educated population helps societies keep pace with these rapid and massive
changes which require both technological and social innovations.
If good education is needed more than ever, it is especially important to re-
duce educational poverty. As shall be seen, such poverty continues to exist de-
spite the major educational expansion of recent decades. To claim that educa-

6
tional attainment below secondary level II has reached a saturation point, as
some authors have done (Checchi et al., 2014), is far from the truth. Especially if
we compare educational attainment across the EU, we clearly see that the scope
for reducing educational poverty is enormous. Such individual low educational
attainment must be considered to be mostly the result of institutional arrange-
ments rather than the result of individual shortcomings. Nevertheless, due to
their focus on tertiary education, existing research and national policies often
fail to address educational poverty, thus ignoring one of the major sources of
low wages, inequalities and serious poverty in Europe.
Protecting people against educational poverty does not necessarily mean
reaching high national average educational attainment levels. It does not even
imply to reduce inequality in educational outcomes (Allmendinger and Leibfried,
2003). But the extent of educational poverty does tell us how many people are
just left behind. The empirical question addressed in this Review is whether
countries manage to reduce educational poverty, reach a high average level of
educational attainment and reduce social inequality. In trying to answer this
question, notably by building on the European research projects funded by the
European Commission (such as EQUALSOC, GOETE, INCLUD-ED, EDUMIGROM,
YIPPEE, EUMARGINS, WORKABLE) and on the large and rich tradition of research
on educational inequalities in Europe dating back to the 1960s at least (for re-
cent publications see, for instance, Ballas et al., 2012; Felouzis, 2014; Baker et al.,
2009)2, this Review would develop a solid foundation for fighting social inequali-
ty.
The answer to this question also provides the basis for all subsequent Chap-
ters because of the close connections between education, employment, income
and wealth in all countries. Fighting social inequalities at school is thus a priori-
ty in the fight against inequalities.
This chapter first discusses methods of measuring education, which have
significantly improved in recent years. It then goes on to look at educational
outcomes in terms of the quantity and quality of education. It ends up showing
the extent to which educational attainment is socially structured by gender and
family background. The following Chapters will show how much education mat-
ters for employment, income and wealth.
2 For a wealth of information on inequalities in education, beyond the European projects cited, see also the publications of the Network of Experts in Social Sciences of Education and Training (http://www.nesse.fr/nesse) and of the networks of the European Educational Research Associa-tion (http://www.eera-ecer.de/).

7
1.1 How do we measure education? And what does educational attainment tell us?
To measure education, researchers used to simply count the years people
had spent in educational and vocational training institutions or the degrees they
had earned, that is, the certificates awarded by schools and vocational training
providers. In recent years, they have also collected data on cognitive competen-
cies (i.e. what people really know or can do with their knowledge), which are
being measured globally via standardized tests among different age groups and
with regard to different cognitive areas, such as mathematics, reading and sci-
ence3.
For the time being, comparison is limited to two measures. The first is for-
mal education, as measured by degrees and codified by the International Stand-
ard Classification of Education (ISCED). The second is cognitive competencies as
measured at the age of 15 by the Programme for International Student Assess-
ment (PISA) and in adulthood by the Programme for International Adult Compe-
tencies (PIAAC). As for PISA and PIAAC, this Review will concentrate only on read-
ing comprehension.
Educational poverty can be defined on the basis of the information on de-
grees and acquired competencies. In terms of degrees, poorly educated people
are those below secondary level II. In terms of competencies, their level of com-
petence remains below level 2. Highly educated people are those who have been
awarded a tertiary degree or have reached competence levels 5 and 6.4
1.2 Who gets a chance? Educational attainment in Europe
Looking at the distribution of degrees awarded, vast differences in educa-
tional attainment across the EU countries can be seen, as demonstrated by the
EQUALSOC, INCLUD-ED and WORKABLE European research projects. For instance,
the percentage of the young population in educational poverty (below secondary
level II) ranges from 41% in Malta to 6% in Poland, the Czech Republic and Slo-
3 Although progress has been made, as degrees and cognitive competencies cover many aspects of education, the full complexity of education is not yet understood. What still needs to be devel-oped are data on emotional, social and global competencies. There can be no doubt that these competencies are increasingly important in an interconnected world and that they have to be regarded as an educational good. 4 In the recent past, graduates of vocational apprenticeship programs have come to be included in the tertiary sector, or at the very least those who have successfully completed master crafts-man certification.

8
vakia (see Figure 1). Despite considerable progress over the years, educational
poverty remains one of Europe's greatest challenges.
Figure 1: Population without secondary education, by age group, 2013
(in per cent)
Source: Eurostat-Online 2014, EU Labour Force Survey (EU-LFS).
At secondary level II the levels for 25- to 34-year-olds in 2013 ranged be-
tween 25% and 68%, making the spread between the countries equally high.
Again, there is clear progress over time. The speed at which the population’s
education levels can improve is exemplified by Portugal’s unparalleled develop-
ment. Among the 54- to 65-year-olds, only 9% have a secondary level II qualifi-
cation, whereas 30% of 25- to 34-year-olds have a similar qualification.
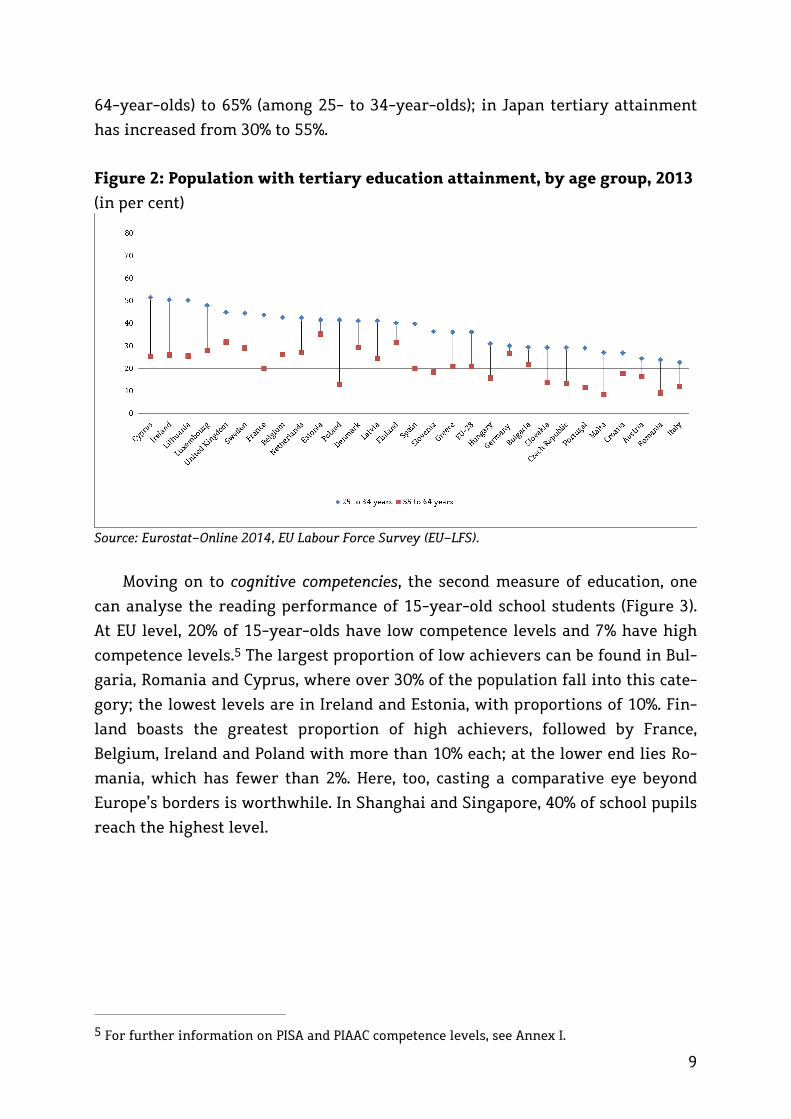
In tertiary education, the countries education levels also differ dramatically
(Figure 2). In Italy and Romania, 23% of 25- to 34-year-olds have a tertiary de-
gree; in Cyprus, Ireland, Lithuania and Luxemburg, it is closer to 50%. In Poland,
the recent expansion of the tertiary sector has been particularly quick: the in-
crease here is approximately 28 percentage points. There has also been great
progress in Cyprus, Lithuania, Ireland and France (increases of between 24 to 27
percentage points). In Germany, the proportion of people with a tertiary degree
has only minimally increased, from 27% to 30%. A glance beyond the borders of
the EU at some Asian countries shows, however, that despite all the progress,
further efforts are urgently needed. Within a short period of time, South Korea
has succeeded in increasing tertiary education levels from 12% (among 55- to
9
64-year-olds) to 65% (among 25- to 34-year-olds); in Japan tertiary attainment
has increased from 30% to 55%.
Figure 2: Population with tertiary education attainment, by age group, 2013
(in per cent)
Source: Eurostat-Online 2014, EU Labour Force Survey (EU-LFS).
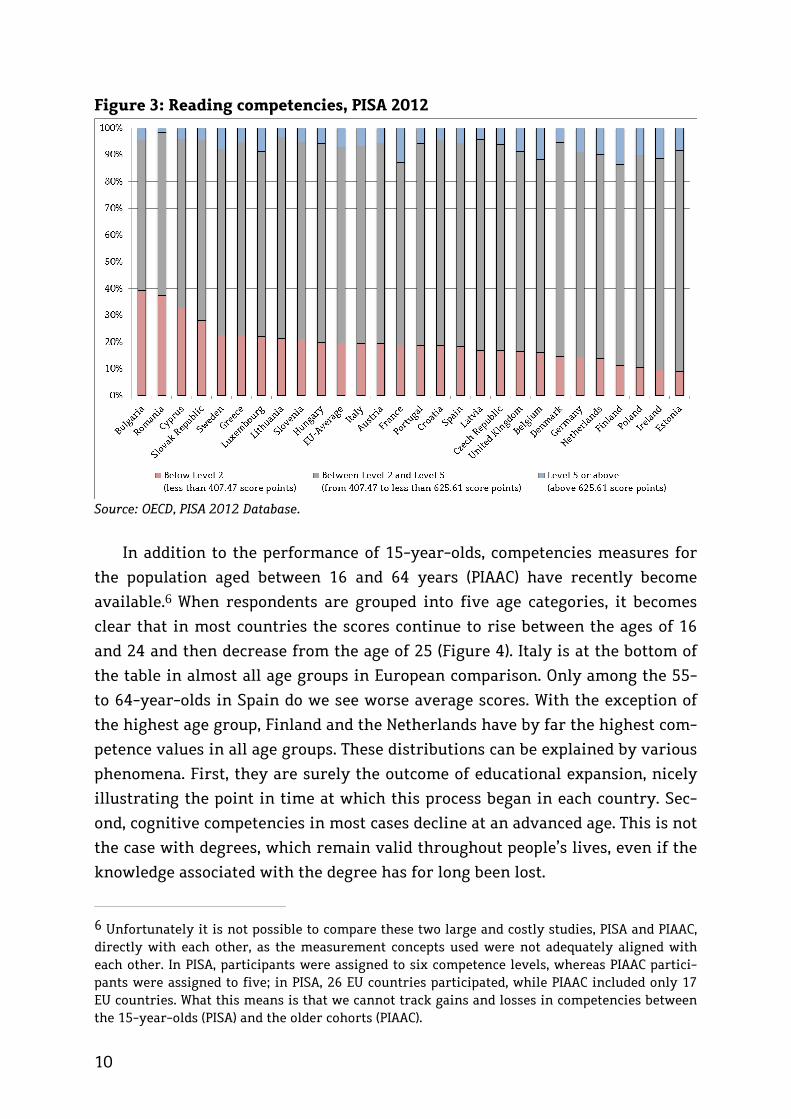
Moving on to cognitive competencies, the second measure of education, one
can analyse the reading performance of 15-year-old school students (Figure 3).
At EU level, 20% of 15-year-olds have low competence levels and 7% have high
competence levels.5 The largest proportion of low achievers can be found in Bul-
garia, Romania and Cyprus, where over 30% of the population fall into this cate-
gory; the lowest levels are in Ireland and Estonia, with proportions of 10%. Fin-
land boasts the greatest proportion of high achievers, followed by France,
Belgium, Ireland and Poland with more than 10% each; at the lower end lies Ro-
mania, which has fewer than 2%. Here, too, casting a comparative eye beyond
Europe’s borders is worthwhile. In Shanghai and Singapore, 40% of school pupils
reach the highest level.
5 For further information on PISA and PIAAC competence levels, see Annex I.
10
Figure 3: Reading competencies, PISA 2012
Source: OECD, PISA 2012 Database.
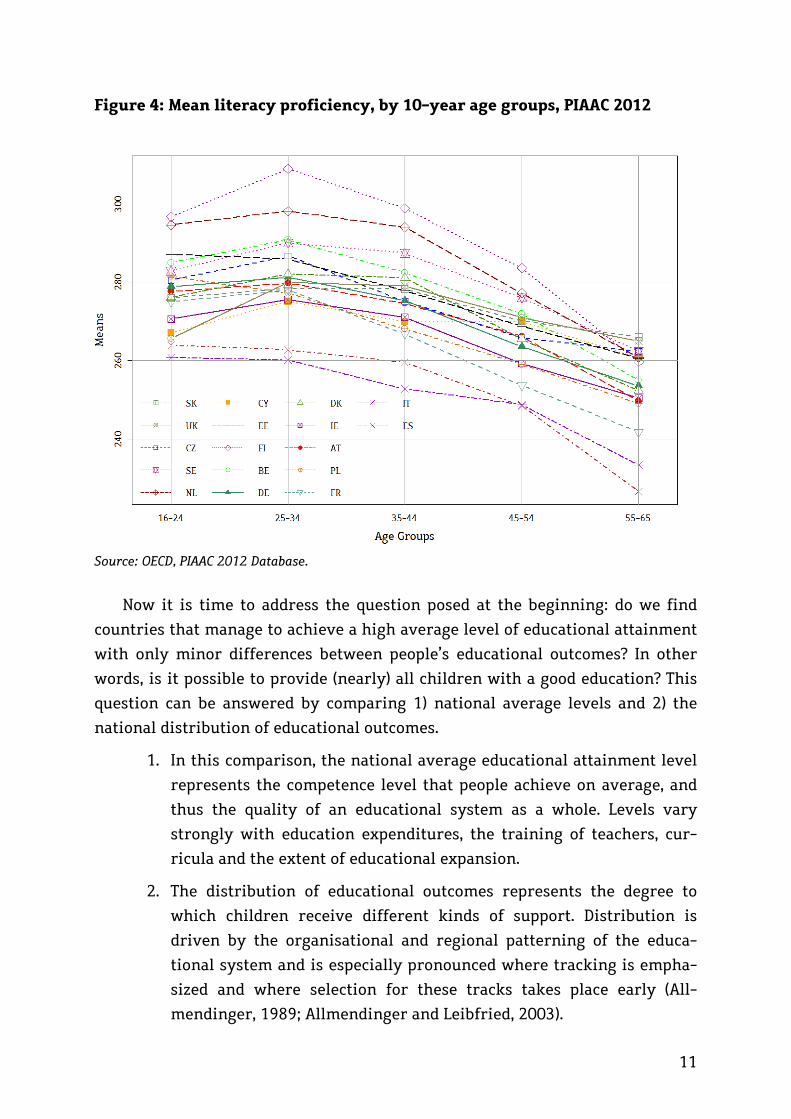
In addition to the performance of 15-year-olds, competencies measures for
the population aged between 16 and 64 years (PIAAC) have recently become
available.6 When respondents are grouped into five age categories, it becomes
clear that in most countries the scores continue to rise between the ages of 16
and 24 and then decrease from the age of 25 (Figure 4). Italy is at the bottom of
the table in almost all age groups in European comparison. Only among the 55-
to 64-year-olds in Spain do we see worse average scores. With the exception of
the highest age group, Finland and the Netherlands have by far the highest com-
petence values in all age groups. These distributions can be explained by various
phenomena. First, they are surely the outcome of educational expansion, nicely
illustrating the point in time at which this process began in each country. Sec-
ond, cognitive competencies in most cases decline at an advanced age. This is not
the case with degrees, which remain valid throughout people’s lives, even if the
knowledge associated with the degree has for long been lost.
6 Unfortunately it is not possible to compare these two large and costly studies, PISA and PIAAC, directly with each other, as the measurement concepts used were not adequately aligned with each other. In PISA, participants were assigned to six competence levels, whereas PIAAC partici-pants were assigned to five; in PISA, 26 EU countries participated, while PIAAC included only 17 EU countries. What this means is that we cannot track gains and losses in competencies between the 15-year-olds (PISA) and the older cohorts (PIAAC).
11
Figure 4: Mean literacy proficiency, by 10-year age groups, PIAAC 2012
Source: OECD, PIAAC 2012 Database.
Now it is time to address the question posed at the beginning: do we find
countries that manage to achieve a high average level of educational attainment
with only minor differences between people’s educational outcomes? In other
words, is it possible to provide (nearly) all children with a good education? This
question can be answered by comparing 1) national average levels and 2) the
national distribution of educational outcomes.
1. In this comparison, the national average educational attainment level
represents the competence level that people achieve on average, and
thus the quality of an educational system as a whole. Levels vary
strongly with education expenditures, the training of teachers, cur-
ricula and the extent of educational expansion.
2. The distribution of educational outcomes represents the degree to
which children receive different kinds of support. Distribution is
driven by the organisational and regional patterning of the educa-
tional system and is especially pronounced where tracking is empha-
sized and where selection for these tracks takes place early (All-
mendinger, 1989; Allmendinger and Leibfried, 2003).

12
Along the two axes, we can distinguish four fields (Table 1): egalitarian coun-
tries at a high versus low level of competence, and inegalitarian countries at a
high versus low level of competence. The table only shows countries that can be
clearly assigned to one of these profiles. All other countries are situated some-
where in the middle section of the two axes. Regarding the 15-year-olds7, the
countries that reach a high level and a low spread are Ireland, Poland and Esto-
nia (Box 1). France, in contrast, is more elitist in that regard (Box 3): average
competence levels are high, but the spread is much wider than it is in Ireland,
Poland or Estonia.
Table 1: Distribution and level: Institutional educational profiles (illustrated
by the most outstanding countries), PISA 2012
Distribution of competencies a
low (egalitarian) high (unequal)
Level of competencies b
high
1 Ireland (286/523)c
Poland (289/518)c
Estonia (263/516)c
3 France (357/505) c
low 2
Lithuania (281/477)c 4
Bulgaria (386/436)c
Cyprus (366/449)c
Notes: a The distribution of competencies can be considered high in this context when the score is 350 points or higher (upper quartile) and low when it falls to 290 or less (lower quartile). b The level of competencies is defined as high when surpassing 505 points (upper quartile) or low when it is at 481 (lower quartile) or less. c The first number reported in the brackets refers to the variance, the spread, between the 95th and 5th percentile (equality/ inequality). The second number reports mean national competence (level/ plateau). Source: OECD, PISA 2012 Database.
The two other boxes represent countries with a low level of educational at-
tainment: Lithuania provides a low-level, low-spread education (Box 2); Bulgaria
7 A corresponding comparison could also be made by referring to the population aged between 16 and 64 years (PIAAC). However, since all countries have seen strong developments in recent years (see Fig. 4), and because cohort and age effects intersect, doing so would make little sense. The differences within single countries are often larger than those between countries.
13
has a low level of education with a considerable dispersion below and above the
average (Box 4). In view of these findings, the European Commission would be
well-advised to consider not only the competence levels achieved but also the
question of how high competence levels can be ensured for the whole population
in education.
Degrees and competencies: Do measures of education converge?
Normally, degrees and competencies are placed alongside each other and
remain unconnected. Behind this, the implicit assumption is that both indicators
measure something comparable and those countries whose populations achieve
high degrees will also have high cognitive competence scores. For a long time,
the only way to test this assumption was to compare the competencies of 15-
year-olds (PISA) with the degrees earned by 25- to 34-year-olds. The new PIAAC
data now allow comparing the competencies of 25- to 34-year-olds with the
degrees of those in the same age group.
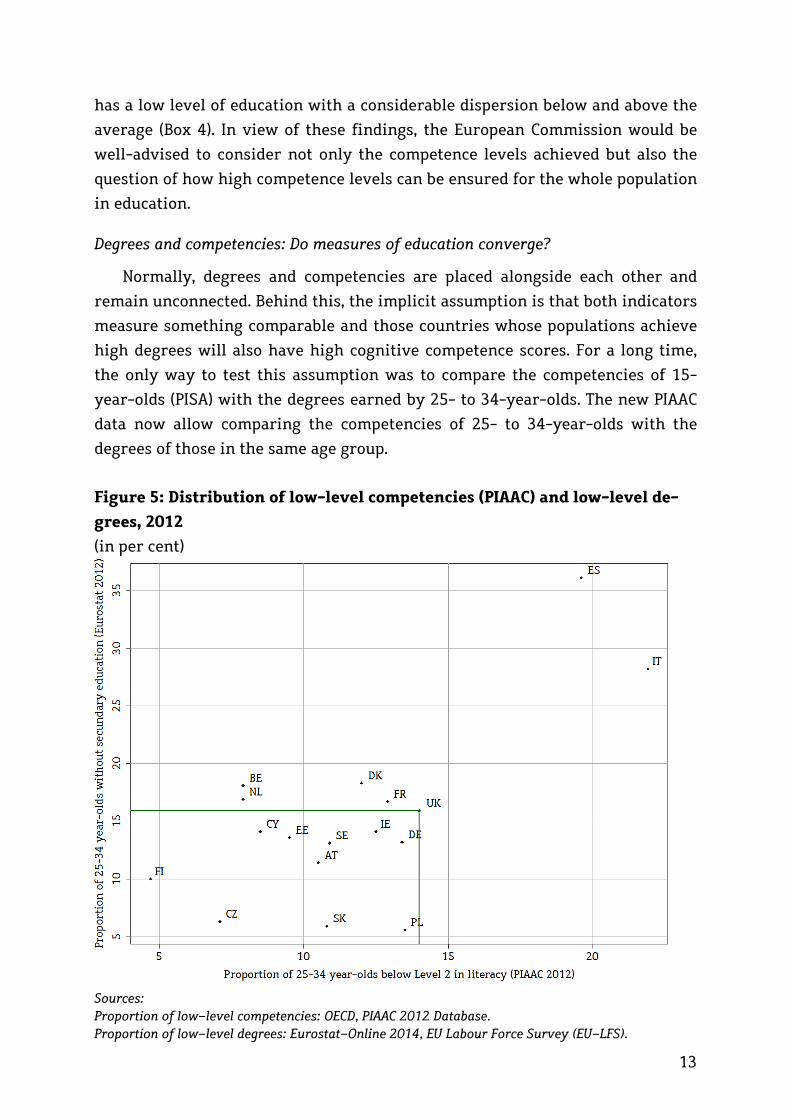
Figure 5: Distribution of low-level competencies (PIAAC) and low-level de-
grees, 2012
(in per cent)
Sources: Proportion of low-level competencies: OECD, PIAAC 2012 Database. Proportion of low-level degrees: Eurostat-Online 2014, EU Labour Force Survey (EU-LFS).

14
As for educational poverty (Figure 5), the correlation between low-level
competencies and low-level degrees is very high.8 Spain and Italy at the lower
end and Finland and the Czech Republic at the upper end are the best examples
here. There are few countries with low-level competencies and high-level de-
grees or vice versa. One example is Belgium, a country where few people lack
basic competencies but relatively many hold only few or no educational degrees.
We find the inverse pattern in Poland. Here, many people lack basic competen-
cies but few lack the most basic educational degrees.
Figure 6: Distribution of high-level competencies (PIAAC) and high-level
degrees, 2012
(in per cent)
Sources: Proportion of high-level competencies: OECD, PIAAC 2012 Database. Proportion of high-level degrees: Eurostat-Online 2014, EU Labour Force Survey (EU-LFS).
However, there are more disturbing results. The somewhat comforting find-
ing that low competence levels and low degree levels by and large overlap does
not hold true for the higher educational levels.9 In all countries, there is a sub-
8 R2= 0.43, p-value: 0.002 9 R2= -0.02, p-value: 0.429
15
stantially higher proportion of 29- to 34-year-olds with a tertiary degree than
the proportion of people with high-level competencies (Figure 6). The most ex-
treme case is Cyprus where over half of the population in this age group has a
tertiary qualification (54%) but only 7% of this same age group score at compe-
tence levels 4 and 5. Only in Finland do the proportions of people with tertiary
qualifications (40%) roughly equal the proportion of high-competence individu-
als (37%). This discrepancy is an alarming sign. Europe has made the free move-
ment of labour a top priority. Employers look at degrees but only rarely screen
the competencies that lie behind them. When degrees lose their meaning, this
weakens the confidence of the employers but also the mobility on the European
labour market.
Stratification in educational attainment
Are there groups in the population that are systematically able to reach a
higher or lower level of education than other groups? To what extent can we
assume that, aside from these differences, there is a systematic social structur-
ing?
As already seen, educational outcomes differ by age. These differences are
primarily cohort effects resulting from educational expansion. Looking at cogni-
tive competencies, it is also expected that age effects should involve a decrease
of cognitive competencies as people grow older, albeit with strong variations
within each age group.
In addition to age, gender plays a role. When it comes to qualifications, wom-
en have caught up with men and have even managed to outperform them in
some respects over time. This also applies to countries where women have had a
higher education level than men for some time (OECD, 2013: 36). As far as cogni-
tive competencies are concerned, between mathematical and reading competen-
cies must be distinguished. In most countries, men have higher mathematical
competencies than women; the exceptions are Latvia, Finland and Sweden. Re-
garding language-related competencies, women perform better and achieve
clear competence advantages over time. In Poland, the level of 15-year-old
women with high competence levels (PISA, levels 5 and 6) increased by more
than 7 percentage points between 2000 and 2012. While the advantages men
enjoy in mathematics remain evident over the life course, a finding confirmed
by the results of PISA and PIAAC, this is not the case for literacy. 15-year-old
women do better than men (PISA), whereas in the higher age groups men have
16
better competencies than women. Whether this is due to the different measure-
ment instruments used in PISA and PIAAC, or whether it is due to actual gains
and losses in competencies, is an open question.
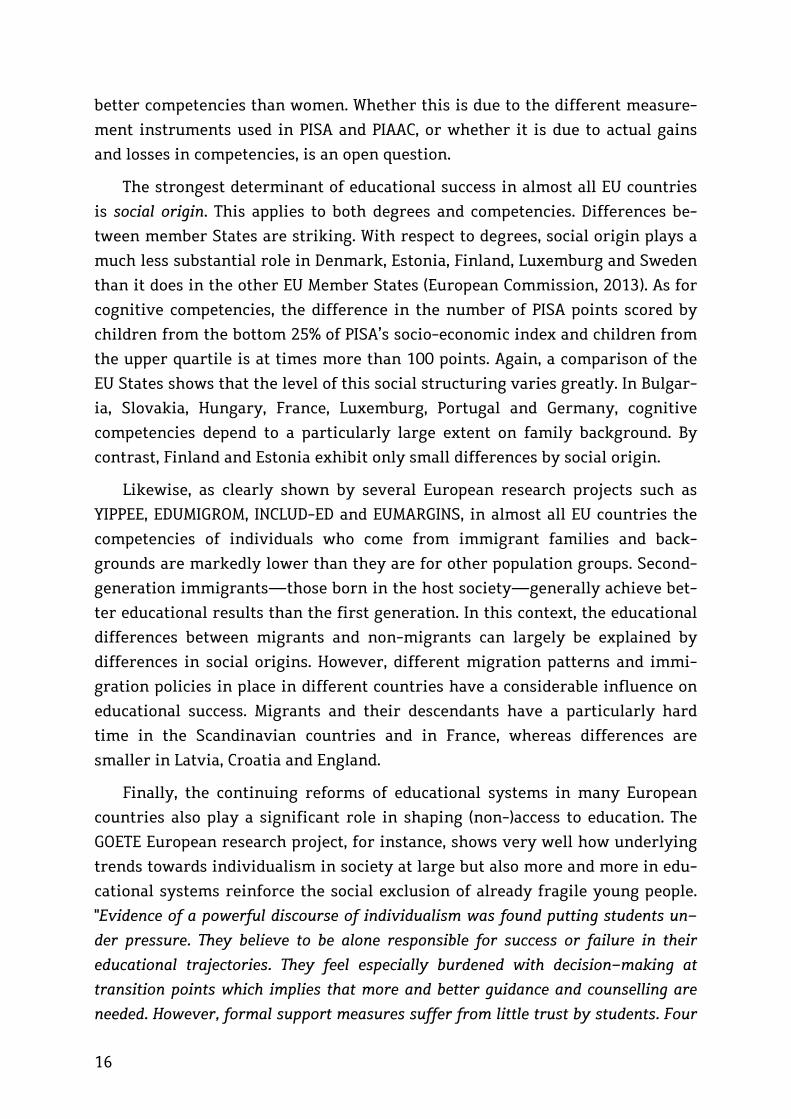
The strongest determinant of educational success in almost all EU countries
is social origin. This applies to both degrees and competencies. Differences be-
tween member States are striking. With respect to degrees, social origin plays a
much less substantial role in Denmark, Estonia, Finland, Luxemburg and Sweden
than it does in the other EU Member States (European Commission, 2013). As for
cognitive competencies, the difference in the number of PISA points scored by
children from the bottom 25% of PISA’s socio-economic index and children from
the upper quartile is at times more than 100 points. Again, a comparison of the
EU States shows that the level of this social structuring varies greatly. In Bulgar-
ia, Slovakia, Hungary, France, Luxemburg, Portugal and Germany, cognitive
competencies depend to a particularly large extent on family background. By
contrast, Finland and Estonia exhibit only small differences by social origin.
Likewise, as clearly shown by several European research projects such as
YIPPEE, EDUMIGROM, INCLUD-ED and EUMARGINS, in almost all EU countries the
competencies of individuals who come from immigrant families and back-
grounds are markedly lower than they are for other population groups. Second-
generation immigrants—those born in the host society—generally achieve bet-
ter educational results than the first generation. In this context, the educational
differences between migrants and non-migrants can largely be explained by
differences in social origins. However, different migration patterns and immi-
gration policies in place in different countries have a considerable influence on
educational success. Migrants and their descendants have a particularly hard
time in the Scandinavian countries and in France, whereas differences are
smaller in Latvia, Croatia and England.
Finally, the continuing reforms of educational systems in many European
countries also play a significant role in shaping (non-)access to education. The
GOETE European research project, for instance, shows very well how underlying
trends towards individualism in society at large but also more and more in edu-
cational systems reinforce the social exclusion of already fragile young people.
"Evidence of a powerful discourse of individualism was found putting students un-
der pressure. They believe to be alone responsible for success or failure in their
educational trajectories. They feel especially burdened with decision-making at
transition points which implies that more and better guidance and counselling are
needed. However, formal support measures suffer from little trust by students. Four
17
times more students refer to informal sources of support in case of school or tran-
sition problems rather than to teachers or other professionals. Informal support in
turn suffers from a lack of recognition from institutional actors. In fact, findings
reveal a “blaming game” between school and parents." (Parreira do Amaral et al.,
2013).
1.3 Conclusion
Educational attainment is distributed very unequally, both between the EU
countries and within individual countries, regardless of whether we take quali-
fications or competencies as a measure. Among the societal challenges Europe
faces, the greatest one lies in reducing educational poverty. Poorly educated
young people will have a hard time finding a job and living an independent life,
as will be shown in the Chapters to follow. An average of 8% of the young cohort
lacks a general school-leaving certificate. Worse even, an average of 19% of 15-
year-old boys and girls are considered ‘functionally illiterate or innumerate’
because their cognitive reading or mathematical understanding is very low.
These young people have been denied a good start in life and an opportunity to
find a good job. Reducing educational poverty must be made a priority in all EU
countries.
The data have shown that it is possible to reduce educational poverty with-
out endangering the overall quality of education. It is wrong to assume that a
policy aimed at reducing educational poverty would water down the quality of
education and lead to a one-size-fits-all low-level education. In fact, there is
now ample scientific evidence that some countries successfully manage to reach
a high average level of educational attainment without increasing inequality in
educational outcomes.
An important key to improving the quality and equality of educational out-
comes is to promote more equal access to education. Parents’ social status struc-
tures educational opportunities in almost all countries. Much can be done to give
children from socially disadvantaged groups or migrant families a good start at
school and in life. Highly stratified school systems in particular are not sustain-
able. The international comparison shows that educational systems have a great
influence on the level and distribution of education. The countries that have
markedly improved their performance over time are those that have opened
their education systems and sort students only at a much later stage. Teacher
training in these countries has also been substantially improved through incen-
tive systems, higher wages and further education. Targeted measures for weaker

18
students have been introduced and the autonomy of schools has been increased
(Allmendinger, 2013).
While there can be no doubt that reducing educational poverty and increas-
ing equal opportunity in educational outcomes must be a key goal, it is unclear
to what extent tertiary education must be expanded and whether it can bring all
the competencies needed now and in the future in the European labour market.
Some countries boast an excellent performance at secondary level II but have
not expanded their tertiary sector in similar ways. They have chosen the policy
not to expand their higher education sector and instead emphasize post-
secondary vocational education (Austria, Germany and Central and East Europe-
an countries such as Slovakia, Slovenia, the Czech Republic and Hungary). This
concerns national policies in the transition from school to work and will be tak-
en up in more detail in Chapter 2.
This chapter has also identified a number of methodological problems. In
particular, we pointed out three areas. First, it is important to note that existing
measures of education remain deficient. We urgently need data to assess social,
emotional and global competencies. Schools need to teach such competencies.
Reducing education to factual knowledge and cognitive competencies will not do
justice to the individual and societal meaning of education. Doing so also fails to
take account of important changes in the labour market, which relies more and
more on diversity, self-managing teams and self-regulating workers. Second,
the education measures used by the OECD and the European Commission paint a
very different picture of educational success and of the distribution of education
in various countries. High degrees in particular are too often unrelated to cogni-
tive competencies. It might be suspected that while the EU-wide benchmarks
(related to degrees) have caused Member States to adapt to these benchmarks by
lowering the requirements needed, the same is not possible with regard to com-
petencies which follow standardized tests. Awarding high-level degrees without
teaching the underlying competencies is highly problematic, as it threatens the
European Qualifications Framework (EQF). This problem has yet to be addressed
by the European Commission. Third, for the purpose of determining educational
success, the EU uses indicators that are uniformly applied to all countries (ISCED,
PISA, PIAAC). Given the different demands of national labour markets, consider-
ate can be asked whether applying such a uniform approach makes sense or not.

19
2. Employment and Inequalities
Today, employment is increasingly seen as a panacea for all social ills. Driv-
en by demographic change and supported by a transformation of the Welfare
State into a social investment State, large-scale activation schemes now aim to
get as many people of working age as possible into employment and ensure they
remain employed. The European Commission has supported this objective for
more than a decade. As part of the Lisbon Strategy, the EU in 2000 stated the
following goals for 2010: an overall employment rate of 70%, a female employ-
ment rate of 60% and an employment rate for older workers (aged 55-64) of 50%.
For 2020 the overall employment target has been increased to 75% as part of the
so-called Europe 2020 strategy. In recent years, under the so-called European
Employment Strategy, the establishment of the Annual Growth Survey and of
the European Semester have given the EU and its member States much im-
proved tools such as the Employment Guidelines, the Joint Employment Report
and the National Reform Programmes, which allow a refined monitoring of the
employment situation in the EU countries.
Nevertheless, the impressive transformations of work patterns and of the
labour markets in Europe over the last decades have left policymakers with
many puzzles as to how to steer their employment policies. The common reason-
ing behind the existing employment objectives goes something like this: paid
work determines who is included and who is excluded, who enjoys recognition
and self-respect and who does not. Employment protects people from poverty
and helps them to avoid having to rely on state transfers and financial support
from personal relationships. It also allows people to shape their own lives, inte-
grate into society and build up and retain their own networks. But is that truly
the case? Or is that reading nothing but a popular myth?
The truth is complex and somewhere in between. We need a more nuanced
approach, as a recent scientific Review of the Commission on “jobs and skills”
underlined (European Commission, 2012). High employment rates for instance
do not as such say anything about the quality of employment: do we want eve-
rybody employed but in many poor-quality jobs? Certainly not: the EU has actu-
ally always pressed for “more and better jobs”. Therefore there is no reason to
believe that employment is THE exclusive solution to economic and social prob-
lems: as also shown in Chapter 4, many Europeans are trapped in the low-wage
sector, many belong to the working poor, others have insecure jobs and often
20
work in small-scale, part-time employment with little or no prospects for bet-
ter-paid jobs.
It is thus important to distinguish two employment measures: employment
rates and types of employment.
1. The employment rate shows how many people of working age are in
employment.
2. Analysing the type of employment, by contrast, gives answers to ques-
tions like: How many hours do people work? How secure are their
jobs? This Review follows the latter approach and asks about the types
of employment.
This Chapter is based on the finding of several European research projects
such as NEUJOBS, YOUNEX, WALQING and FLOWS as well as other research results.
It begins by describing a very specific stage in people’s lives: the difficult transi-
tions between education, training and employment. In many EU countries, young
people fail to get access to employment and thus begin their working lives in
precarious employment, unemployment or inactivity. How can we explain the
differences between Member States? Why do young people in some countries
gain quicker and more effective access to the labour market than those in oth-
ers? It then addresses employment rates and the important issue of the quality
of jobs before offering concluding remarks.
2.1 From education to employment: or how to fight youth un-employment effectively?
High youth unemployment in many European countries is one of the central
challenges of our time. Empirical studies agree that early-career unemployment
has particularly long-term consequences. Individuals who are unemployed early
in adulthood are considerably more likely to be unemployed later in their lives.
When they eventually start working after a period of unemployment, their start-
ing salaries are often low and then increase very little. Eventually, after 25
years, their job satisfaction is still markedly lower than that of individuals with
comparable qualifications who have not experienced a period of early-career
unemployment (Arulampalam, 2001). As amply shown by the YOUNEX European
research project, scars remain.
However, any examination of the transition from education into employ-
ment has to consider more than ‘just’ unemployment. This is especially true if
transitional experiences are attributed to specific age cohorts. That is why

21
statements such as ‘Every second Spaniard under the age of 30 is not employed’,
or ‘Half of all young people in Greece are out of work’, as important as they are,
should be interpreted with caution. In a best-case scenario, young people in this
age group are not available for employment because they are still in education
or training. Others are indeed unemployed, which means by definition they are
looking for jobs. Many others may have already lost hope and are inactive. But
others are considered as “employed”, they actually have a job but they do not
earn enough for a decent standard of living.
Young people who are ‘not employed, not in education, not in training’ are
called NEETs. The average proportion of NEETs across the EU-28 in 2013 was
15.9%, of which 8% are unemployed and 7.9% are inactive. However, this esti-
mate of the proportion of NEETs may be conservative. In some countries, many
young people with low education levels are enrolled in training courses. This
means they are not considered NEETs even though they typically continue to
face poor employment prospects when entering the labour market and are thus
likely to join the NEETs.
There are dramatic differences between countries in the proportions and
composition of the NEET group (Figure 7). For example, the proportion of inactiv-
ity ranges from 4% in Luxembourg, Sweden and the Netherlands to 17% in Bul-
garia.
Figure 7: Education and employment among 15-29-year-olds, 2013
(in per cent)
Source: Eurostat-Online 2014, EU Labour Force Survey (EU-LFS).
22
Youth unemployment ranges from 3% in Denmark and the Netherlands to
22% in Greece. In many countries in Europe, youth unemployment skyrocketed
with the financial and euro crisis and the accompanying economic collapse.
There are only two EU countries in which youth unemployment has fallen: Ger-
many and Austria.
The great differences in the proportion of NEETs between EU Member States
cannot be ascribed to a single cause. Before the crisis, youth unemployment was
often explained by structural components, like structural changes in industries,
mismatches in qualifications or (risk)-group-specific characteristics (Dietrich,
2012). Since the beginning of the 2000s, the business cycle has emerged as an
explanatory factor in macro-analytical models of youth unemployment. These
models show that youth unemployment is more sensitive to business cycle con-
ditions than adult unemployment (Blanchflower and Freeman, 2000; Jimeno and
Rodriguez-Palanzuela, 2002).
The discussion has also begun to address a broad set of institutionally driven
individual factors that prevent young people from entering the labour market or
increase their risk of becoming unemployed. These include a lack of seniority,
firm-specific human capital and labour market experience as well as a greater
likelihood of working on short-term contracts and in other forms of precarious
employment (Dietrich, 2012). In other words, many young Europeans seem to be
trapped into a vicious circle where, ironically, their lack of experience is often
the main reason for not giving them access to the labour market. The organisa-
tion of precarious employment or unemployment has thus become a long-term
feature of European economics—a feature that, it seems, policymakers and em-
ployers have failed to address with effective action and determination for more
than 30 years.
It is often emphasized that the proportion of NEETs is systematically con-
nected to demographic developments. The higher the share of young people, the
higher the youth unemployment rate. This intuitively plausible relationship was
observed within the countries of the EU prior to the Euro crisis. In 2003, the
unemployment rate for 15-24-year-olds was highest in Poland—the country
with the highest share of young people among the EU-27 countries. In contrast,
Denmark, Germany and Luxemburg, with a smaller share of young people, had
comparatively low unemployment rates among this population. However, this
explanation did not prove sustainable in subsequent years. In many countries,
the proportion of 15- to 24-year-olds fell between 2003 and 2012; and yet, youth
unemployment rates continued to rise over the same period. Only in Belgium,
23
Finland, Germany, Malta and Poland did the share of 15- to 24-year-olds and the
youth unemployment rate fall between 2003 and 2012.
Even if cultural norms, such as the norm of non-employment of women, help
explain the vast differences between NEET populations, it is the type of occupa-
tional training and the concomitant structured transition between school and
work that have received the most attention from scholars and policymakers.
This Review will therefore explore institutional sources in particular detail.
Across Europe, systems of vocational training differ greatly. In the UK and Ire-
land, a liberal market model dominates: training takes place on the job. The skills
that are taught are largely practical and very company specific; therefore they
are difficult to transfer from one company to another. In the Scandinavian coun-
tries and in France, by contrast, training is principally delivered in a full-time
school setting. The contents taught tend to be theoretical in nature, highly
standardised and not particularly tailored to the needs of individual companies.
The third type, the cooperative dual model can be found in Switzerland (60% of
young people are in a dual apprenticeship), Denmark (48%), Germany (43%) and
Austria (35%) (Ebner, 2013). This model combines the characteristics of the other
two systems. The combination of classroom learning and workplace training
results in an apprenticeship that is both theoretical and practical and therefore
likely to be more transferable.
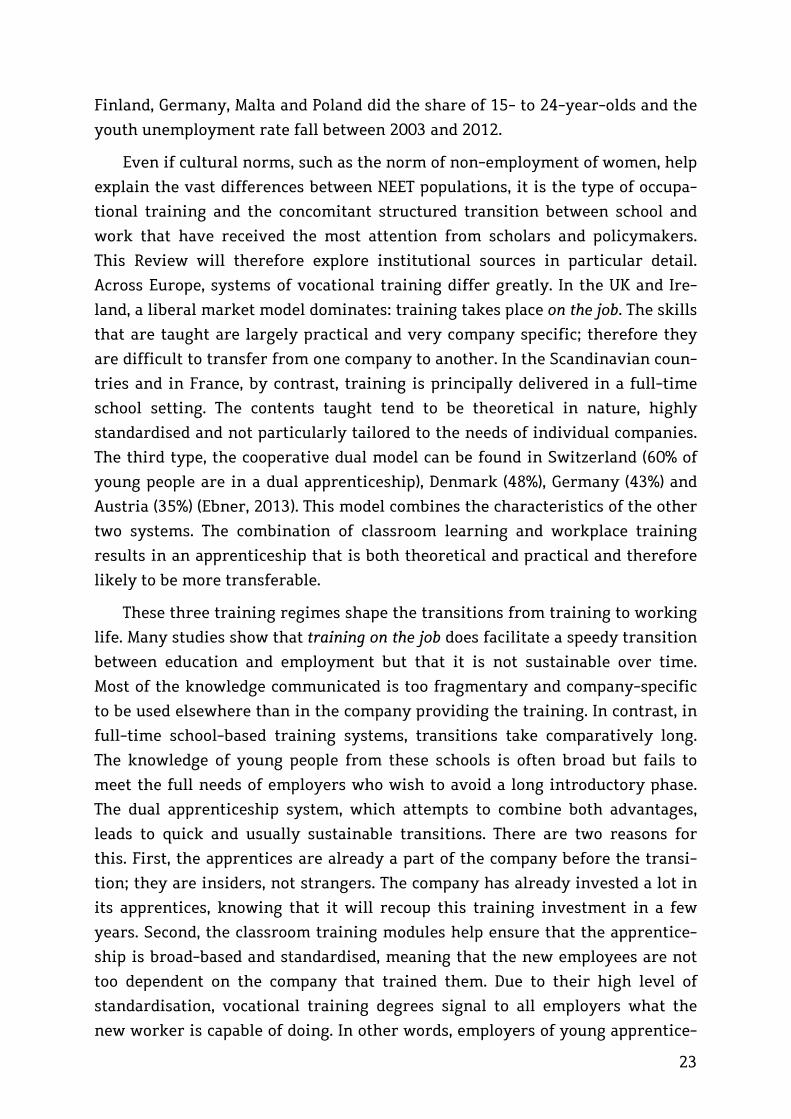
These three training regimes shape the transitions from training to working
life. Many studies show that training on the job does facilitate a speedy transition
between education and employment but that it is not sustainable over time.
Most of the knowledge communicated is too fragmentary and company-specific
to be used elsewhere than in the company providing the training. In contrast, in
full-time school-based training systems, transitions take comparatively long.
The knowledge of young people from these schools is often broad but fails to
meet the full needs of employers who wish to avoid a long introductory phase.
The dual apprenticeship system, which attempts to combine both advantages,
leads to quick and usually sustainable transitions. There are two reasons for
this. First, the apprentices are already a part of the company before the transi-
tion; they are insiders, not strangers. The company has already invested a lot in
its apprentices, knowing that it will recoup this training investment in a few
years. Second, the classroom training modules help ensure that the apprentice-
ship is broad-based and standardised, meaning that the new employees are not
too dependent on the company that trained them. Due to their high level of
standardisation, vocational training degrees signal to all employers what the
new worker is capable of doing. In other words, employers of young apprentice-

24
ship graduates see a match between certificates and skills. For many young peo-
ple in countries with a dual apprenticeship system, this form of training is any-
thing but a second-best option after university. Interestingly, in these countries
an increasing number of young people eligible for university study still choose a
dual apprenticeship, expecting to find employment more easily. The corollary is
that these countries have seen only been limited attempts to expand tertiary
education on a larger scale (see Chapter 1, Figure 2).
Is the dual apprenticeship system transferable? There are certain structural
challenges that need to be addressed. These relate to the intersections between
schools, tertiary institutions and further education. Countries where dual ap-
prenticeship systems are in place, such as Switzerland, Denmark and Austria,
have met these challenges (Ebner, 2013). There are 350 training occupations in
Germany, 250 in Austria and Switzerland, and 150 in Denmark. The fact that
there are fewer occupations in the latter three countries means that those occu-
pations are more broad-based, giving young people more mobility in their occu-
pations.
Austria and Denmark offer a kind of ‘general apprenticeship’ in the first
year, allowing trainees to get a sense of the occupation they are drawn to before
deciding in favour of a specific occupational field. In such systems, it is crucial to
allow young people to move between jobs in order to find a proper career that
suits them. The same applies to ensuring greater mobility between the occupa-
tional training and the tertiary sectors. With its vocational education colleges,
Austria has broken new ground. The time pupils spend at school is extended by
one year, enabling them to earn a double qualification: a university entrance
diploma and a vocational diploma. Similarly, the Swiss vocational baccalaureate
leads from an apprenticeship to a degree at a tertiary-level institution (Ebner,
2013; Graf, 2013).
In conclusion, the dual apprenticeship has proven its value in easing the
transition between education and employment. Nevertheless, it must be
acknowledged that the higher demands of the labour market will not leave this
dual system unchanged.
2.2 Employment rates: one objective, many national realities
Employment rates and conditions differ greatly between the EU Member
States. Between 2002 and 2012, employment across all EU countries rose slightly
from 67% to 69%. Behind this average there are large differences in country-
specific employment rates and trends. In Greece and Croatia, the employment

25
rate in 2012 was around 55%; in Sweden it was almost 80%. Despite the econom-
ic and financial crisis there were increases in employment in some countries in
the same 2002-2012 period, such as in Germany (plus 8 percentage points), Po-
land and Bulgaria (plus 7 percentage points) and Malta (plus 5 percentage points).
Figure 8: Employment rates, 20-64-year-olds, 2002, 2007 and 2012
(in per cent)
Source: Eurostat-Online 2014, EU Labour Force Survey (EU-LFS).
However, other countries witnessed a collapse in employment, such as
Greece, Ireland and Portugal (a fall of 7 percentage points each). Comparing the
2002 and 2012 figures, we see that the differences between countries regarding
their employment rates did not change so much, with of course some important
exceptions in countries most hit by the crisis after 2008 (Figure 8).
Age structures employment in all countries. In general, employment trajec-
tories over the life course are characterized by low employment rates at the
beginning and at the end of the working life, while employment rates reach
their peak between the ages of 35 and 45 years. Differences at the start of the
working life can be explained by the varying length of education and training,
as well as by phases of military service and difficulties with finding jobs, espe-
cially among the low skilled. The low employment rates at the end of the work-
ing life are related to the fact that many people in several European countries
leave the workforce due to early retirement schemes. The consequences are sub-

26
stantial. In virtually all countries, retirement benefits are linked to the number
of years in employment. As a result, delayed entries into employment and early
exits from employment also determine people’s financial situation – and hence
financial inequality in old age.
Figure 9: Employment rates in Europe, total population and 20-24-year-
olds, 2012
(in per cent)
0 20 40 60 80
SwedenNetherlands
GermanyAustria
DenmarkUnited Kingdom
FinlandEstonia
Czech RepublicLuxembourg
CyprusFrance
LithuaniaSlovenia
LatviaBelgiumPortugalSlovakia
PolandRomania
IrelandMalta
BulgariaHungary
ItalySpain
CroatiaGreece
Data Source: Eurostat; Authors Calculations.
females (20-24) males (20-24) total population (20-64)
Source: Eurostat-Online 2014, EU Labour Force Survey (EU-LFS).
If we concentrate on senior individuals (aged 55-64) in 2012, only 10 of the
EU-27 countries reached the ‘full-employment’ target that was set for this age
group under the Lisbon Strategy for Growth and Jobs (50%). Senior women espe-
cially fall short of this target, with noticeable exceptions in the Scandinavian
countries and Germany, Latvia and Estonia. However, most countries, except
Greece and Portugal, succeeded in raising the employment rate of senior people
between 2002 and 2012. Germany, the Netherlands and Austria showed a consid-
erable increase of about 23, 17 and 15 percentage points, respectively. Impres-
sive increases can also be seen for some of the new Member States, such as Slo-
vakia and Bulgaria, with about 19 and 15 percentage points in employment.
These large-scale country differences between the employment rates of 55- to
64-year-olds are partly explained by the variations in pension schemes and la-
bour market situations (Hartlapp and Schmid, 2008).

27
Figure 10: Employment rates in Europe, total population and 55-64-year-
olds, 2012
(in per cent)
0 20 40 60 80
SwedenNetherlands
GermanyAustria
DenmarkUnited Kingdom
FinlandEstonia
Czech RepublicLuxembourg
CyprusFrance
LithuaniaSlovenia
LatviaBelgiumPortugalSlovakia
PolandRomania
IrelandMalta
BulgariaHungary
ItalySpain
CroatiaGreece
Data Source: Eurostat; Authors Calculations.
females (55-64) males (55-64) total population (20-64)
Source: Eurostat-Online 2014, EU Labour Force Survey (EU-LFS).
Variations in actual retirement age are huge, even between countries that
have the same statutory pension age. In the majority of the EU-28 countries, the
official pension age is 65. In Belgium and Luxemburg, the average age for men
and women to leave the labour force is below 60. Women and men from the Bal-
tic States, as well as Romania and Portugal, tend to leave the labour force (on
average) later than the official pension age. The effective pension age is general-
ly determined by many factors but retirement schemes certainly have a huge
impact (OECD, 2011). Social and individual factors also influence the decision to
retire. Research shows that the greater people’s private wealth, the earlier they
retire, as wealth ensures that the current living standard can be maintained
after retirement (Skirbekk et al., 2012). There is also ample evidence that the
boom of the 1990s caused a decrease in retirement age by capital holders
(Corando and Perozek, 2003). Moreover, a survey during the financial crisis
(2008-2009) indicates that the majority of those aged 45 and more who lost
money during the crisis expected to delay their retirement (Skirbekk et al.,
2012). However, higher income is also associated with higher education, which
leads to the possible explanation that wealthier people might work longer be-
cause they entered the labour market later than those with less education. As

28
income and education are inversely correlated with mortality, higher educated
people retire later because they have a higher life expectancy. Early inequalities
thus have a strong impact over the life course.
Levels of education and employment rate
Education is by far the most important factor impacting on employment.
This is vividly illustrated in Figure 11. It shows the differences in employment
rates between people with a tertiary education and a medium-level education
(represented by blue bars) and the differences between people with a low and a
medium-level education (represented by the green bars).
Figure 11: Relative employment rate of 20-64-year-old workers, by educa-
tional attainment, 2012
(in percentage points)
Source: Eurostat-Online 2014, EU Labour Force Survey (EU-LFS).
In all countries: the higher the education, the higher the employment rates.
On average for the EU-28 countries, the disadvantages experienced by people
without qualifications are higher (minus 25%) than the advantages of tertiary-
level graduates (plus 18%). Nevertheless, there are still important differences
between countries. Some countries provide equal access to employment for peo-
ple from all qualification groups (Portugal, Cyprus). In other countries, there is a
split between the low-education group and the rest of the population (Slovakia,
the Czech Republic, Hungary, Poland, Belgium, Bulgaria), while another group of
29
countries offers highly educated individuals particularly good employment op-
portunities (Lithuania, Croatia and Greece).
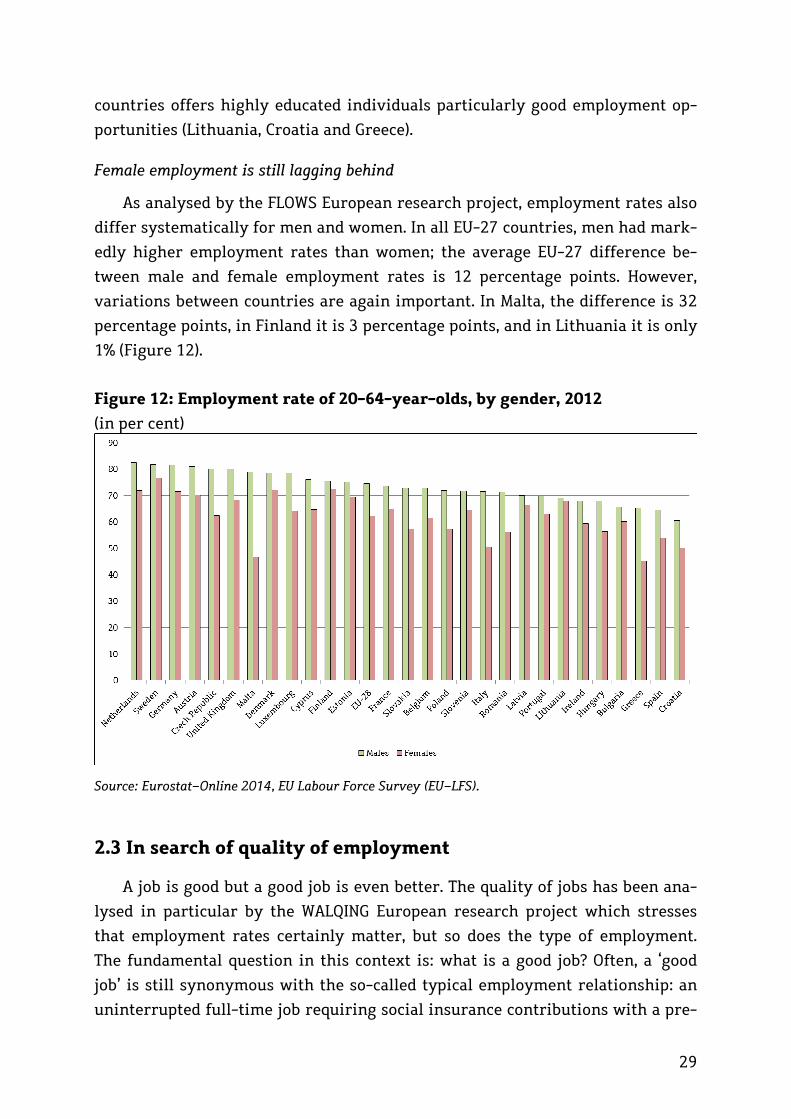
Female employment is still lagging behind
As analysed by the FLOWS European research project, employment rates also
differ systematically for men and women. In all EU-27 countries, men had mark-
edly higher employment rates than women; the average EU-27 difference be-
tween male and female employment rates is 12 percentage points. However,
variations between countries are again important. In Malta, the difference is 32
percentage points, in Finland it is 3 percentage points, and in Lithuania it is only
1% (Figure 12).
Figure 12: Employment rate of 20-64-year-olds, by gender, 2012
(in per cent)
Source: Eurostat-Online 2014, EU Labour Force Survey (EU-LFS).
2.3 In search of quality of employment
A job is good but a good job is even better. The quality of jobs has been ana-
lysed in particular by the WALQING European research project which stresses
that employment rates certainly matter, but so does the type of employment.
The fundamental question in this context is: what is a good job? Often, a ‘good
job’ is still synonymous with the so-called typical employment relationship: an
uninterrupted full-time job requiring social insurance contributions with a pre-

30
defined career path and corresponding salary increases over the life course.
Work that deviates from this model (i.e. part-time work, fixed-term contracts,
agency-based employment or (solo) self-employment) is described as atypical
(and thus lower-quality) employment. The practice of calling one typical em-
ployment relationship ‘standard’ and other diverse types of employment ‘atypi-
cal’ deserves to be questioned. For women, for instance, typical employment was
never ‘typical’; it was the exception rather than the rule. Women’s employment
careers are in fact characterized by interruptions and by long periods of part-
time work. The concept of the standard full-time employment relationship his-
torically emerged in countries in which one such job was understood to be
enough to ensure the well-being of an entire household. Things have changed
tremendously since then.
There are many different types of employment. Not all atypical jobs are pre-
carious: open-ended part-time jobs involving substantial hours and social insur-
ance contributions are one example. But there are also many different kinds of
marginal fixed-term jobs exempt from social insurance contributions and asso-
ciated with low hourly wages in Europe (European Commission, 2010). Therefore,
this Review suggests a precise analysis of the differences between ‘typical’ and
‘atypical’ types of employment.
Before discussing the various forms of atypical employment in the EU Mem-
ber States, one can first take a look at typical work hours, as shown in Table 2.
There is considerable variation within the EU, with weekly work hours ranging
from 38.8 in Denmark to 43.1 in Austria. This means that the number of hours
people typically work is higher than what has been set down in collective bar-
gaining agreements in all EU countries. The differences are rather small in the
Eastern Europe countries, but in the UK and Austria, that ‘extra work’ adds up to
no less than five hours per week.10
10 Table 2 also takes account of the differences in actual work hours between men and women. Only working women have been included, however. The fact that gender differences are quite small in some cases should not obscure the fact that the working hours of men and women with children (not shown here) diverge much more widely.

31
Table 2: Collectively agreed and actual full-time work hours in Europe, 2013
Country Actual full-time work hours
(total population)
Gender differences in actual full-time
work hours
Collectively agreed full-time work
hours France 40.7 2.7 35.6 Denmark 38.8 1.9 37.0 Sweden 40.8 1 37.1 Finland 40 2.8 37.5 Netherlands 40.8 1.7 37.5 Germany 41.7 2 37.7 UK 42.8 3.7 37.7 Belgium 41.7 2.8 37.8 Cyprus 42.5 2.5 38.0 Italy 40.4 3.5 38.0 Czech Republic 41.9 2.1 38.1 EU-28 41.5 2.5 38.1 Spain 41.7 2.3 38.3 Austria 43.1 2.1 38.8 Ireland 40.1 4.4 39.0 Slovakia 41.8 1.7 39.0 Portugal 42.7 2.3 39.3 Croatia 41.1 0.9 40.0 Greece 44.1 3.8 40.0 Hungary 40.7 0.9 40.0 Malta 41.3 3.2 40.0 Romania 40.6 1 40.0 Bulgaria 41.2 0.5 * Estonia 40.8 0.9 * Latvia 40.4 0.8 * Lithuania 39.6 0.8 * Luxembourg 40.8 1.6 * Poland 42.3 3.1 * Slovenia 41.9 1.2 * Sources: Actual full-time work hours: Eurostat-Online 2014, EU Labour Force Survey (EU-LFS). Collectively agreed full-time work hours: European Industrial Relations Observatory (EIRO). * No collective agreements on full-time.
To illustrate the various forms of employment, the entire working-age popu-
lation (15- to 64-year-old) can be divided into ten groups: people in standard
employment, substantial part-time, marginal part-time, fixed-term employment

32
part-time, fixed-term employment, solo self-employment, self-employment,
unemployment, inactivity, and inactivity in education.11
In addition to indicating the 2011 percentages, the trends that have occurred
for each group since 1996 are also shown. As an example, Figure 13 shows the
composition of employment in two countries with very different employment
profiles, Hungary and the Netherlands.12 In 2011, 55% of the working-age popu-
lation in Hungary was employed, of which 42% were in full-time employment
and 13% in various forms of atypical employment. The rest of the population
(45%) was not employed. Of these, 13% were still in education, 25% were inactive,
and 7% were unemployed. Little has changed over the course of the past 15
years: the proportion of ‘inactive’ people has fallen slightly and the proportion
of unemployed people has risen slightly. The situation in the Netherlands is en-
tirely different. There, 75% of the working-age population are in employment, a
much higher rate than in Hungary; however, the proportion of people in full-
time employment (28%) is markedly lower. When we look at the breakdown of
the various types of employment, it is evident that atypical employment is ‘typi-
cal’ in the Netherlands. It is practised by over half of employees. Over the last 15
years, two particularly noteworthy developments have occurred in that country:
the proportion of people in employment has fallen by 6 percentage points and
the proportion of people in ‘small full-time employment’ has increased by 6 per-
centage points. Today there are also fewer ‘inactive’ people in the Netherlands;
however, more people are in precarious employment situations.
11 The results described here are drawn from the study by Allmendinger et al. (2013). The sample included all people who were of working age (between 15 and 64 years) at the time of the survey, excluding those living in collective living quarters (monasteries/ convents, hospitals, etc.) and those doing compulsory military service. A person was considered employed if they were work-ing in the private or public sector, either in a dependent or self-employed capacity, for at least one hour a week, and receiving a salary, wage or other monetary remuneration for that work. Individuals were considered unemployed if they were not employed but actively seeking work and available to the labour market, or if they were entering employment within the following three months. Those who were neither employed nor unemployed were considered economically inactive. Inactive individuals who were in education or training were assigned to the inactive in education or training category. A standard employment relationship exists when an individual is in a dependent employment relationship for at least 35 hours per week and has a permanent em-ployment contract. Marginal part-time employment is employment with fewer than 20 hours per week. Substantial part-time employment is employment with 20 hours and more per week but fewer than 35 hours per week. Fixed-term employment exists when the period during which a contract is valid is limited. We differentiate between fixed-term employment (35 hours and more per week) and fixed-term part-time employment (fewer than 35 hours per week). Self-employment exists when an individual’s main economic activity is not dependent employment. Solo self-employment refers to self-employed individuals without employees. 12 Profiles of the other EU countries can be found in Allmendinger et al., 2013.

33
Figure 13: Forms of employment in Hungary and the Netherlands, 1996-
2011
(in per cent)
Source: Allmendinger et al. (2013), Data Source: EU Labour Force Survey (EU-LFS).
What role does atypical employment play? Are increases in employment
linked to increases in atypical employment? Is atypical employment even re-
placing ‘good’ work? There are no clear patterns. In the Netherlands, Austria,
Germany and Italy, increasing employment rates have been accompanied by an
increase in atypical employment. In the UK, France and the Scandinavian coun-
tries, employment rates are rising without an increase in atypical employment.
Interestingly, Romania has even registered an increase in employment with a
simultaneous decrease in atypical employment. The duration of atypical em-
ployment also varies considerably, as the European research project GUSTO
shows for the Nordic countries. After one year, 24.5% of Finns have moved from
a fixed-term contract to a permanent contract, compared to 49.5% of Norwegians
(Berglund and Furåker, 2010).
As with employment rates, the various types of employment differ system-
atically by age, education and gender. Likewise, the differences between the EU
countries are enormous. Given the limited scope of this Review, only a few
glimpses of this wide-ranging diversity can be provided.
Figure 14 shows types of employment by age. The examples of Finland and
Belgium are instructive. In both countries, the 2011 employment rates in the
middle age category (30 to 49 years) are high at 84% and 82%, respectively. How-
ever, the percentage of ‘inactive’ people in Belgium is more than twice as high as
in Finland (although the last couple of years have seen a significant increase in
all modes of employment). It is also clear that Belgium and Finland have a com-

34
pletely different approach to senior (above 49 years-old) employment. This
points to the importance of national environments.
Figure 14: Forms of employment in Finland and Belgium, by age, 1996-2011
(in per cent)
Source: Allmendinger et al. (2013), Data Source: EU Labour Force Survey (EU-LFS).

35
With regard to education, Figure 15 gives a breakdown of employment for
each of the three qualification levels.13
Figure 15: Forms of employment in Germany and Italy, by education, 1996-
2011
(in per cent)
Source: Allmendinger et al. (2013), Data Source: EU Labour Force Survey (EU-LFS).
13 The ‘low’, ‘medium’ and ‘high’ education groups are based on the UNESCO International Stand-ard Classification of Education (ISCED). The ‘low’ education level covers ISCED groups 1, 2 and 3c, that is, those individuals who left the education system no later than the end of the second phase of basic education and did not participate in any additional formal education beyond this. The ‘medium’ category includes ISCED groups 3 and 4 (excluding 3c) and therefore encompasses all those who completed upper secondary education or an apprenticeship, as well as those who completed a programme in preparation for tertiary education. ‘Highly’ qualified individuals are those in ISCED groups 5 and 6. These are people with a tertiary-level qualification.

36
It shows two countries, Italy and Germany, characterized by entirely differ-
ent patterns. In Germany, the standard employment rate is extremely low
among low-skilled workers (19%). Among people with mid-level and high-level
qualifications, the same rate is almost twice as high, with no great differences
between the two (44% and 52%). Therefore, the German vocational training sys-
tem proves its worth beyond the transition from education to employment. The
gap between the various groups increased between 1996 and 2011. It is thus
clear that in Germany poorly qualified individuals have increasingly become
isolated from the other groups. In Italy, standard employment rates are at a sim-
ilarly low level among individuals of all three qualification levels. Differences
emerge, however, once we look at the types of employment: Atypical employ-
ment, for instance, is much more prevalent among university graduates than
among low-skilled workers. Few differences have emerged between the three
groups over time. Within the group of medium and high-skilled workers, the
proportion of people in solo self-employment has risen markedly, however. This
indicates a certain mismatch between education and employment, which could
almost certainly be improved by a dual apprenticeship system. In conclusion,
well-educated people have significantly better chances of finding and retaining
a job. Their position in the labour market is better than that of the other groups.
Nevertheless, atypical employment for this group has also become a new signifi-
cant feature.
Women are found in atypical employment more often than men. But again,
there are major differences between countries, which illustrates how gender
regimes can be influenced politically. This is evident from Figure 16. In the
Netherlands, 80% of men and 70% of women are in employment (2011). But 44%
of men work full time, compared to only 12% of women. The situation in Finland
is quite different. Here, 72% of men and 68% of women are in employment. The
differences in standard employment rates are similarly small: 47% of men and
40% of women work in permanent full-time jobs. Even if forms of atypical em-
ployment differ between genders—self-employment is more common among
men than among women, whereas women are more frequently engaged in sub-
stantial and marginal part-time employment—Finland does achieve considera-
bly higher levels of gender equality.

37
Figure 16: Forms of employment in the Netherlands and Finland, by gender,
1996-2011
(in per cent)
Source: Allmendinger et al. (2013), Data Source: EU Labour Force Survey (EU-LFS).
Source: Allmendinger et al. (2013), Data Source: EU Labour Force Survey (EU-LFS).

38
2.4 Conclusion
Employment rates have risen in most European countries. But that does not
make the differences between countries any smaller. This is true of both em-
ployment rates and types of employment. In some countries the employment
rate is low but all those in employment have full-time jobs; in other countries
employment rates are high but people are engaged in multiple forms of atypical
employment with potentially limited resources (as will be seen in Chapter 4).
Thus the link between rising employment rates and atypical employment is any-
thing but automatic.
The EU has to open up to this discussion. It keeps formulating objectives that
refer to employment and unemployment rates while still insufficiently address-
ing the various forms of employment. This too easily suggests that any kind of
paid work is better than no paid work at all. Much more than in the past, the EU
has to define qualitative goals for ‘good work’, in line with its previous policy of
"more and better jobs". In this context, what is needed is not just an employment
policy but also a time policy. Which ratio between paid work and unpaid work is
appropriate over a person’s entire life course? How do we reorganise periods of
paid work and unpaid work (parental and/or child care, housework)? How do we
reorganise periods of inactivity? A recent research Review of the European
Commission entitled ‘New skills and jobs in Europe: Pathways towards full em-
ployment’ (2012) already pointed out to these issues as well as to the important
need to address them at European and national levels. The NEUJOB European
research project is full with excellent scientific analyses and sober policy rec-
ommendations on how to try to remedy the employment and unemployment
problems in the EU (Beblavý, et al., 2014).
Social inequality is rising when it comes to accessing employment. Whereas
persons with high-level professional qualifications and a tertiary degree experi-
ence high employment rates, persons with low-level qualifications are increas-
ingly excluded from employment. This finding applies to all forms of employ-
ment. At the same time, both typical and atypical employment relationships are
more common among persons with high-level qualifications; they are by no
means characteristic of persons with low-level qualifications.
Nevertheless, people with low qualifications find it harder and harder to find
stable and quality jobs. The increasing exclusion of persons with low-level quali-
fications is especially alarming because the marriage and partnership market
has changed over time. Assortative mating—that is, marriage between individ-
uals who are similar to each other in terms of their education—is much more

39
prevalent today (Blossfeld, 2009). As a consequence, being in partnership signifi-
cantly increases individual risks instead of reducing them. Entire households
and families are thus either being excluded from employment or benefit from
their access to (dual) employment. Young people with low-level qualifications
hardly have a chance even in countries with a low degree of fertility. The highly
qualified, by contrast, do not experience any disadvantages from educational
expansion. More and more, they are pushing the less qualified out of the labour
market. The permanent exclusion of persons with low-level qualifications cre-
ates individual problems that are also passed on to the next generation, causing
tremendous damage to society in the longer term. This is where strong policy
action is needed, both in preventive ways through education and in compensato-
ry ways through continuing education opportunities in later life. Much more
than in the past, such opportunities must be offered in individualised forms and
supported in equal measure by all social partners.
40
3. Income, Education and Employment
When speaking about social inequalities, income is a major factor to consid-
er. As much as education and employment matter, at the end of the day people
need enough money to live. Income thus constitutes the third axis of social ine-
quality—three axes that need to be analysed independently of each other, de-
spite the fact that they are highly correlated. This chapter focuses on earnings,
in particular the social structuring of people’s earnings by education and gender.
In Chapter 4, the Review will then go on to discuss the distribution of incomes
and wealth, including issues of poverty and deprivation arising from this distri-
bution.
3.1 Education still provides income provided there is education
Education does pay off in all EU countries. The earnings of university gradu-
ates are above those of persons with mid-level qualifications, who in turn most-
ly earn more than persons without a vocational training degree (Figure 17).
Across the EU-27, persons with low-level qualifications earn on average 15% less
than persons with mid-level qualifications. Such income differentials are espe-
cially pronounced in Germany, Slovakia and Austria. This illustrates the down-
sides of the dual vocational training system. Dual training programmes help
people find employment and serve to reinforce the income gap between those
with mid-level and low-level qualifications. In countries as different as Den-
mark, Finland, Sweden, Greece, Cyprus and Lithuania, income differentials be-
tween persons with low and mid-level qualifications are comparatively small.14
Figure 17 also shows that income differentials between persons with high
and mid-level qualifications are much higher than between persons with mid
and low-level qualifications. Across the EU, persons with high levels of educa-
tion earn on average 44% more than persons with mid-level qualifications. Edu-
cational returns are especially high in Portugal, Poland and Cyprus, where per-
sons with high levels of education make more than twice as much income as
persons with mid-level qualifications. Another finding that stands out is that
university-based education and dual vocational training are far from equal, at
least in Germany and Austria. In Germany, persons with a university degree
earn 70% more than persons who completed a vocational training programme;
14 To be precise, labour force participation among persons with mid-level qualifications is high-er than it is among those with low-level qualifications in these countries as well, but if persons with low qualifications do find a job, the conditions are quite similar.

41
in Austria, that figure is 50%. This runs counter to political messages in these
countries claiming that academic and vocational training are of equal worth.
Figure 17: Relative hourly earnings of 25-64-year-old workers, by educa-
tional attainment, 2010
(in percentage points)
Source: Eurostat-Online 2014, Structure of Earnings Survey (SES). Note: Data refer to enterprises with 10 employees or more and to NACE Rev.2 sections B to S excluding O.
An impressive finding emerges for Sweden, Denmark and Finland, where in-
come differentials by educational attainment are extremely small. This presents
a challenge to functionalist and economic theories claiming that a high level of
educational attainment in the population can only be achieved by providing
suitable financial incentives. Denmark is of particular interest for another rea-
son: it runs a vocational training system without excluding the low skilled and
without favouring academic over occupational careers.
All in all, however, one has to agree with the results of the European re-
search projects INEQ and PROFIT: over the last decades, a polarisation of income
by education has been noticed in most EU Member States. This polarisation can
generally be explained by the transition from manufacturing to services in a
knowledge-based economy, in which value is created through innovation—a
fact that does not benefit all groups of society but mostly those with high-level
qualifications. In more recent years, however, income differentials by qualifica-
tion evolved in diverging ways (Figure 18). Germany for instance, between 2006

42
and 2010, saw a widening of the income gap between persons with low qualifica-
tions and those with high qualifications; people with low qualifications lost 11
percentage points compared to persons with mid-level qualifications, whereas
those with high qualifications gained 9 percentage points compared to persons
with mid-level qualifications. However, a completely different picture emerges
for the United Kingdom, for example. There, between 2006 and 2010, the gap
between people with low and mid-level qualifications decreased by 13 percent-
age points while the gap between those with mid-level and high qualifications
even dropped by 21 percentage points.
Figure 18: Changes in returns to education, 2006 and 2010
(in percentage points)
Source: Eurostat-Online 2014, Structure of Earnings Survey (SES). Note: Data refer to enterprises with 10 or more employees and to NACE Rev.2 sections B to S excluding O.
How can these divergent developments across the EU-27 countries be ex-
plained? A first approach is to ask: do people’s incomes depend on their compe-
tences, rather than on their degrees, in some countries? Have degrees lost their
power in matching people to jobs? A second approach would try to assess wheth-
er educational returns depend on the overall level of educational attainment in a
given society. In other words, do returns to education decrease, especially for
people with a university degree, when many people have a tertiary-level educa-
tion?
Is the age of degrees over? Are people’s earnings driven much more by their cogni-
tive competences rather than by their certificates or diplomas?

43
The information on the level and distribution of competences available for
some of the EU-27 countries (OECD, 2013a) can be systematically connected to
their earnings. In Figure 19, the horizontal line represents the income of per-
sons with a medium level of competence (defined by the PIAAC consortium as
skill level 2). The earnings of persons with very low competences (level 1) and
those of persons with higher (level 3) and very high competences (levels 4 and 5)
are then projected in relation to the horizontal line.
Figure 19: Relative hourly earnings, by PIAAC literacy competences, 2011
(in percentage points)
Source: OECD, PIAAC 2012 Database.
A clear structure emerges for all countries covered by PIAAC: earnings and
competences are closely connected. The extent of that connection, however, var-
ies widely between countries. In the UK and Poland, the earnings of persons with
very high competences (levels 4 and 5) are 65 % higher than those with medium
skills (level 2). In Sweden, Denmark, Belgium and Finland, the difference is only
about 20%. At the lowest skill levels, people with low competences in Germany
earn 19% less than persons who scored at skill level 2; in Finland, by contrast,
they only make 9% less.
If we compare formal educational certificates and competences and their re-
lationships with earnings, a largely coherent picture emerges. In Sweden, Den-
mark, Belgium and Finland, income differentials by education are small, regard-
less of whether we look at formal degrees or competences. Likewise, income
differentials by education (whether degrees or actual competences) are relative-
ly large in the UK, Poland and Germany. Only one country, Spain, does not fit

44
this pattern. There, income is strongly driven by competences and not by de-
grees. It can thus be concluded that degrees have not lost their value; they con-
tinue to serve as an important valid signal for employers. Nevertheless, it
emerges from these data that degrees and competences do not correspond to
each other, especially at higher levels. Degrees are not a ‘proxy’ for competences.
That is why future research has to work with both measures in order to under-
stand the selection processes of education into employment.
Does education lose its value if many people are well educated?
It is often argued that returns to education are particularly high if there are
only few highly educated people. In economic terms, too much education would
affect returns to education negatively since a good possessed by only a few is a
valuable asset in the labour market. Accordingly, the returns to education
should be low in countries with a high percentage of university-educated indi-
viduals. Is this hypothesis confirmed empirically? Figure 20 illustrates the rela-
tionship between returns to education and the percentage of university gradu-
ates. Cyprus, Luxemburg and the UK, even though they have a high percentage of
university graduates, still witness very high returns to education. Likewise, re-
turns to education in Malta, Austria and Italy are not particularly high, the small
percentage of university graduates in these countries notwithstanding. Sweden,
Denmark, Finland and Belgium do match the predicted outcome: these countries
have a high percentage of university graduates but extraordinarily small re-
turns to education. Portugal and Romania have few university graduates reaping
high returns to their education. Despite these differences, however, there is no
reason to fear that getting a university degree will no longer pay off if many
people are highly educated. Similar conclusions emerge when competences are
considered. Again, one might expect the returns to competences to be particu-
larly high if the number of people with high-level competences is small. But this
is not the case. In Belgium, for example, 12.4% of the population scored at skill
levels 4 and 5 in the PIAAC study, and their return to competence is 21%. In the
UK, the share of highly skilled individuals is 13.1%; their return to competence
is about 66%. It can be concluded that the institutional context counts more than
the share of graduates in explaining how much education pays off.
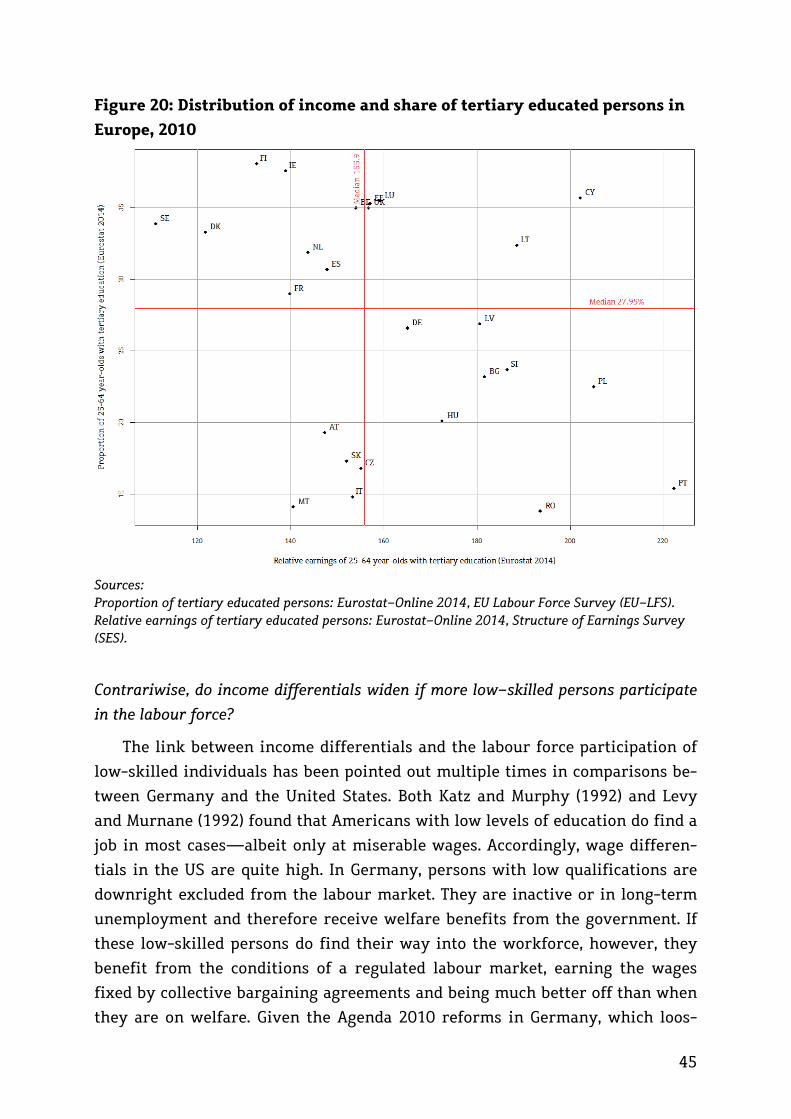
45
Figure 20: Distribution of income and share of tertiary educated persons in
Europe, 2010
Sources: Proportion of tertiary educated persons: Eurostat-Online 2014, EU Labour Force Survey (EU-LFS). Relative earnings of tertiary educated persons: Eurostat-Online 2014, Structure of Earnings Survey (SES).
Contrariwise, do income differentials widen if more low-skilled persons participate
in the labour force?
The link between income differentials and the labour force participation of
low-skilled individuals has been pointed out multiple times in comparisons be-
tween Germany and the United States. Both Katz and Murphy (1992) and Levy
and Murnane (1992) found that Americans with low levels of education do find a
job in most cases—albeit only at miserable wages. Accordingly, wage differen-
tials in the US are quite high. In Germany, persons with low qualifications are
downright excluded from the labour market. They are inactive or in long-term
unemployment and therefore receive welfare benefits from the government. If
these low-skilled persons do find their way into the workforce, however, they
benefit from the conditions of a regulated labour market, earning the wages
fixed by collective bargaining agreements and being much better off than when
they are on welfare. Given the Agenda 2010 reforms in Germany, which loos-

46
ened labour market regulations and therefore the guarantee for decent pay, one
may wonder whether this is still the case. Moreover, can these results be trans-
ferred to the EU-27? Analyses show that the sharp increase of income differen-
tials in some EU-27 countries, notably Germany, is not linked to rising labour
market participation among the low-skilled population. On the contrary, their
employment rates have declined over time, reinforcing exclusion. In conclusion,
it is not the labour market participation of low-skilled individuals that shapes
the extent of social inequality. It seems that in some countries, the low skilled
are excluded from work and supported by the government while people with
medium skills take their low-wage jobs, thus increasing social declassification.
3.2 Income and gender: the need to change family life and in-come distribution
Today, there are fewer women than men with low-level educational degrees
and competences. Likewise, more women than men have a high-level education
and high-level competences in many of the EU-27 countries. Another important
improvement is that more and more women now translate their education into
employment. And yet the labour force participation of women is lower than that
of men in all EU-27 Member States (see Chapter 2, Figure 12). Likewise, as shown
earlier, there are vast differences in the types of employment that men and
women engage in (see Chapter 2, Figure 16). Besides, in all EU countries, women
are more likely than men to interrupt their careers (periods of so-called ‘inac-
tivity’) and work in atypical forms of employment (especially part-time work
and fixed-term contracts). What is also clear is that women retire earlier than
men, thereby further reducing their total time of employment, with profoundly
negative effects on their lifetime earnings and the size of their retirement pen-
sions.
The mean gender hourly wage gap in the EU is 16% (Figure 21). At the begin-
ning of people’s working lives, earnings differences between men and women
are rather small but then keep growing over time. In Germany and Finland, for
example, the gender wage gap at the age of 25–29 is 4%; at the age of 40–44 it is
22%; and at 55–59 years it is 31% (OECD, 2013b: 145). Moreover, the gender wage
gap is particularly wide in the upper income brackets, meaning that women in
leadership positions earn significantly lower hourly wages than men in the
same leadership positions.

47
Figure 21: Gender pay gap in unadjusted form, 2012
(in per cent)
Source: Eurostat-Online 2014, Structure of Earnings Survey (SES). Note: Data refer to enterprises with 10 or more employees and to NACE Rev.2 sections B to S excluding O. * Greece refers to 2010 data
How can the wage gap be explained?
Researchers have identified a whole array of causes. There are many occupa-
tions that are primarily performed by men; others are primarily performed by
women (horizontal segregation). In particular, women are highly overrepresent-
ed in the public sector. Typical female occupations are characterised by low en-
try salaries in most cases, but more importantly, salary progression in these
occupations is flatter than that in ‘typical’ male occupations (OECD, 2013b: 132;
Flabbi and Tejada, 2012). Whereas the right to ‘equal pay for equal work’ has
been firmly established in most countries, the principle of ‘equal pay for compa-
rable work’ is not yet put into practice although this principle has been stated in
the European treaties for decades (Treaty of Amsterdam 1997; see CJCE case De-
frenne II, 1976). What is more, all EU-28 countries have significantly more men
than women in leadership positions (vertical segregation), where income differ-
entials are particularly high. One of the reasons for this is that interruptions in
employment and a reduction of working hours are severely punished in finan-
cial terms (accordingly, the gender wage gap is smaller if we only look at full-
time workers, OECD, 2013b: 143). Interruptions in employment cause women’s
careers to stall: once they are working part time, they are no longer offered

48
leadership positions nor wages comparable to those of men (Breen and Cooke,
2005).
However, the gender wage gap cannot be fully explained by pointing to em-
ployment careers, occupational characteristics, work hours or education. Some
unexplained variance remains. The scope of this ‘variance’ varies widely be-
tween the EU-28 countries (OECD, 2013b: Table 13.5; Arulampalam et al., 2007)
and can be explained in part by country-specific differences in family policy,
labour policy and taxation. For instance, the wage gap decreases along with the
percentage of children who attend formal caregiving institutions (R2=0.56; OECD,
2013b: 147). Conversely, the wage gap increases along with the number of weeks
of paid parental leave (R2=0.604; OECD, 2013b: 148). Likewise, countries with
unregulated labour markets are characterized by significantly higher wage dif-
ferentials than countries with regulated labour markets.
Employment careers also determine people’s material situation in retire-
ment, as most pensions are based on employment duration and average earn-
ings. The gender wage gap thus turns into a gender pension gap—a gap that
persists for many years: on average, women at the age of 60 can expect to live
for another 22.5 years, compared to 18.5 years for men who have reached the
same age (OECD, 2011: 29). In a comprehensive study conducted on behalf of the
European Commission, Francesca Bettio, Platon Tinios and Gianni Betti (2013)
have looked at the gender pension gap in detail.15 The picture that emerges is a
dark one. From the wealth of the authors’ findings, one can highlight three key
results: the gender pension gap, the concentration of women in the low-pension
segment and the evolution of the gender pension gap over time.16
Across the EU-27, the average gender pension gap is 39%. The gap is espe-
cially wide in Luxemburg (47%), Germany (44%) and the UK (43%); it is extraordi-
narily small in Eastern European countries such as Estonia (4%), Slovakia (8%)
and Latvia (9%). If we calculate the pension gap without taking widowed women
into account (thereby excluding widow’s pensions), the average EU-27 gender
pension gap increases from 39% to 53%.
15 Bettio et al. (2013) refer to the EU-SILC data while also using the SHARE data for validation purposes. 16 It is important to point out that the EU-SILC data do not allow for providing separate infor-mation for people’s own old-age pensions (i.e. pensions earned through their own employment) and widow’s pensions (i.e. pensions earned as a result of marriage). Furthermore, statutory pen-sions and employer-sponsored pensions are lumped together in EU-SILC. Private pensions are shown separately, but their share is very small in most countries. The SHARE data illustrate that

49
Figure 22 shows both the gender pension gap (above the horizontal axis) and
the gender pay gap (below the horizontal axis). Even if we include widow’s pen-
sions, the gender pension gap is significantly larger than the gender pay gap and
the gap in mean annual gross earnings, as supplied by Eurostat. Two groups of
countries can be clearly distinguished. Estonia, Slovakia, Latvia, the Czech Re-
public and Denmark are characterized by a small pension gap despite a large pay
gap.
Figure 22: Gender gap in pensions and gender pay gap, pensioners over 65
years, 2010
(in per cent)
Source: EU-SILC, Bettio et al (2013): The gender gap in pensions in the EU. P. 37 (here Figure 1.5).
In these countries, we find pension systems that include some kind of age
pension. In the second group of countries, gender pension gaps are much wider
than gender pay gaps. These are the countries in which the pension system fol-
lows the social insurance principle and thus reproduces or even intensifies the
labour market situation. In addition to the relation between male and female
pensions, the size of people’s pensions is also very important. If we sort men
according to the size of their pension benefits, we can form three groups: one-
third of men receive the lowest pensions, another third the highest pensions;
the rest is somewhere in the middle. Now how many women do we find in the
lower third of the distribution scale defined above? Across the EU-27, an average
the distribution of employer-sponsored pensions between men and women is especially unequal, significantly increasing the gender pension gap.
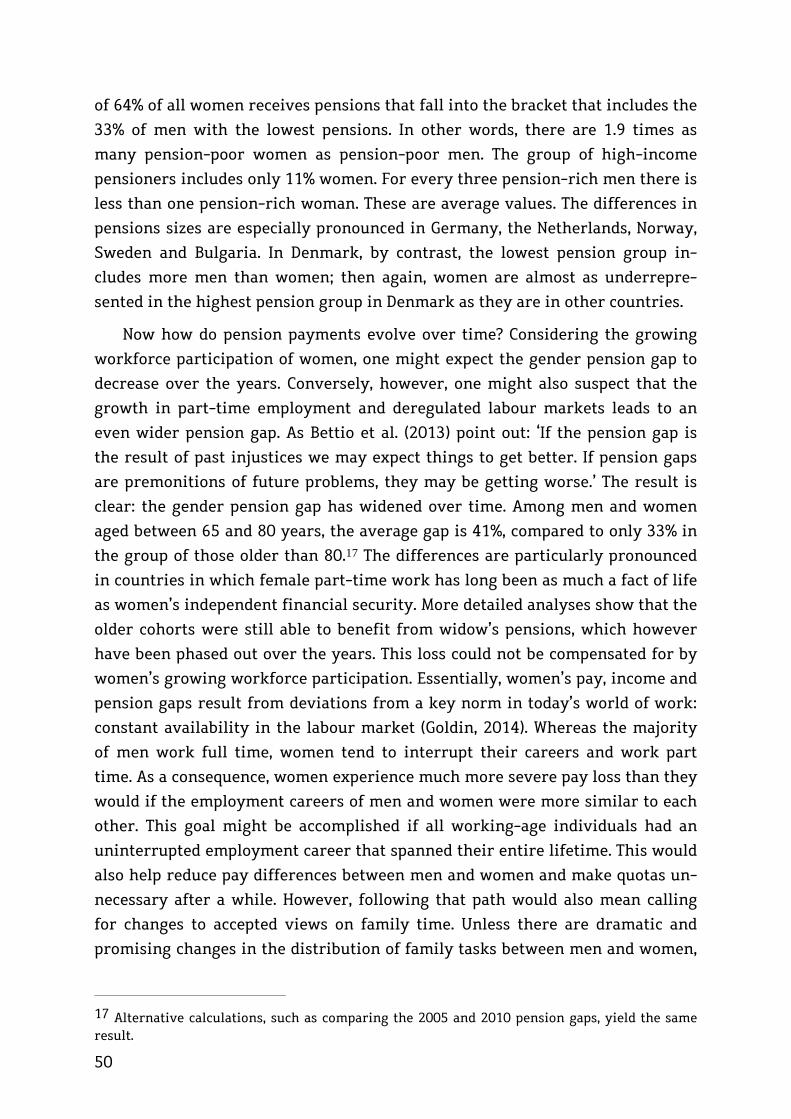
50
of 64% of all women receives pensions that fall into the bracket that includes the
33% of men with the lowest pensions. In other words, there are 1.9 times as
many pension-poor women as pension-poor men. The group of high-income
pensioners includes only 11% women. For every three pension-rich men there is
less than one pension-rich woman. These are average values. The differences in
pensions sizes are especially pronounced in Germany, the Netherlands, Norway,
Sweden and Bulgaria. In Denmark, by contrast, the lowest pension group in-
cludes more men than women; then again, women are almost as underrepre-
sented in the highest pension group in Denmark as they are in other countries.
Now how do pension payments evolve over time? Considering the growing
workforce participation of women, one might expect the gender pension gap to
decrease over the years. Conversely, however, one might also suspect that the
growth in part-time employment and deregulated labour markets leads to an
even wider pension gap. As Bettio et al. (2013) point out: ‘If the pension gap is
the result of past injustices we may expect things to get better. If pension gaps
are premonitions of future problems, they may be getting worse.’ The result is
clear: the gender pension gap has widened over time. Among men and women
aged between 65 and 80 years, the average gap is 41%, compared to only 33% in
the group of those older than 80.17 The differences are particularly pronounced
in countries in which female part-time work has long been as much a fact of life
as women’s independent financial security. More detailed analyses show that the
older cohorts were still able to benefit from widow’s pensions, which however
have been phased out over the years. This loss could not be compensated for by
women’s growing workforce participation. Essentially, women’s pay, income and
pension gaps result from deviations from a key norm in today’s world of work:
constant availability in the labour market (Goldin, 2014). Whereas the majority
of men work full time, women tend to interrupt their careers and work part
time. As a consequence, women experience much more severe pay loss than they
would if the employment careers of men and women were more similar to each
other. This goal might be accomplished if all working-age individuals had an
uninterrupted employment career that spanned their entire lifetime. This would
also help reduce pay differences between men and women and make quotas un-
necessary after a while. However, following that path would also mean calling
for changes to accepted views on family time. Unless there are dramatic and
promising changes in the distribution of family tasks between men and women,
17 Alternative calculations, such as comparing the 2005 and 2010 pension gaps, yield the same result.
51
this Review suggests taking a different path towards more gender equity in
terms of earnings, namely a policy of reducing the gainful employment of men
in order to redistribute paid and unpaid work between men and women.
3.3 Conclusion
Education is the primary gateway to (good) jobs and a good income. Low-
skilled individuals face increasingly tougher times. At this point, the Scandina-
vian countries are the only ones to successfully provide opportunities for low-
skilled workers to enter the workforce while at the same time offering wages
high enough to make a decent living. The growing marginalisation of the educa-
tionally deprived will also become clear in the following Chapter, which will
look at the links between education, the low-wage sector and the working poor.
But before getting there, it should be emphasized again that any talk about edu-
cational attainment levels in Europe having reached a saturation point with
regard to secondary level II and tertiary education completely misses the point.
Quite the contrary, the EU has to do everything it can to eliminate one of the key
sources of social inequality by further reducing the number of persons without
sufficient education and training.
Another important challenge for the EU is the gender wage and income gap.
The EU, in principle, pursues the same values and increasingly demands that
women join the workforce and get their own social security benefits. However,
women still run a disproportionate risk of working in the low-wage sector and
have to cope with insufficient pensions in old age. Public policies to help parents
balance work and family responsibilities, such as parental leave payments or
part-time work, must be designed in a way that men also become the primary
beneficiaries of these policies. But this requires sea changes in social behaviours
across Europe. Therefore, a policy of reducing the gainful employment of men in
order to redistribute paid and unpaid work between men and women is also
needed.

52
4. Financial Inequalities
So far the Review has discussed educational attainment, employment and in-
come in a life course perspective. It now turns from the individual to the societal
level. The focus of this Chapter is on financial inequalities, i.e. on the extent to
which incomes and wealth are distributed unevenly across and within the EU
Member States. This is an area where most governments in Europe and else-
where have been reluctant to intervene, although they have in their tool box
traditional powerful instruments such as taxation. Policymakers have avoided
setting limits to high and very high earning and wealth accumulation. As sever-
al European research projects such as EQUALSOC, IMPROVE and COPE have
demonstrated, they have rather focused, with more or less capacity and efficien-
cy, on reforming their Welfare State in order to maximise the impact of social
and financial transfers to those in need, as well as fighting the increase in pov-
erty and social exclusion, especially for targeted vulnerable groups. At the Euro-
pean level for instance, a key initiative of the European Commission, within the
Europe 2020 agenda, has been the "Platform against poverty and social exclu-
sion" (European Commission, 2010). More recently, the European Commission
adopted what is known as the "Social Investment Package" which tries to con-
vince member states to modernise their Welfare state through a better targeting
of social and financial transfers to populations in need and new operating policy
modes which attempt to "activate" people in order to keep them away from so-
cial exclusion (European Commission, 2013). Finally, it has continued to use the
European Social Fund and more recently the EU Programme for Employment and
Social Innovation in order to promote a high level of quality and sustainable
employment, guarantee adequate and decent social protection, combat social
exclusion and poverty and improve working conditions.
Before turning to the efficiency of policies, one has to ask: What is the real
extent of financial inequalities? In Europe and elsewhere, there is currently
much controversy about financial inequalities. Before assessing the consequenc-
es of such inequalities, it is crucially important to ascertain the facts as the Eu-
ropean research GINI projects, in particular, has done with an unprecedented
wealth of details (Salverda, 2014).
This Chapter begins by looking at mean annual earnings and median wealth
across the EU. Although these measures provide an idea of the average standard
of living, they do not speak of the distribution of resources. We therefore turn to
relative measurements relating to each country’s national context, such as the

53
Gini coefficient or the proportion of income and wealth in the top decile of the
income distribution. Since relative measures do not say anything about the
standards of living, we need to connect information on the standard of living to
measures of inequality. As will be seen, there are countries with low inequality,
but people there can also be very poor; likewise, some countries may raise the
average standard of living and yet may become more unequal in social terms.
When looking at the development of financial inequality, therefore, one needs to
pay equal attention to the level and to the distribution of income and wealth.
The Review proceeds with looking at the bottom of the income and wealth
distribution, referring to poverty, deprivation, low wage earners and the work-
ing poor in order to explain the state of inequalities in Europe before offering a
short conclusion.
4.1 The large variety of gross and net incomes in EU countries
Giving a precise account of income is a challenge in itself. Often there is a
significant difference between gross income and disposable income. Most stud-
ies refer to net incomes, which take account of the various redistribution mech-
anisms in each country’s taxes and welfare system, as well as transfer payments,
such as child, sickness, nursing care and unemployment benefits. The effects of
indirect taxes and in-kind transfer payments, however, are not considered in
this approach. Furthermore, we need to distinguish between an individual per-
son’s income and the household income. Someone with a low individual income
may still enjoy a relatively high standard of living if other members of the
household are well off financially. As will be seen, statistics on workers earning
low wages and the working poor follow two very distinct concepts.
The mean annual gross income in all EU-27 countries is 31,000 euros. Based
on the available income statistics, the differences between the countries are
immense. In Denmark the mean annual gross income is 55,000 euros, compared
to 5,000 euros in Bulgaria (Figure 23). However, given that the size and scope of
the shadow economy is particularly pronounced in countries with a low gross
domestic product, drawing conclusions about the standard of living based on
income is not always reliable.

54
Figure 23: Mean annual gross earnings, 2010
(in thousands)
Source: Eurostat-Online 2014, Structure of Earnings Survey (SES). Note: Data refer to enterprises with 10 or more employees and to NACE Rev.2 sections B to S excluding O.
Do these differences become smaller if we look at annual net earnings—that
is, the income that people actually have available to buy goods and services?
Making general statements in this regard is not possible. Net earnings always
refer to the respective household situation. To illustrate this variety, let’s con-
sider two married couples, with both partners in the workforce and earning the
mean annual income of men and women. In the first case, the couple has no
children (Figure 24a); in the second case, the couple has two children (Figure
24b). It is clear that the range of net earnings in the EU-27 is about as large as
the range of gross earnings. Despite (or because of) the widely varying taxes and
transfer systems, there is no convergence of incomes in Europe. Among married
couples without children, taxes and social security contributions range from
17.5% in Malta to as much as 42.8% in Belgium. Taxes and contributions for cou-
ples with children are lower, ranging from 12.8% in Ireland to 37.3% in Belgium.
There is only minor correlation between the level of gross earnings and the rate
of taxes and contributions.
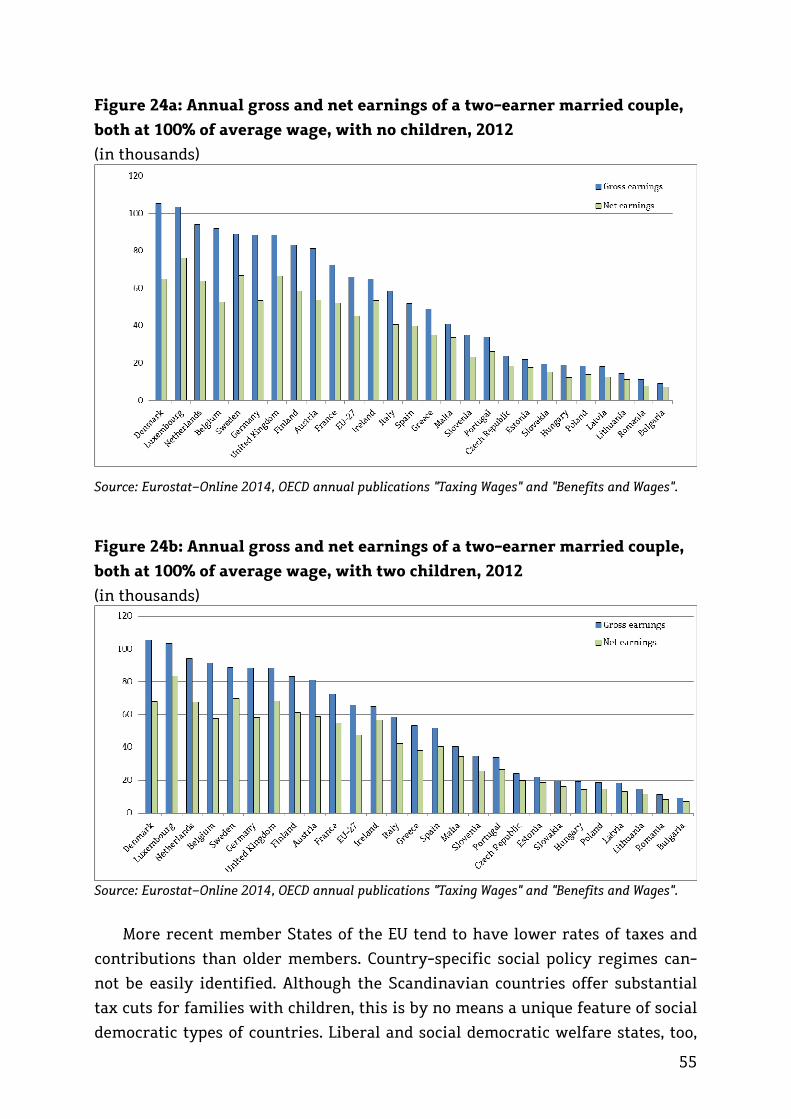
55
Figure 24a: Annual gross and net earnings of a two-earner married couple,
both at 100% of average wage, with no children, 2012
(in thousands)
Source: Eurostat-Online 2014, OECD annual publications "Taxing Wages" and "Benefits and Wages".
Figure 24b: Annual gross and net earnings of a two-earner married couple,
both at 100% of average wage, with two children, 2012
(in thousands)
Source: Eurostat-Online 2014, OECD annual publications "Taxing Wages" and "Benefits and Wages".
More recent member States of the EU tend to have lower rates of taxes and
contributions than older members. Country-specific social policy regimes can-
not be easily identified. Although the Scandinavian countries offer substantial
tax cuts for families with children, this is by no means a unique feature of social
democratic types of countries. Liberal and social democratic welfare states, too,

56
offer significant benefits for couples with children. The United Kingdom, for
example, ranks at 7 when comparing the EU-27 with regard to gross earnings
but comes out at 3 with regard to the net earnings of couples with two children.
For couples with children, incentives and disincentives for both spouses to
work are as important as benefits. Do couples in which one partner earns the
average wage while the other earns ‘only’ one-third of the average wage (e.g.
due to part-time employment) receive disproportionally high tax cuts or not?
Disproportionally high tax cuts for such couples can be observed in countries
like Germany and Belgium, which first pool the earnings of both spouses and
then split them. For example, if a husband earns 3,000 euros but his wife only
earns 1,000 euros, they are both taxed for an income of 2,000 euros each. The
man saves taxes; the woman pays higher taxes. Together, however, they pay
fewer taxes than they would pay if each of their incomes were taxed separate-
ly—thanks to progressive taxation. In most Scandinavian countries, but else-
where as well (e.g. Spain), this pooling and splitting of taxes is unknown. Tax
‘incentives’ such as those in Germany and Belgium weaken the position of wom-
en and, as will be shown, put their independent social security entitlements at
risk.
4.2 The challenge of rising income inequality
Income distribution is commonly calculated based on disposable income and
its distribution within each of the EU-27 countries. The disposable income in-
cludes income from work and wealth as well as monetary transfers. To measure
its distribution, and thus the range of inequalities, the Gini coefficient is com-
monly used. It ranges from 0 to 1, with 1 corresponding to an extremely high
level of income inequality and 0 corresponding to an equal distribution of in-
come (Atkinson, 1970). For the year 2010, Figure 25 shows that the income di-
vide in disposable income (blue dots) is higher in the UK, in Southern European
countries (Portugal, Greece) and in Eastern European countries such as Latvia,
Romania, Lithuania, Bulgaria and Poland (scores between 0.34 and 0.36). It is
lower in the Nordic countries (Sweden, Denmark and Finland), in some continen-
tal countries such as Belgium, France, Luxembourg and Austria, as well as in
Slovakia, the Czech Republic, Slovenia and Ireland (scores between 0.22 and
0.25). The distribution of disposable income can also be compared with the dis-
tribution of gross income (Figure 25, red squares). The difference between the
two distributions gives the redistributive effect of taxes and benefits (Boadway
and Keen, 2000). It can be observed that tax-benefit systems play an important
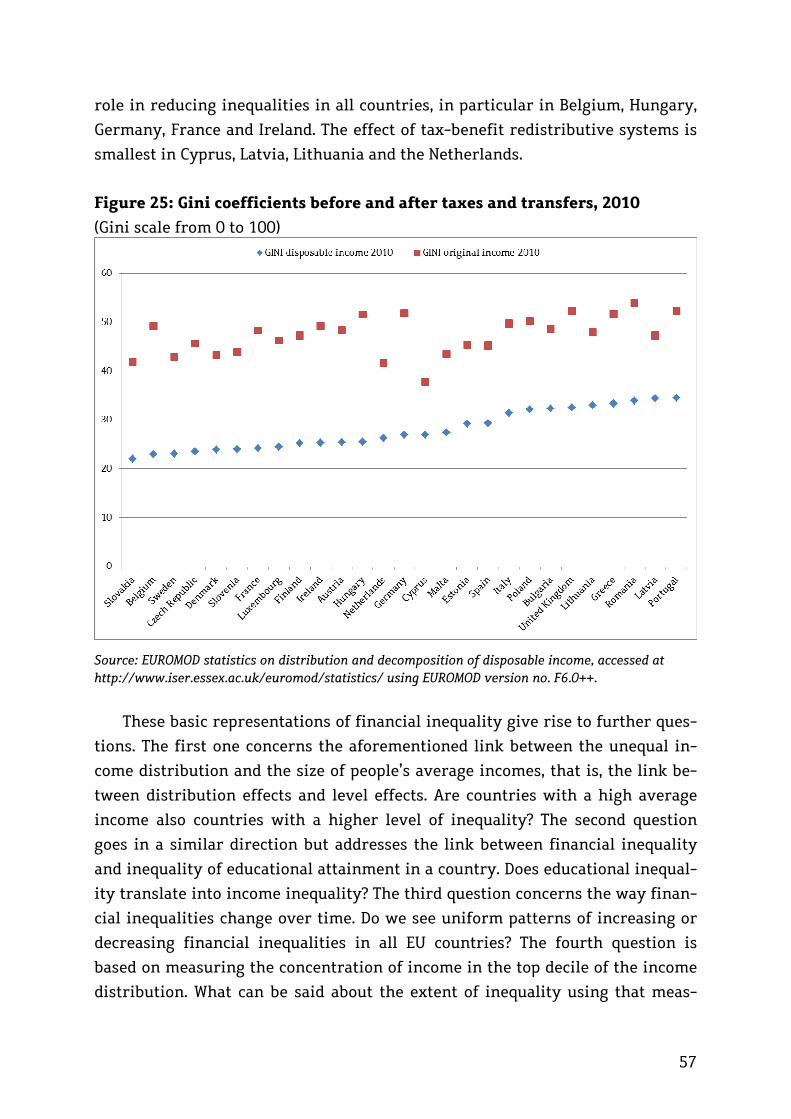
57
role in reducing inequalities in all countries, in particular in Belgium, Hungary,
Germany, France and Ireland. The effect of tax-benefit redistributive systems is
smallest in Cyprus, Latvia, Lithuania and the Netherlands.
Figure 25: Gini coefficients before and after taxes and transfers, 2010
(Gini scale from 0 to 100)
Source: EUROMOD statistics on distribution and decomposition of disposable income, accessed at http://www.iser.essex.ac.uk/euromod/statistics/ using EUROMOD version no. F6.0++.
These basic representations of financial inequality give rise to further ques-
tions. The first one concerns the aforementioned link between the unequal in-
come distribution and the size of people’s average incomes, that is, the link be-
tween distribution effects and level effects. Are countries with a high average
income also countries with a higher level of inequality? The second question
goes in a similar direction but addresses the link between financial inequality
and inequality of educational attainment in a country. Does educational inequal-
ity translate into income inequality? The third question concerns the way finan-
cial inequalities change over time. Do we see uniform patterns of increasing or
decreasing financial inequalities in all EU countries? The fourth question is
based on measuring the concentration of income in the top decile of the income
distribution. What can be said about the extent of inequality using that meas-
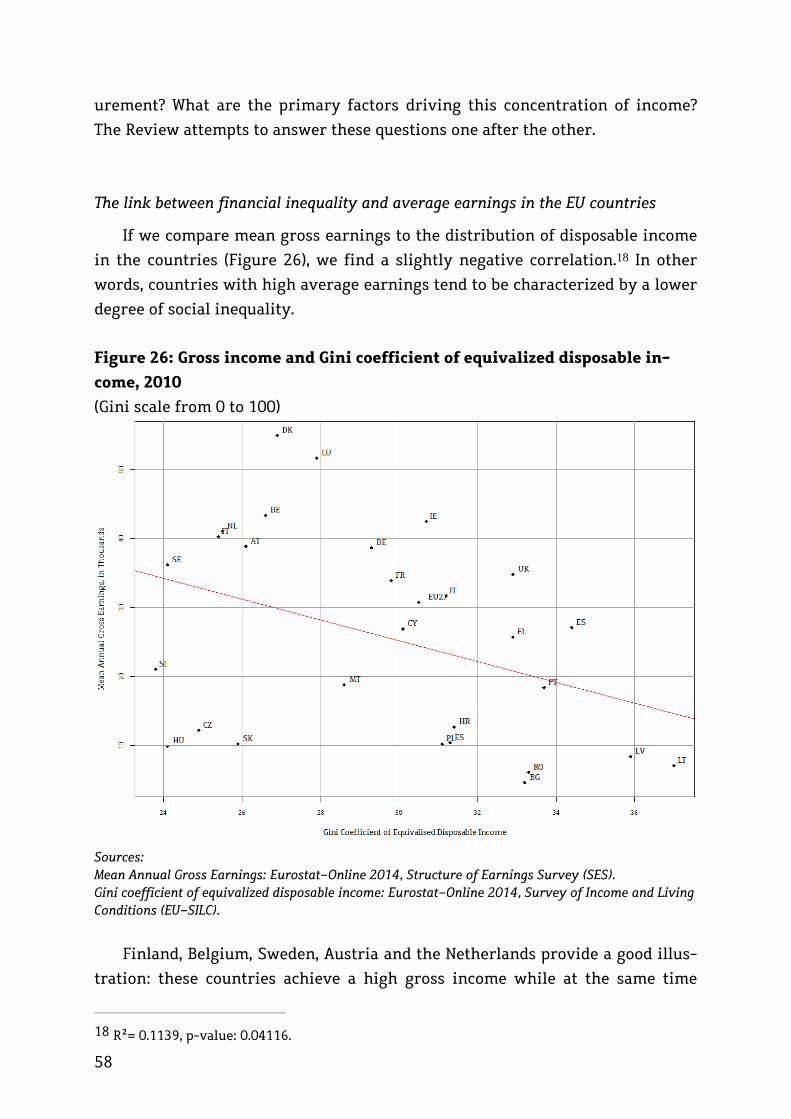
58
urement? What are the primary factors driving this concentration of income?
The Review attempts to answer these questions one after the other.
The link between financial inequality and average earnings in the EU countries
If we compare mean gross earnings to the distribution of disposable income
in the countries (Figure 26), we find a slightly negative correlation.18 In other
words, countries with high average earnings tend to be characterized by a lower
degree of social inequality.
Figure 26: Gross income and Gini coefficient of equivalized disposable in-
come, 2010
(Gini scale from 0 to 100)
Sources: Mean Annual Gross Earnings: Eurostat-Online 2014, Structure of Earnings Survey (SES). Gini coefficient of equivalized disposable income: Eurostat-Online 2014, Survey of Income and Living Conditions (EU-SILC).
Finland, Belgium, Sweden, Austria and the Netherlands provide a good illus-
tration: these countries achieve a high gross income while at the same time
18 R2= 0.1139, p-value: 0.04116.
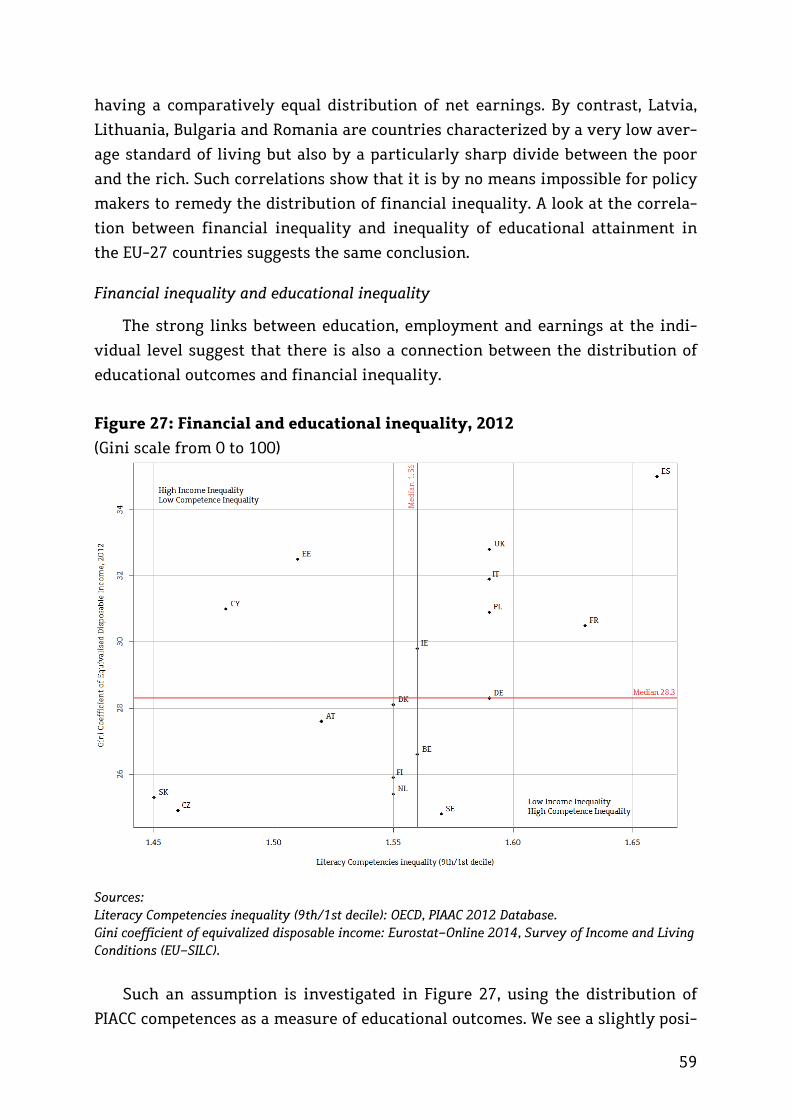
59
having a comparatively equal distribution of net earnings. By contrast, Latvia,
Lithuania, Bulgaria and Romania are countries characterized by a very low aver-
age standard of living but also by a particularly sharp divide between the poor
and the rich. Such correlations show that it is by no means impossible for policy
makers to remedy the distribution of financial inequality. A look at the correla-
tion between financial inequality and inequality of educational attainment in
the EU-27 countries suggests the same conclusion.
Financial inequality and educational inequality
The strong links between education, employment and earnings at the indi-
vidual level suggest that there is also a connection between the distribution of
educational outcomes and financial inequality.
Figure 27: Financial and educational inequality, 2012
(Gini scale from 0 to 100)
Sources: Literacy Competencies inequality (9th/1st decile): OECD, PIAAC 2012 Database. Gini coefficient of equivalized disposable income: Eurostat-Online 2014, Survey of Income and Living Conditions (EU-SILC).
Such an assumption is investigated in Figure 27, using the distribution of
PIACC competences as a measure of educational outcomes. We see a slightly posi-
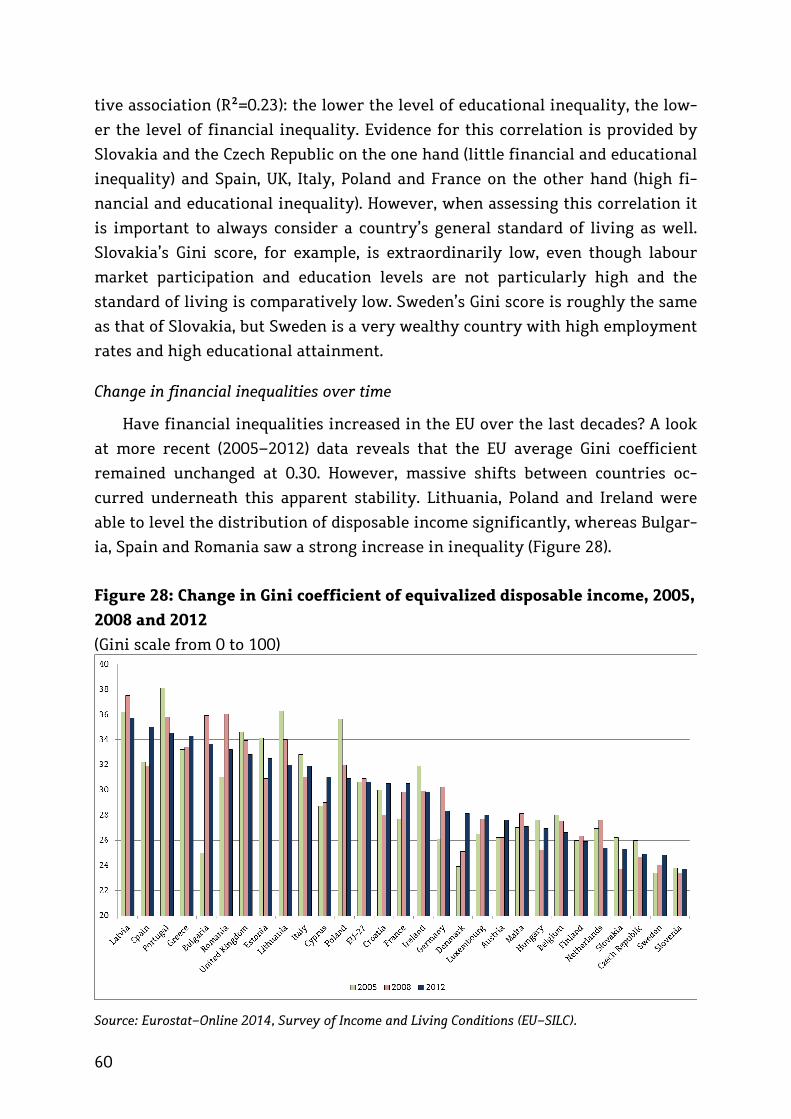
60
tive association (R2=0.23): the lower the level of educational inequality, the low-
er the level of financial inequality. Evidence for this correlation is provided by
Slovakia and the Czech Republic on the one hand (little financial and educational
inequality) and Spain, UK, Italy, Poland and France on the other hand (high fi-
nancial and educational inequality). However, when assessing this correlation it
is important to always consider a country’s general standard of living as well.
Slovakia’s Gini score, for example, is extraordinarily low, even though labour
market participation and education levels are not particularly high and the
standard of living is comparatively low. Sweden’s Gini score is roughly the same
as that of Slovakia, but Sweden is a very wealthy country with high employment
rates and high educational attainment.
Change in financial inequalities over time
Have financial inequalities increased in the EU over the last decades? A look
at more recent (2005–2012) data reveals that the EU average Gini coefficient
remained unchanged at 0.30. However, massive shifts between countries oc-
curred underneath this apparent stability. Lithuania, Poland and Ireland were
able to level the distribution of disposable income significantly, whereas Bulgar-
ia, Spain and Romania saw a strong increase in inequality (Figure 28).
Figure 28: Change in Gini coefficient of equivalized disposable income, 2005,
2008 and 2012
(Gini scale from 0 to 100)
Source: Eurostat-Online 2014, Survey of Income and Living Conditions (EU-SILC).

61
This may only be attributed in part to the economic and financial crisis: in-
deed, an increase in earnings inequality can also be witnessed in countries that
weathered the crisis relatively well, such as Germany, Denmark, Luxemburg and
Sweden. Likewise, there is no evidence to support the assumption that it is espe-
cially countries with a low 2005 Gini coefficient that have become more unequal
over the years. Finland, the Czech Republic and Slovenia could keep their Gini
scores at a low level, whereas Denmark, Bulgaria and Germany have in part seen
a pronounced increase in inequality. Comparative research has shown that there
are several reasons for these developments: changes in the underlying size of
people’s earnings, changes in the general welfare state set-up and changes in
collective bargaining agreements. Countries with a high degree of unionisation
are characterised by low wage differentials; rising inequality, therefore, as it is
more and more suggested, may also point to a decline in collective bargaining
commitment (OECD, 2001: 149; OECD, 2013).
The concentration of money at the top: Decile income shares
Decile income shares, namely the concentration of income among the top
decile of the population with the highest income constitute an alternative indi-
cator to measure income inequality. Based on administrative data (income tax
data), Thomas Piketty and his team of international economists compiled the
World Top Incomes Database (WTID), which allows researchers to study the evolu-
tion of incomes and wealth over a long period of time for many countries (Piket-
ty, 2014).
Figure 29: Top decile income shares, 1910–2010
Source: Piketty and Saez (2013): Top Incomes and the Great Recession: Recent Evolutions and Policy Implications (World Top Incomes Database).

62
One of the most important findings of the WTID is ‘the pronounced U-shaped
evolution of top income shares in the US over the past century. The share of
total market income going to the top decile was as large as 50% at the eve of the
1929 Great Depression, fell sharply during the 1930s and during World War 2,
and stabilized below 35% between the 1940s and the 1970s. It then rose gradual-
ly since the late 1970s–early 1980s, and is now close to 50% once again.’ (Piketty
and Saez, 2013: 2). This development shows that over the past thirty years, more
than 15% of the US national income was shifted from the bottom 90% to the top
10%. The top 1 per cent almost exclusively absorbed nearly 60% of aggregate US
income growth between 1976 and 2007.
Figure 29 also shows that even though economic and monetary crises led to
minor declines in income concentration, it never took very long for that concen-
tration to rebound to its previous high level. However, it is striking to observe
that in contrast to the 1930s, when governments responded to income inequali-
ty with massive tax increases (in the US, the marginal tax rate increased from
24% in 1929 to 63% in 1932 and reached its peak in 1945 with 94%), today’s US
policy makers have chosen not to counter imbalances with similar political cor-
rectives.
Can these trends be shown for Europe as well? In part. A less pronounced U-
shaped curve emerges for the UK; in Germany, that trend is even weaker. In
France, income concentration fell from 47% to 29% between the late 1930s and
the early 1940s, whereas the 1960s saw it rebound to 37%, a rate higher than
that in the US during those years. Between 1960 and 1980, income concentration
declined again and has since been stable at about 33%—the lowest rate among
the four countries. In 2010, the top income decile earned 47% of income in the
US, 42% in the UK, 36% in Germany and 33% in France. The fact that countries
such as France, Germany, the US and the UK, that have evolved in very similar
ways in terms of technology and productivity, eventually show such different
patterns of income inequality supports the view that institutional and policy
differences play a key role. The tax system is one of the crucial factors in this
regard. The marginal tax rate in France is 49% and thus significantly higher
than in Germany (45%), the UK (40%) and the US (35%, see Figure 30). Taxing high
incomes has historically proven to be a powerful instrument of equality and
should therefore be considered again by policy makers as a useful tool if they
are serious about their intentions to fight inequalities.

63
Figure 30: Top income tax rates, 1910–2010
Source: Piketty and Saez (2013): Top Incomes and the Great Recession: Recent Evolutions and Policy Implications (World Top Incomes Database).
4.3 The alarming concentration of wealth in Europe
Wealth is defined as the total of financial and real assets less the sum of lia-
bilities (European Central Bank, 2013: 107). According to the European Central
Bank’s Eurosystem Household Finance and Consumption Survey, which reports
on the wealth of private households for 2012 (European Central Bank, 2013), the
median figure is 109,200 euros in the euro area, whereas the mean net wealth of
all households is 230,000 euros. This discrepancy between mean and median
clearly shows how unevenly wealth is distributed in Europe. Average values
differ considerably from country to country. For the median, the extremes lie
between 51,400 euros in Germany and 397,800 euros in Luxemburg; for the
mean, the differences are even higher, ranging from 79,700 euros to 710,100
euros. These differences are explained by a number of factors, notably home-
ownership, income, and institutional framework conditions such as tax systems.
At the individual level, age must also be included: wealth is highest in house-
holds where the reference person is aged between 55 and 64, and lowest in
households where the reference person is under the age of 35. Moreover, pen-
sioners hold a 34.8% share in total wealth but account for only 31.7% of the pop-
ulation.
Home ownership
The average wealth of home owners is 217,600 euros, compared to 9,100 eu-
ros among non-homeowners. An average 60.1% of households in the EU own

64
their home. The figure is 90% in Slovakia, 82% in Slovenia and 83% in Spain. In
Germany and Austria, by contrast, fewer than half of all households own an
apartment or a house. This high variation is due to a number of institutional
factors. For instance, the absence of provision of social housing, the lack of de-
preciation allowances or the lack of secure provision for old age lower the rate
of home ownership. Countries with pay-as-you-go pensions have less wealth
than countries that have developed account-based pension systems. For sure, a
strong link between wealth and home ownership can prove problematic: Homes
are goods traded mainly on the domestic market and are thus strongly subject to
business cycles and economic fluctuations. The share of wealth accordingly
shifts between home owners and renters and thus between young people (saving
to buy a home) and older people who already own their home. In countries with
high rates of ownership and correspondingly fewer rental homes, the high share
of home owners also proves to be an obstacle to mobility, since young people
live at home longer than elsewhere, not moving to areas with better job oppor-
tunities. They also tend to start a family only when they have saved enough to
buy their own home.
Income and wealth
Income correlates systematically with wealth, albeit with marked differ-
ences between countries (see Figure 31). Incomes are high in Germany, Austria,
Finland, and the Netherlands, but wealth in these countries is much below aver-
age. In Malta and Cyprus, for instance, wealth is much higher than incomes.
Again, homeownership and household size are major reasons for this relation-
ship. Most recently, the issue of wealth has been propelled to the forefront of
scientific and public scene. The GINI European research project gives detailed
information on this phenomenon. As Thomas Piketty (2014) has shown, wealth
has grown faster than the gross domestic product in many countries, meaning
larger inequalities. In the US and many European countries, it wealth rather
than hard work that pays off, leading to a situation of rising inequalities which
recalls the worst times of inequalities before the Second World War. While the
top 10% of all households earn 31% of the total income, this top 10% own over
50% of the total wealth. Another comparison: those in the top 5% of the income
distribution earn 20% of the total income but hold 37% of the total wealth (Euro-
pean Central Bank, 2013). Wealth inequality varies considerably across countries.
The lowest inequality (Gini between .4 and .6) is found in Slovakia, Slovenia and
Greece, the highest in Austria and Germany (Gini over .7).
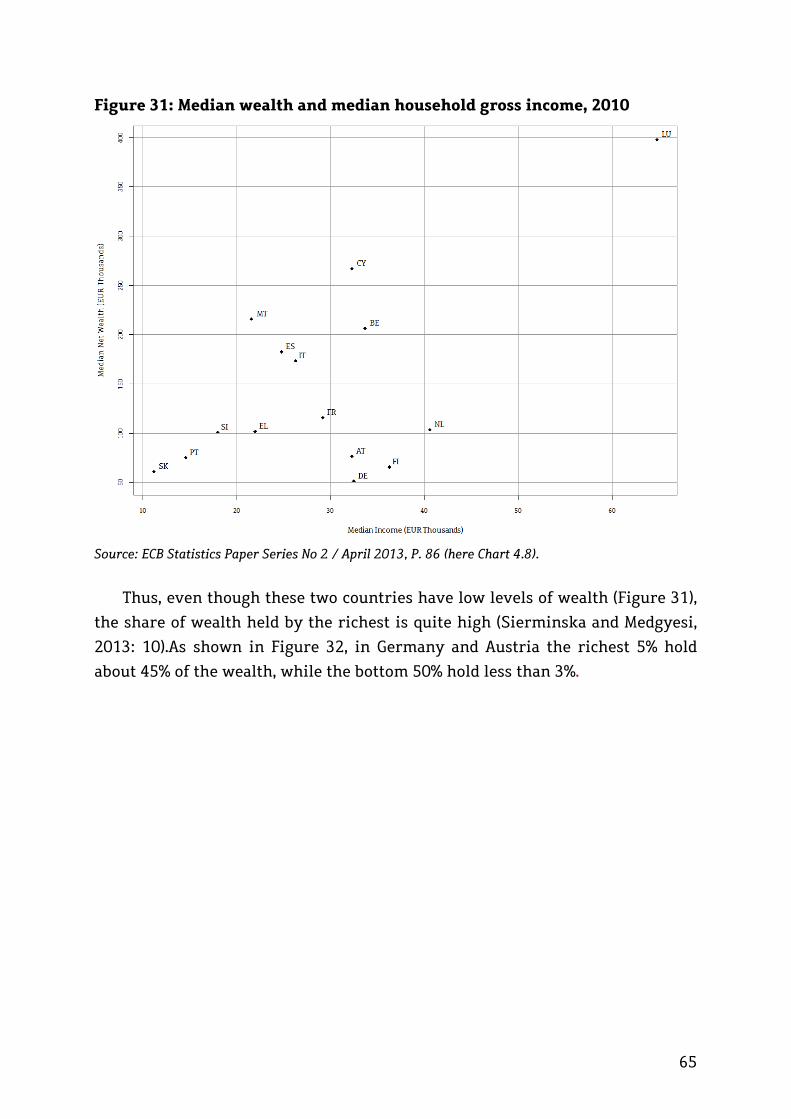
65
Figure 31: Median wealth and median household gross income, 2010
Source: ECB Statistics Paper Series No 2 / April 2013, P. 86 (here Chart 4.8).
Thus, even though these two countries have low levels of wealth (Figure 31),
the share of wealth held by the richest is quite high (Sierminska and Medgyesi,
2013: 10).As shown in Figure 32, in Germany and Austria the richest 5% hold
about 45% of the wealth, while the bottom 50% hold less than 3%.

66
Figure 32: The distribution of wealth: Share of the top 5% and bottom 50%,
2010
Source: Fessler and Schürz (2013): Cross-Country Comparability of the Eurosystem Household Fi-nance and Consumption Survey. Monetary Policy & the Economy, Oesterreichische Nationalbank (Austrian Central Bank), issue 2, pages 29-50.
As with income, inequality in wealth has risen considerably over time. This
also shows in the aggregate wealth-to-income ratio, which can be calculated
using the WTID database (Piketty, 2014; Piketty and Zucman, 2013). Piketty and
Zucman have analysed wealth accumulation in Australia, Canada, France, Ger-
many, Italy, Japan, the UK, and the US for the years 1970 to 2010, using long-
term, homogeneous information on national wealth based on balance sheets.19
For France, Germany, the UK and the US, the authors were able to extend their
series as far back as the nineteenth century. From then until 1950, private
wealth-national income ratios of the European countries under study decreased
from about 700% to 200–400%. Since the mid-twentieth century, wealth-
income-ratios have increased in all European countries included in the study,
from 200–300% to 300–600%, despite considerable changes in the nature of
wealth (see Figure 33). The U-shaped pattern of European wealth-income ratios
19 They use measurements such as the market value of all financial and non-financial assets and liabilities by households, government and corporations. The information on retrospective na-tional stock accounts (including consistent and annual balance sheets) for each sector of the economy is reported by the statistical institutes of most developed countries and published on balance sheets that follow new international guidelines.

67
can be explained by the long-term swing in relative asset prices, which are
driven by changes in capital policies. The constant ratios until the First World
War are attributable to the unfettered run of capital markets. Between 1914 and
the 1970s, several anti-capital policies were put into place, thus depressing asset
prices. The increase in wealth-income ratios since the 1980s is due to an asset
price recovery resulting from financial globalization and deregulation and large
wealth transfers from public to private hands through privatisations. In fact, the
rise of private wealth is partly due to a decline of government wealth (Piketty
and Saez, 2013: 9).
Figure 33: Private wealth/ national income ratios, 1870–2010
Source: Piketty and Zucman (2013): Capital is Back: Wealth-Income Ratios in Rich Countries 1700-2010 (here Figure 2).
Moreover, a slowdown in population growth and productivity has also led to
an increase in the wealth-income ratio since the end of the 1970s. Comparing
the long-term development of income concentration and wealth concentration,
the US has been seeing a marked concentration of income that is far higher than
wealth accumulation. In Europe the concentration of income is less pronounced
than in the US, whereas wealth accumulation is higher. This rise in high wealth-
income ratios over past decades prompts new questions about capital taxation
and regulation which, given the international nature of capital mobility, should
be core concerns of the EU (Piketty, 2014; Piketty and Zucman, 2013).

68
4.4 On the dark side: poverty in the EU
Back in 1985, the EU Council of Ministers agreed on a definition of poverty
according to which the poor are the persons whose resources (material, cultural
and social) are so limited as to exclude them from the minimum acceptable way
of life in the member State to which they belong. This definition is relative and
includes both outcome elements (‘the exclusion of minimum acceptable way of
life…’) and input elements (‘…due to a lack of resources’) (Fusco et al., 2010: 9). As
shown by the AMELI, IMPROVE and COPE European research projects, the meas-
urement of poverty and social inclusion has given birth in Europe to strong sci-
entific developments which are explained below.
In the new Europe 2020 Strategy which has replaced the 2000–2010 Lisbon
Strategy since June 2010, the European Commission has agreed on three indica-
tors for measuring poverty: a relative definition that corresponds to the 60%
threshold of a country’s median income; an absolute definition that measures
material deprivation; and the number of households in which all members are
without a job (European Commission, 2010). This Chapter discusses the relative
poverty measure.
Relative poverty describes men and women earning an equivalent annual
disposable household income below 60% of the national median level. This
threshold reflects the minimum level of income considered necessary to have an
acceptable standard of living relative to the society in which a person lives. Per-
sons with incomes below that threshold are defined as being ‘at risk of poverty’.
The term poor is not used in this context because there are other factors besides
income that contribute to social exclusion. In addition to the 60% threshold,
some studies also refer to more rigorous (40% and 50% of the median income)
and softer (70% of the median income) thresholds. This wide range of definitions
suggests that the 60% threshold set by the European Commission is ultimately
an arbitrary marker (Bradshaw and Mayhew, 2010).20 No matter how the thresh-
old is defined, it is always crucial to look at the development of the household
income. Doing so reveals, for example, that over the years, the income level
marked by this 60% threshold has grown significantly in many countries, as the
national mean income has increasingly been driven by the incomes of house-
holds in which both adults work. Assortative mating, a phenomenon mentioned
earlier—well-educated employed individuals increasingly marry other well-
20 Another interesting figure in this context is the at-risk-of-poverty gap, which indicates the extent to which people live below the respective poverty line.

69
educated employed individuals—causes the 60% mark to rise even more, as the
income opportunities associated with education turn one good income into two
good incomes.
In 2012, 84 million EU-citizens (17%) lived below the risk-of-poverty line, in
2010 the number was at 81 million, in 2005 at 79 million. This is a tremendous
increase. Today, Europe has about five million people more at-risk-of-poverty
than the United States with 74 million, although the risk-of-poverty-rate is with
17% considerably lower than in the United States with 24% (OECD, 2014)21.
Figure 34 gives a picture of the 2012 at-risk-of-poverty rate. Compared to
the EU-27 average, the rates are much higher (at 20-plus per cent) in Greece,
Romania, Spain, Bulgaria and Croatia. In the Netherlands and the Czech Republic,
by contrast, the rates are below 10%. Although the at-risk-of-poverty-rate of
Germany is below EU-average, the country faces the highest total number of
people at-risk-of-poverty: 13 million in 2012.
Figure 34: Change in at-risk-of-poverty rate, 2005, 2008 and 2012
(in per cent)
Source: Eurostat-Online 2014, Survey of Income and Living Conditions (EU-SILC). Note: At risk of poverty rate (cut-off point: 60% of median equalized income after social transfers).
This is an increase of 3 million compared to 2005. It is clear from Figure 35
that in most of the EU-27 countries the number of people at-risk-of-poverty has
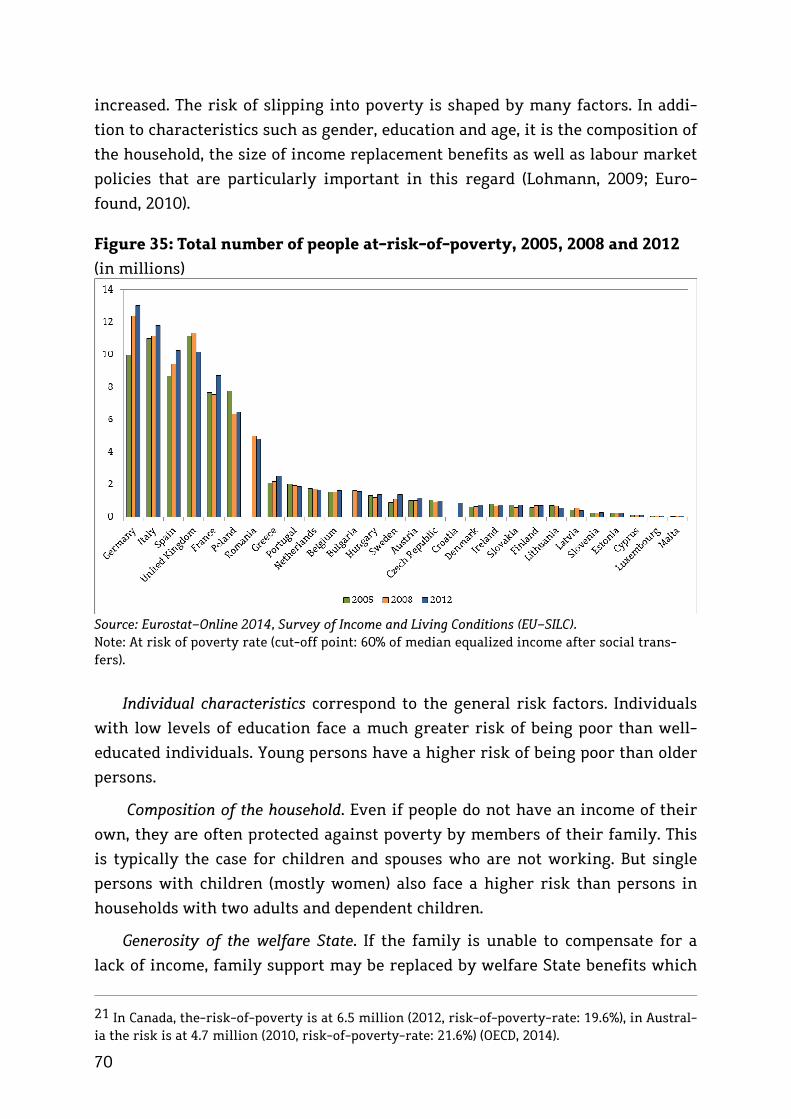
70
increased. The risk of slipping into poverty is shaped by many factors. In addi-
tion to characteristics such as gender, education and age, it is the composition of
the household, the size of income replacement benefits as well as labour market
policies that are particularly important in this regard (Lohmann, 2009; Euro-
found, 2010).
Figure 35: Total number of people at-risk-of-poverty, 2005, 2008 and 2012
(in millions)
Source: Eurostat-Online 2014, Survey of Income and Living Conditions (EU-SILC). Note: At risk of poverty rate (cut-off point: 60% of median equalized income after social trans-fers).
Individual characteristics correspond to the general risk factors. Individuals
with low levels of education face a much greater risk of being poor than well-
educated individuals. Young persons have a higher risk of being poor than older
persons.
Composition of the household. Even if people do not have an income of their
own, they are often protected against poverty by members of their family. This
is typically the case for children and spouses who are not working. But single
persons with children (mostly women) also face a higher risk than persons in
households with two adults and dependent children.
Generosity of the welfare State. If the family is unable to compensate for a
lack of income, family support may be replaced by welfare State benefits which
21 In Canada, the-risk-of-poverty is at 6.5 million (2012, risk-of-poverty-rate: 19.6%), in Austral-ia the risk is at 4.7 million (2010, risk-of-poverty-rate: 21.6%) (OECD, 2014).

71
are provided if individuals are unable to earn a market income of their own—
whether because of illness, invalidity, unemployment or age. In many countries,
there are also public subsidies for employment contracts involving wages below
a certain threshold (government top-ups, partial unemployment). Benefits paid
for household members who cannot be expected to work or are not allowed to do
so constitute another form of transfer payments. They include, most important-
ly, benefits paid for children but also benefits paid for family members who do
not work, or only work part time, especially mothers.
Besides the generosity of the welfare State, which as such can motivate peo-
ple to find work or, on the contrary, provide disincentives to work (early re-
tirement, taxation of dual income families etc.), the risk of slipping into poverty
also depends on labour market policy (see below) and on the overall economic
situation, of course. High unemployment rates reduce the likelihood of house-
holds being able to benefit from two incomes; likewise, the proportion of atypi-
cal employment increases at the expense of standard work. Moreover, the size
and duration of income replacement benefits is likely to go down as unemploy-
ment rises.
Up to this point, poverty has been defined in relation to the national distri-
bution of disposable incomes. This approach is not undisputed, though. In rich
countries, the risk-of-poverty threshold can be relatively high, meaning that
people are considered poor but, despite earning only a small income compared
to others, are still able to afford most goods of daily life. The reverse case, how-
ever, is much more worrying. In countries with a low GNP, the risk-of-poverty
rate is so low that it fails to capture the full extent of material deprivation. In
those countries, even people who are above the poverty line often cannot afford
many of the goods essential for life. There is another aspect that is important.
Poverty is commonly understood to be a hot-button social issue if it is persistent
and if people can barely escape it. The risk-of-poverty rate does not provide any
indication in this regard, referring only to the financial situation compared to
the national distribution in the previous year.
That is why researchers have suggested that poverty should also be meas-
ured in absolute terms, based on people’s physical needs. That way, measure-
ments are no longer relative to the specific circumstances in a given country but
are the same for all countries. Thus they may be compared much more easily to
common European standards for education, vocational training and employ-
ment, which are the same in all countries.
72
4.5 Material deprivation in Europe
Over the years, a variety of measures has been developed to define physical
poverty in absolute terms. The World Bank, for example, continues to use its ‘one
dollar a day’ poverty line (defined in 1985), which however is mainly used for
the World Development Plan (Revallion et al., 2008). In a certain way, the US pov-
erty line is an absolute measure as well. It was established in 1960 and since
then has only been adjusted to the impacts of inflation. Unlike the EU’s 60% me-
dian threshold, it does not adapt to changes in the standard of living. Absolute
definitions, which in one way or another are based on baskets of consumer
goods, are also found in many EU member States whose national poverty lines
are guided by the minimum income or the welfare eligibility threshold. None of
these measures has gained widespread acceptance at the EU level, however. The
‘one dollar a day’ line is far too low for rich countries; poverty lines that do not
adapt to rising standards of living are obsolete; and nationally fixed minimum
income thresholds allow far too much room for political manipulation (Brad-
shaw and Mayhew, 2010: 176).
Instead, the EU now uses an indicator measuring ‘material deprivation’. This
approach defines a number of items of daily life that are generally considered
important and looks at the number of people who would like to own these items
but cannot afford them. The material deprivation concept is based on a study by
Guio (2009), which identified three core areas of potential material deprivation:
economic strain, durables and housing. The EU indicator on material deprivation
commonly used today is based on nine specific poverty aspects within these
three areas (facing unexpected expenses; being able to afford a one-week holi-
day away from home; being able to pay for arrears; having a meal with meat,
chicken or fish every second day; being able to keep home adequately warm;
having a washing machine; having a colour TV; having a telephone; and having a
personal car). The EU deprivation rate is defined as the proportion of people liv-
ing in households who lack at least 3 out of these 9 items because they cannot
afford them. In other words, this is not about a voluntary decision to do without
these things but about an enforced lack22 (Fusco et al.,2010: 11; Guio, 2009; Euro-
pean Commission, 2011).
Figure 36 shows the deprivation rate, contrasting it with the at-risk-of-
poverty rate shown in Figure 34. When interpreting this graph, it is important to
22 A second indicator measures the intensity of deprivation, that is, the mean number of items (from 0 to 9) that people lack.

73
note that aspects of deprivation may also be found among persons who live
above the 60% poverty threshold. Their share, however, is far below the share of
poor persons in all EU countries. The range across countries in terms of the per-
centage of materially deprived persons is wide—from 1% in Sweden and Lux-
emburg to 45% in Bulgaria. The EU average is 10%. This range is much wider
than that of the EU poverty rate, which ranges from 10% in the Czech Republic
and the Netherlands to 23% in Greece and Romania, with an EU average of 17%.
In five countries (Bulgaria, Hungary, Romania, Latvia and Lithuania), material
deprivation is much higher than the poverty rate. Conversely, material depriva-
tion is significantly lower than the poverty rate in crisis-ridden countries such
as Spain and Portugal.
Figure 36: National material deprivation rates and at-risk-of-poverty rates,
2012
(in per cent)
Source: Eurostat-Online 2014, Survey of Income and Living Conditions (EU-SILC). Note: *Poverty and deprivation rate of Ireland refers to 2011 data.
It is not surprising, therefore, that national deprivation rates are only weak-
ly correlated with national poverty rates (in 2010, the correlation was 0.31). This
is evidence of the vast differences in living conditions across the EU. The corre-
lation is much stronger, however, if we compare national deprivation rates to a
poverty threshold calculated for all of Europe (R2=0.80) (Fusco et al., 2010: 15).
The strong differences between the at-risk-of-poverty threshold and the ex-
tent of material deprivation result from the different frames of reference (na-

74
tional vs. European) but also from the duration of poverty. It is safe to assume
that the deprivation rate tends to measure long-term deprivation, whereas the
poverty rate should be more subject to annual variation.
4.6 The low-wage sector
In the discussions about the extent and the evolution of poverty, the focus
has increasingly shifted to work and employment. Activation policies are based
on the assumption that getting people into paid work is the same as lifting peo-
ple out of welfare and poverty. As already alluded to above in Chapter 2, such an
assumption has become more and more difficult to sustain. It is absolutely es-
sential, therefore, to take a closer look at the development of two phenomena:
the percentage of people who work in the low-wage sector and, as will be seen in
the following section 4.7, the percentage of people who belong to the working
poor23.
What is the percentage of people whose wages are low? Who is part of the
low-wage sector and why? What are the main differences between the EU-27
countries in this regard?
The low-wage sector is measured by referring to the national distribution of
wage income. Persons who earn less than two-thirds of the median wage are
called low-wage earners. The low-wage rate shows the proportion of low-wage
earners among all employees.24
The average low-wage threshold across the EU-27 is 11.90 euros per hour. In
Bulgaria, you are a low-wage earner if you earn less than 1.50 euros per hour; in
Denmark, you need to make less than 16.60 euros per hour to fall into that cate-
gory. A total of about 21 million employees in the EU-27 earn a low wage (ex-
cluding apprentices). Almost 5 million live in Germany and another 5 million in
the UK (Figure 38). The proportion of low-wage earners varies considerably. On
average, 17% of all employees in the EU-27 earn a low wage. In Bulgaria, that
figure is 22% (the highest rate, at 28%, is found in Latvia); in Denmark, by con-
23 Both concepts are relative measures referring to the national context: therefore, a step be-yond national borders may be as much a step out of the low-wage sector and out of poverty as it may be a step into the low-wage sector and into poverty. 24 Earning low wages is not the same as income poverty because income from transfer pay-ments, redistributive taxation and the household context is not taken into account. For a single person household, a low income may be sufficient, but surely not for a larger family with only one earner.

75
trast, it is only 8% (Figure 37). Again, these few numbers illustrate the extent to
which living conditions in the EU continue to diverge.
Figure 37: Proportion of low-wage earners, by qualification, 2010
(in per cent)
Source: Eurostat-Online 2014, Structure of Earnings Survey (SES). Note: Low-wage earners as a proportion of all employees excluding apprentices.
In all countries, the low-wage sector is populated by certain social groups,
albeit to widely varying degrees: low-skilled workers, women and young people.
Working hours are a crucial aspect. Part-time hourly wages often fall far below
those for full-time employment; accordingly, the low-wage sector features a
higher proportion of people working part time. In Germany, the low-wage rate
among part-time workers is 40%; among full-time workers, it is 18% (Rhein,
2013). In Denmark, the part-time penalty is much lower, with a low-wage rate of
14% among part timers and 9.5% among full timers.
The differences in low-wage employment are particularly pronounced if we
look at education. Figure 37 provides a striking illustration. Whereas the EU-27
average for low-wage employment is 17%, it is 30% among persons with low
qualifications, 19% among persons with mid-level qualifications and 6% among
persons with high qualifications. Education-based differences are especially
large in Germany, where the low-wage rate among those with low qualifications
is 55%, compared to 19% among those with mid-level qualifications and 2%
among those with a university degree. Education provides protection against
low-wage employment. Conversely, however, these numbers also illustrate the
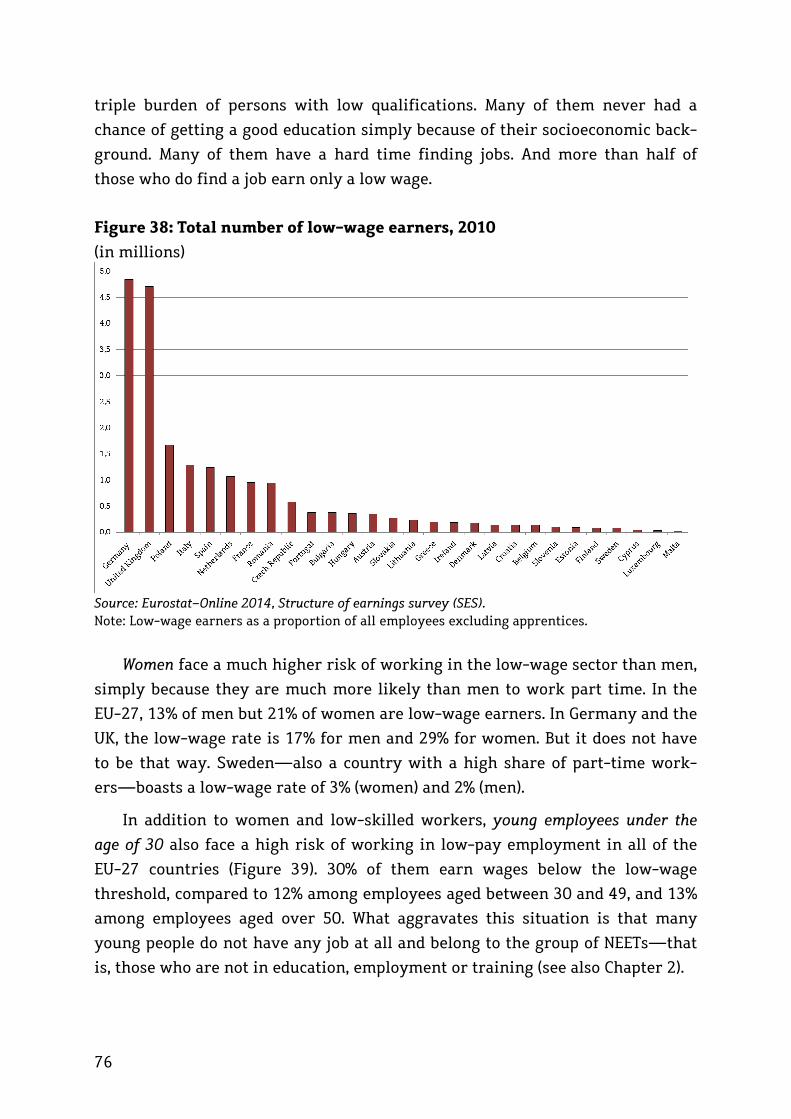
76
triple burden of persons with low qualifications. Many of them never had a
chance of getting a good education simply because of their socioeconomic back-
ground. Many of them have a hard time finding jobs. And more than half of
those who do find a job earn only a low wage.
Figure 38: Total number of low-wage earners, 2010
(in millions)
Source: Eurostat-Online 2014, Structure of earnings survey (SES). Note: Low-wage earners as a proportion of all employees excluding apprentices.
Women face a much higher risk of working in the low-wage sector than men,
simply because they are much more likely than men to work part time. In the
EU-27, 13% of men but 21% of women are low-wage earners. In Germany and the
UK, the low-wage rate is 17% for men and 29% for women. But it does not have
to be that way. Sweden—also a country with a high share of part-time work-
ers—boasts a low-wage rate of 3% (women) and 2% (men).
In addition to women and low-skilled workers, young employees under the
age of 30 also face a high risk of working in low-pay employment in all of the
EU-27 countries (Figure 39). 30% of them earn wages below the low-wage
threshold, compared to 12% among employees aged between 30 and 49, and 13%
among employees aged over 50. What aggravates this situation is that many
young people do not have any job at all and belong to the group of NEETs—that
is, those who are not in education, employment or training (see also Chapter 2).

77
Figure 39: Proportion of low-wage earners by age, 2010
(in per cent)
Source: Eurostat-Online 2014, Structure of Earnings Survey (SES). Note: Low-wage earners as a proportion of all employees excluding apprentices.
How can we explain these vast differences within the EU countries regarding
the proportion of low-wage earners and the social structure of the low-wage
sector? What is the impact of minimum wages, the prevalence of collective bar-
gaining agreements and labour market institutions? Ten of the EU-27 countries
have a national statutory minimum wage25: Belgium, Bulgaria, France, Greece,
Hungary, Lithuania, the Netherlands, Poland, Slovenia and the UK. Most of these
countries have a high proportion of low-wage earners. In all of these countries,
with the exception of France, the minimum wage is below the low-wage thresh-
old. In the Scandinavian countries, by contrast, the low-wage sector is extremely
small despite the fact that there is no minimum wage. And yet, minimum wages
do help employees because they keep wage differentials at the lower end from
widening even more. In other words, minimum wages do help reduce income-
based social inequality to some degree but they seldom provide protection
against low wages.
Nationwide collective bargaining agreements tend to protect workers from
low wages (Schmitt, 2012). Especially for employees with a low income, collec-
tive pay negotiations lead to better outcomes than individual agreements. Figure
40 shows the low-wage rate as it relates to the percentage of employees working
at firms bound by collective bargaining agreements.
25 From 1 January 2015, Germany will also have a general statutory minimum wage.
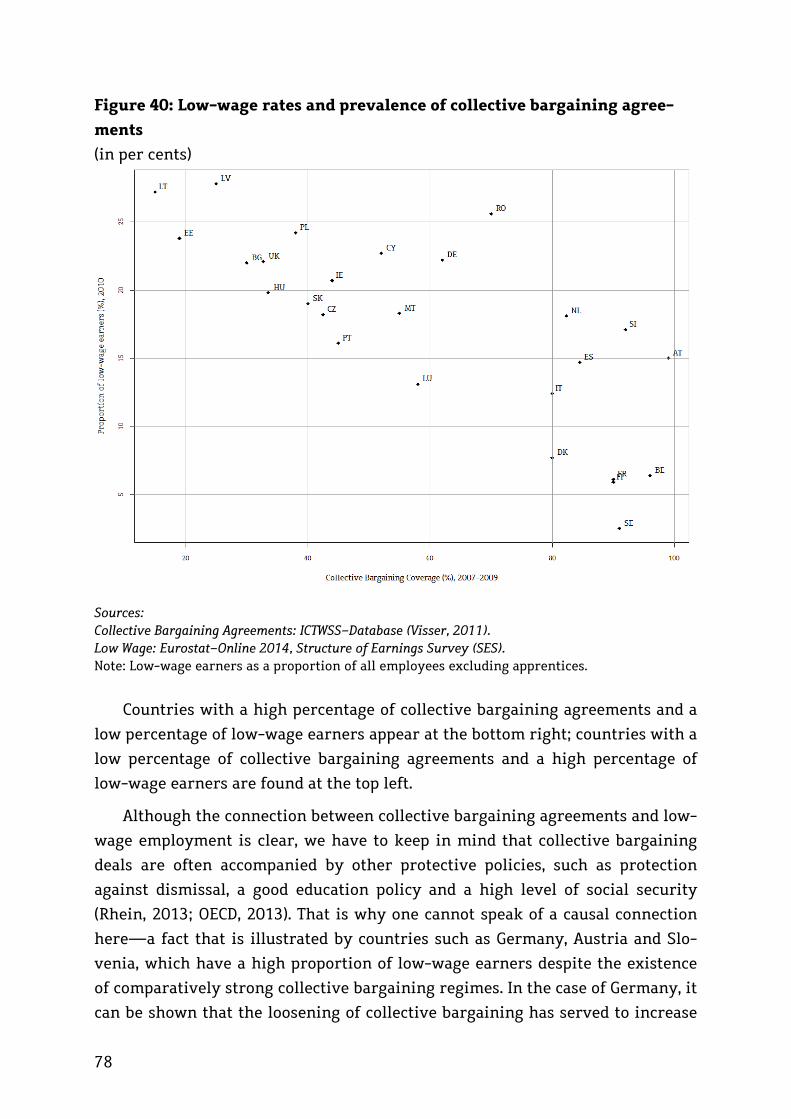
78
Figure 40: Low-wage rates and prevalence of collective bargaining agree-
ments
(in per cents)
Sources: Collective Bargaining Agreements: ICTWSS-Database (Visser, 2011). Low Wage: Eurostat-Online 2014, Structure of Earnings Survey (SES). Note: Low-wage earners as a proportion of all employees excluding apprentices.
Countries with a high percentage of collective bargaining agreements and a
low percentage of low-wage earners appear at the bottom right; countries with a
low percentage of collective bargaining agreements and a high percentage of
low-wage earners are found at the top left.
Although the connection between collective bargaining agreements and low-
wage employment is clear, we have to keep in mind that collective bargaining
deals are often accompanied by other protective policies, such as protection
against dismissal, a good education policy and a high level of social security
(Rhein, 2013; OECD, 2013). That is why one cannot speak of a causal connection
here—a fact that is illustrated by countries such as Germany, Austria and Slo-
venia, which have a high proportion of low-wage earners despite the existence
of comparatively strong collective bargaining regimes. In the case of Germany, it
can be shown that the loosening of collective bargaining has served to increase

79
wage differentials: one-third of the increased wage differentiation in the lower
half of the wage pyramid among West German full-time employees can be ex-
plained by a decrease in collective bargaining rights (Dustmann et al., 2009).26
In many EU countries, therefore, the most plausible explanation for the
growth of low-wage sectors is the decreasing competitiveness of low-skilled
labour due to technological change (Rhein, 2013). As a consequence, reducing
educational deprivation and providing better training and continuing education
opportunities is key.
4.7 The working poor
The COPE European research project provides very useful information on in-
work poverty. What is in-work poverty in the first place? We have already de-
fined one component, poverty. But how do we define ‘in-work’, that is, employ-
ment? The Eurostat indicators classify employment by referring to people’s most
frequent activity status—that is, if they work at least seven months per year.
One may easily object that this definition is much too unspecific, as it includes
all kinds of employment, ranging from forms of low-pay and fixed-term em-
ployment all the way to non-fixed-term, full-time employment covering a full
year. This definitional breadth turns out to be an advantage, however. If we were
to use a more limited definition involving specific forms of employment, the
proportion of the working poor would be attributable to labour market policy or
the overall economic situation. The differences between working poor and low
pay would be marginal. If we used an even broader definition, for instance by
dropping the seven-month period, much more explanatory power would reside
in the household situation. That is why the Eurostat definition has proven its
worth as a compromise solution, and it is increasingly being used in research
(Horemans and Marx, 2013, see also the contributions by members of the GUSTO
European research project).
A total of about 21 million employees earn a low wage (excluding apprentic-
es). The total number of working poor in the EU today amounts to about 18 mil-
lion (including apprentices) (EU-27, 2010). Figure 42 shows that the total number
of working poor varies greatly across countries. In Germany, more than 3 mil-
26 Likewise, recent labour market reforms in Germany (deregulation of fixed-term and tempo-rary employment, introduction of so-called ‘mini jobs’, Hartz IV) cannot be considered to have caused the growth of the low-wage sector, as they were used more in response to rising wage differentiation. Nevertheless, their introduction in 2005 has not stopped the low-wage sector from growing (Kalina and Weinkopf, 2013).

80
lion people live in-work-at-risk-of-poverty (2012). This is an increase of more
than 1 million since 2005. Although there is a link between low pay and working
poor, that link is extremely weak (Marx and Nolan, 2012; Horemans and Marx,
2013). Latvia, for example, has a 28% rate of low-wage earners but ‘only’ 10%
working poor. In Sweden, the situation is very different: there, there are 2%
low-wage earners and 7% working poor. But even if the two proportions were
roughly the same—as they are in Spain (15/13) or Luxemburg (13/11), for exam-
ple—that would not mean that these are the same persons (Figure 41).
Figure 41: In-work at-risk-of-poverty rate and proportion of low-wage
earners, 2010
(in per cent)
Sources: Proportion of Low Wage Earners: Eurostat-Online 2014, Structure of Earnings Survey (SES). At-risk- of- poverty rate: Eurostat-Online 2014, Survey of Income and Living Conditions (EU-SILC). Note: Low-wage earners as a proportion of all employees excluding apprentices.
Which groups of the population face an above-average risk of living in pov-
erty despite being employed? Why do we see such striking differences between
the EU countries? Beyond the well-known individual characteristics, there are
four factors that have a crucial impact on the risk of belonging to the working
poor: family policy benefits, the tax system, labour market institutions and of
course household composition (Lohmann, 2009; Eurofound, 2010; Marx and No-
lan, 2012; Horeman and Marx, 2013).

81
Figure 42: Total number of people in-work at-risk-of-poverty, 2005, 2008
and 2012
(in millions)
Sources: At risk of poverty rate: Eurostat-Online 2014, Survey of Income and Living Conditions (EU-SILC). Employed Persons: Source: Eurostat-Online 2014, EU Labour Force Survey (EU-LFS). Note: At risk of poverty rate (cut-off point: 60% of median equalized income after social trans-fers).
Family policy benefits include all those measures designed to reduce the costs
that households incur for children. This is done via transfer payments such as
child allowances or wage replacement benefits during the first few months after
a child is born. Likewise, the availability of high-quality and free childcare ser-
vices outside home, as well as all-day schools, are major factors because they
enable mothers to seek employment in the first place.
The tax system is essential in so far as many countries privilege household
constellations in which one partner works full time while the second person
only earns an ‘additional income’. This is the case with the spousal income split-
ting regime in Germany, for example, or the UK Child and Working Tax Credit
System, which significantly reduce the net earnings from a full-time job to cre-
ate incentives for part-time employment. The various types of employment play
a key role as well, especially regarding the composition of atypical employment
(see Chapter 2) and the material security associated with it. In countries with a
high part-time penalty, part-time workers are much more at a disadvantage
than in countries where fewer working hours are not automatically accompa-
nied by lower hourly wages. Finally, household composition is of major im-

82
portance as well. Having a full-time worker in the household reduces the risk of
belonging to the working poor.
The interplay of these factors becomes clear in a number of studies recently
published by several European research projects such as ImPRovE (poverty, so-
cial policy and innovation), Bien (Basic income European network), RECWOWE
(Reconciliation of Work and Welfare in Europe) and GINI (Growing inequalities
impacts). Horemans and Marx (2013), for instance, draw on the EU-SILC data to
examine the links between part-time employment and poverty.
The first thing to notice is that in most countries women have a lower risk
of belonging to the working poor than men, with the notable exception of Esto-
nia, Cyprus, Germany, Lithuania and Latvia (Figure 43). This may seem paradoxi-
cal at first glance. As we have seen, women earn significantly less than men, are
more likely to be found in the low-wage sector and work part time in highly
disproportionate numbers.
Figure 43: In-work at-risk-of-poverty rate of employed persons aged 18–64,
by gender, 2012
(in per cent)
Source: At-risk- of-poverty rate: Eurostat-Online 2014, Survey of Income and Living Conditions (EU-SILC).

83
This effect can mainly be attributed to the fact that household composition is
of special importance when it comes to women’s financial situation. Single-
parent households are mostly headed by women, and it is this type of household
that carries the highest risk of poverty, as illustrated by Figure 44. In house-
holds with more than one adult, women benefit more than men from sharing a
household with a working spouse. Men are much less likely to live with a part-
ner who is working full time and therefore enjoy less protection against pov-
erty. This effect is especially pronounced in Southern European countries, where
36% of male part-time workers but only 16% of female part-time workers be-
long to the working poor. When interpreting these findings, we need to keep
reminding ourselves that these gender effects are caused by the very definition
of working poor, as poverty always refers to the disposable income (Peña-Casas
and Ghailani, 2011). Moreover, we must not forget that this kind of protection is
discontinued in the case of divorce, causing many women to slip into poverty.
Figure 44: In-work at-risk-of-poverty rate of employed persons aged 18–64,
by household type, 2011
(in per cent)
Source: At-risk-of -poverty rate: Eurostat-Online 2014, Survey of Income and Living Conditions (EU-SILC).
Second, full-time employment provides a much better protection against
poverty than part-time employment in most countries (Table 3). In France, 4% of
all men working full time belong to the working poor, compared to 22% of all

84
men working part time; among French women, the corresponding figures are 3%
(full time) and 12% (part time). Likewise, part-time workers in Austria and Bel-
gium are four times more likely to slip into poverty than full-time workers.
Now the fact that the working poor population is heavily influenced by
household composition and working hours may easily suggest that full-time
employment is the only suitable remedy against working poverty. In that sce-
nario, women working full time would protect their husbands against poverty
risks while at the same time avoid the danger of part-time penalties for them-
selves. Such an argument is open to several objections. First, universal full-time
employment is not a realistic option in many countries due to the current labour
market situation. Moreover, it would push the poverty line to a new peak and
thus create new poverty. But more importantly, even the most flexible 40-
hour/week full-time employment model for both partners may threaten family
relationships by cutting back on the time that people need and want to spend
with their families. That is why the path chosen by the Netherlands, Denmark
and Finland—extending part-time employment and the regulations accompany-
ing it—seems to be more convincing. In these countries, there is no part-time
penalty. Men and women working part time do not face a higher risk of in-work
poverty than those working full time (Table 3).
Table 3: At-risk-of-poverty rate, full-year full-time workers (FYFT) and full-
year part-time workers (FYPT), individuals aged 18–64, 2010
(in per cent) Men Women
FYFT FYPT FYFT FYPT Austria 3 15.4 ** 1.5 6.1 *** Belgium 1.7 7.2 (*) 1.1 5.7 *** Germany 3.8 23 *** 3.6 9.9 *** Denmark 2.8 13.6 2.7 6.5 Greece 5.3 36.1 ** 4.2 14.3 ** Spain 5.3 20.4 *** 4.1 17.3 *** Finland 0.9 4.2 0.9 3.3 (*) France 4 21.6 *** 2.9 12.3 *** Ireland 0.7 5.9 (*) 1.3 4.6 ** Italy 7.8 35.8 *** 5 16 *** Luxembourg 7.1 2 ** 7.6 12.5 * Netherlands 3.4 2.4 1.5 3.1 (*) Portugal 5.2 25.8 * 5.4 20.4 *** Sweden 2.5 21.1 *** 2.6 7.4 *** United Kingdom 3.2 15 ** 2.9 10.5 *** Source: Horemans and Marx 2013, P. 12 (here Table 5). Note: t-test significance levels H0: IWP FT = IWP PT: (*) p < 0.1, *p < 0.05, ** p <0.01, *** p<0.001

85
In a shared effort, governments, unions and employers have made sure that
part-time and full-time workers enjoy the same rights, benefits and earnings
(Visser, 2002). Part-time work is high-quality work; unlike in other countries, it
is a voluntary option rather than one forced on people due to a lack of childcare
services and other general circumstances (Horemans and Marx, 2013).
These new time regimes combine the inclusion of all adults into the work-
force with broad-based support services for children through childcare provi-
sion, financial support and parental leave schemes targeted towards both moth-
ers and fathers. Crettaz and Bonoli (2010), as well as Marx and Nolan (2012),
emphasize that these approaches are much more effective than minimum wages,
in-work benefits or tax credits. Minimum wages, now implemented or underway
in many EU Member States, cannot protect one-breadwinner models against
poverty, especially if there are children to look after. In-work benefits and tax
credits are viewed critically because they are strongly targeted, ‘which implies a
potential cost in terms of mobility traps and wage erosion’ (Marx and Nolan,
2012: 37). Providing better support for children is also the preferred approach of
Strengmann-Kuhn (2002), who calls for a basic income for children to eliminate
the risk of slipping into poverty because of having children.
4.8 Conclusion
This Chapter has highlighted the enormous differences in incomes and
wealth between and within the EU member states. The evolution of the Gini co-
efficient has been uneven across the EU Member States. Although this Review
does not agree with all the current analyses of financial inequalities, it is clear
that Europe and other continents or countries share a similar problem: can we
let inequalities increase and what are acceptable levels? If one looks at the in-
come of the top 10 per cent for instance, an increasing concentration of income
and especially wealth is clearly evident. Some of the recent EU policy initiatives,
such as the "Platform against Poverty and Social Exclusion" and "the Social In-
vestment State" go in the right direction but are not sufficient to tackle ine-
qualities per se. Reducing the high level of financial inequality must definitely
become a top priority for the European Commission and all EU member States.
Depending on the country and the respective political and institutional set-up,
several tools are clearly available, provided there is political will and enough
support among society. Taxation, union representation, labour regulation on
wages and social transfers to children, for instance, are decisive factors to cor-
rect inequalities in this context, but so are the level and the distribution of edu-

86
cation and employment for children and young people at the beginning of their
lives.
In recent years, more and better data on the evolution of wealth distribution
have become available. Unlike with the Gini coefficient, concentration effects
are also evident in the growing income-wealth ratio. Such growth is linked to
the increase in income, and especially wealth, concentration in the top decile of
earners. The most effective remedy against this trend, in addition to fighting the
underlying situation, is to introduce higher taxes on capital gains.
Finally, a look at the lower end of the income distribution shows that the ex-
tent of poverty continues to be alarming. What is more, the findings of this Re-
view show that looking only at income can fail to identify individuals who may
be excluded from the minimum acceptable way of life in the Member States to
which they belong and that looking only at deprivation can fail to identify poor
people. The findings also suggest an urgent need to include in the analysis of
inequalities both poverty rates and national income poverty thresholds. They
should also accompany the national material deprivation rates.
The European Union’s activation policies assume that employment provides
protection against poverty. That, however, is not always the case. In many EU
countries, people are poor despite the fact that they work. If we look at the low-
wage sector, the prevalence of precarious living conditions is almost frighten-
ing, especially because young people and people with little education are partic-
ularly hard hit. This trend provides further illustration of the fact that a one-
sided activation strategy cannot be the goal that policy makers should pursue.
The modern "Social Investment State" in Europe thus needs two legs: good, pre-
ventive education policies and effective and courageous social policies designed
to foster social equity. This should be the goal of the new Commission appointed
in 2014.

87
5. Social and Political Outcomes of Financial Inequalities
To which extent does the increase in social and economic inequalities affects
the cohesion of society, the future of our democratic systems and the grand pro-
ject of europeanisation? There is more to a good life than money and material
wealth. Health, happiness and mutual trust, the sense of living in a society that
brings opportunities for personal development and a sense of commonality are
at least as important. Likewise, nobody would question the fact that the exist-
ence of democratic societies where people are free to choose, think and express
themselves, certain that a predictable rule of law and justice will always prevail,
is part of a good life. As P. Rosanvallon (2011) argues, inequalities are not only
economic and social phenomena, they also signal our political capacities to live
together (or not). This means also to think equality historically, not along the
principles of independence, citizenship and similarity inherited from our demo-
cratic traditions, but rather along other modern lines of reinvented democracy
such as singularity (being recognised as a specific individual in a community),
reciprocity (being able to exchange equally along common norms and rules) and
commonality (being able to share common political destinies across social
groups). This is also the message that we get from over the Atlantic Ocean. The
"era of market triumphalism" where "everything is for sale" actually reinforces
inequalities and separates people rather than aggregates them, thus weakening
solidarities and eventually democracy too (Sandel, 2012). On both continents
however there is more and more a feeling that inequalities are unavoidable and
cannot be limited; it seems that the political institutions in our democracies
have become powerless and let inequalities grow (Dubet, 2014).
In the current context, one may wonder: to what extent is active democratic
citizenship related to individual income, to a country’s wealth and to the degree
of financial equality? Over time, the EU countries have witnessed an increase of
income and wealth, fundamental medical progress, the almost complete elimina-
tion of hunger and widening access to health care services for more and more
people. Life expectancy and what is more, healthy life expectancy, have risen
considerably in all EU member States while the once large differences between
the countries have become smaller over time (United Nations, 2013). Democracy
has flourished despite dire dictatorial and even totalitarian periods, wars have
stopped. Unprecedented economic growth in Europe after 1945 has generally led
to higher levels of material and social satisfaction, a capitalist lifestyle ‘imitated’
by Central and Eastern European countries joining the EU after the fall of the

88
Berlin Wall at a time when inequalities in Western Europe and elsewhere were
increasing27.
Behind these intuitively plausible connections, however, there is a series of
intriguing questions that need to be looked at separately concerning well-being
at large and political participation. This Review cannot take up all the issues
raised in recent years notably by the research on the links (or rather the corre-
lations) between inequalities and other negative social and political outcomes
(Wilkinson and Pickett, 2009). This research has created ample scientific (and
ideological) disagreements on the extent of inequalities and especially on
whether degrees of inequalities are not only tolerable but defendable in demo-
cratic societies given that full equality can, in essence, be anti-democratic. Such
disagreements tend to escape other lessons of social sciences and humanities
and notably history and philosophy, which have shown for long that democracy,
since the XVIIIth century, has always had a rather subtle and complex, if not at
times ambiguous, understanding of equality. This Review thus limits itself to
debating these questions with caution and from two more empirical angles.
First, it looks at the connections between people’s financial status, financial ine-
quality and health in order to illustrate the social consequences of income ine-
qualities. Secondly, it focuses on the links between inequalities and political
outcomes, especially on voter turnout and people’s attitudes to democracy.
5.1 Financial inequality and health
At the EU level, there has been a clear recognition that health inequalities in
Europe are much more important than previously thought, not only between
countries but also notably within countries and even at local levels within re-
gions, rural areas or cities or even neighbourhoods (European Commission,
2009). In the framework of its recent Social Investment Package, the European
Commission has suggested specific solutions to "reduce inequalities in health"
(European Commission, 2013).
However, beyond the current generous policy initiatives, many unanswered
and still, fundamental, questions remain on the exact links between health ine-
qualities and other types of inequalities, including financial ones. The link be-
tween income and health provides a good example to illustrate the conceptual,
theoretical and methodological complexity of these issues. As these diverse con-
27 A new European Review by the European Commission (DG RTD) is due soon to analyse the effects of 25 years of market economy and democracy in the Central and Eastern European coun-tries 25 years after the fall of the Berlin Wall.
89
nections are frequently not presented and studied in a precise fashion in the
existing literature, it is useful to approach the issue in four steps.
The first question is: do persons with a high income, high levels of education
and a high socioeconomic status have a higher life expectancy than persons with
a low income, low levels of education and a low status? What is observed at the
individual level does not necessarily have to apply to countries as a whole.
Therefore, it is important to consider the extent to which such differences
emerge at country level. The second question is: do countries with a high GDP
and high average educational attainment boast of an equally high average level
of good health and life expectancy? The next question is at aggregate level: do
countries with lower levels of income inequality also see less inequality in terms
of health? Finally, this Review is interested in the interconnections between
income levels and the national income distribution and their impact on individ-
ual health. The fourth question then is: does a person’s life expectancy depend on
the national income distribution? More bluntly, does it make a difference in per-
sonal life expectancy whether people live in England, a country characterized by
relatively high financial inequality, or in Sweden where financial inequality is
much lower?
The existing research does not systematically address these questions, which
eventually leads to major methodological and theoretical problems. Therefore
this Review can only sketch a few of the challenges here, as researched by the
GINI European project in particular (Nolan and Whelan, 2014; McKnight and Cow-
ell, 2014).
(1) Do rich and highly educated persons lead healthier lives than poor persons
with low levels of education? Health, measured in terms of mortality, morbidity
and perceived health, is linked to educational attainment and socioeconomic
status in all EU countries (Eikemo et al., 2008; Mackenbach et al., 1997, 2008; van
Ourti et al., 2009; European Commission, 2009; OECD, 2012). In the lower income
groups, the effect of income on life expectancy is stronger than it is in the high-
er income groups, meaning the relationship between education and income on
the one hand and life expectancy on the other hand is not a linear one (Backlund
et al., 1996; Fritzell et al., 2012). This may be due to less favourable working con-
ditions in low-paid jobs (Benach et al., 2009; Cottini and Lucifora, 2013); such a
connection, however, is still an open debate between researchers (McKnight and
Cowell, 2014: 194). Furthermore, there is evidence to suggest that, in rich coun-
tries, it is relative income (rather than absolute income) that makes a difference
when people assess their own state of health (Blázquez et al., 2012).

90
(2) Do countries with a high GDP also have a high life expectancy? As soon as
scientific research looks at differences between countries rather than between
individuals, clear connections between wealth and life expectancy begin to blur.
GDP and life expectancy are not causally linked. The wealthy countries of Scan-
dinavia, which boast high GDPs, high levels of educational attainment and a
high-quality healthcare system for all, are not those with the highest life expec-
tancy. The UK and Germany, despite lower scores in the same areas, do much
better in this regard. At the same time, however, it is true that the Baltic and
Southern European countries with a low GDP also have a low average life expec-
tancy. So far, there is no satisfying explanation for this unexpected result, as we
will also show below (Eikemo et al., 2008; Mackenbach et al., 1997, 2008).
(3) Do countries with lower levels of income inequality also see less inequality
in terms of health? The answer is clearly a qualified ‘no’. The extent of income
inequality does not relate to the extent of health inequality. Sweden and Den-
mark, for example, although characterized by low levels of income inequality,
have comparatively high levels of inequality with regard to life expectancy. Es-
sentially, this is explained by referring to reasons such as migration and inter-
generational mobility, but they do not sufficiently explain why, comparatively,
life expectancy differentials in the UK are low despite the country’s high degree
of income inequality.
(4) Does a person’s life expectancy depend on the financial inequality in the
country they live in? This question combines the individual situation with ine-
qualities in society at large, thereby addressing a classical micro-macro prob-
lem. Wilkinson and Pickett (2006, 2009) argue that at a certain level of wealth, it
is the distribution of incomes rather than the size of the national GDP that af-
fects people’s health. Van Ourti et al. (2009) show that life expectancy increases
in countries whose economies develop well over time. This correlation is partic-
ularly strong when economic growth is accompanied by increasing social equali-
ty.
Various lines of argument may support this income inequality-health hy-
pothesis. Psychologists and cultural theorists (McKnight and Cowell, 2014: 170)
claim that in unequal societies the pressure of competition is greater and people
have to struggle to maintain, let alone improve, their position. They are under
constant stress and pressure, thereby causing harm to themselves and their
children as well. It is precisely these arguments that are sometimes used to ex-
plain the comparatively low life expectancy rates in the Scandinavian countries.

91
Institutional explanations likewise are not completely satisfactory. Are so-
cially unequal countries also countries with an underdeveloped social welfare
system? One could hypothesize that when people have no health insurance and
cannot secure the necessary financial resources, they take fewer precautions
and consult doctors less frequently, which in turn lowers their own life expec-
tancy and that of their children. This, however, would suggest that countries
with a comprehensive healthcare system have a higher life expectancy (and low
life expectancy differentials). Yet, as seen above, this is not the case in Scandina-
vian countries.
Overall, research on the links between income and health is still in its early
phases, both in terms of theory and methodology. As long as we do not have any
data providing information on health and income over the life course in longi-
tudinal and international comparisons, linking life course information to condi-
tions in society at large, assessments and explanations regarding the income
inequality-health hypothesis will remain inconclusive28.
Besides health, other possible social outcomes of financial inequality such as
stress, fertility, crime, solidarity, trust and happiness have been studied (Nolan
and Whelan, 2014; McKnight and Cowell, 2014). For each of these areas, the GINI
European research project finds that ‘tracing causal relationships with any de-
gree of confidence is extremely challenging’ (Nolan and Whelan, 2014: 166). Re-
searchers in that project acknowledge the importance of the debates sparked by
the widely quoted work of Wilkinson and Pickett (2006, 2009) on the relation-
ships between inequalities and social phenomena such as crime, violence or
health, but argue that Wilkinson and Pickett’s work is mostly based on correla-
tions insufficiently backed up by empirical evidence. Accordingly, the GINI Euro-
pean research project concludes its assessment of the social impacts of income
inequality with caution: ‘Overall, the evidence that income inequality plays the
central role sometimes proposed for it across a range of social outcomes is rela-
tively weak.’ (Nolan and Whelan, 2014: 168) This summary of the state of re-
search is not to be misinterpreted. Social inequalities, the researchers say, do
make a difference, but in order to capture that difference, we need a better op-
erationalisation of the underlying theoretical concepts and methodologies. Tak-
ing on this challenge is an important task for future research.
28 It is expected that the SHARE European infrastructure project will be able to give further results in this area of research.

92
5.2 Financial inequality and political outcomes: democracy in threat?
A long political philosophy tradition since Aristotle has linked democracy
with restricted inequalities; societies of extremes, it is said, are little prone to
the development of a sense of community and of shared past and future. Howev-
er, these links are difficult to prove empirically even though research shows
very clearly how some categories of citizens, like youth, women and migrants
for instance have lower levels of political participation. As analysed by the PIDOP
and MYPLACE European research projects, the links between income, voter turn-
out, institutional factors, psychological factors and other forms of democratic
participation and citizenship are particularly complex. At the individual level,
the empirical evidence is clear. People with a good income and a good education
are more likely to vote and pursue democratic values than persons with a low
income and low levels of education. But again, the interesting question is
whether the degree of financial inequality in a country has an additional impact.
Do inequalities widen the voting gap between persons with high social status,
incomes or wealth and persons with low social status, incomes and wealth?
Most theories are based on the assumption that richer individuals are more
likely to be opposed to redistributing wealth from rich to poor whereas poorer
individuals are likely to push for that kind of redistribution (Tóth and Keller,
2011; Corneo and Grüner, 2002; McCarty and Pontusson, 2009; Guillaud, 2013).
This argument might be called the ‘pure material self-interest’ (Tóth and Keller,
2011) or the ‘homo economicus’ effect (Corneo and Grüner, 2002). From this we
might conclude that total voter turnout should be higher in countries with a
high level of social inequalities than in countries with a low level of social ine-
qualities. Historically, however, the rise in inequalities has coincided with a
decline in voter turnout in most Western democracies. In other words, it would
rather seem that in unequal societies people at the bottom of society are less
involved in politics than people at the top of society. This observation also leads
to the puzzling question of why, at least in Western democracies, voting rates
decline even though education levels increase?
Research results on the links between inequalities and electoral participa-
tion do not paint a clear picture. On a simple bivariate level, no correlation be-
tween voter turnout and the Gini index is observed. In European elections, for
example (Figure 45), there is not obvious link between the Gini coefficient and
electoral turnout.

93
Figure 45: Turnout at European elections and Gini coefficient, 2009
Sources: Gini coefficient of equivalized disposable income: Eurostat-Online 2014, Survey of Income and Living Conditions (EU-SILC). Turnout at European elections: European Parliament (http://www.europarl.europa.eu/aboutparliament/de/000cdcd9d4/Wahlbeteiligung-%281979-bis-2009%29.html)
Although minor links do emerge for national elections (Figure 46), there is
no consistent pattern there either. Some multivariate studies, dating back to the
1960s, show that economic inequalities do affect voting rates in negative ways
(Solt, 2010). This may be explained by the fact that poorly educated citizens tend
to vote less frequently than highly educated citizens (Gallego, 2010). However, as
the same authors note, voting behaviour by education varies a lot from one
country to another. A recent meta-analysis of 90 empirical studies of individual
voter turnout in national elections published in ten leading journals during
2000–2010 and covering more than 170 different independent variables, does
not find any clear pattern between income, occupational status, occupational
type, social status and voting rates, although ‘those from higher social classes
indeed systematically turn out at higher rates’ (Smets and van Ham, 2013: 350).

94
Figure 46: Turnout at national elections and Gini coefficient, 2010-2013
Sources: Gini coefficient of equivalized disposable income: Eurostat-Online 2014, Survey of Income and Living Conditions (EU-SILC). Turnout at national elections: Eurostat-Online 2014, Voter turnout in national and EU parliamentary elections.
The same study also observes that ‘there is no consensus on a “core model”
of voter turnout […] authors rarely include the same control variables in their
models’ (ibid.:356). This sociological remark clearly means that competition in
this scientific field can work at the expense of knowledge on democracy.
Therefore, there is no clear empirical evidence that inequalities negatively
affect electoral participation. Again, these rather simple observations, based on
quantitative correlations rather than elaborate qualitative observations, do not
mean that inequalities do not matter. They rather suggest that, as pointed out
above with regard to health, people’s financial status or the degree of material
inequality are far too rough indicators. Other theoretical approaches involving
status and class have more explanatory power (see Svallfors, 1997; Kumlin and
Svallfors, 2008; Tóth et al., 2014: 198). However, Tóth et al. (2014), for instance,
95
arrive at the conclusion that it is far from clear ‘whether increasing inequality
reduces turnout or diminishing turnout increases inequality’ (Tóth et al., 2014:
216).
But it is not only elections that matter in democracy. Political science has a
very long tradition of studying ‘civic culture’ and social participation. As ana-
lysed by the PIDOD European research project, civic culture refers to various
non-electoral forms of political participation embedded in democratic life, such
as voluntary membership in parties or various civil organizations. Social partic-
ipation refers to attitudes towards others, including trust in particular. Here,
research seems to point more clearly to a link between inequalities and such
attitudes to broader political participation. In a comparative study of 24 Europe-
an countries, the GINI European research project concludes that ‘civic participa-
tion is indeed negatively affected by inequalities’ (Lancee and Van de Werfhorst,
2012). The MYPLACE European research project studies how young people be-
come (or not) politicised and come to share far right and populist ideologies giv-
en the social and political environments they live in. Political interest and en-
gagement corresponds closely with young people’s economic, social and cultural
capital. This sets significant equality challenges for policy makers and suggests
the need for a differentiated policy approach that takes account of social struc-
tural inequality and diversity. If the relatively good news is that on the whole
young people, if in socially differentiated ways, have a fairly substantial interest
in politics and political issues, the worrying concern is that this does not trans-
late into comparable levels of engagement with formal politics and the political
system. The most important reason that appears to emerge from the research to
date is the low level of trust and high level of cynicism that exists in most Euro-
pean countries towards politics, politicians and the political system. While on
the whole there is support for democracy as a system, many young people seem
to feel that it is not working well for them. A significant number of young peo-
ple think that politicians are corrupt, and the majority of respondents in most
countries felt that politicians are not interested in young people like them. Be-
sides, it appears that non-institutionalized forms of participation (such as at-
tending demonstrations or signing petitions) reinforce education-based inequal-
ities: poorly educated citizens tend to be excluded from such increasing non-
electoral democratic practices (Marien and al., 2010). This also has to be linked to
the fact that higher economic inequality is correlated to an underrepresentation
of the poor in both party and government affairs (Rosset and al., 2013). Finally,
research on attitudes has provided evidence that income inequality is negatively
related to solidarity. The more inequality there is in a society, the less people
96
are willing to improve the living conditions of others in their community (e.g.
older, sick and disabled persons) (Paskov and Dewilde, 2012).
Overall, there is mounting scientific evidence that various forms of educa-
tional, employment and financial exclusion are likely to lead to various forms of
political exclusion—that is, a depoliticisation of socially excluded groups. This is
obviously an alarming sign for the future of European democracies and is in
glaring contradiction to the democratic political values enshrined in the Trea-
ties.
5.3 Conclusion
This brief discussion of the social and political outcomes of social inequali-
ties has shown that, given the current conclusions of quantitative research ap-
proaches, there are still open questions. Without doubt, an individual’s material
situation makes a big difference—and that fact alone is reason enough for poli-
cymakers to do everything they can to address the exclusion of socially disad-
vantaged persons and households in the long term.
Whether the degree of inequality is causally related to a range of negative
social and political outcomes such as health inequalities and voting rates is still
an open scientific question. However, recent research on the relationships be-
tween inequalities and other types of political and social participation point to
more evidence that inequalities are related to a weakening of what one might
call ‘thick democracy’ in Europe, that is, democratic attitudes and practices be-
yond voting. This observation in itself should suffice to mobilise politicians,
policymakers and active citizens to defend our common good, democracy. How-
ever, as Rosanvallon (2011) and Dubet (2014) remark, we are caught in a para-
dox: the more we speak about inequalities, the less we fight them, and the less
our democracies seem capable of fighting them. Combatting inequalities within
the current unsatisfactory democratic systems in Europe may thus not be
enough. What might be necessary is a much more critical assessment of our cur-
rent democratic practices, theories and institutions in order to re-found a ‘total
democracy’ and a ‘society of equals’ (Rosanvallon, 2011).

97
Conclusion: The Need for the EU to Adopt Policies to Fight
Inequalities
Let us focus on five major issues about social inequalities that require de-
termined action at EU and also at national level.
1) As a general principle, it is important to note that many differences among
people in Europe are ‘created’ by society and are systematically linked to life
chances. As this Review has shown, educational attainment depends to a
large extent on the region or country where people live and on their par-
ents’ socioeconomic status. Far from all citizens of Europe have access to the
same educational opportunities, even if—and this is the crucial point—they
have the same abilities. Access to good employment and income opportuni-
ties is closely connected to success in education, meaning it is once again
firmly anchored in existing structures. This is even more true for individu-
als who live on capital gains rather than on their market income. Europe
will always be characterized by the many differences between its various
regions—and often this diversity is something to celebrate. Systematic ine-
qualities in people’s access to resources, however, are unacceptable and
must also be addressed at the supranational level by means of a determined
European policy on education: tackling inequalities in Europe first means
tackling inequalities at an early age, which means making education acces-
sible to all with adequate policies to give to the least advantaged populations
opportunities for life.
2) Considerable inequality exists in Europe with regard to the standard of liv-
ing and the distribution of income and wealth. Take Poland and Germany in
2012, for example. The poverty rates in both countries are quite similar: in
Poland, 16.3% of the population is considered poor; in Germany, it is 15.3%.
The annual income threshold demarcating poverty is 3,036 euros in Poland;
in Germany it is 11,757 euros. In a common Europe, the political agenda
must not only include the reduction of social inequalities but also the dif-
ferences in income between countries. This Review has shown that average
annual earnings in Europe do not converge over time; on the contrary they
are drifting further apart. This is harmful for a common European economic
space and runs counter to the creation of a European social union. Likewise,
in many EU Member States, inequalities in income and/or wealth distribu-
tion have largely increased over the last 35 years, putting a test on the EU’s
so-called social model. The unprecedented accumulation of wealth among

98
the already rich and, at the other end of the social scale, the growing num-
ber of poor people give rise to harsh questions such as: can the EU help re-
duce such inequalities? Do the political and economic elites in the EU and its
member States have the will and the means to fight for the cause of equality
or are they satisfied with the current and possibly future levels of inequali-
ties?
3) A European social policy must address differences resulting from an in-
creasing pluralisation of lifestyles and social security models. This Review
has shown the huge difference between the proportion of people working in
the low-wage sector (individual income) and those that make up the work-
ing poor (household income). The daily reality of women provides a striking
example in this regard. Those working in the low-wage sector are mostly
women. But when we look at the group of the working poor—that is, those
whose incomes fall below a given poverty line even though they have a
job—we see it consists mostly of men. Although women often work in ‘bad’
jobs not covered by collective bargaining agreements, they are protected
against poverty if they are married or live in households. This is ‘reassur-
ing’ only at first glance. Most EU Member States do not have any policies to
help women earn their own social security benefits; they rather rely on
women to gain financial security through their husbands. In view of the
longstanding trend towards fewer marriages and rising divorce rates be-
cause of individualistic and freedom trends in society, this is a very risky
road to take. Will in particular the EU institutions and the EU member States
take at last gender equality seriously and propose policies that take wom-
en’s situation into account and try to improve the position of women in so-
ciety regarding employment, income, welfare and retirement? Indeed,
providing individual security not only means designing social policies to-
wards that end but also improving women’s opportunities in the labour
market. Starting here means introducing minimum wages across Europe,
creating equal collective bargaining agreements and regulations for male-
and female-dominated occupations, resolutely addressing the part-time
penalty gap, and implementing a diverse array of measures to enable wom-
en to pursue gainful employment beyond marginal part-time work. Besides
providing childcare services and all-day schools, this includes a cultural
transformation towards a situation where unpaid work, too, is divided even-
ly between men and women. The Scandinavian countries have been particu-
larly successful developing in that direction.

99
4) In all European countries, one can witness processes of social closure result-
ing from assortative mating: social mobility through marriage or long-term
partnerships has dropped dramatically over the years. This creates a social
gap between households facing a double poverty risk and households enjoy-
ing a double safety net. On one side, both partners have low levels of educa-
tion and poor prospects in the labour market, complemented by a weak de-
gree of social security. On the other side, richer households consist of dual
earner couples earning high incomes, enabling them to afford private social
security in addition to government benefits. Very importantly, this is not a
momentary snapshot; its consequences will affect several generations: chil-
dren will get the corresponding education, and (grand-) parents will receive
the corresponding care when they are old and frail. Through inheritance,
the opportunities and risks accumulate dramatically on both sides. Is this
the dual society that Europe wants?
5) This leads the European citizens to consider the evolution of the middle
classes in our democracies. An interesting hypothesis of our modern times
is: are increasing inequalities and growing polarization between ‘rich’ and
‘poor’ likely to lead to a strong erosion of the middle classes? Indeed there
are signs of downward mobility among the middles classes in many Western
countries. For instance, as this Review has underlined, while unskilled peo-
ple are excluded from the workforce, their unskilled jobs are taken up by
skilled individuals from the middle classes, who then are less likely to ob-
tain quality jobs and a good income. The main problem is that Western de-
mocracies have thrived on affluent middles classes with more or less stable
political preferences, supported by stable government parties. If the middle
classes shrink and experience downward mobility, then support for our tra-
ditional democratic governments is likely to drop because of growing politi-
cal exclusion and apathy among larger segments of society on the one hand
and because of increased political and potentially anti-democratic radical-
ism among citizens who do not accept such changes on the other hand. On
the scientific front, evidence of the decline of the middle class is still mixed
(Gornick and Jäntti, 2013). However, the debate also unveils a problem re-
garding the relevance and quality of political and policy supply in our dem-
ocratic systems.
The only way for Europe to meet these challenges is not only to strengthen
economic growth policies through a broad-based economic programme promot-
ing marketisation but also by resolutely pushing for the expansion of a Social
Union which has always been part of the European model, but not so strongly in

100
recent years. A modern and successful Europe must resist the call for short term
economic growth solutions to acute social problems like inequalities. As this
Review has shown extensively, increasing selection at an early age in educa-
tional systems, cutting back on government benefits, deregulating labour mar-
kets and pretending to ignore that the number of working poor develop, allow-
ing wealth accumulation without adequate EU taxation, ignoring the political
exclusion of people at the bottom of societies because of weak policies in favour
of active citizenship, definitely increase inequalities and weaken Europe as a
continent for social progress . Europe’s most powerful countries must put equal
emphasis on employment and welfare, stress future-oriented educational in-
vestments, make sure their education and labour market policies are highly
efficient and offer a comprehensive spectrum of services and likewise pursue
active social policies. The Scandinavian countries, for example, boast an extraor-
dinarily strong profile in that regard, combining a high level of educational at-
tainment reached by most citizens and a high level of social security to protect
against unemployment, illness and old age. If their cultural environment is dif-
ferent from other EU countries, their achievement cannot be ignored or assessed
as irrelevant since these countries show that inequalities are not a fate but a
series of policies.
This Review has tried to show that inequalities in Europe are not a recent
phenomenon and that they have in general increased over recent times in most
EU countries although with many national and historical variations. The im-
portant issue for Europe is not whether inequalities are acceptable in democra-
cies since European (and other) democracies have from the beginning lived with
acceptable levels of inequalities in society. The issue is rather what levels of
inequalities are acceptable and who is able to take decision as to what limits
there should be to inequalities: this is the fundamental political question for our
democracies at national and EU levels.
101
References
Introduction
Crouch, C. (2013): Entrenching neo-liberalism: the current agenda of European social policy. In: Countouris, N.; Freedland, M. (Ed.): Resocialising Europe in a time of crisis. Cambridge: Cambridge University Press, pp. 36- 60.
Dubet, F. (2014): La préférence pour l'inégalité. Comprendre la crise des solidari-tés. Paris: Seuil.
Esping-Andersen, G. (1990): The Three Worlds of Welfare Capitalism. Princeton: Princeton University Press.
European Commission (2013): Towards Social Investment for Growth and Cohe-sion – including implementing the European Social Fund 2014-2020. Acces-sible at http://ec.europa.eu/social/main.jsp?langId=en&catId=1044&newsId= 1807&furtherNews=yes.
European Commission (2012): Towards a Job-Rich Recovery. Accessible at http://eur-lex.europa.eu/legal-content/EN/ALL/?uri=CELEX:52012DC0173.
Frazer, H.; Guio, A. C.; Marlier, E.; Vanhercke, B.; Ward, T. (2014): Putting the fight against poverty and social exclusion at the heart of the EU agenda: a con-tribution to the Mid-Term Review of the Europe 2020 Strategy". OSE Re-search Paper 15, Observatoire social européen (OSE) Paper Series. Accessible at http://www.ose.be/files/publication/OSEPaperSeries/Frazer_Guio_Marlier_Vanhercke_Ward_2014_OseResearchPaper15.pdf.
Hvistendahl, M. (2014): While emerging economies boom, equality goes bust. Inequality spikes in developing nations around the world. In: Science, Vol. 344 (6186), pp. 832-835.
Piketty, T. (2014): Capital in the Twenty-First Century. Cambridge: Harvard Uni-versity Press.
Salverda, W.; Nolan, B.; Checchi, D.; Marx, I.; McKnight, A.; György Tóth, I.; van de Werfhorst, H. (2014): Changing Inequalities in Rich Countries. Analytical and Comparative Perspectives. Oxford: Oxford University Press.
Sandel, M. J. (2012): What Money Can't Buy. The Moral Limits of Markets. London: Allen Lane.
Schraad-Tischler, D.; Kroll, C. (2014): Social Justice in the EU. A Cross-National Comparison. Gütersloh: Bertelsmann Stiftung. Accessible at http://www.sgi-network.org/docs/2014/basics/Social_Justice_in_the_EU_2014.pdf.
Stiglitz, J. E. (2013): The Price of Inequality: How Today’s Divided Society Endan-gers Our Future. New York City: Norton.

102
Vandenbroucke, F. (2014): A European Social Union: 10 tough nuts to crack. Background report for the Friends of Europe High-Level Group on 'Social Union'. Friends of Europe. Accessible at http://www.friendsofeurope.org/Portals/13/Events/WorkingGroups/Social_Europe/03_03_14_Report_SocialUnion_FINAL_V.pdf.
Chapter 1
Allmendinger, J. (2012): Schulaufgaben. Wie wir das Bildungssystem verändern
müssen, um unseren Kindern gerecht zu werden. München: Pantheon.
Allmendinger, J.; Leibfried, S. (2003): Education and the welfare state: the four
worlds of competence production. In: Journal of European Social Policy 13(1),
pp. 63-81.
Allmendinger, J. (1989): Career Mobility Dynamics. A Comparative Analysis of the
United States, Norway, and West Germany. Berlin: Edition Sigma.
Baker, J.; Lynch, K.; Cantillon, S.; Walsh, J. (2009): Equality: From Theory to Action.
London: Palgrave Macmillan.
Ballas, D.; Lupton, R.; Kavroudakis, D.; Hennig, B; Yiagopolou; Dale, Roger; Dorling,
D.(2012): Mind the Gap. Education Inequality Across EU regions. Nesse re-
port. Accessible at http://www.nessefr/nesse/activities/reports and at
http:/ /ec.europa.eu/education/news/20120914docs_en.htm.
Checchi, D.; Werfhorst, H. van den; Braga, M.; Meschi, E. (2014): The Policy Re-
sponse to Educational Inequalities. In: Salverda, W. et al. (Ed.): Changing Ine-
qualities in Rich Countries. Analytical and Comparative Perspectives. Ox-
ford: Oxford University Press, pp. 294-327.
European Commission (2013): Adult and continuing education in Europe: Using
public policy to secure a growth in skills. Accessible at
http://ec.europa.eu/research/social-sciences/pdf/kina25943enc.pdf.
European Commission (2011): Tackling early school leaving: a key contribution
to the Europe 2020 agenda. Accessible at http://eur-lex.europa.eu/legal-
content/EN/ALL/?uri=CELEX:52011DC0018.
Felouzis, G. (2014): Les inégalités scolaires. Paris: Presses Universitaires de
France.
OECD (2013): Education at a Glance: OECD Indicators, OECD Publishing.
Parreira do Amaral, M.; Walther, Andreas; Litau, John (2013): Governance of edu-
cational Trajectories in Europe. Access, Coping and Relevance of Education

103
for Young People in European Knowledge Societies in Comparative Perspec-
tive. GOETE final report. Accessible at
http://www.goete.eu/download/cat_view/69-working-papers.
Chapter 2
Allmendinger, J.; Hipp, L.; Stuth, S. (2013): Atypical Employment in Europe 1996-2011. WZB Discussion Paper P2013-003, Wissenschaftszentrum für Sozialfor-schung Berlin (WZB).
Arulampalam, W. (2001): Is Unemployment Really Scarring? Effects of Unem-ployment Experiences on Wages. IZA Discussion Papers 189, Institute for the Study of Labor (IZA).
Beblavý, M.; Maselli, I.; Veselková M. (Ed.) (2014): Let's go to work. The future of labour in Europe. Brussels: Center for European Policy Studies.
Berglund, T.; Furåker, B. (2010): Transitions into and out of temporary employ-ment. In: Nordic Council of Ministers (Ed.): Labour market mobility in Nor-dic welfare states. Copenhagen: Nordic Council of Ministers, pp. 109-139.
Blanchflower, D.; Freemann, R. (2000): The Declining Economic Status of Young Workers in OECD Countries. In: Blanchflower, D.; Freemann, R. (Ed.): Youth Unemployment and Joblessness in Advanced Countries. Chicago and Lon-don: University of Chicago Press, pp. 19-55.
Blossfeld, H.-P. (2009): Educational Assortative Marriage in Comparative Perspec-tive. In: Annual Review of Sociology, Vol. 35, pp. 513-530.
Corando, J.; Perozek, M. (2003): Wealth effects and the consumption of leisure: Retirement decisions during the stock market boom of the 1990s. FEDS Working Paper 2003-20, Finance and Economics Disussion Series (FEDS).
Dietrich, H. (2012): Youth unemployment in Europe. Theoretical Considerations and Empirical Findings. Berlin: Friedrich-Ebert-Stiftung, International Po-licy Analysis.
Ebner, C. (2013): Erfolgreich in den Arbeitsmarkt? Die duale Berufsausbildung im internationalen Vergleich. Frankfurt am Main/ New York: Campus.
European Commission (2012): New skills and jobs in Europe: Pathways towards full employment. Accessible at http://ec.europa.eu/research/social-sciences /books65_en.html.
European Commission (2010): Why socio-economic inequalities increase? Facts and policy responses in Europe. Accessible at http://ec.europa.eu/research/ social-sciences/books36_en.html.
Graf, L. (2013): The Hybridization of Vocational Training and Higher Education in Austria, Germany, and Switzerland. Opladen: Budrich UniPress.

104
Hartlapp, M.; Schmid, G. (2008): Labour Market Policy for ‘Active Ageing’ in Eu-rope: Expanding the Options for Retirement Transitions. In: Journal of Social Policy, Vol. 37 (3), pp. 409-431.
Jimeno, J.; Rodriguez-Panzuela, D. (2002): Youth Unemployment in the OECD: Demographic Shifts, Labour Market Institutions and Macroeconomic Shocks. ECB-Working Papers 2002-155, European Central Bank Working Paper Se-ries.
OECD (2011): Pensions at a Glance 2011, Retirement-income Systems in OECD and G20 Countries, OECD Publishing.
Skirbekk, V.; Loichinger, E.; Barakat, B. (2012): The Aging of the Workforce in European Countries. Demographic Trends, Retirement Projections, and Re-tirement Policies. In: Hedge, J.; Borman, W. (Ed.): The Oxford Handbook of Work and Aging. Oxford: Oxford University Press, pp. 60-79.
Chapter 3
Arulampalam, W.; Booth, A.; Bryan, M. (2007): Is There a Glass Ceiling over Eu-
rope? Exploring the Gender Pay Gap across the Wage Distribution. In: Indus-
trial and Labor Relations Review, Vol. 60 (2), pp. 163-186.
Bettio, F.; Tinios, P.; Betti, G. (2013): The Gender Gap In Pensions. Luxembourg:
Publications Office of the European Union. Accessible at
http://ec.europa.eu/justice/gender-equality/files/documents/131118_pensi
on_gap_report_en.pdf .
Breen, R.; Cooke, L. (2005): The Persistence of the Gendered Division of Domestic
Labour. In: European Sociological Review, Vol. 21 (1), pp. 43-57.
European Union (1997): Treaty on European Union (Consolidated Version), Treaty
of Amsterdam, 2 October 1997.
Flabbi, L.; Tejada, M. (2012): Gender Gaps in Education and Labor Market Out-
comes in the United States: The Impact of Employers' Prejudice. IDB Working
Paper Series IDB-WP-357, Inter-American-Development-Bank (IDB).
Goldin, C. (2014): A Grand Gender Convergence: Its Last Chapter. In: American
Economic Review- PROOF, Vol. 104 (4), pp. 1-30.
Katz, L.; Murphy, K, (1992): Changes in Relative Wages, 1963-1987: Supply and
Demand Factors. In: The Quarterly Journal of Economics, Vol. 107 (1), pp. 35-
78.
105
Levy, F.; Murnane, R. (1992): U.S. Earnings Levels and Earnings Inequality: A Re-
view of Recent Trends and Proposed Explanations. In: Journal of Economic
Literature, Vol. 30 (3), pp. 1333-1381.
OECD (2013a): The Survey of Adult Skills. Reader’s Companion, OECD Publishing.
OECD (2013b): Gleichstellung der Geschlechter: Zeit zu handeln, OECD Publishing.
OECD (2011): Pensions at a Glance 2011, Retirement-income Systems in OECD and
G20 Countries, OECD Publishing.
Chapter 4
Atkinson, A. (1970): On the measurement of inequality. In: Journal of Economic Theory, Vol. 2 (3), pp. 244-263.
Boadway, R.; Keen, M. (2000): Redistribution, Handbook of Income Distribution. In: Atkinson, A.; Bourguignon, F. (Ed.): Handbook of Income Distribution Volume 1. Amsterdam: North-Holland, pp. 677-789.
Bradshaw, J.; Mayhew, E. (2010): Understanding Extreme Poverty in the European Union. European Journal of Homelessness, Vol. 4, pp. 171-186.
Crettaz, E.; Bonoli, G. (2010): Why Are Some Workers Poor? The Mechanisms that Produce Working Poverty in a Comparative Perspective. REC-Working Paper 12/2010, Working Papers on the Reconciliation of Work and Welfare in Eu-rope.
Dustmann, C.; Ludsteck, J.; Schönberg, U. (2009): Revisiting the German Wage Structure. In: The Quarterly Journal of Economics, Vol. 124 (2), pp. 843-881.
Eurofound (2010): Working poor in Europe.
European Central Bank (2013): The Eurosystem Household Finance and Consump-tion Survey. Results from the first wave. Statistics Paper Series, No. 2.
European Commission (2013): Towards Social Investment for Growth and Cohe-sion – including implementing the European Social Fund 2014-2020. Ac-cessible at http://ec.europa.eu/social/main.jsp?langId=en&catId=1044&newsId=1807&furtherNews=yes.
European Commission (2011): The Measurement of Extreme Poverty in the Euro-pean Union. Accessible at http://ec.europa.eu/social/main.jsp?langId=en&catId=89&newsId=982&furtherNews=yes.
European Commission (2010): The European Platform against Poverty and Social Exclusion: A European framework for social and territorial cohesion. Ac-cessible at http://eur-lex.europa.eu/legal-con-
106
tent/EN/ALL/;ELX_SESSIONID=NvYGJv3CTzGTT2XpyjnnLLkjHYTKDmJ6qbCMJhnY8TcT0tBc7T2v!-774584983?uri=CELEX:52010DC0758.
Fessler, P.; Schürz, M. (2013): Cross-Country Comparability of the Eurosystem Household Finance and Consumption Survey. In: Monetary Policy & the Economy, Austrian Central Bank, Vol. 2, p. 29-50.
Fusco, A.; Guio, A.; Marlier, E. (2010): Income poverty and material deprivation in European countries. Eurostat Methodologies and Working Papers.
Guio, A. (2009): What can be learned from deprivation indicators in Europe? Pa-per presented at the Indicators Sub-Group of the Social Protection Commit-tee. Eurostat Methodological Working Papers.
Horemans, J.; Marx, I. (2013): In-work poverty in times of crisis: do part-timers fare worse? ImPRovE Discussion Paper 13/14-2013. Antwerp.
Kalina, T.; Weinkopf, C. (2013): Niedriglohnbeschäftigung 2011: Weiterhin arbei-tet fast ein Viertel der Beschäftigten in Deutschland für einen Niedriglohn. IAQ-Report 2013-01, Institut für Arbeit und Qualifikation (IAQ).
Lohmann, H. (2009): Welfare States, Labour Market Institutions and the Working Poor: A Comparative Analysis of 20 European Countries. In: European Socio-logical Review, Vol. 25 (4), pp. 489-504.
Marx, I.; Nolan, B. (2012): In-Work Poverty. AIAS, GINI Discussion Paper 51.
OECD (2014): OECD. Stat, (database). doi: 10.1787/data-00285-en.
OECD (2013): OECD Employment Outlook 2013, OECD Publishing.
OECD (2001): Innovations in Labour Market Policies – The Australian Way, OECD Publishing.
Peña-Casas, R.; Ghailani, D. (2011): Towards individualizing gender in-work pov-erty risks. In: Fraser, N.; Gutierrez, R.; Pena-Casas, R. (Ed.): Working poverty in Europe: a comparative approach. Bakingstoke: Palgrave Macmillan.
Piketty, T. (2014): Capital in the Twenty-First Century. Cambridge: Harvard Uni-versity Press.
Piketty, T.; Saez, E. (2013): Top incomes and the Great Recession: Recent Evolu-tions and Policy Implications. In: IMF Economic Review, Vol. 61 (3), pp. 456-478.
Piketty, T.; Zucman G. (2013): Capital is Back: Wealth-Income Ratios and Rich Countries, 1700-2010. CEPR Discussion Paper DP9588, Centre for Economic Policy Research (CEPR).
Ravallion, M.; Chen, S.; Sangraula, P. (2008): Dollar a Day Revisited. In: Policy Re-search Working Paper, No. 4620.
Rhein, T. (2013): Deutsche Geringverdiener im europäischen Vergleich. IAB-Kurzbericht, No. 15.
107
Salverda, W.; Nolan, B.; Checchi, D.; Marx, I.; McKnight, A.; György Tóth, I.; van de Werfhorst, H. (2014): Changing Inequalities in Rich Countries. Analytical and Comparative Perspectives. Oxford: Oxford University Press.
Schmitt, J. (2012): Low-wage Lessons. Center for Economic and Policy Research (CEPR). Accessible at http://www.cepr.net/documents/publications/low-wage-2012-01.pdf.
Sierminska, E.; Medgyesi, M. (2013): The distribution of wealth between house-holds. European Commission, Research Note 11/2013.
Strengmann-Kuhn, W. (2002): Working Poor in Europe: A Partial Basic Income for Workers? 9th B.I.E.N International congress: Income Security as a Right. In-ternational Labour Office. Geneva.
Visser, J. (2011): Data Base on Institutional Characteristics of Trade Unions, Wage Setting, State Intervention and Social Pacts, 1960-2010 (ICTWSS). Amster-dam Institute for Advanced Labour Studies (AIAS), University of Amsterdam.
Visser, J. (2002): The First Part-time Economy of the World - A model to be fol-lowed? In: Journal of European Social Policy, Vol. 12 (1), pp. 23-41.
Chapter 5
Backlund, E.; Sorlie, P.; Johnson, N. (1996): The Shape of the Relationship between Income and Mortality in the United States: Evidence from the National Lon-gitudinal Mortality Study. In: Annuals of Epidemiology, Vol. 6(1), pp. 12-20.
Benach, J.; Muntaner, C.; Solar, O.; Santana, V.; Quinlan, M.; Emconet Network (2009): Employment, Work, and Health Inequalities: A Global Perspective. Geneva: WHO.
Blázquez, M.; Cottini, E.; Herrarte, A. (2012): Socioeconomic Gradient in Health: How important is material deprivation? AIAS, GINI Discussion Paper 39.
Corneo, G.; Grüner, H. P. (2002): Individual preferences for political redistribu-tion. In: Journal of Public Economics, Vol. 83 (1), pp. 83–107.
Cottini, E.; Lucifora, C. (2013): Inequalities at Work. Job Quality, Health and Low Pay in European Workplaces. AIAS, GINI Discussion Paper 86.
Dubet, F. (2014): La préférence pour l'inégalité. Comprendre la crise des solidari-tés. Paris: Seuil..
Eikemo, T.; Huisman, M.; Bambra, C.; Kunst, A. (2008): Health inequalities accord-ing to educational level in different welfare regimes: a comparison of 23 European countries. In: Sociology of Health & Illness, Vol. 30 (4), pp. 565-582.
European Commission (2013): Social Investment Package. Investing in Health. Staff Working Document. Accessible at http://ec.europa.eu/social/main.jsp?catId=1044&langId=en&newsId=1807&moreDocuments=yes&tableName=news

108
European Commission (2009): Solidarity in health. Reducing health inequalities in the European Union. Accessible at http://eur-lex.europa.eu/legal-content/EN/TXT/?qid=1396946539740&uri=CELEX:52009DC0567.
Fritzell, J.; Kangas, O.; Hertzman, J.; Blomgren, J.; Hiilamo, H. (2012): Cross-Temporal and Cross-National Poverty and Mortality Rates among Developed Countries. AIAS, GINI Discussion Paper 64.
Gallego, A. (2010): Understanding unequal turnout: education and voting in com-parative perspective. In: Electoral studies 29 (2), pp. 239-248.
Guillaud, E. (2013): Preferences for redistribution: an empirical analysis over 33 countries. In: Journal of Eonomic Inequality, Vol. 11 (1), pp. 57-78.
Kumlin, S.; Svallfors, S. (2008): Social Stratification and Political Articulation: Why Attitudinal Class Differences Vary across Countries. LIS Working Paper 484, Luxembourg Income Study (LIS).
Lancee B.; Van de Werfhorst H. (2012): Income inequality and participation: A comparison of 24 European countries. In: Social Science Research 41 (5), pp. 1166-1178.
Mackenbach J.; Kunst A.; Cavelaars, A.; Groenhof F.;, Geurts, J.; EU Working Group on Socioeconomic Inequalities in Health (1997): Socioeconomic inequalities in morbidity and mortality in Western Europe. In: The Lancet, Vol. 349 (9066), pp. 1655-1659.
Mackenbach, J.; Stirbu, I.; Roskam, A-J.; Schaap, M.; Menvielle, G.; Leinsalu, M.; Kunst, A. (2008): Socioeconomic Inequalities in Health in 22 European Coun-tries. In: The New England Journal of Medicine, Vol. 359 (23), pp. 2468-2481.
Marien, S. ; Hooghe, M. ; Quintelier, E. (2010): Inequalities in non-institutionalized forms of political participation. A multilevel analysis for 25 countries. In: Political studies, Vol. 58 (1), pp. 187-213.
McCarty, N.; Pontusson, J. (2009): The Political Economy of Inequality and Redis-tribution. In: Salverda, W. (Ed.): The Oxford Handbook of Economic Inequali-ty. Oxford: Oxford University Press, pp. 665-692.
McKnight, A.; Cowell, F. (2014): Social Impacts: Health, Housing, and Inter-generational Mobility. In: Salverda, W. et al. (Ed.): Changing Inequalities in Rich Countries. Analytical and Comparative Perspectives. Oxford: Oxford University Press, pp. 169-194.
Nolan, B.; Whelan, C. (2014): The Social Impact of Income Inequality: Poverty, Dep-rivation, and Social Cohesion. In: Salverda, W. et al. (Ed.): Changing Inequali-ties in Rich Countries. Analytical and Comparative Perspectives. Oxford: Ox-ford University Press, pp. 146-168.
OECD (2012): Health at a Glance: Europe 2012, OECD Publishing.
109
Ourti, T. van; Doorslaer, E. van; Koolman, A. (2009): The effect of income growth and inequality in incomes on health inequality: Theory and empirical evi-dence from the European Panel. In: Journal of Health Economics, Vol. 28 (3), pp. 525-539.
Paskov, M. ; Dewilde, C. (2012): Income inequality and solidarity in Europe. Re-search in Social Stratification and Mobility, Vol. 30 (4), pp. 415-432.
Rosanvallon, P. (2011): La société des égaux. Paris: Seuil.
Rosset, J.; Giger, N.; Bernauer, J. (2013): More money, fewer problems? Cross-level effects of economic deprivation on political representation. West European Politics, Vol. 36 (), pp. 817-835.
Sandel, M. J. (2012): What Money Can't Buy. The Moral Limits of Markets. London: Allen Lane.
Smets, K. ; Van Ham C. (2013): The embarrassment of riches? A meta-analysis of individual-level research on voter turnout. In: Electoral studies, Vol. 32 (2), pp. 344-359.
Solt, F. (2010): Does economic equality depress electoral participation? Testing the Schattschneider Hypothesis. In: Political Behavior, Vol. 32 (2), pp. 285-301.
Svallfors, S. (1997): Worlds of Welfare and Attitudes to Redistribution: A Compar-ison of Eight Western Nations. In: European Sociological Review, Vol. 13 (3), pp. 283-304.
Tóth, I. G.; Horn, D.; Medgyesi, M. (2014): Rising Inequalities: Will Electorates Go for Higher Redistribution? In: Salverda, W. et al. (Ed.): Changing Inequalities in Rich Countries. Analytical and Comparative Perspectives. Oxford: Oxford University Press, pp. 195-217.
Tóth, I. G.; Keller; T. (2011): Income distributions, inequality perceptions and re-distributive claims in European societies. AIAS, GINI Discussion Paper 7.
United Nations (2013): Inequality matters. Report of the World Social Situation 2013.
Van Ourti, T; Van Doorslaer, E.; Koolman, X. (2009): The effect of income growth and inequality on health inequality: Theory and empirical evidence from the European Panel. In: Journal of Health Economics, Vol. 28, pp. 525-539.
Wilkinson, R.; Pickett, K. (2009): The Spirit Level: Why more equal societies al-most always do better. London: Allen Lane.
Wilkinson, R.; Pickett, K. (2006): Income Inequality and Population Health: A Re-view and Explanation of the Evidence. In: Social Science and Medicine, Vol. 62, pp. 1768-1784.
110
Conclusion
Gornick, J. C.; Jäntti, M. (2013). Income inequality. Economic Disparities and the
Middle Class in Affluent Countries. Stanford: Standford University Press.

111
Annex I: Description for the competence levels of proficiency in
print reading (PISA) and literacy (PIAAC)
PISA: reading (Source: OECD (2013), PISA 2012 Assessment and Analytical Framework: Mathematics, Read-ing, Science, Problem Solving and Financial Literacy, OECD Publishing. P.79)
PIAAC: literacy (Source: OECD (2013), The Survey of Adult Skills: Reader’s Companion, OECD Publishing. P. 69-70)
Below Level 1
Lower score limit 262
Tasks at this level require the reader to locate
a single piece of explicitly stated information
in a prominent position in a short, syntactical-
ly simple text with a familiar context and text
type, such as a narrative or a simple list. The
text typically provides support to the reader,
such as repetition of information, pictures or
familiar symbols. There is minimal competing
information. In tasks requiring interpretation
the reader may need to make simple connec-
tions between adjacent pieces of information.
Below 176 points
The tasks at this level require the respondent
to read brief texts on familiar topics to locate a
single piece of specific information. There is
seldom any competing information in the text
and the requested information is identical in
form to information in the question or di-
rective. The respondent may be required to
locate information in short continuous texts.
However, in this case, the information can be
located as if the text was non-continuous in
format. Only basic vocabulary knowledge is
required, and the reader is not required to
understand the structure of sentences or para-
graphs or make use of other text features.
Tasks below Level 1 do not make use of any
features specific to digital texts.
Level 1
Lower score limit 335
Tasks at this level require the reader to locate
one or more independent pieces of explicitly
stated information; to recognise the main
theme or author’s purpose in a text about a
familiar topic, or to make a simple connection
between information in the text and common,
everyday knowledge. Typically the required
information in the text is prominent and there
is little, if any, competing information. The
reader is explicitly directed to consider rele-
vant factors in the task and in the text.
176 to less than 226 points
Most of the tasks at this level require the re-
spondent to read relatively short digital or
print continuous, noncontinuous, or mixed
texts to locate a single piece of information
that is identical to or synonymous with the
information given in the question or directive.
Some tasks, such as those involving non-
continuous texts, may require the respondent
to enter personal information onto a document.
Little, if any, competing information is present.
Some tasks may require simple cycling
through more than one piece of information.
Knowledge and skill in recognising basic vo-
cabulary determining the meaning of sentenc-
es, and reading paragraphs of text is expected.

112
Level 2
Lower score limit 407
Some tasks at this level require the reader to
locate one or more pieces of information,
which may need to be inferred and may need
to meet several conditions. Others require
recognizing the main idea in a text, under-
standing relationships, or construing meaning
within a limited part of the text when the
information is not prominent and the reader
must make low level inferences. Tasks at this
level may involve comparisons or contrasts
based on a single feature in the text. Typical
reflective tasks at this level require readers to
make a comparison or several connections
between the text and outside knowledge, by
drawing on personal experience
and attitudes.
226 to less than 276 points
At this level, the medium of texts may be digi-
tal or printed, and texts may comprise continu-
ous, non-continuous, or mixed types. Tasks at
this level require respondents to make matches
between the text and information, and may
require paraphrasing or low-level inferences.
Some competing pieces of information may be
present. Some tasks require the respondent to
• cycle through or integrate two or more pieces
of information based on criteria;
• compare and contrast or reason about infor-
mation requested in the question; or
• navigate within digital texts to access-and-
identify information from various parts of a
document.
Level 3
Lower score limit 480
Tasks at this level require the reader to locate,
and in some cases recognise the relationship
between, several pieces of information that
must meet multiple conditions. Interpretative
tasks at this level require the reader to inte-
grate several parts of a text in order to identi-
fy a main idea, understand a relationship or
construe the meaning of a word or phrase.
They need to take into account many features
in comparing, contrasting or categorising.
Often the required information is not promi-
nent or there is much competing information;
or there are other text obstacles, such as ideas
that are contrary to expectation or negatively
worded. Reflective tasks at this level may
require connections, comparisons, and expla-
nations, or they may require the reader to
evaluate a feature of the text. Some reflective
tasks require readers to demonstrate a fine
understanding of the text in relation to famil-
iar, everyday knowledge. Other tasks do not
require detailed text comprehension but re-
quire the reader to draw on less common
knowledge.
276 to less than 326 points
Texts at this level are often dense or lengthy,
and include continuous, non-continuous,
mixed, or multiple pages of text. Understanding
text and rhetorical structures become more
central to successfully completing tasks, espe-
cially navigating complex digital texts. Tasks
require the respondent to identify, interpret, or
evaluate one or more pieces of information,
and often require varying levels of inference.
Many tasks require the respondent to construct
meaning across larger chunks of text or per-
form multi-step operations in order to identify
and formulate responses. Often tasks also de-
mand that the respondent disregard irrelevant
or inappropriate content to answer accurately.
Competing information is often present, but it
is not more prominent than the correct infor-
mation.
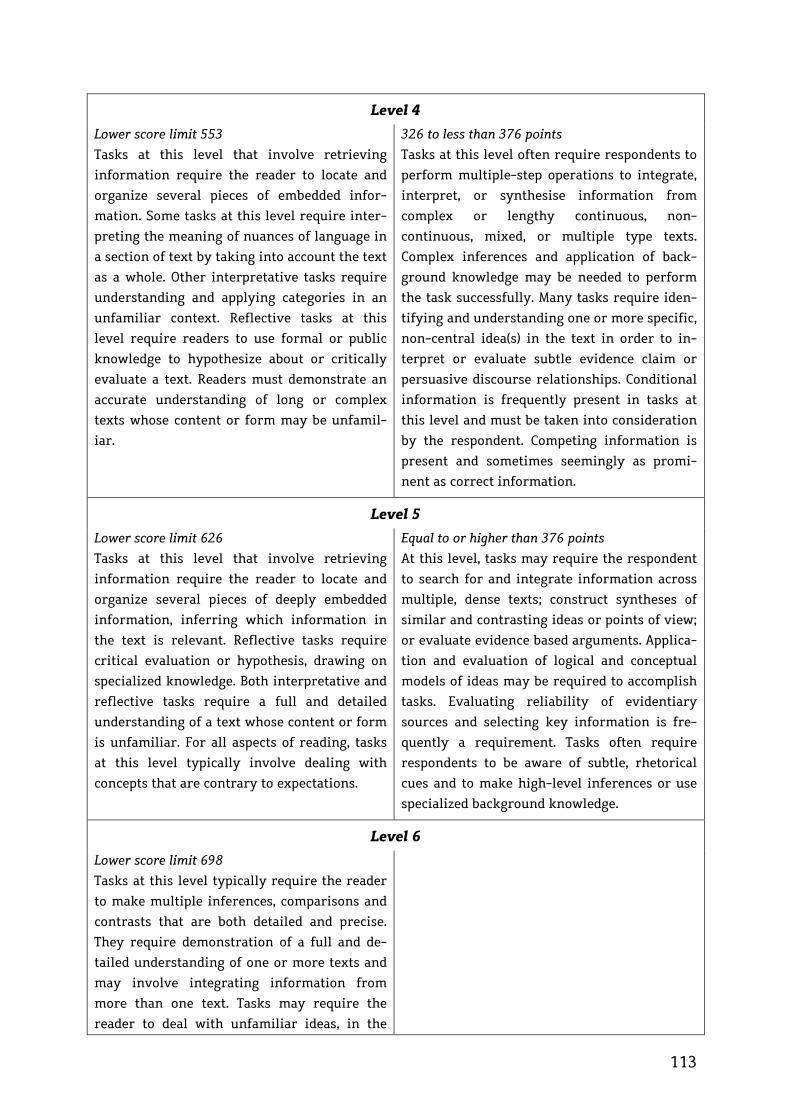
113
Level 4
Lower score limit 553
Tasks at this level that involve retrieving
information require the reader to locate and
organize several pieces of embedded infor-
mation. Some tasks at this level require inter-
preting the meaning of nuances of language in
a section of text by taking into account the text
as a whole. Other interpretative tasks require
understanding and applying categories in an
unfamiliar context. Reflective tasks at this
level require readers to use formal or public
knowledge to hypothesize about or critically
evaluate a text. Readers must demonstrate an
accurate understanding of long or complex
texts whose content or form may be unfamil-
iar.
326 to less than 376 points
Tasks at this level often require respondents to
perform multiple-step operations to integrate,
interpret, or synthesise information from
complex or lengthy continuous, non-
continuous, mixed, or multiple type texts.
Complex inferences and application of back-
ground knowledge may be needed to perform
the task successfully. Many tasks require iden-
tifying and understanding one or more specific,
non-central idea(s) in the text in order to in-
terpret or evaluate subtle evidence claim or
persuasive discourse relationships. Conditional
information is frequently present in tasks at
this level and must be taken into consideration
by the respondent. Competing information is
present and sometimes seemingly as promi-
nent as correct information.
Level 5
Lower score limit 626
Tasks at this level that involve retrieving
information require the reader to locate and
organize several pieces of deeply embedded
information, inferring which information in
the text is relevant. Reflective tasks require
critical evaluation or hypothesis, drawing on
specialized knowledge. Both interpretative and
reflective tasks require a full and detailed
understanding of a text whose content or form
is unfamiliar. For all aspects of reading, tasks
at this level typically involve dealing with
concepts that are contrary to expectations.
Equal to or higher than 376 points
At this level, tasks may require the respondent
to search for and integrate information across
multiple, dense texts; construct syntheses of
similar and contrasting ideas or points of view;
or evaluate evidence based arguments. Applica-
tion and evaluation of logical and conceptual
models of ideas may be required to accomplish
tasks. Evaluating reliability of evidentiary
sources and selecting key information is fre-
quently a requirement. Tasks often require
respondents to be aware of subtle, rhetorical
cues and to make high-level inferences or use
specialized background knowledge.
Level 6
Lower score limit 698
Tasks at this level typically require the reader
to make multiple inferences, comparisons and
contrasts that are both detailed and precise.
They require demonstration of a full and de-
tailed understanding of one or more texts and
may involve integrating information from
more than one text. Tasks may require the
reader to deal with unfamiliar ideas, in the

114
presence of prominent competing information,
and to generate abstract categories for inter-
pretations. Reflect and evaluate tasks may
require the reader to hypothesise about or
critically evaluate a complex text on an unfa-
miliar topic, taking into account multiple
criteria or perspectives, and applying sophisti-
cated understandings from beyond the text. A
salient condition for access and retrieve tasks
at this level is precision of analysis and fine
attention to detail that is inconspicuous in the
texts.

115
Discussion Papers of the Research Area President’s Project Group 2014
Talat Mahmood P 2014-004 Assessment of German-Pakistani relations in trade, investment and strategic cooperation
Jutta Allemendinger, Ellen von den Driesch P 2014-005 Social Inequalities in Europe: Facing the challenge.
Stefan Stuth, Marina Hennig P 2014-006 Ist der Beruf entscheidend? Zum Einfluss beruflicher Eigenschaften auf die Dauer familienbedingter Nichterwerbsphasen von Frauen
Stefan Stuth, Julia Schorlemmer, Marina Hennig, Jutta Allmendinger P 2014-007 Freiwilliges Engagement – ein Patentrezept für Wiedereinsteigerinnen?