Social and Economic Infrastructure Impacts on Economic ...€¦ · economic infrastructure lead...
38
1 Social and Economic Infrastructure Impacts on Economic Growth in South Africa C. Kularatne 1 ABSTRACT One of the key constraints to growth identified by the Accelerated Shared Growth Initiative (ASGI) in South Africa is investment in infrastructure. Analysis of the various measures of physical infrastructure provides one with a declining trend in infrastructure development over the recent past. Investment in economic infrastructure affects GVA directly and indirectly via private investment. There also exist feedback effects from GVA and private investment to investment in economic infrastructure. This implies that economic infrastructure investment responds to growth. Social infrastructure investment is found to have a direct, positive impact on GVA. Theoretical evidence does posit the belief that even though public and private capital may be complements, there may exist threshold effects present with respect to public infrastructure expenditure. The findings do allude to the possibility of a non-linear relationship existing between per capita output and social infrastructure investment. This threshold is not reached at 1.3% with regard to the social infrastructure net investment rate. The threshold between the private investment rate and net investment rate in economic infrastructure is not reached at 6%. This implies that the government can afford to invest (net) at least 1.3% and 6% in social and economic infrastructure, respectively. 1 School of Economics, University of Cape Town
Transcript of Social and Economic Infrastructure Impacts on Economic ...€¦ · economic infrastructure lead...
1
Social and Economic Infrastructure Impacts on Economic Growth in South Africa
C. Kularatne1
ABSTRACT
One of the key constraints to growth identified by the Accelerated Shared Growth Initiative
(ASGI) in South Africa is investment in infrastructure. Analysis of the various measures of
physical infrastructure provides one with a declining trend in infrastructure development over
the recent past. Investment in economic infrastructure affects GVA directly and indirectly via
private investment. There also exist feedback effects from GVA and private investment to
investment in economic infrastructure. This implies that economic infrastructure investment
responds to growth. Social infrastructure investment is found to have a direct, positive impact on
GVA. Theoretical evidence does posit the belief that even though public and private capital may
be complements, there may exist threshold effects present with respect to public infrastructure
expenditure. The findings do allude to the possibility of a non-linear relationship existing
between per capita output and social infrastructure investment. This threshold is not reached at
1.3% with regard to the social infrastructure net investment rate. The threshold between the
private investment rate and net investment rate in economic infrastructure is not reached at 6%.
This implies that the government can afford to invest (net) at least 1.3% and 6% in social and
economic infrastructure, respectively.
1 School of Economics, University of Cape Town

2
1 INTRODUCTION
South Africa is seeking to accelerate her growth rate in order to provide greater social and
economic benefits to a wider section of her population. The Accelerated Shared Growth
Initiative for South Africa (Asgi-SA) document outlines six salient topics that need immediate
address - one of which is investment in infrastructure. Targeting of infrastructure expenditure is
crucial as one of the key constraints to growth given the fact that the relative logistics cost of
South Africa (15% of GDP) versus those of its trading partners (8.5% of GDP).2
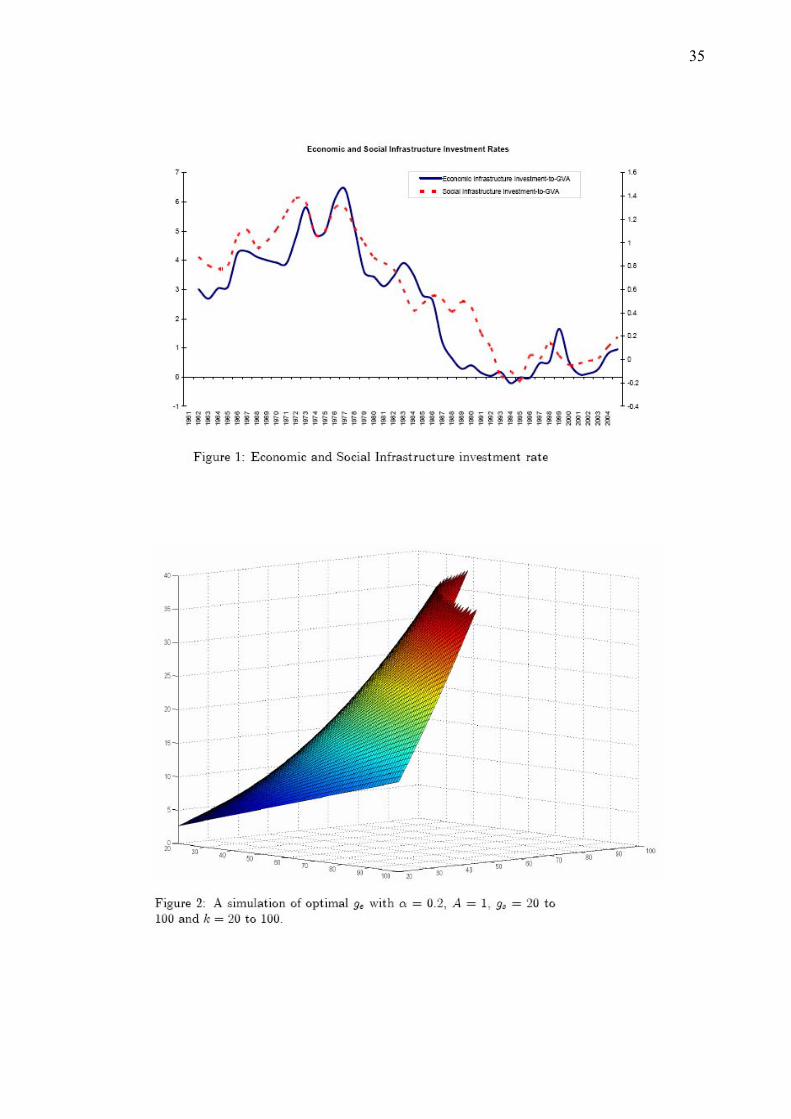
This puts South Africa at an immediate competitive disadvantage. Moreover, Figure I depicts
government net investment rates in both economic and social infrastructure have been declining
over the last few years.3
The extensive capital expenditure program the government is currently undertaking is aimed at
improving and increasing both the efficiency and network of country-wide infrastructure needs
of the economy. In the same vein, the SA Cabinet has given its approval for Eskom and
Transnet to undertake approximately R121-billion worth of investment by 2010 with a private
sector target of R44-billion for both sectors -- R23-billon for the energy system and an
additional R21-billion for transport. It is estimated that approximately R107-billion would be
needed between 2005 and 2009 to meet South Africa's growing energy needs. Eskom plans to
meet 70% of this requirement, implying an investment of R84-billion over the next five years
with the balance reserved for possible Independent Power Producer (IPP) entrants.4 The
planned rate of growth of the capital budget of government at between 15% and 20% per year is
unprecedented in South African history.
A plethora of studies have highlighted the importance of investment in infrastructure on
growth. Infrastructure investment is deemed to increase the growth potential of an economy by
increasing the economy's productive capacity. This may be borne by affecting output directly
2 See Economic Infrastructure Framework Report (2005), Department of Trade and Industry. 3 Infrastructure investment rates are calculated by obtaining the first difference of capital stock used in economic and social infrastructure as a percentage of Gross Value-Added (GVA). Capital stock data on public infrastructure is obtained from the SA Reserve Bank (SARB). The SARB provides capital stock figures net of depreciation. Allowance for depreciation of capital stock is generated by the SARB depending on the type of asset. 4 See "R165bn power, transport capex plan unveiled", Engineering News, 26 October 2004.
3
(as additional factor of production) or indirectly (increasing the productivity of private capital).
This implies that productive infrastructure and private capital are "complements" in production.5
Thus, a rise in infrastructure capital raises the marginal productivity of private capital services
so that, given the rental price of such services, a larger flow of private capital services and a
larger stock of private assets producing them are demanded. The rise in the marginal product of
capital increases private capital formation, raising private sector output further.
The indirect effect of a rise in infrastructure capital on private output, however, is not
necessarily positive. In fact, this effect can be negative if infrastructure and private capital are
"substitutes". This is characterised by two opposing forces. On the one hand, infrastructure
capital enhances the productivity of private capital, raising its rate of return and encouraging
more investment. On the other hand, from the investor's perspective, infrastructure capital acts
as a substitute for private capital and "crowds out" private investment. One needs to test
empirically when private and infrastructure stocks are complements or substitutes by estimating
a system of equations that highlights the complex webs of association between private and
public capital. This is crucial in understanding the role played by public capital in enhancing
growth. Moreover, this analysis needs to be taken on a country-by-country basis because the
various peculiarities of each economy determine if public and private capital are complements
or substitutes.
South Africa, being a middle-income country, provides an excellent case study on the impact
of infrastructure on growth in aiding such transition economies. To what extent does social and
economic infrastructure lead growth or is it merely responding to increasing growth rates as
these transition economies attain higher growth paths. Given the fact that SA is currently
embarking on increasing expenditure on economic infrastructure, there have been some studies
done on the impact of infrastructure expenditure on growth. This paper argues that even though
public and private capital may be complements, this may not be borne out by the econometric
results if there exists threshold effects present with respect to public infrastructure expenditure.
The paper tests for the possibility of a non-linear relationship existing between per capita output
and economic infrastructure expenditure likely for South Africa.6 Furthermore, a principle
5 See Gramlich (1994) for a review of the main studies about the impact of infrastructure investment. 6 Mariotti (2002) finds a non-linear relationship beween government consumption expenditure and GDP in SA.

4
component analysis is conducted on various measures of physical infrastructure to draw a
picture of actual physical infrastructure created over the years. Given that infrastructure
development in SA has occurred in stages (by type of physical infrastructure) over the decades,
this index should provide one with a picture of the trends in infrastructure development over the
recent past.
This paper proceeds as follows: Section 2 provides a theoretical exposition of the model
together with an overview of the literature; Section 3 provides a brief historical review of the
development of economic and social infrastructure in South Africa; Section 4 discusses the
econometric methodology employed in the analysis; Section 5 will discuss the results of two
models - one which excludes threshold effects and one which does not; and lastly Section 6
provides the conclusion and policy implications of this study.
2. IMPACT OF ECONOMIC AND SOCIAL INFRASTRUCTURE ON GROWTH
2.1 Theoretical Background
The paper adapts the Barro (1990) theoretical model to underpin the interaction of economic
and social infrastructure on growth. This model aims to disentangle the impact public sector
infrastructure investment from private sector investment in capital stock (k). From the
theoretical literature, investment in infrastructure is argued to raise the marginal product of
private capital used in production. A nuance this paper attaches to the Barro model (1990) is the
inclusion of public investment in social infrastructure. Thus the paper is considering an
economy in which infrastructure (economic7and social8) is used in the production of final output
and is financed by a tax on output.
Assume the existence of an endogenous growth model (similar to Barro (1990)) in which the
government owns no capital and does not produce services but acquires private-sector output in
order to provide (economic and social) productive services, which serve as inputs into the
private-sector production process. The services are purchased under a balanced budget
7 Economic infrastucture represents items such as roads, bridges, dams, electricity and water supply. 8 Social infrastructure represents items such as schools and hospitals.
5
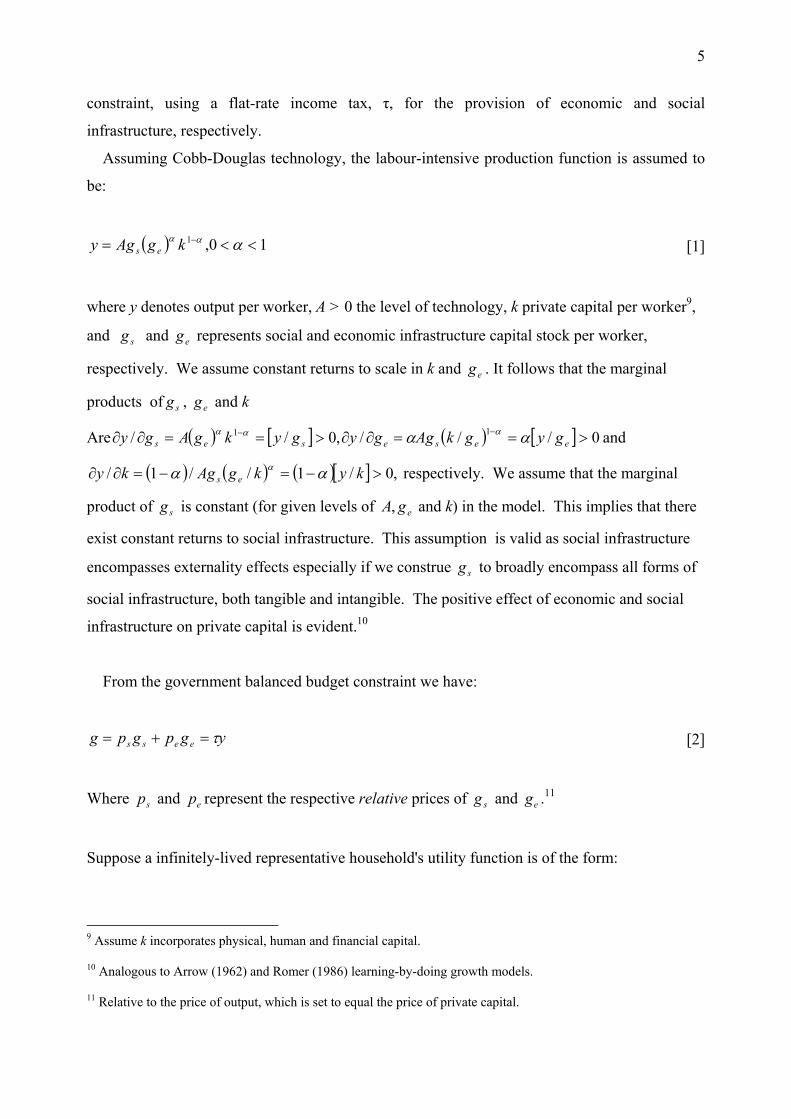
constraint, using a flat-rate income tax, τ, for the provision of economic and social
infrastructure, respectively.
Assuming Cobb-Douglas technology, the labour-intensive production function is assumed to
be:
( ) 10,1 <<= − ααα kgAgy es [1]
where y denotes output per worker, A > 0 the level of technology, k private capital per worker9,
and sg and eg represents social and economic infrastructure capital stock per worker,
respectively. We assume constant returns to scale in k and eg . It follows that the marginal
products of sg , eg and k
Are ( ) [ ] ( ) [ ] 0///,0// 11 >==∂∂>==∂∂ −−eeseses gygkAggygykgAgy αα ααα and
( ) ( ) ( )[ ] ,0/1//1/ >−=−=∂∂ kykgAgky es αα α respectively. We assume that the marginal
product of sg is constant (for given levels of egA, and k) in the model. This implies that there
exist constant returns to social infrastructure. This assumption is valid as social infrastructure
encompasses externality effects especially if we construe sg to broadly encompass all forms of
social infrastructure, both tangible and intangible. The positive effect of economic and social
infrastructure on private capital is evident.10
From the government balanced budget constraint we have:
ygpgpg eess τ=+= [2]
Where sp and ep represent the respective relative prices of sg and eg .11
Suppose a infinitely-lived representative household's utility function is of the form:
9 Assume k incorporates physical, human and financial capital. 10 Analogous to Arrow (1962) and Romer (1986) learning-by-doing growth models. 11 Relative to the price of output, which is set to equal the price of private capital.
6
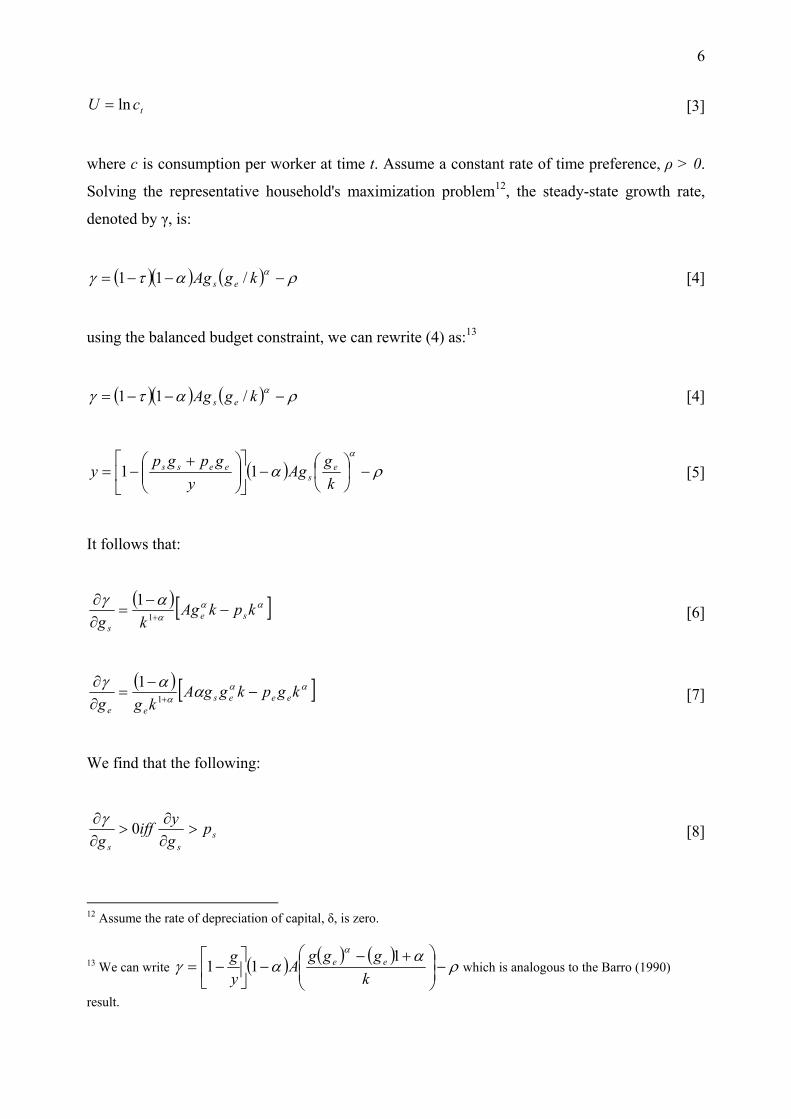
tcU ln= [3]
where c is consumption per worker at time t. Assume a constant rate of time preference, ρ > 0.
Solving the representative household's maximization problem12, the steady-state growth rate,
denoted by γ, is:
( )( ) ( ) ρατγ α −−−= kgAg es /11 [4]
using the balanced budget constraint, we can rewrite (4) as:13
( )( ) ( ) ρατγ α −−−= kgAg es /11 [4]
( ) ραα
−⎟⎠⎞
⎜⎝⎛−⎥
⎦
⎤⎢⎣
⎡⎟⎟⎠
⎞⎜⎜⎝
⎛ +−=
kg
Agy
gpgpy e
seess 11 [5]
It follows that:
( ) [ ]ααα
αγ kpkAgkg se
s
−−
=∂∂
+1
1 [6]
( ) [ ]ααα ααγ kgpkggA
kgg eeesee
−−
=∂∂
+1
1 [7]
We find that the following:
sss
pgyiff
g>
∂∂
>∂∂ 0γ [8]
12 Assume the rate of depreciation of capital, δ, is zero.
13 We can write ( ) ( ) ( )ρ
ααγ
α
−⎟⎟⎠
⎞⎜⎜⎝
⎛ +−−⎥
⎦
⎤⎢⎣
⎡−=
kggg
Ayg ee 1
11 which is analogous to the Barro (1990)
result.
7
eee
pgyiff
g>
∂∂
>∂∂ 0γ [9]
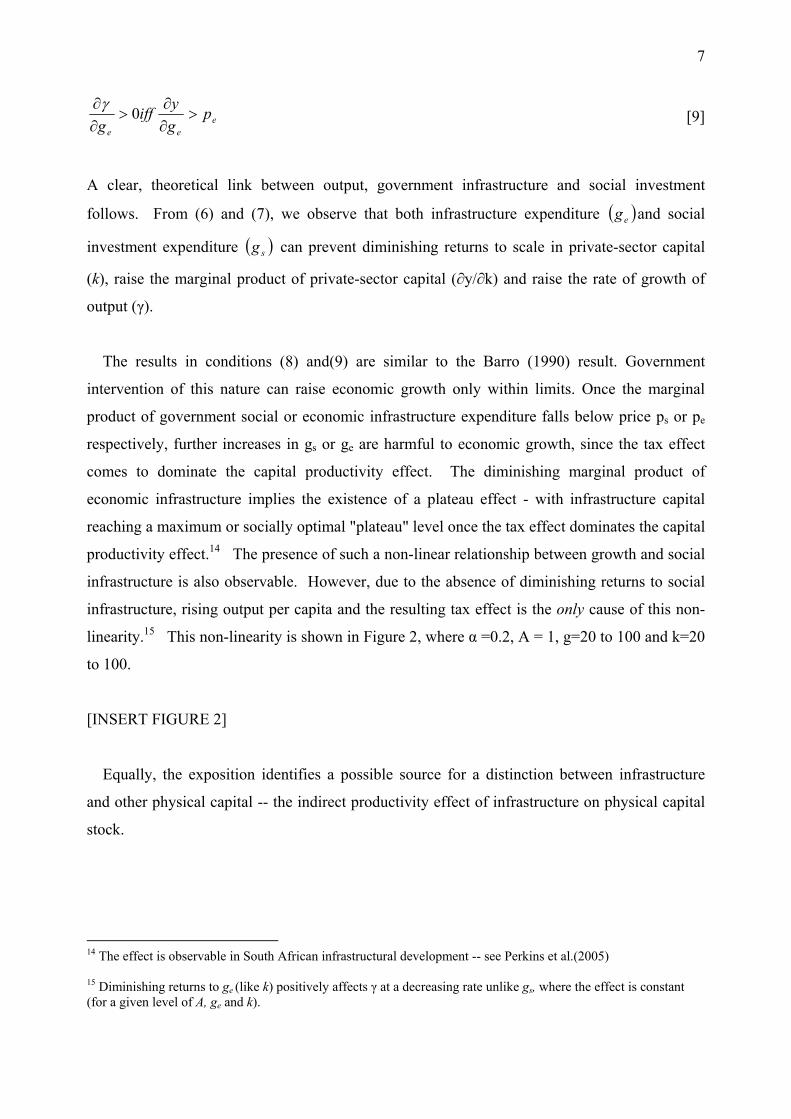
A clear, theoretical link between output, government infrastructure and social investment
follows. From (6) and (7), we observe that both infrastructure expenditure ( )eg and social
investment expenditure ( )sg can prevent diminishing returns to scale in private-sector capital
(k), raise the marginal product of private-sector capital (∂y/∂k) and raise the rate of growth of
output (γ).
The results in conditions (8) and(9) are similar to the Barro (1990) result. Government
intervention of this nature can raise economic growth only within limits. Once the marginal
product of government social or economic infrastructure expenditure falls below price ps or pe
respectively, further increases in gs or ge are harmful to economic growth, since the tax effect
comes to dominate the capital productivity effect. The diminishing marginal product of
economic infrastructure implies the existence of a plateau effect - with infrastructure capital
reaching a maximum or socially optimal "plateau" level once the tax effect dominates the capital
productivity effect.14 The presence of such a non-linear relationship between growth and social
infrastructure is also observable. However, due to the absence of diminishing returns to social
infrastructure, rising output per capita and the resulting tax effect is the only cause of this non-
linearity.15 This non-linearity is shown in Figure 2, where α =0.2, A = 1, g=20 to 100 and k=20
to 100.
[INSERT FIGURE 2]
Equally, the exposition identifies a possible source for a distinction between infrastructure
and other physical capital -- the indirect productivity effect of infrastructure on physical capital
stock.
14 The effect is observable in South African infrastructural development -- see Perkins et al.(2005) 15 Diminishing returns to ge (like k) positively affects γ at a decreasing rate unlike gs, where the effect is constant (for a given level of A, ge and k).
8
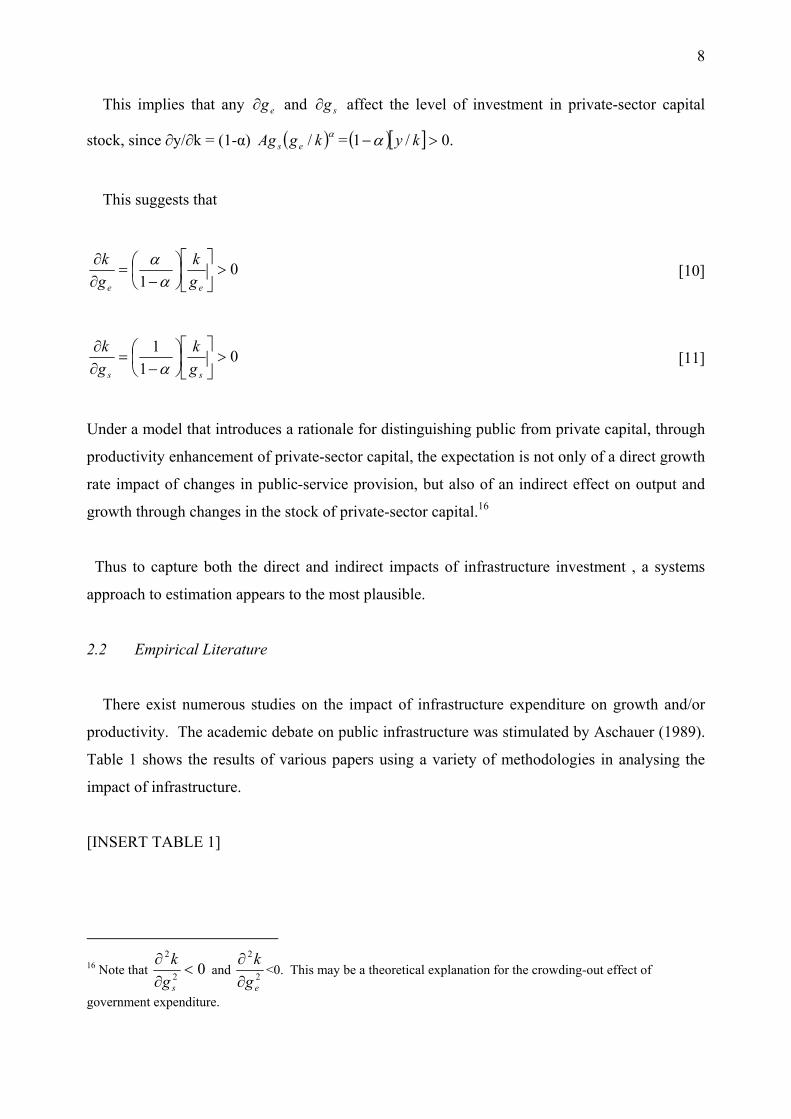
This implies that any eg∂ and sg∂ affect the level of investment in private-sector capital
stock, since ∂y/∂k = (1-α) ( )αkgAg es / = ( )[ ] .0/1 >− kyα
This suggests that
01
>⎥⎦
⎤⎢⎣
⎡⎟⎠⎞
⎜⎝⎛−
=∂∂
ee gk
gk
αα [10]
01
1>⎥
⎦
⎤⎢⎣
⎡⎟⎠⎞
⎜⎝⎛−
=∂∂
ss gk
gk
α [11]
Under a model that introduces a rationale for distinguishing public from private capital, through
productivity enhancement of private-sector capital, the expectation is not only of a direct growth
rate impact of changes in public-service provision, but also of an indirect effect on output and
growth through changes in the stock of private-sector capital.16
Thus to capture both the direct and indirect impacts of infrastructure investment , a systems
approach to estimation appears to the most plausible.
2.2 Empirical Literature
There exist numerous studies on the impact of infrastructure expenditure on growth and/or
productivity. The academic debate on public infrastructure was stimulated by Aschauer (1989).
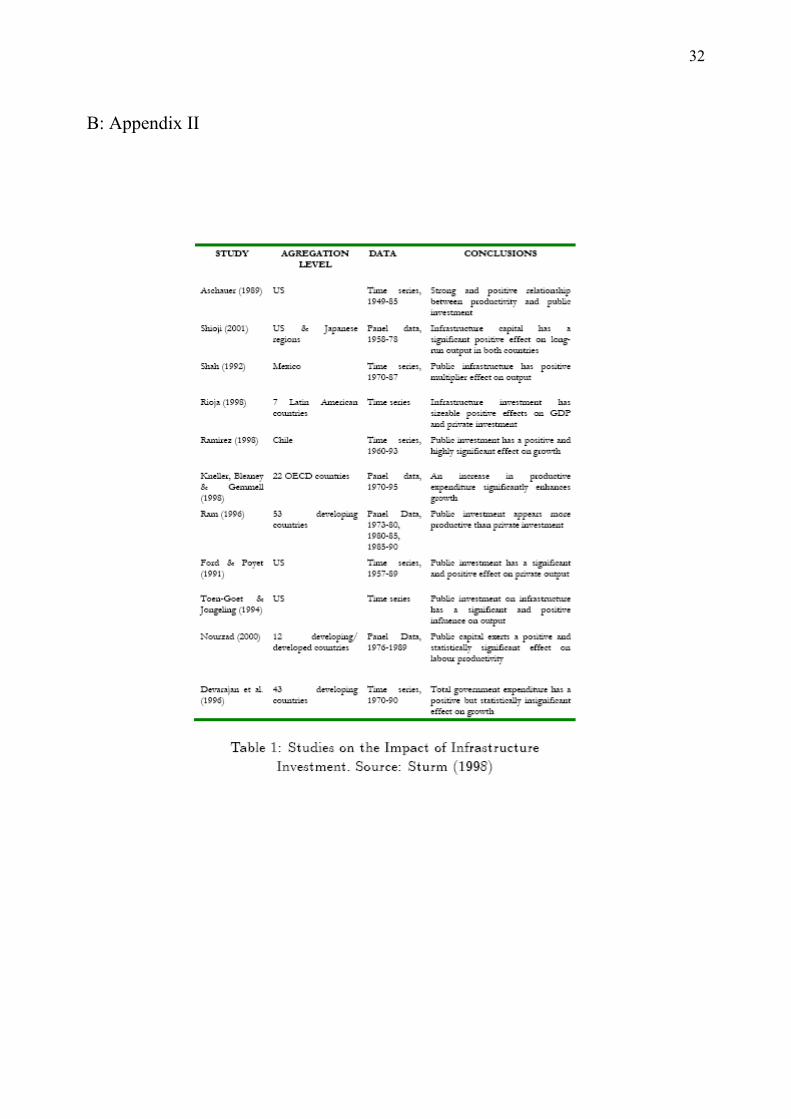
Table 1 shows the results of various papers using a variety of methodologies in analysing the
impact of infrastructure.
[INSERT TABLE 1]
16 Note that 02
2
<∂∂
sgk
and 2
2
egk
∂∂
<0. This may be a theoretical explanation for the crowding-out effect of
government expenditure.
9
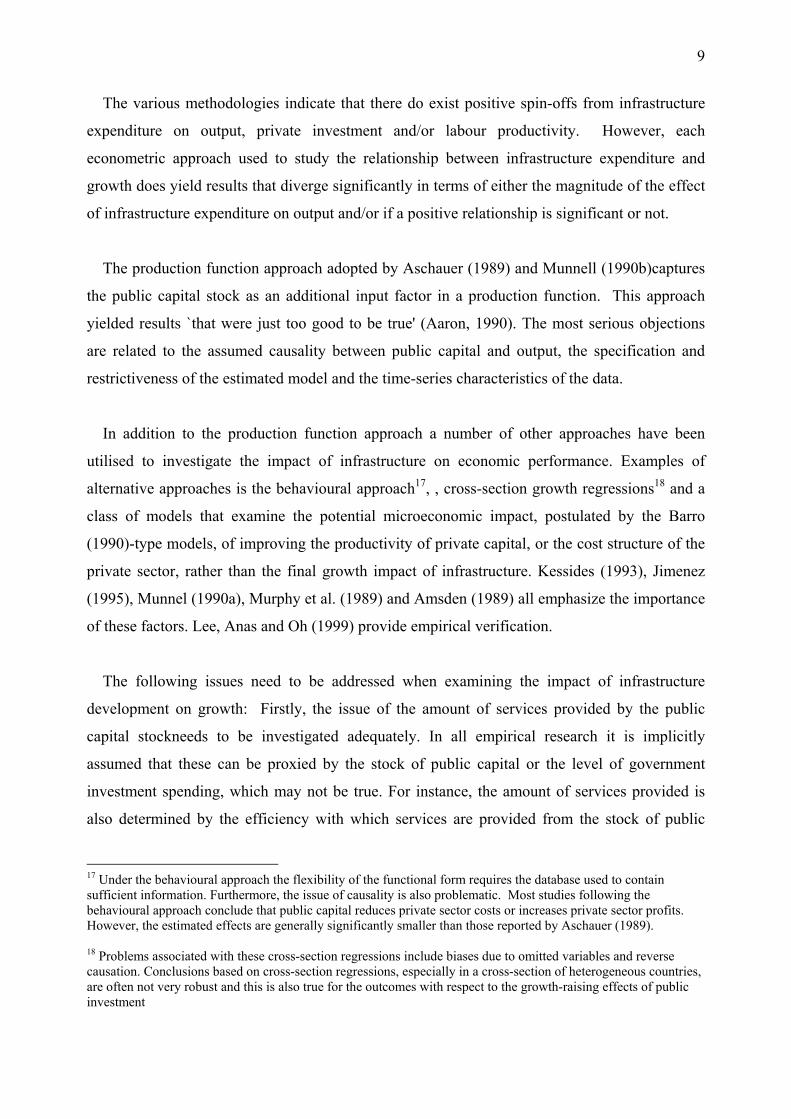
The various methodologies indicate that there do exist positive spin-offs from infrastructure
expenditure on output, private investment and/or labour productivity. However, each
econometric approach used to study the relationship between infrastructure expenditure and
growth does yield results that diverge significantly in terms of either the magnitude of the effect
of infrastructure expenditure on output and/or if a positive relationship is significant or not.
The production function approach adopted by Aschauer (1989) and Munnell (1990b)captures
the public capital stock as an additional input factor in a production function. This approach
yielded results `that were just too good to be true' (Aaron, 1990). The most serious objections
are related to the assumed causality between public capital and output, the specification and
restrictiveness of the estimated model and the time-series characteristics of the data.
In addition to the production function approach a number of other approaches have been
utilised to investigate the impact of infrastructure on economic performance. Examples of
alternative approaches is the behavioural approach17, , cross-section growth regressions18 and a
class of models that examine the potential microeconomic impact, postulated by the Barro
(1990)-type models, of improving the productivity of private capital, or the cost structure of the
private sector, rather than the final growth impact of infrastructure. Kessides (1993), Jimenez
(1995), Munnel (1990a), Murphy et al. (1989) and Amsden (1989) all emphasize the importance
of these factors. Lee, Anas and Oh (1999) provide empirical verification.
The following issues need to be addressed when examining the impact of infrastructure
development on growth: Firstly, the issue of the amount of services provided by the public
capital stockneeds to be investigated adequately. In all empirical research it is implicitly
assumed that these can be proxied by the stock of public capital or the level of government
investment spending, which may not be true. For instance, the amount of services provided is
also determined by the efficiency with which services are provided from the stock of public
17 Under the behavioural approach the flexibility of the functional form requires the database used to contain sufficient information. Furthermore, the issue of causality is also problematic. Most studies following the behavioural approach conclude that public capital reduces private sector costs or increases private sector profits. However, the estimated effects are generally significantly smaller than those reported by Aschauer (1989). 18 Problems associated with these cross-section regressions include biases due to omitted variables and reverse causation. Conclusions based on cross-section regressions, especially in a cross-section of heterogeneous countries, are often not very robust and this is also true for the outcomes with respect to the growth-raising effects of public investment
10
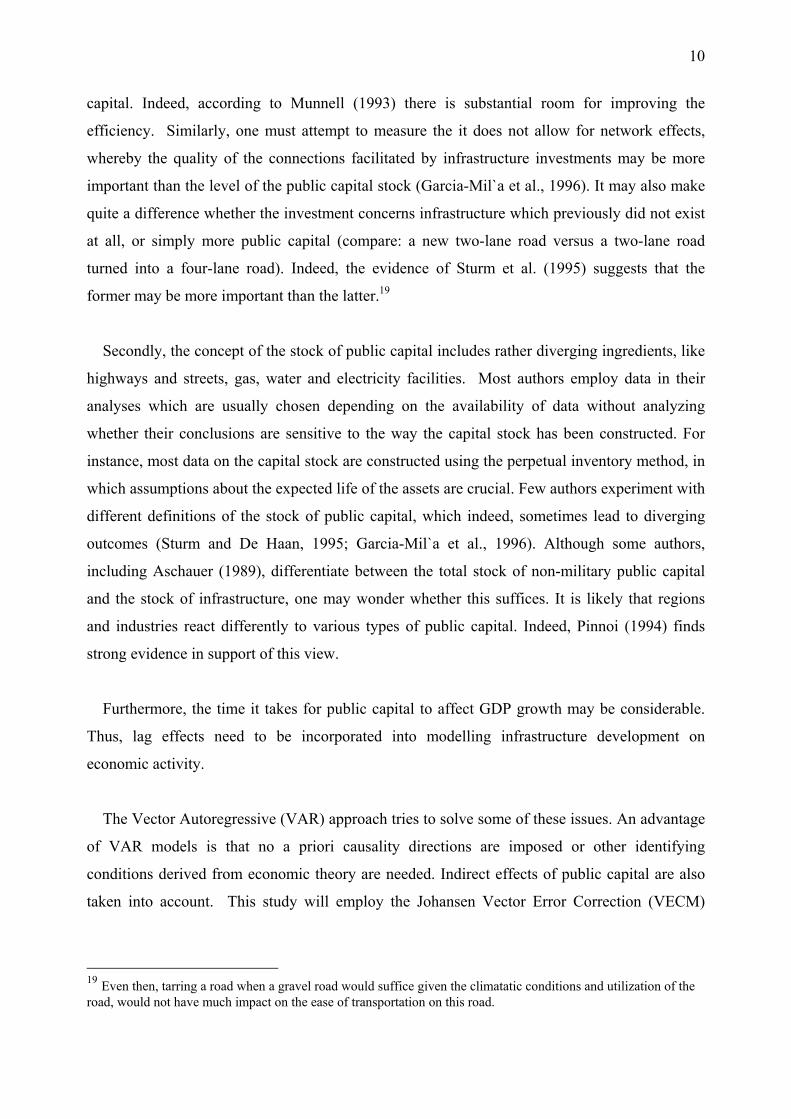
capital. Indeed, according to Munnell (1993) there is substantial room for improving the
efficiency. Similarly, one must attempt to measure the it does not allow for network effects,
whereby the quality of the connections facilitated by infrastructure investments may be more
important than the level of the public capital stock (Garcia-Mil`a et al., 1996). It may also make
quite a difference whether the investment concerns infrastructure which previously did not exist
at all, or simply more public capital (compare: a new two-lane road versus a two-lane road
turned into a four-lane road). Indeed, the evidence of Sturm et al. (1995) suggests that the
former may be more important than the latter.19
Secondly, the concept of the stock of public capital includes rather diverging ingredients, like
highways and streets, gas, water and electricity facilities. Most authors employ data in their
analyses which are usually chosen depending on the availability of data without analyzing
whether their conclusions are sensitive to the way the capital stock has been constructed. For
instance, most data on the capital stock are constructed using the perpetual inventory method, in
which assumptions about the expected life of the assets are crucial. Few authors experiment with
different definitions of the stock of public capital, which indeed, sometimes lead to diverging
outcomes (Sturm and De Haan, 1995; Garcia-Mil`a et al., 1996). Although some authors,
including Aschauer (1989), differentiate between the total stock of non-military public capital
and the stock of infrastructure, one may wonder whether this suffices. It is likely that regions
and industries react differently to various types of public capital. Indeed, Pinnoi (1994) finds
strong evidence in support of this view.
Furthermore, the time it takes for public capital to affect GDP growth may be considerable.
Thus, lag effects need to be incorporated into modelling infrastructure development on
economic activity.
The Vector Autoregressive (VAR) approach tries to solve some of these issues. An advantage
of VAR models is that no a priori causality directions are imposed or other identifying
conditions derived from economic theory are needed. Indirect effects of public capital are also
taken into account. This study will employ the Johansen Vector Error Correction (VECM)
19 Even then, tarring a road when a gravel road would suffice given the climatatic conditions and utilization of the road, would not have much impact on the ease of transportation on this road.

11
approach20 to estimate the impact of social and economic infrastructure expenditure on per
capita gross value-added (GVA) for South Africa.21
A variety of studies on the impact of infrastructure expenditure on growth have been
conducted on South African data. One such study was instituted by the Development Bank of
Southern Africa (DBSA). Its report highlights three sets of econometric results for South
African data, all of which employ Cobb-Douglas production function specifications. The
DBSA's own study relates to the period 1967--1996, and controls for time and capacity
utilization. The results indicate a strong, positive relationship between public-sector capital and
output, although the ordinary least squares (OLS) estimates are spurious (elasticity of
approximately 0.3). Using Engle-Granger cointegration estimation, the DBSA study also finds
strong crowding-in effects of infrastructure on private-sector non-residential investment.
Fedderke et al. (2005) show that causality between infrastructure investment and economic
growth appears to run in both directions. Specifically, they find a forcing relationship running
from infrastructure fixed capital stock to GDP suggesting that infrastructure leads growth,
though they also find evidence of potential simultaneity between infrastructure and output (GDP
and locomotives; GDP and goods stock; goods vehicles and GDP; GDP and electricity), of
output leading infrastructure (GDP and railway lines; GDP and coaching stock; GDP and rail
passenger journeys; GDP and port cargo; GDP and SAA passengers; GDP and fixed phone
lines), and of no association at all (GDP and rail carrying capacity; GDP and rail freight; GDP
and international air passengers). Fedderke et al. (2005) find weak evidence of feedback from
output to infrastructure. In contrast, they find a strong evidence of infrastructure growth leading
economic growth. Moreover, Bogeti´c et al. (2005), using panel data for the SA manufacturing
sector, find empirical links between infrastructure and productivity. Specifically, infrastructure
affects output directly, while it exerts more limited impact on factor productivity.
Summarizing, we come up with the following conclusions:
1. Public capital probably enhances economic growth; and
20 See Section 4.3 for a detailed description of this approach. 21 In this paper, the term gross value-added (GVA) will be interchanged with gross domestic product (GDP) to imply one in the same.

12
2. We are less certain about the magnitude of the effect and direction of association
between infrastructure and growth.
3 ECONOMIC AND SOCIAL INFRASTRUCTURE: A BRIEF HISTORY IN SA
The South African Reserve Bank (SARB) publishes the economic infrastructure component
of gross fixed capital formation for general government and public corporations. Examples of
public corporations are Transnet (transport services such as rail and air), Eskom (electricity),
and Telkom (until its listing in March 2003; Telkom provides telephone services). However,
their has been a reclassification of these corporations from general government to public
corporations. Consequently, the analysis which follows treats economic infrastructure of
general government and public corporations together under the expression `public sector'.22
Apart from the national accounts data, the data set on which our analysis is based was compiled
largely from the statistical publications of Statistics South Africa and its predecessors.
Unfortunately the publication of most of the time series relating to infrastructure (e.g. rail, roads,
ports, air travel, telephones) was discontinued by Statistics South Africa in the late 1980s and
1990s.23
National accounts data reveals that government investment in infrastructure has been
declining over the last few years, leading to low levels of gross fixed capital formation (GFCF)
and GDP performance. This has been exacerbated by poor coherence and coordination regarding
economic infrastructure by the relevant government departments.
Reference below to infrastructure in the context of the national accounts denotes public sector
economic infrastructure. As indicated in Section 1, economic infrastructure includes transport,
communication, power, water and sanitation systems. Social infrastructure (e.g. schools and
hospitals) is also included in this analysis. The national accounts data are expressed in constant
22 The capital stock data on economic and social infrastructure (obtained from the SARB) includes depreciation. The SARB allows for depreciation by assuming a contant linear rate of depreciation as per asset type. The original infrastructure capital stock data is obtained by the SARB from Statistics South Africa. SARB then recategorises the data into economic and social infrastructure capital stock. 23 Data was obtained from Perkins (2003). For the purpose of this study, data was also updated from a variety of organisations involved with the collection of these data series.
13
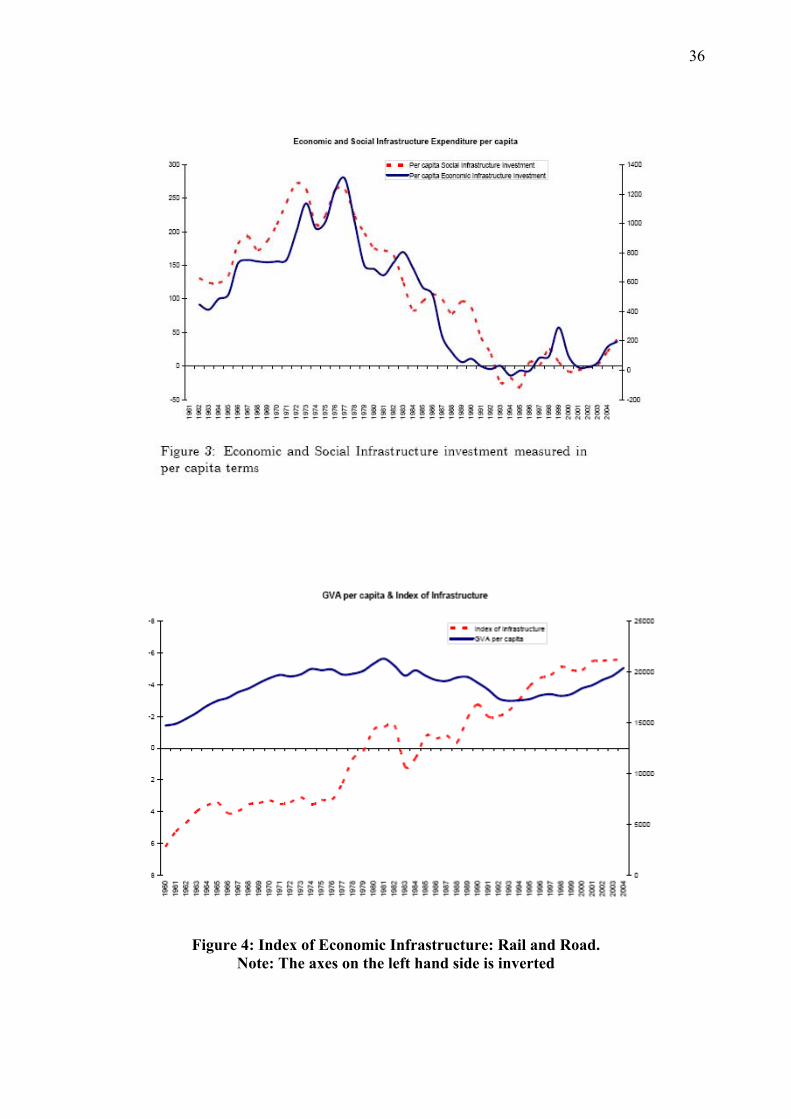
2000 prices. Figure 3 shows indices of both of these measured per capita, and both demonstrate
a long-term deterioration: from the mid-1970s.
[INSERT FIGURE 3]
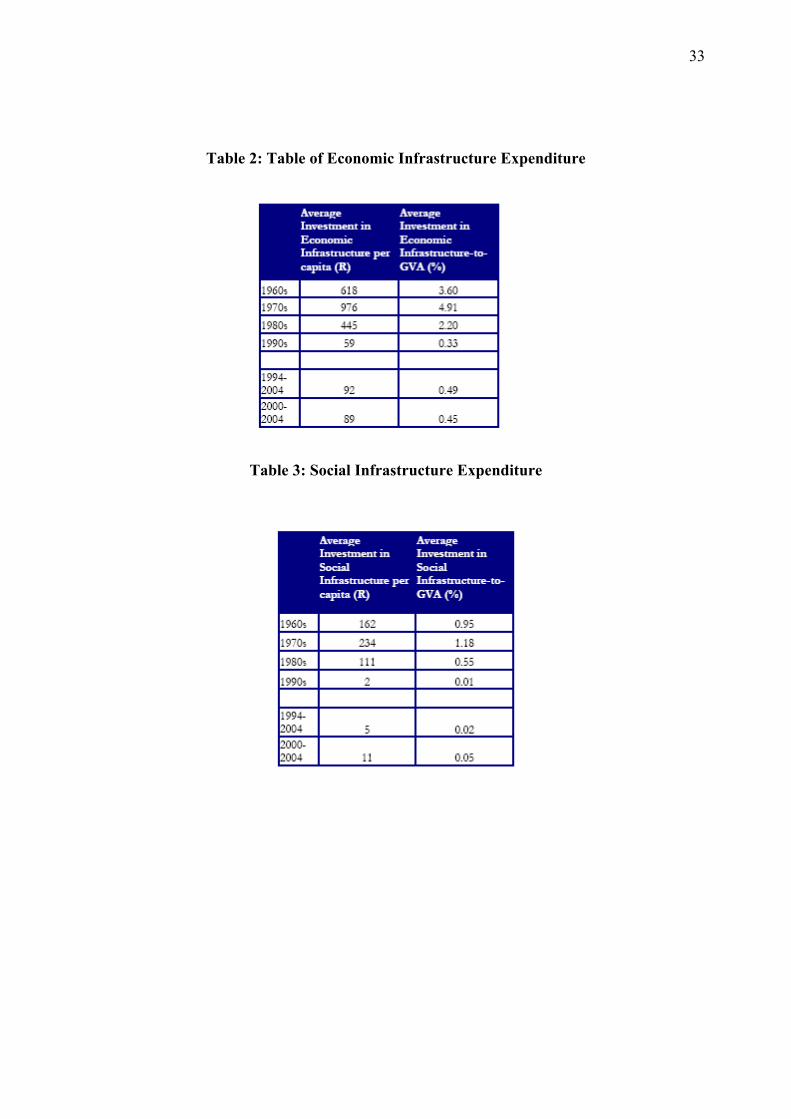
Net investment in economic infrastructure per capita fell from R1,304 in 1976 to R52 in 2002
(in 2000 prices), a collapse of 96 percent.24
Investment rates in net economic infrastructure expenditure (for this period) fell from 6.5
percent of GVA to 0.3 percent of GVA, which lies well below the international benchmark of
approximately three to six per cent identified by Kessides (1993). In 2002, 72% of public-sector
infrastructure investment consisted of transport, communication, power and water. The recovery
of infrastructure investment in the 1990s and the subsequent slump were mainly the result of
expansion programs by the telephone (Telkom) and electricity (Eskom) utilities to extend
telephone lines and electricity to areas which were under-serviced, and the purchase of new
aircraft by the national carrier (South African Airways) (SARB annual economic reports, 1996--
2000).
[INSERT TABLE 2]
The decline in infrastructure investment between the mid-1970s and 2002 was part of an
overall decline in gross fixed capital formation (GFCF) over the same period. As a percentage of
GDP, South Africa's gross savings also fell during the 1980s and 1990s. Falling infrastructure
investment may also have been a response to overcapacity in certain areas (Merrifield, 2000).
Perkins (2003) provides a comprehensive description of particular economic infrastructure
developments in South Africa since 1875. Perkins (2003) provides an extensive data set of
different measures of physical infrastructure for SA. Some of these series are used in this paper
to create an index of infrastructure expenditure. The first wave of infrastructure development
was railways over the 1875--1930 period, after which there was little change in the route-
kilometre railway line distance -- though rolling stock continued to increase. The second wave
24 For the purposes of this study, investment is calculated as the change in real fixed capital stock, taking account of depreciation.
14
in infrastructure investment was in inter-city roads, which tapered off around 1940, after which
the focus was on the paving of national and provincial roads. In the 1920s and 1930s growth in
road traffic far exceeded growth in rail transport, and with the paving of roads after 1940 road
traffic continued to grow faster than rail for the rest of the century. While ports constitute South
Africa's oldest form of infrastructure, substantial expansion in port capacity was limited to the
1970s through the construction of two new ports, doubling the volume of cargo handled. The
final phase of infrastructure development was in telephones and electricity. While the average
growth rate for fixed phone lines dropped in the 1960s, it rose again in response to the
introduction of information and cell phone technology.
A number of implications follow from the descriptive evidence. Firstly, South Africa's stock
of economic infrastructure has developed in stages -- with a series of sequential periods of
infrastructure roll-out. Thus creating an index of physical infrastructure capital stock, one may
be able to get a more comprehensive picture of the role economic infrastructure plays in
development.25
An index of capacity utilization of railroad and road infrastructure was created. The index
incorporates different measures of rail infrastructure26 per ton of freight and road infrastructure
(both paved and unpaved) per vehicle. Figure 4 indicates a declining trend. This may either
imply that infrastructure capacity is declining or that infrastructure is being more efficiently
used. More kilometres of road does not necessarily imply improvements in infrastructure.
Roads in SA in the 1970s were being altered so that vehicular transportation may be more
efficiently utilized. Thus economic growth thus appears to provide both the need for, and the
resources to fund, various types of infrastructure. It is plausible that phases of infrastructure
development took place both in response to changes in the structure of the economy, while also
impacting on economic performance in their own right.
[INSERT FIGURE 4]
25 This may be the reason why Fedderke et al. (2005) only finds some measures of physical infrastructure to have a positive effect over the anlaysed sample period. 26Rail infrastructure measures include railway lines, locomotives and coaching stock.

15
Fedderke et al. (2005) also finds that South Africa's economic infrastructure developed
rapidly from the mid-1870s to the mid-1970s27, but this was followed by a sharp slowdown from
the late-1970s to 200228. The papers finds a significant long-run relationship between
infrastructure and GDP in South Africa. More specifically, the results indicate that South
Africa's GDP growth tends to drive growth in individual measures of infrastructure-related
goods and services. International evidence suggests that there is a strong correlation between
fixed investment and GDP growth. Countries such as Malaysia, South Korea and Chile have
kept GDI as a percentage of GDP at levels higher than 20% for the last two decades and have
experienced relatively strong and consistent growth.
Social infrastructure net investment per capita also decline from R263 in 1976 to R2 in 2002,
representing a decline of 99%. As a proportion of GDP, social infrastructure expenditure in
2004 was 0.2% of GVA. There has been a renewed effort from year 2000 to increase social
infrastructure investment expenditure. This is evident clearly evident from Figure 3 with social
infrastructure per capita rising to R39 in 2004.29 From Table 3 an exponential increase in social
infrastructure expenditure is evident from 2000 onwards.
[INSERT TABLE 3]
This is in line with the government's renewed efforts to ensure its social obligations are met
from 2000 onwards. The government has been on a campaign to use its favourable fiscal
position to generate social infrastructure, with a special emphasis on the rural areas.
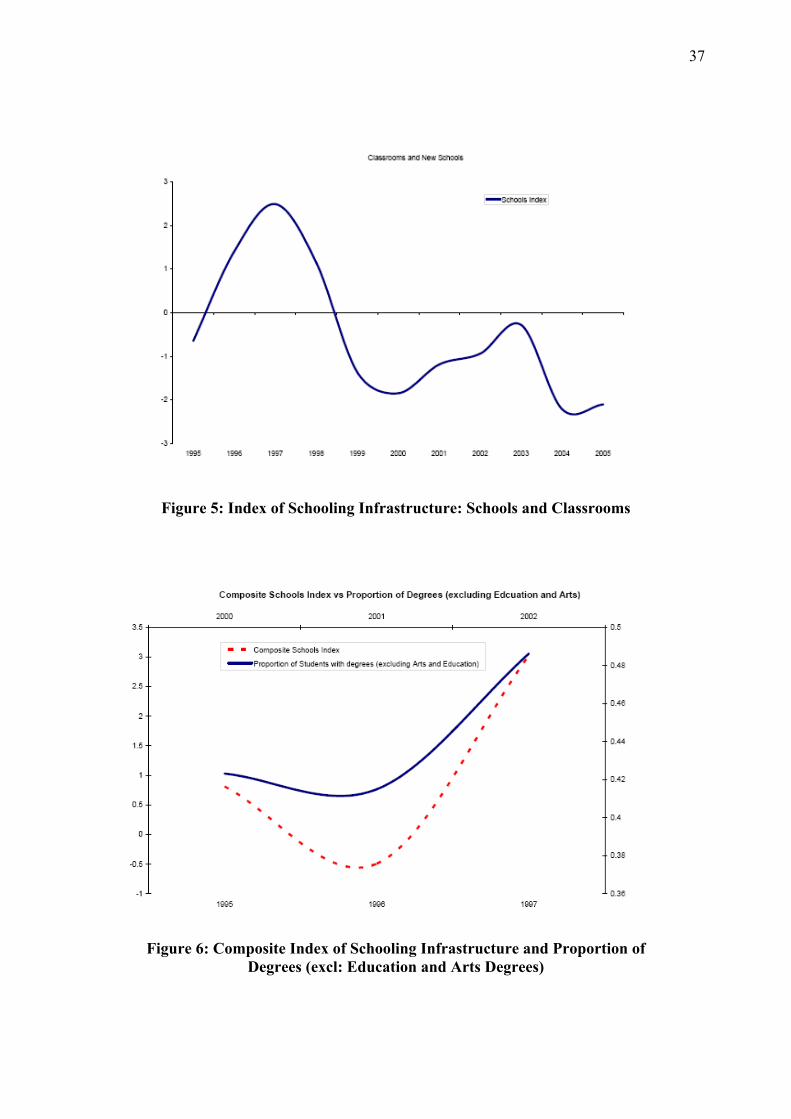
Furthermore, Figure 5 depicts an index composing of new schools and classrooms built from
1995-2005.
[INSERT FIGURE 5]
27 The early boom in South Africa's infrastructure development was led by a need in the mining sector for adequate infrastructure to transport its factor inputs to the mines and its mineral output to the market. 28 The slowdown in infrastucture development between the mid-1970s to 2002 was accompanied by a decline in the country's savings and total investment rates. Furthermore, the share of government consumption in the economy grew. Government resources were redirected from investment to consumption, whilst during the 1990s, fiscal consolidation became a priority. In both cases, this had an adverse impact on infrastructure expenditure. 29 Recall that investment in social infrastructure is measured by change in capital stock. For the years 1999 to 2001, the change in real capital stock for social infrastructure is negative. This is because the rate of gross investment is less than the rate of depreciation.

16
The declining oscillating trend in the provision of new schools and classrooms in this period
may indicate that government may have either met its targets for the provision of this type of
schooling infrastructure or that the intensity at which government initially undertook
expenditure on schooling is waning. Figure 6 provides an interesting illustration of a composite
index on schooling infrastructure30 and the proportion of students who obtain degrees in the
natural sciences five years later.31
The correlation coefficient is found to be 0.96 and the trend between the two series appears to
follow one another. One cannot conclude more from the data due to a lack of times series data
of an adequate length. An interesting question arises: does expenditure schooling infrastructure
positively (and significantly) affect the quality of the educational output?
[INSERT FIGURE 6]
Finally, it is essential that infrastructure is maintained until it becomes obsolete. Thus
responsiveness of government to the changing technological needs of the economy (with regard
to the type of infrastructure development) is crucial. From ports, to railways, to roads, to
telecommunications, hospitals and schools, infrastructure may remain a prevailing enabler of
private capital stock productivity growth. Albeit, in the recent past, in the case of both social
and economic infrastructure expenditure, SA may have been spending mostly to cover
depreciation of assets. This may explain the low levels of social and economic infrastructure
expenditure in the recent past.
30 This composite index includes: new schools; classrooms; workshops; toilets (number of seats); administrative areas (offices and storerooms); media centres; halls; number of schools provided with fences; number of schools provided with water; and number of schools provided with electricity. 31 This variable includes total degrees obtained in all fields of study except for the arts and education. This graph highlights the need for further research analysing the link between infrastructure expenditure and the quality of the labour force may. Data was obtained from Human Sciences Research Council.
17
4 ECONOMETRIC METHODOLOGY
4.1 An Index of Economic Infrastructure
This paper creates indices of economic infrastructure using roads and railways and social
infrastructure using schooling infrastructure data.32 In the literature, two basic approaches have
been suggested for measuring infrastructure stock. The first is to measure infrastructure capital
in monetary terms. Second, is to use physical measures by taking inventory of the quantity of
the pertinent structures and facilities. Observing times series data on actual physical
infrastructure available in SA will provide one with a non-monetary indication of the
infrastructure capital stock in the country.
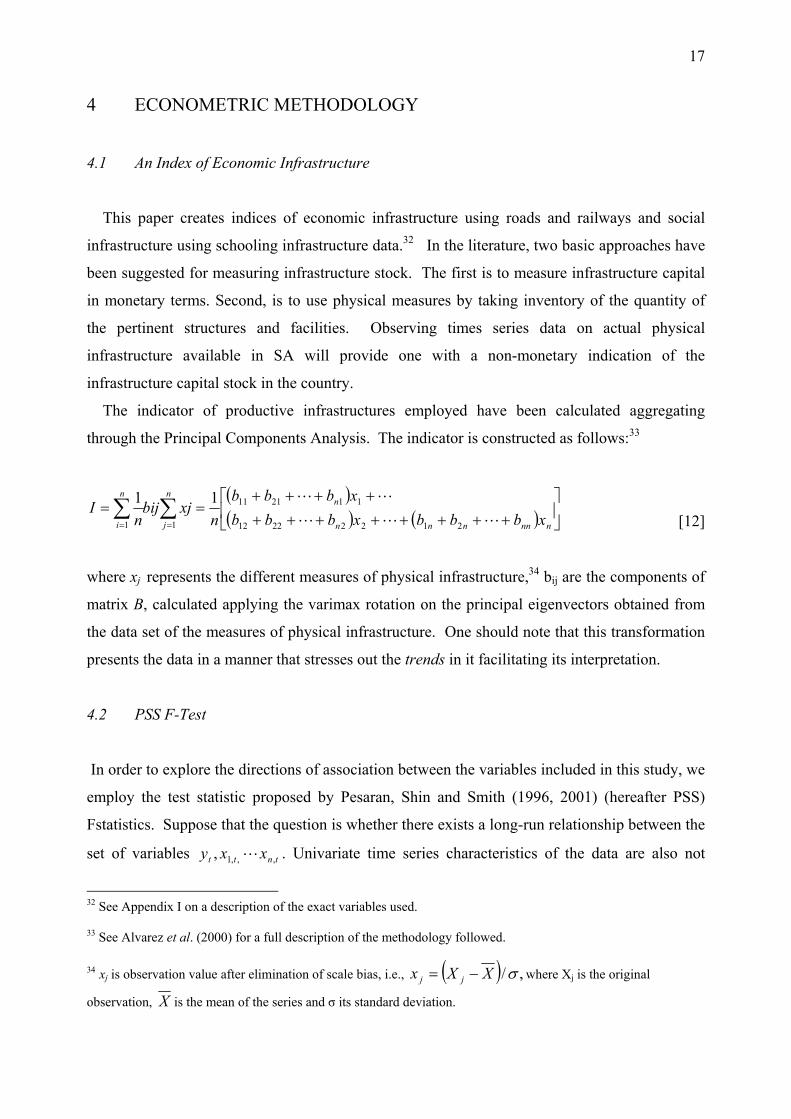
The indicator of productive infrastructures employed have been calculated aggregating
through the Principal Components Analysis. The indicator is constructed as follows:33
( )( ) ( ) ⎥
⎦
⎤⎢⎣
⎡++++++++
++++== ∑∑
== nnnnnn
nn
j
n
i xbbbxbbbxbbb
nxjbij
nI
LLL
LL
21222212
112111
11
11 [12]
where xj represents the different measures of physical infrastructure,34 bij are the components of
matrix B, calculated applying the varimax rotation on the principal eigenvectors obtained from
the data set of the measures of physical infrastructure. One should note that this transformation
presents the data in a manner that stresses out the trends in it facilitating its interpretation.
4.2 PSS F-Test
In order to explore the directions of association between the variables included in this study, we
employ the test statistic proposed by Pesaran, Shin and Smith (1996, 2001) (hereafter PSS)
Fstatistics. Suppose that the question is whether there exists a long-run relationship between the
set of variables tntt xxy ,,,1, L . Univariate time series characteristics of the data are also not
32 See Appendix I on a description of the exact variables used. 33 See Alvarez et al. (2000) for a full description of the methodology followed. 34 xj is observation value after elimination of scale bias, i.e., ( ) ,/σXXx jj −= where Xj is the original
observation, X is the mean of the series and σ its standard deviation.
18
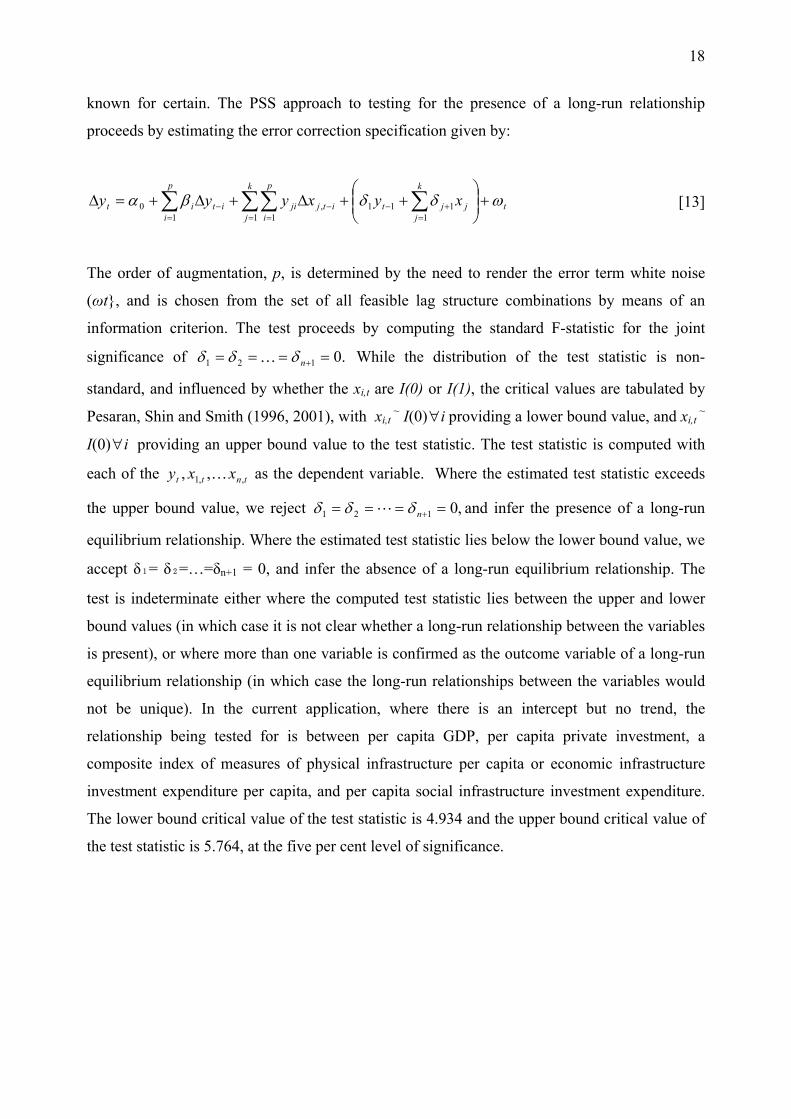
known for certain. The PSS approach to testing for the presence of a long-run relationship
proceeds by estimating the error correction specification given by:
t
k
jjjtitj
k
j
p
ijiit
p
iit xyxyyy ωδδβα +⎟⎟
⎠
⎞⎜⎜⎝
⎛++Δ+Δ+=Δ ∑∑∑∑
=+−−
= =−
= 1111,
1 110 [13]
The order of augmentation, p, is determined by the need to render the error term white noise
(ωt}, and is chosen from the set of all feasible lag structure combinations by means of an
information criterion. The test proceeds by computing the standard F-statistic for the joint
significance of .0121 ==== +nδδδ K While the distribution of the test statistic is non-
standard, and influenced by whether the xi,t are I(0) or I(1), the critical values are tabulated by
Pesaran, Shin and Smith (1996, 2001), with xi,t ~ I(0) i∀ providing a lower bound value, and xi,t
~
I(0) i∀ providing an upper bound value to the test statistic. The test statistic is computed with
each of the tntt xxy ,,1 ,, K as the dependent variable. Where the estimated test statistic exceeds
the upper bound value, we reject ,0121 ==== +nδδδ L and infer the presence of a long-run
equilibrium relationship. Where the estimated test statistic lies below the lower bound value, we
accept δ₁= δ₂=…=δn+1 = 0, and infer the absence of a long-run equilibrium relationship. The
test is indeterminate either where the computed test statistic lies between the upper and lower
bound values (in which case it is not clear whether a long-run relationship between the variables
is present), or where more than one variable is confirmed as the outcome variable of a long-run
equilibrium relationship (in which case the long-run relationships between the variables would
not be unique). In the current application, where there is an intercept but no trend, the
relationship being tested for is between per capita GDP, per capita private investment, a
composite index of measures of physical infrastructure per capita or economic infrastructure
investment expenditure per capita, and per capita social infrastructure investment expenditure.
The lower bound critical value of the test statistic is 4.934 and the upper bound critical value of
the test statistic is 5.764, at the five per cent level of significance.
19
4.3 Vector Error-Correction Mechanism (VECM)
To estimate a structural model for the linkages between economic and social infrastructure
and other macroeconomic variables the paper employs the Johansen estimation technique.35 This
technique is based on estimating a Vector Error Correction Mechanism (VECM). The
discussion of this methodology will be brief as this technique is well established.
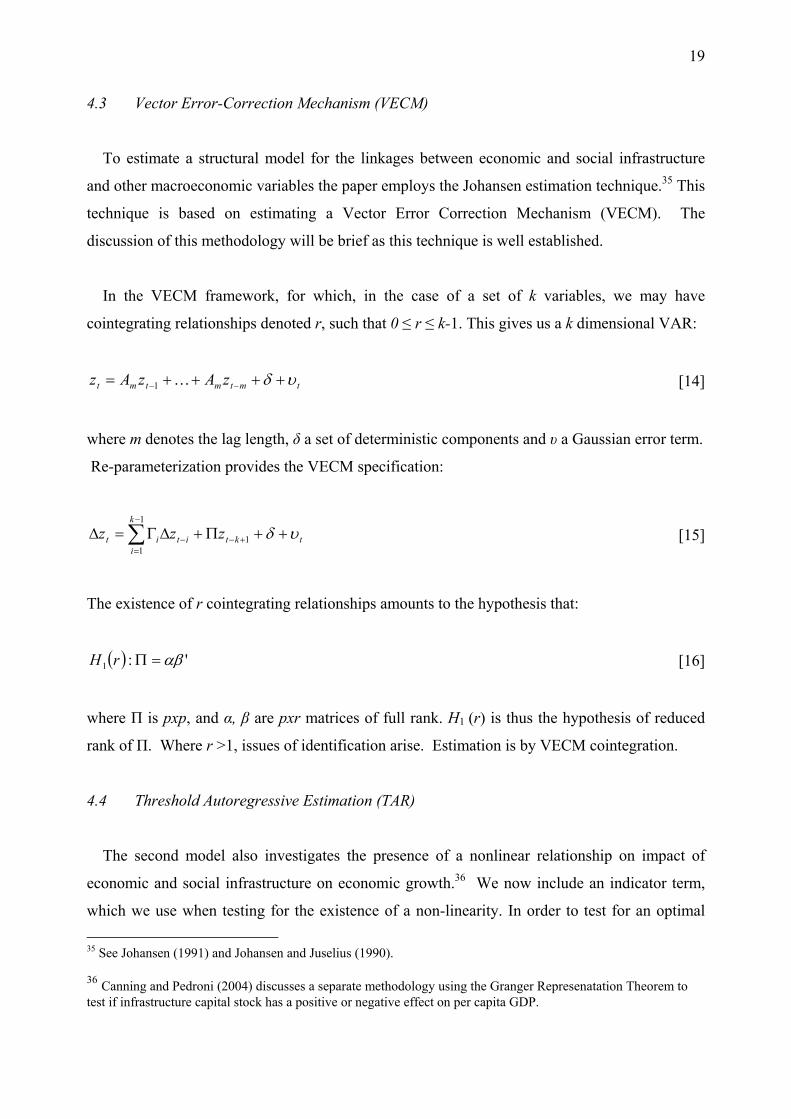
In the VECM framework, for which, in the case of a set of k variables, we may have
cointegrating relationships denoted r, such that 0 ≤ r ≤ k-1. This gives us a k dimensional VAR:
tmtmtmt zAzAz υδ ++++= −− K1 [14]
where m denotes the lag length, δ a set of deterministic components and υ a Gaussian error term.
Re-parameterization provides the VECM specification:
tktit
k
iit zzz υδ ++Π+ΔΓ=Δ +−−
−
=∑ 1
1
1 [15]
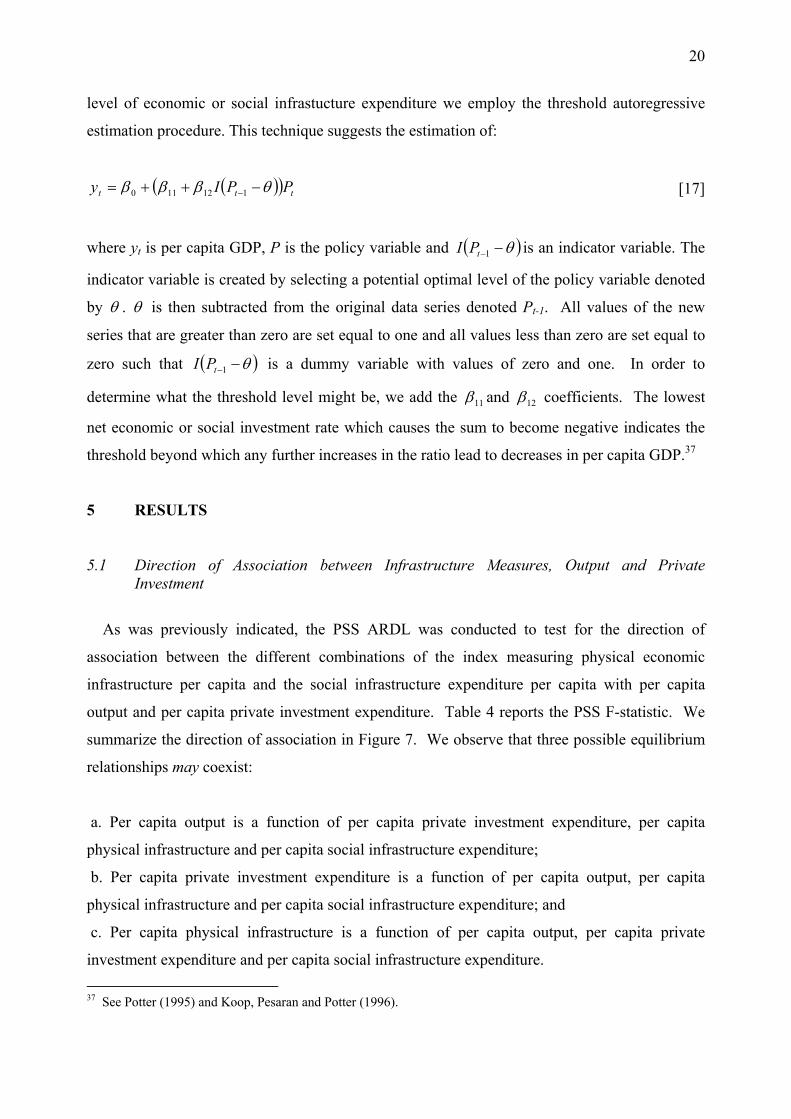
The existence of r cointegrating relationships amounts to the hypothesis that:
( ) ':1 αβ=ΠrH [16]
where Π is pxp, and α, β are pxr matrices of full rank. H1 (r) is thus the hypothesis of reduced
rank of Π. Where r >1, issues of identification arise. Estimation is by VECM cointegration.
4.4 Threshold Autoregressive Estimation (TAR)
The second model also investigates the presence of a nonlinear relationship on impact of
economic and social infrastructure on economic growth.36 We now include an indicator term,
which we use when testing for the existence of a non-linearity. In order to test for an optimal 35 See Johansen (1991) and Johansen and Juselius (1990). 36 Canning and Pedroni (2004) discusses a separate methodology using the Granger Represenatation Theorem to test if infrastructure capital stock has a positive or negative effect on per capita GDP.
20
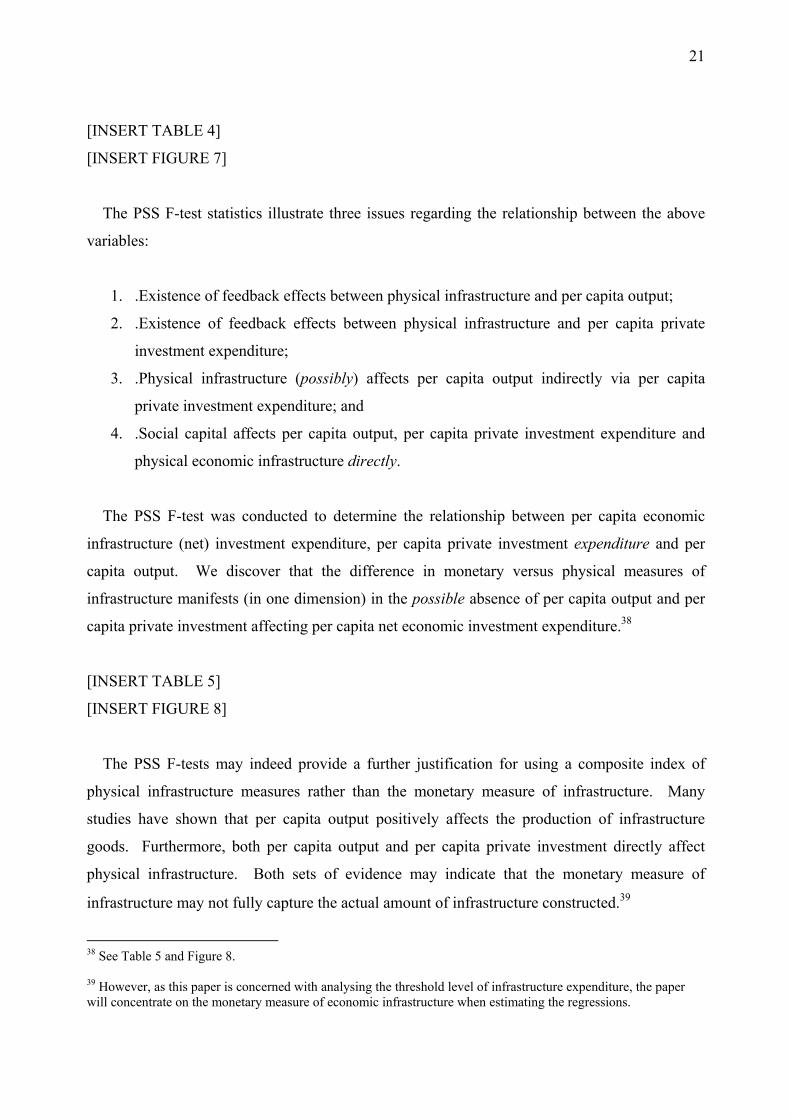
level of economic or social infrastucture expenditure we employ the threshold autoregressive
estimation procedure. This technique suggests the estimation of:
( )( ) ttt PPIy θβββ −++= −112110 [17]
where yt is per capita GDP, P is the policy variable and ( )θ−−1tPI is an indicator variable. The
indicator variable is created by selecting a potential optimal level of the policy variable denoted
by θ . θ is then subtracted from the original data series denoted Pt-1. All values of the new
series that are greater than zero are set equal to one and all values less than zero are set equal to
zero such that ( )θ−−1tPI is a dummy variable with values of zero and one. In order to
determine what the threshold level might be, we add the 11β and 12β coefficients. The lowest
net economic or social investment rate which causes the sum to become negative indicates the
threshold beyond which any further increases in the ratio lead to decreases in per capita GDP.37
5 RESULTS
5.1 Direction of Association between Infrastructure Measures, Output and Private Investment
As was previously indicated, the PSS ARDL was conducted to test for the direction of
association between the different combinations of the index measuring physical economic
infrastructure per capita and the social infrastructure expenditure per capita with per capita
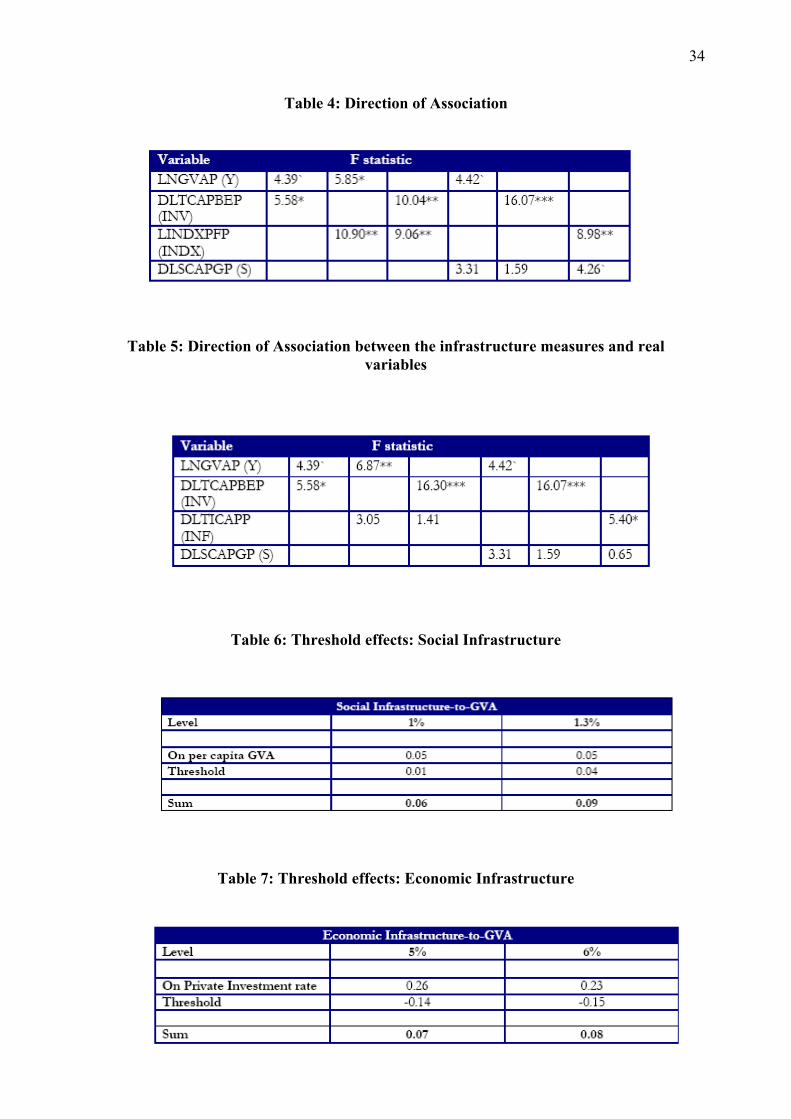
output and per capita private investment expenditure. Table 4 reports the PSS F-statistic. We
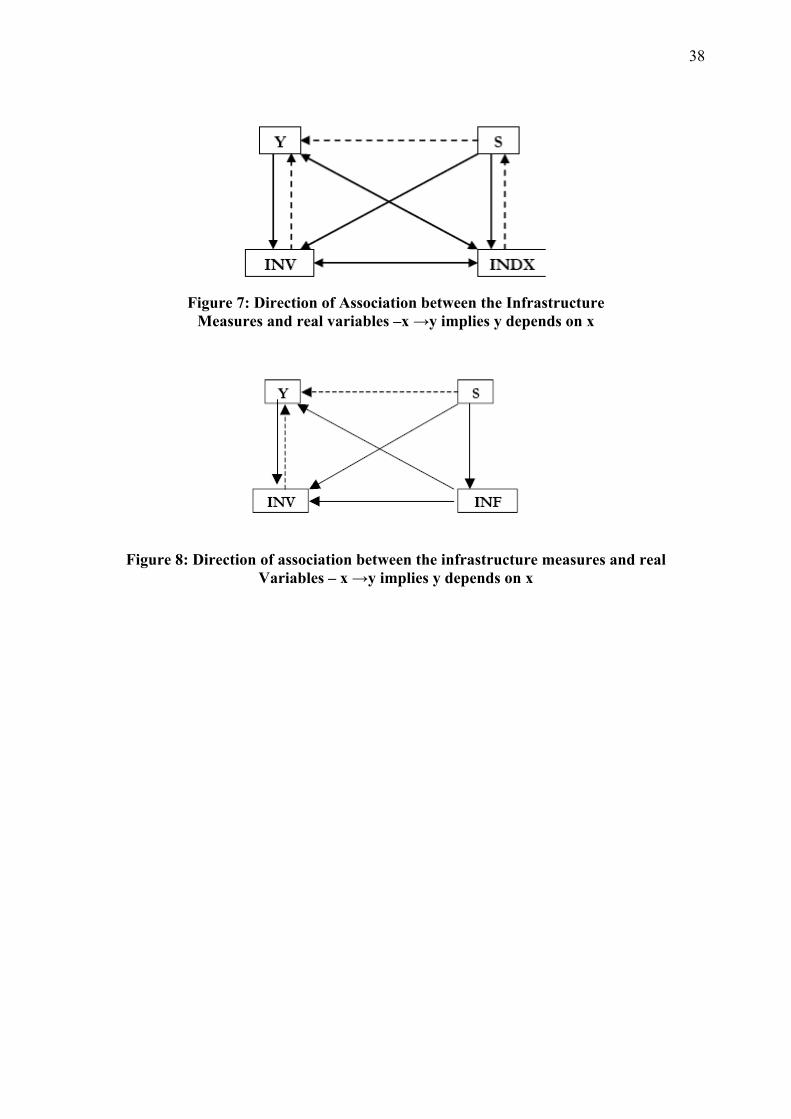
summarize the direction of association in Figure 7. We observe that three possible equilibrium
relationships may coexist:
a. Per capita output is a function of per capita private investment expenditure, per capita
physical infrastructure and per capita social infrastructure expenditure;
b. Per capita private investment expenditure is a function of per capita output, per capita
physical infrastructure and per capita social infrastructure expenditure; and
c. Per capita physical infrastructure is a function of per capita output, per capita private
investment expenditure and per capita social infrastructure expenditure. 37 See Potter (1995) and Koop, Pesaran and Potter (1996).
21
[INSERT TABLE 4]
[INSERT FIGURE 7]
The PSS F-test statistics illustrate three issues regarding the relationship between the above
variables:
1. .Existence of feedback effects between physical infrastructure and per capita output;
2. .Existence of feedback effects between physical infrastructure and per capita private
investment expenditure;
3. .Physical infrastructure (possibly) affects per capita output indirectly via per capita
private investment expenditure; and
4. .Social capital affects per capita output, per capita private investment expenditure and
physical economic infrastructure directly.
The PSS F-test was conducted to determine the relationship between per capita economic
infrastructure (net) investment expenditure, per capita private investment expenditure and per
capita output. We discover that the difference in monetary versus physical measures of
infrastructure manifests (in one dimension) in the possible absence of per capita output and per
capita private investment affecting per capita net economic investment expenditure.38
[INSERT TABLE 5]
[INSERT FIGURE 8]
The PSS F-tests may indeed provide a further justification for using a composite index of
physical infrastructure measures rather than the monetary measure of infrastructure. Many
studies have shown that per capita output positively affects the production of infrastructure
goods. Furthermore, both per capita output and per capita private investment directly affect
physical infrastructure. Both sets of evidence may indicate that the monetary measure of
infrastructure may not fully capture the actual amount of infrastructure constructed.39
38 See Table 5 and Figure 8. 39 However, as this paper is concerned with analysing the threshold level of infrastructure expenditure, the paper will concentrate on the monetary measure of economic infrastructure when estimating the regressions.
22
5.2 Structural Model
5.2.1 VECM Results
Modelling the effect of economic and social infrastructure on growth was performed in two
stages. The first stage concentrated on attempting to estimate the possible relationships between
the public infrastructure investment rate and per capita GVA. The effect of public infrastructure
investment rate on the private investment rate was also analysed. The existence of feedback
mechanisms from output per capita and the private investment rate to the public infrastructure
investment rate were determined.40
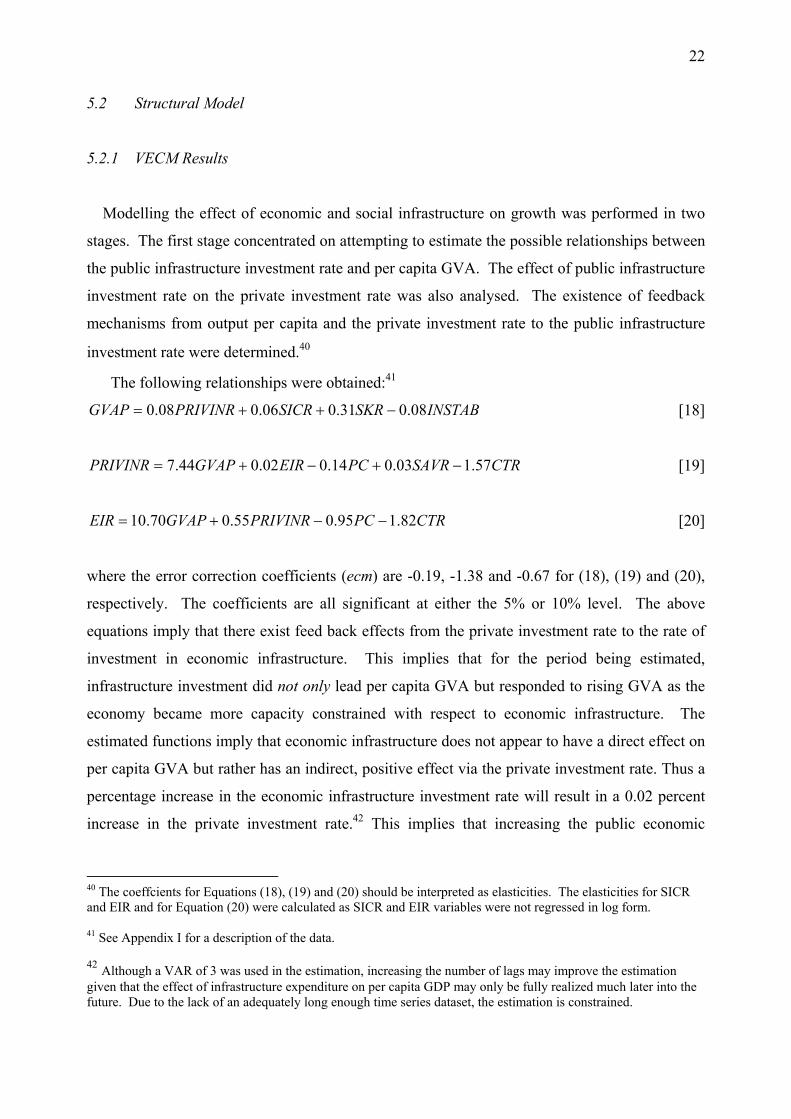
The following relationships were obtained:41
INSTABSKRSICRPRIVINRGVAP 08.031.006.008.0 −++= [18]
CTRSAVRPCEIRGVAPPRIVINR 57.103.014.002.044.7 −+−+= [19]
CTRPCPRIVINRGVAPEIR 82.195.055.070.10 −−+= [20]
where the error correction coefficients (ecm) are -0.19, -1.38 and -0.67 for (18), (19) and (20),
respectively. The coefficients are all significant at either the 5% or 10% level. The above
equations imply that there exist feed back effects from the private investment rate to the rate of
investment in economic infrastructure. This implies that for the period being estimated,
infrastructure investment did not only lead per capita GVA but responded to rising GVA as the
economy became more capacity constrained with respect to economic infrastructure. The
estimated functions imply that economic infrastructure does not appear to have a direct effect on
per capita GVA but rather has an indirect, positive effect via the private investment rate. Thus a
percentage increase in the economic infrastructure investment rate will result in a 0.02 percent
increase in the private investment rate.42 This implies that increasing the public economic
40 The coeffcients for Equations (18), (19) and (20) should be interpreted as elasticities. The elasticities for SICR and EIR and for Equation (20) were calculated as SICR and EIR variables were not regressed in log form. 41 See Appendix I for a description of the data. 42 Although a VAR of 3 was used in the estimation, increasing the number of lags may improve the estimation given that the effect of infrastructure expenditure on per capita GDP may only be fully realized much later into the future. Due to the lack of an adequately long enough time series dataset, the estimation is constrained.
23
infrastructure investment rate has positive productivity effects on the private investment as
theory would suggest.
There exist feedback effects on net economic infrastructure investment from per capita GVA
and the private investment rate of 10.70 and 0.56 percent, respectively. This implies that
investment in economic infrastructure, in the recent past, appears to have been more as a
response to growth and not leading growth. As capacity became more constrained given the
rising growth rates, SA appears to have been faced with the realization that capacity in
infrastructure was lacking. The SA government appears to have responded by increasing the
investment rate in economic infrastructure.
Social infrastructure investment rate expenditure is found to have a direct effect on per capita
GVA. The significance of this is that improving expenditure on hospitals and schooling
infrastructure would provide a more productive labour force. In fact, increasing expenditure on
schooling and hospital infrastructure may be argued to improve the quality of the labour force.
A 1 percent increase in the social infrastructure investment rate will result in a 0.06 percent
increase in per capita GDP.
Furthermore, both the price of capital and the corporate tax rate has a negative effect on both
private and public investment rates.43 Uncertainty has a negative effect on per capita GDP.44 We
also find that the quality of the labour force (as proxied by the skills ratio) matters for increasing
per capita GVA as does the savings rate (indirectly via increasing private investment).45
The short-run dynamics for equation (18) include variables such as net exports-to-GVA and
capacity utilization. Both come in with positive and significant coefficients. Equation (20)
43 Recall that investment in economic infrastructure includes expenditure conducted by public corporations. As such, these corporations are adversely affected by the corporate tax rate and the price of capital in their investment decisions. 44 In previous studies conducted such as Fedderke (2004), Kularatne (2002), Mariotti (2002), political instability had an adverse effect on the private investment rate. This paper uses a measure of instability based on the divergence between the US (as a proxy for world) and SA long term interest rates. 45 The negative effect of the savings rate on economic infrastructure investment rate may be attributed to the accounting identity. Moreover, this implies the existence of a lagged effect of savings on economic infrastructure investment.
24
includes the deficit-to-GVA as part of short-run dynamics which has a positive and significant
effect on the change in the economic infrastructure investment rate.
5.2.2 Threshold Effects
To test the existence of threshold effects of economic and social infrastructure, one can only
test limiting cases on the basis of the available sample. In some cases one may not be able to
identify what the exact threshold may be but will be able to indicate if the threshold has or has
not been achieved at a specific level. This will indicate to policy makers that there may or may
not be more room available for increased expenditure on either economic or social infrastructure
without having adverse, unintended consequences for growth.
Given the fact the highest the social infrastructure net investment rate has been from the
1970s has been approximately 1.3 percent, we test the existence of threshold effects on Equation
(18). Table 6 provides evidence of the existence (or not) of threshold effects at either the 1 or
1.3 percent levels of the social infrastructure investment rate. The results show that the
threshold level of social infrastructure investment rate appears to have not been reached at either
the 1 percent nor the 1.3 percent levels.46 At 1 percent, the total impact of social infrastructure
expenditure is not yet negative. Further, the impact of social infrastructure expenditure on per
capita GVA is positive at 1.3 percent implying that there exists an opportunity for the
government to increase social infrastructure investment rates to higher levels than the maximum
it has been over the past 30 years. If there is a threshold above which increases in social
infrastructure expenditure leads to decreases in per capita GVA, these levels are above the 1.3
percent threshold level. Unfortunately limitations in the data prevent us from examining ratios
above1.3 percent.
[INSERT TABLE 6]
The highest economic infrastructure investment rate stands at approximately 6 percent in the
past 30 years. Table 7 depicts the results of the tests for the existence of threshold effects. The
paper tests threshold effects at the 5 and 6 percent levels.47
46 A threshold of 0.5% was also tested for and found not to be present. 47 A threshold of 4% was also tested for and found not to be present.
25
We find that even at a 6 percent rate of economic infrastructure investment any (possible)
negative effects of economic infrastructure expenditure on private investment have not yet set
in. The economic infrastructure net investment rate (as measured by the change in real fixed
capital stock) by general government and public corporations stands at approximately 1.2
percent of GVA for 2005.
Clearly, the possibility exists for increased expenditure on economic infrastructure. Thus
government attempts to increase investment expenditure to 8 percent of GDP (where a large
chunk of this investment is on infrastructure48) will be unlikely to have negative consequences
for economic output, given that it is financed and spent prudently .
[INSERT TABLE 7]
6 CONCLUSION AND POLICY IMPLICATIONS
The paper alluded to the fact that South Africa has experienced stages of investment in
different types of infrastructure. Firstly, the ports, then railways, roads and so on. SA is
currently a member of the group of middle-income countries. Such countries are generally in
transition from developing to developed nations. Therefore the results of the effect of economic
and social infrastructure on the growth path experienced by SA is an interesting one.
Furthermore, the nature of the effect of economic and social infrastructure both on output and
private investment is key to understanding the role government can play in both stimulating and
enabling a conducive environment for such transition economies.
The results of the estimation clearly support the hypothesis that expenditure on both economic
and social infrastructure do have a positive, significant effect on per capita GVA either directly
(as in the case of social infrastructure) or indirectly (as in the case of economic infrastructure).
This implies that expenditure on schooling and hospital infrastructure does increase the growth
rate of the economy by either improving the quality of the labour force or providing beneficial
outcomes to the society. Expenditure on social infrastructure generates positive externalities by
creating a healthy, educated populace. Economic infrastructure expenditure was found to 48 As indicated in the Medium Term Budget Policy Statement in late 2005, government and public enterprise investment expenditure for the period April 2005 to March 2008 is planned to be about R370bn.
26
increase private investment rates. Theory highlights this may occur if economic infrastructure
expenditure increases the productivity of private capital. In SA (for the given data set) social
infrastructure expenditure was found not to directly affect the private investment rates but may
do so indirectly via increases in per capita GVA.
Furthermore, using the Barro (1990) model possible nonlinearity may exist as is the case for
the study conducted by Mariotti (2002) on government consumption expenditure.49 Figures of
1.3 percent and 6 percent of GVA for social and economic infrastructure, respectively, did not
generate adverse effects on either per capita output nor the private investment rates. This
implies that there exists an opportunity for the SA government to advocate for higher rates of
investment in both these variables to increase economic growth. In the recent past, both social
and economic infrastructure investment rates have been rising. In 2005, the figure for social
infrastructure investment rate (as measured by change in real fixed capital stock) is 0.3 percent.
This is well below the tested threshold level of 1.3 percent.
Although the paper advocates for increasing the rates of investment for economic and social
infrastructure, expenditure by government should ensure that the investments are not of
substandard quality. The SA government by targeting rates specific rates of investment should
ensure that monetary expenditure on infrastructure produces high quality physical infrastructure
that matches such expenditure. This implies that the services provided by such physical
infrastructure need to be efficient and of the highest quality.
This study may be improved by increasing the length of the times series. However, given the
availability of time series data on social infrastructure expenditure, this was not possible. It
would also be beneficial to any study on infrastructure to attempt to gauge the quality of the
physical infrastructure being constructed. Thus a micro examination of the quality and type of
infrastructure development undertaken will be of value. This too, given the paucity of data, is an
arduous task.
49 Government consumption expenditure was found to have a a threshold of 12 percent of GDP for SA.
27
REFERENCES
1 Aaron, H. J., (1990). Discussion in "Is There a Shortfall in Public Capital Investment?",
edited by A.H. Munnell. Boston: Federal Reserve Bank of Boston, Conference Series No.34,
June 1990, 51-63.
2 Arrow, K.J., (1962). The Economic Implications of Learning by Doing, Review of
Economic Studies, 29, 155-73.
3 Aschauer D. A., (1989). Is Public Expenditure Productive, Journal of Monetary
Economics, Vol. 23, pp 177-200.
4 Barro R. J., (1990). Government Spending in a Simple Model of Endogenous Growth,
Journal of Political Economy, Vol. 98, pp 103-125.
5 Bogeti'ć, Ž. and Fedderke, J.W., (2005). Infrastructure and Growth in South Africa:
Benchmarking, productivity and investment needs. Paper presented at the Infrastructure
Workshop of ERSA, South Africa 29-31 May 2006.
6 Canning, D. and Holtz- Eakin, D., (1994). Infrastructure in a structural model of
economic growth, NBER Working Paper 4824.
7 Canning, D. and P. Pedroni., (2004). The Effect of Infrastructure on Long-Run
Economic Growth, Harvard University.
8 Devaranjan, S., and Hossain, S.I., (1998). The Combined Incience of Taxes and Public
Expenditures in the Philippines, World Development, 26(2):963-977.
9 Development Bank of Southern Africa, (1998). Infrastructure: a foundation for
development.
10 Easterly, W. and Robelo, S., (1993). Fiscal Policy and Economic Growth, Journal of
Monetary Economics, 32, 417-58.
11 Economic Infrastructure Framework Report., (2005) Department of Trade and Industry
Report.
12 Engineering News, 26 October 2004, R165bn power, transport capex plan unveiled.
13 Fedderke, J.W., (2004). Investment in Fixed Capital Stock: testing for the impact of
sectoral and systemic uncertainty, Oxford Bulletin of Economics and Statistics, 66(2), 165-188.
14 Fedderke, J.W., De Kadt, R. and Luiz, J.M., (2001). Indicators of political liberty,
property rights and political instability in South Africa: 1935-97, International Review of Law
and Economics, 21: 103-134.
28
15 Ford, R. and P. Poret (1991). Infrastructure and Private-Sector Productivity, OECD
Economic Studies No. 17, 63--89.
16 Garcia-Mila T., McGuire T. J. and Porter R. H. (1996). The Effect of Public Capital in
State Level Production Functions Reconsidered, Review of Economics and Statistics, pp 177-
180.
17 Gramlich E. M., (1994). Infrastructure Investment: A Review Essay, Journal of
Economic Literature, Vol. XXXII, pp 1176-1196.
18 Jimenez, E., (1995). "Human and physical infrastructure: Public investment and pricing
polices in developing countries." In Handbook of Development Economics, ed. Jere Behrman
and T.N. Srinivasan, 3B: 2773-2843.
19 Johansen, S., (1991). Estimation and Hypothesis Testing of Cointegration Vectors in
GaussianVector Autoregressive Models, Econometrica, 59(6), 1551-80
20 Johansen, S., and Juselius, K., (1990). Maximum Likelyhood Estimation and Inference
on Cointegration - with applications to the demand for money, Oxford Bulletin of Economics
and Statistics, 52(2), 169-210.
21 Kessides, C., (1993). "The Contributions of Infrastructure to Economic Development, A
review of Experience and Policy Implications," World Bank - Discussion Papers 213, World
Bank.
22 Koop, G., Pesaran, M.H. and Potter, S.M., (1996). Impulse Response Analysis in Non-
Linear Multivariate Models, Journal of Econometrics, 74, 119-147.
23 Kularatne, C., (2002). An Examination of the Impact of Fianncial Deepening on long-
run Economic Growth: An application of a VECM structure to a middle-income context, South
African Journal of Economics, 70(4), 647-87.
24 Lee, KS, Anas, A and Oh, G. (1999). "Costs of infrastructure deficiencies for
manufacturing in Nigerian, Indonesian and Thai Cities." Urban Studies, 36(12): 2135--2149.
25 Mariotti M., (2002). An Examination of the Impact of Economic Policy on long-run
Economic Growth: An application of a VECM structure to a middle-income context, South
African Journal of Economics, 70(4), 688-724.
26 Merrifield, A., (2000). Financing of public infrastructure investment in South Africa. In
M. Khosa, (Ed.), Infrastructure mandates for change 1994--1999. Pretoria: HSRC Publishers.
27 Munnell, A.H., (1990a). Why has Productivity Growth Declined? Productivity and
Public Investment, New England Economic Review, Jan/Feb, 2--22.
29
28 Munnell, A.H. and Cook, L.M., (1990b). How Does Public Infrastructure Affect
Regional Economic Performance, in: A.H. Munnell, editor, Is There a Shortfall in Public Capital
Investment?, Federal Reserve Bank of Boston, Boston.
29 Munnell, A.H., (1992). Policy Watch. Infrastructure Investment and Economic Growth,
Journal of Economic Perspectives, 6, 189--198.
30 Munnell, A.H., (1993). An Assessment of Trends in and Economic Impacts of
Infrastructure Investment, in: Infrastructure Policies for the 1990s, OECD, Paris.
31 Murphy, KM, Shleifer, A and Vishny, RW. (1989). Industrialization and the big push,
Journal of Political Economy, 97(5): 1003--1026.
32 Perkins, P. (2003). "An analysis of economic infrastructure investment in South Africa",
Dissertation for the degree of Master of Commerce (partial fulfilment), approved by the
University of the Witwatersrand, Johannesburg
33 Perkins, P., Fedderke, J.W., and Luiz, J.M., (2005). An Analysis of Economic
Infrastructure Investment in South Africa, South African Journal of Economics, 73(2), 211-28
34 Pesaran, MH, Shin, Y and Smith, RJ. (1996). Testing for the existence of a long-run
relationship, DAE Working Paper no. 9622, Department of Applied Economics, University of
Cambridge.
35 Pesaran, MH, Shin, Y, and Smith R. (2001). Bounds testing approaches to the analysis of
level relationships, Journal of Applied Econometrics, 16: 289--326.
36 Pinnoi, N., (1994). "Public Infrastructure and Private Production. Measuring relative
contributions", Journal of Economic Behavior and Organization, 23, 127--148.
37 Potter, S.M. (1995). A Non-linear Approach to US GNP, Journal of Applied
Econometrics, 10(2), 109-126.
38 Ramirez, M., (2000). Foreign Direct Investment in Mexico: A Cointegration Analysis,
Journal of Development Studies, 37(1), 138-162.
39 Romer, P.M., (1986). Increasing Returns and Long-run Growth, Journal of Political
Economy, 94(5),1002-37.
40 Shah, A., (1992). Dynamics of Public Infrastructure, Industrial Productivity and
Profitability, Review of Economics and Statistics, 74, 28--36.
41 South African Reserve Bank Annual Economic Reports, 1996-2001.
42 Sturm, J.E., (1996). The Influence of Public Infrastructure Capital on the Private
Economy of the Netherlands: An Application of the Symmetric
43 Generalized McFadden Cost Function, mimeo, University of Groningen.
30
44 Sturm, J.E. and J. de Haan, (1995). Is Public Expenditure Really Productive? New
Evidence for the US and the Netherlands, Economic Modelling, 12, 60--72.
45 Sturm, J.E., Jacobs, J.P.A.M. and P.Groote, (1995). "Productivity Impacts of
Infrastructure Investment in the Netherlands 1853--1913, SOM Research Report No. 95D30,
Groningen.
46 Sturm, J.E. and Kuper, G.H., (1996). The Dual Approach to the Public Capital
Hypothesis: TheCase of The Netherlands, CCSOSeriesNo. 26,Groningen.
47 Toen-Gout, M.W. and Jongeling, M.M., (1994). Investment in Infrastructure and
Economic Growth, OCFEB Research Memorandum No. 9404, Research Centre for Economic
Policy, Erasmus University Rotterdam.
48 Toen-Gout, M.W. and van Sinderen, J. (1995). The Impact of Investment in
Infrastructure on Economic Growth, Research Memorandum No. 9503, Research Centre for
Economic Policy, Erasmus University Rotterdam.

31
32
B: Appendix II
33
Table 2: Table of Economic Infrastructure Expenditure
Table 3: Social Infrastructure Expenditure
34
Table 4: Direction of Association
Table 5: Direction of Association between the infrastructure measures and real variables
Table 6: Threshold effects: Social Infrastructure
Table 7: Threshold effects: Economic Infrastructure
35
36
Figure 4: Index of Economic Infrastructure: Rail and Road. Note: The axes on the left hand side is inverted
37
Figure 5: Index of Schooling Infrastructure: Schools and Classrooms
Figure 6: Composite Index of Schooling Infrastructure and Proportion of Degrees (excl: Education and Arts Degrees)
38
Figure 7: Direction of Association between the Infrastructure
Measures and real variables –x →y implies y depends on x
Figure 8: Direction of association between the infrastructure measures and real Variables – x →y implies y depends on x