SMRP Best Practice Metrics Workshop - PEMAC€¦ · Figure 2 SMRP Best Practices Metrics Mapped to...
14
SMRP Best Practice Metrics Workshop Measuring Asset Reliability SMRP Headquarters 1100 Johnson Ferry Road, Suite 300 Atlanta, GA 30342 USA www.smrp.org Copyright © 2014 Society for Maintenance & Reliability Professionals
Transcript of SMRP Best Practice Metrics Workshop - PEMAC€¦ · Figure 2 SMRP Best Practices Metrics Mapped to...
SMRP Best Practice Metrics
Workshop
Measuring Asset Reliability
SMRP Headquarters 1100 Johnson Ferry Road, Suite 300
Atlanta, GA 30342 USA www.smrp.org
Copyright © 2014 Society for Maintenance & Reliability Professionals

Best Practices Committee- Metrics Workshop
© 2014 SMRP Page 2 of 14
Best Practices Committee- Metrics Workshop
© 2014 SMRP Page 3 of 14
Measuring Asset Reliability for a Mock Company
Introduction
You will be calculating a set of SMRP Best Practice metrics for a mock company:
“Speedy Mac Reliable Products”
The name of the company shortens to SMRP. The company is based in St. Louis. SMRP has
several plants located in Missouri and Illinois. The company is in the business of manufacturing
reliable widgets for general application.
The company’s CEO, Seymour Profit, envisions starting a reliability initiative, since he has
heard that such efforts can improve the bottom line. He has charged Noah Lott, the Director of
Corporate Reliability, with program implementation.
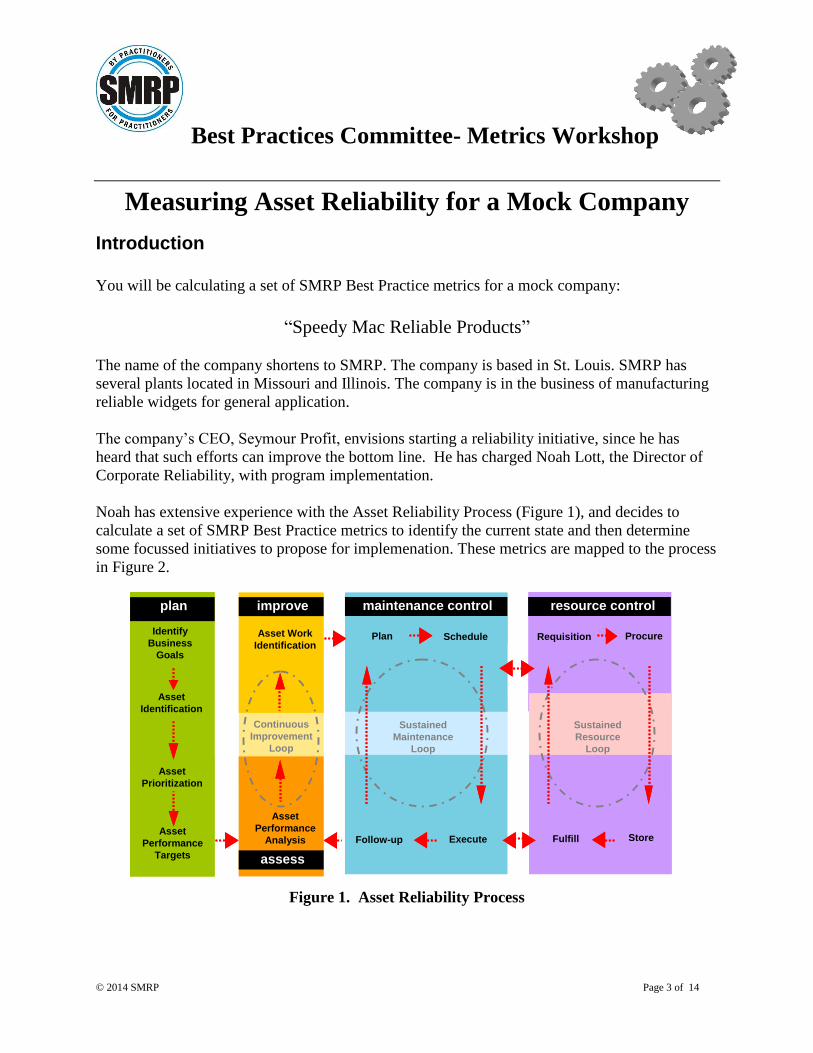
Noah has extensive experience with the Asset Reliability Process (Figure 1), and decides to
calculate a set of SMRP Best Practice metrics to identify the current state and then determine
some focussed initiatives to propose for implemenation. These metrics are mapped to the process
in Figure 2.
Figure 1. Asset Reliability Process
Requisition Procure
resource controlplan
Plan
Follow-up
Schedule
Execute
maintenance control
Sustained
Maintenance
Loop
improve
assess
Asset Work
Identification
Asset
Performance
Analysis
Continuous
Improvement
Loop
Identify
Business
Goals
Asset
Performance
Targets
Sustained
Resource
Loop
Fulfill
Asset
Identification
Asset
Prioritization
Store
Requisition Procure
resource control
Requisition Procure
resource controlplan
Plan
Follow-up
Schedule
Execute
maintenance control
Sustained
Maintenance
Loop
improve
assess
Asset Work
Identification
Asset
Performance
Analysis
Continuous
Improvement
Loop
Identify
Business
Goals
Asset
Performance
Targets
Sustained
Resource
Loop
Fulfill
Asset
Identification
Asset
Prioritization
Store

Best Practices Committee- Metrics Workshop
© 2014 SMRP Page 4 of 14
Figure 2 SMRP Best Practices Metrics Mapped to the Asset Reliability Process
Mr. Lott forms an Asset Reliability Assessment Team consisting of the Maintenance Manager,
Ben Ignored, the Operations Manager, Maury Ficiency, and the Maintenance Planner, Claire
Voyant from the Louisville facility. Together, they select the appropriate metrics and map them
to the Asset Reliability Process. They then set about calculating the current values. Noah has
collected data from two sister plants as well, which will be used to determine which plant is the
best investment for the program. The data for the three facilities is provided in the following
section.
Your teams assignment is to calculate the specific metrics chosen from the mapped process and
make recommendation on how to improve the facilities. You also recognize that these are
snapshots, and you may have to look at the combination of metrics and make educated guesses
about the state of the plant and utlize that information to assist your initiative selection. You
may also determine that additional metrics must be calculated to identify the real problem.

Best Practices Committee- Metrics Workshop
© 2014 SMRP Page 5 of 14
Plant Data
Table 1. Data from the Finance Department:
No. Data Units Plant A Plant B Plant C
1-1 RAV $
Millions $293.5 $293.5 $293.5
1-2 Maintenance Labor Cost $/year $2,015,634 $7,528,986 $11,204,554
1-3 Materials Cost $/year $2,157,428 $8,058,626 $11,992,759
1-4 Overtime Labor Cost $/year $308,428 $1,152,069 $1,714,497
1-5 Training Cost $/year $125,728 $325,806 $262,087
1-6 Contractor Costs $/year $380,723 $1,565,935 $2,116,369
1-7 Total Maintenance Cost $/year $4,987,940 $18,631,422 $27,290,266
1-8 Stores Inventory Value $ $880,225 $9,389,063 $19,511,647
1-9 Value of Stock Purchased $/year $2,640,674 $10,327,970 $9,755,823
1-10 Capital Improvement Costs $/year $135,000 $504,265 $275,000
Table 2. Data From HR:
No. Data Units Plant A Plant B Plant C
2-1 Craft Employees No. 36 134 200
2-2 Supervisors No. 2 8 25
2-3 Planners No. 1 4 4
2-4 Training Hours Hrs/year 2,880 7,463 6,004
2-5 Overtime Hours Hrs/year 3,744 27,970 83,249
2-6 Contractor Hours Hrs/year 7,919 32,571 44,021
2-7 Total Maintenance Labor Hours Hrs/year 82,799 311,291 460,021
Note: Shaded entries are subtotals

Best Practices Committee- Metrics Workshop
© 2014 SMRP Page 6 of 14
Table 3. Operations Data
No. Data Units Plant A Plant B Plant C
3-1 Scheduled Downtime Hrs/month 14 42 83
3-2 Unscheduled Downtime Hrs/month 7 36 65
3-3 Total Downtime Hrs/month 21 78 148
3-4 Idle Time Hrs/month 0 69 206
3-5 Operating Time Hrs/month 699 574 366
3-6 Availability % 97.1% 79.7% 50.9%
3-7 Average Operating speed fpm 200 195 190
3-8 Maximum Achievable speed fpm 203 203 203
3-9 Performance Efficiency % 98.8% 96.3% 93.8%
3-10 Defect rate Dfct/100u 2.5 9.0 15.0
3-11 Quality Rate % 97.5% 91.0% 85.0%
Table 4. Work Management Data
No. Data Units Plant A Plant B Plant C
4-1 Planned Work Hrs/month 5,493 15,173 4,105
4-2 Unplanned Work Hrs/month 969 10,115 36,949
4-3 Total Work Hrs/month 6,462 25,288 41,054
4-4 Corrective Work Identified Hrs/month 1,939 2,529 411
4-5 Reactive Work Hrs/month 323 5,058 26,685
4-6 Proactive Work (includes 4-11 and 4-12)
Hrs/month 5,170 7,333 2,463
4-7 Scheduled work completed Hrs/month 6,139 19,977 17,653
4-8 PM/PdM Work Planned Hrs/month 2,480 5,708 4,413
4-9 PM/PdM Work Completed Hrs/month 2,456 3,995 1,765
4-10 Project Work Hrs/month 1,745 13,706 12,193
4-11 Predictive Work Hrs/month 1,998 3,450 1,202
4-12 Operator Predictive Work Hrs/month 975 2,568 346
4-13 Predictive Work Costs $/month $48,638 $83,985 $8,422
4-14 Operator Predictive Work Costs
$/month $18,447 $48,586 $6,546
Best Practices Committee- Metrics Workshop
© 2014 SMRP Page 7 of 14
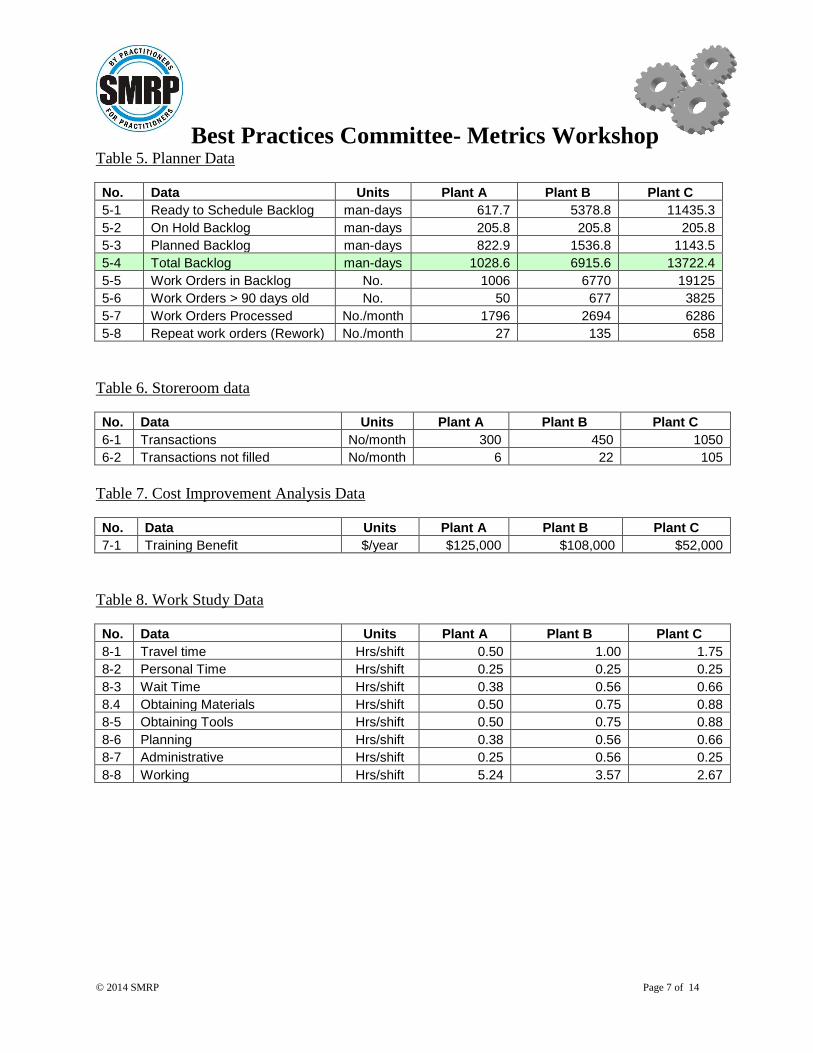
Table 5. Planner Data
No. Data Units Plant A Plant B Plant C
5-1 Ready to Schedule Backlog man-days 617.7 5378.8 11435.3
5-2 On Hold Backlog man-days 205.8 205.8 205.8
5-3 Planned Backlog man-days 822.9 1536.8 1143.5
5-4 Total Backlog man-days 1028.6 6915.6 13722.4
5-5 Work Orders in Backlog No. 1006 6770 19125
5-6 Work Orders > 90 days old No. 50 677 3825
5-7 Work Orders Processed No./month 1796 2694 6286
5-8 Repeat work orders (Rework) No./month 27 135 658
Table 6. Storeroom data
No. Data Units Plant A Plant B Plant C
6-1 Transactions No/month 300 450 1050
6-2 Transactions not filled No/month 6 22 105
Table 7. Cost Improvement Analysis Data
No. Data Units Plant A Plant B Plant C
7-1 Training Benefit $/year $125,000 $108,000 $52,000
Table 8. Work Study Data
No. Data Units Plant A Plant B Plant C
8-1 Travel time Hrs/shift 0.50 1.00 1.75
8-2 Personal Time Hrs/shift 0.25 0.25 0.25
8-3 Wait Time Hrs/shift 0.38 0.56 0.66
8.4 Obtaining Materials Hrs/shift 0.50 0.75 0.88
8-5 Obtaining Tools Hrs/shift 0.50 0.75 0.88
8-6 Planning Hrs/shift 0.38 0.56 0.66
8-7 Administrative Hrs/shift 0.25 0.56 0.25
8-8 Working Hrs/shift 5.24 3.57 2.67

Best Practices Committee- Metrics Workshop
© 2014 SMRP Page 8 of 14
Table 9. Reliability Study on Pump Group 9
No. Data Units Plant A Plant B Plant C
9-1 Number of Pumps No. 52 52 52
9-2 Failures (Repair Event) No/year 12 24 36
9-3 Total Repair Time Hrs/year 48 144 288
9-4 Work Orders (Maint. Action) No/year 24 72 144
9-5 Downtime events No/year 24 60 120
9-6 Estimated repair cost $/repair 2500 2500 2500
9-7 Actual repair cost $/repair 2000 2600 3500
9-8 Est.repair hours (Pump 9-3) Hrs/repai
r 6 6 6
9-9 Actual repair hours (Pump 9-3) Hrs/repai
r 4 6 8
9-10 Total Asset Downtime hrs/year 252 936 1776
Table 10. Constants
No. Data Units Plant A Plant B Plant C
10-1 Hours in a Month Hrs 720 720 720
10-2 Hours in a Year Hrs 8760 8760 8760
10-3 Days per year Days 365 365 365
10-4 Weeks per Year Weeks 52 52 52
10-5 Hours Available per Work week Hrs 40 40 40
10-6 Hours per shift Hrs 8 8 8
10-7 Shifts per Day No. 1 1 1

Best Practices Committee- Metrics Workshop
© 2014 SMRP Page 9 of 14
Acknowledgements
The workshop was developed by the 2006 SMRP Best Practices Conference Track
Subcommittee, whose members were Dick Olver, Jay Padesky, Bob DiStefano, Scotty McLean,
Neil Waugh, Ricky Smith, Jeff Stegemiller, Bruce Hawkins and Jerry Kahn.
The concept for this workshop is based on the “Workshops on Maintenance Indicators”
conducted in Europe by Maintenance Benchmarking Committee of the European Federation of
National Maintenance Societies (EFNMS). Tom Svantesson of the Danish Maintenance Society,
who is the EFNMS committee’s liaison with the SMRP Best Practices Committee, is gratefully
acknowledged for his guidance during the development of this SMRP workshop

Best Practices Committee- Metrics Workshop
© 2014 SMRP Page 10 of 14
Calculation of the metrics for Breakout Session 1 Please calculate the maintenance Metrics for each SMRP Plant facility
█ Strategic Planning Metrics
Metrics to Calculate: 1.1, 1.5, 2.1.1, and 5.5.71
-------------------------------------------------------------------------------------------------------------------------------
Metric 1.1 RAV per Craft/Wage Headcount
Replacement Asset Value
Metric 1.1 Formula:
Craft/Wage Headcount
Metric 1.1 Calculation:
Plant A Plant B Plant C
Metric 1.1 Result: ______ ______ _______ per maintenance employee
-------------------------------------------------------------------------------------------------------------------------------
Metric 1.5 Maintenance Cost per RAV(Harmonized with EFNMS E1)
Annual Maintenance Cost * 100
Metric 1.5 Formula:
Replacement Asset Value
Metric 1.5 Calculation:
Plant A Plant B Plant C
Metric 1.5 Result: ______ ______ ______ %
-------------------------------------------------------------------------------------------------------------------------------
Metric 2.1.1 OEE
Metric 2.1.1 Formula: Availability * Performance Efficiency * Quality Rate
Metric 2.1.1 Calculation:
Plant A Plant B Plant C
Metric 2.1.1 Result: ______ ______ ______ %

Best Practices Committee- Metrics Workshop
© 2014 SMRP Page 11 of 14
Metric 5.5.71 Contractor Cost (Harmonized with EFNMS E10)
[Annual Contactor Cost] * 100
Metric 5.5.71 Formula:
Annual Maintenance Cost
Metric 5.5.71 Calculation:
Plant A Plant B Plant C
Metric 5.5.71 Result: _____ ______ ______ %
Calculation of the metrics for Breakout Session 2 Please calculate the maintenance indicators for each SMRP Plant facility
█ Work Identification Metrics
Metrics to Calculate: 5.3.1, 5.4.1, and 5.1.5
Metric 5.3.1 Planned Work
Planned Work Performed * 100
Metric 5.3.1 Formula:
Total Work Performed
Metric 5.3.12 Calculation:
Plant A Plant B Plant C
Metric 5.3.1 Result ______ ______ ______ %
-------------------------------------------------------------------------------------------------------------------------------
Metric 5.4.1 Reactive Work (Harmonized with EFNMS O17)
Reactive Work Performed * 100
Metric 5.4.1 Formula:
Total Work Performed
Metric 5.4.1 Calculation:
Plant A Plant B Plant C

Best Practices Committee- Metrics Workshop
© 2014 SMRP Page 12 of 14
Metric 5.4.1 Result: ______ ______ ______ %
-------------------------------------------------------------------------------------------------------------------------------
Metric 5.1.5 Condition Based Maintenance Cost (Harmonized with EFNMS E17)
[Condition Based Maintenance Cost] * 100
Metric 5.1.5 Formula:
Annual Maintenance Cost
Metric 5.1.5 Calculation:
Plant A Plant B Plant C
Metric 5.1.5 Result: ______ ______ ______ %
█ Work Planning Metrics
Metrics to Calculate: 5.4.9
-------------------------------------------------------------------------------------------------------------------------------
Metric 5.4.9 Ready Backlog (based on a 40 hour workweek)
Ready to Schedule Backlog (weeks)
Metric 5.4.9 Formula:
Craft Available
Metric 5.4.9 Calculation:
Plant A Plant B Plant C
Metric 5.4.9 Result: ______ ______ _____ weeks
█ Work Scheduling Metrics
Metrics to Calculate: 5.4.3
Metric 5.4.3 Schedule Compliance - Hours
Scheduled Work Performed * 100
Metric 5.4.4 Formula:
Total Time Available
Best Practices Committee- Metrics Workshop
© 2014 SMRP Page 13 of 14
Metric 5.4.4 Calculation:
Plant A Plant B Plant C
Metric 5.4.4 Result: ______ ______ ______ %
Calculation of the metrics for Breakout Session 3 Please calculate the maintenance indicators for each SMRP Plant facility
█ Materials Control Metrics
Metrics to Calculate: 1.4
Metric 1.4 Stocked MRO Inventory per RAV (Harmonized with EFNMS E7)
Stocked Inventory Value * 100
Metric 1.4 Formula:
Replacement Asset Value
Metric 1.4 Calculation:
Plant A Plant B Plant C
Metric 1.4 Result: ______ ______ ______ %
█ Work Execution Metrics
Metrics to Calculate: 5.6.1
Metric 5.6.1 Wrench Time
Productive Work Time * 100
Metric 5.6.1 Formula:
Total Work Time Scheduled
Metric 5.6.1 Calculation:

Best Practices Committee- Metrics Workshop
© 2014 SMRP Page 14 of 14
Plant A Plant B Plant C
Metric 5.6.1 Result: ______ %
█ Analysis Metrics
Metrics to calculate: 3.5.1, and 3.5.2
Metric 3.5.1 Mean Time Between Failures (MTBF) for Pump Group No. 9
(Harmonized with EFNMS T17)
Operating Time
Metric 3.5.1 Formula:
Number of Failures
Metric 3.5.1 Calculation:
Plant A Plant B Plant C
Metric 3.5.1 Result: ______ _______ ______ months
-------------------------------------------------------------------------------------------------------------------------------
Metric 3.5.2 Mean Time To Repair (MTTR) for Pump Group No. 9
(Harmonized with EFNMS T21)
Repair Time
Metric 3.5.2 Formula:
Number of Repair Events
Metric 3.5.2 Calculation:
Plant A Plant B Plant C
Metric 3.5.2 Result: ______ ______ ______ hours