System Modernization and Reliability: A Transition...
27
System Modernization and Reliability: A Transition to Underground 2017 IEEE Rural Electric Power Conference Chris Fluke Richard Walton Steve De Merritt, P.E. Project Director – IJUS, LLC Project Engineer – IJUS, LLC Senior Engineer – SMRP Planning 690 Taylor Rd., Suite 100 690 Taylor Rd., Suite 100 Wisconsin Public Service Gahanna, OH 43230 Gahanna, OH 43230 Green Bay, WI 54313 614-335-6223 x 13 614-335-6223 x34 920-433-1716 [email protected] [email protected] [email protected]
Transcript of System Modernization and Reliability: A Transition...

System Modernization and Reliability:A Transition to Underground
2017 IEEE Rural Electric Power Conference
Chris Fluke Richard Walton Steve De Merritt, P.E.Project Director – IJUS, LLC Project Engineer – IJUS, LLC Senior Engineer – SMRP Planning
690 Taylor Rd., Suite 100 690 Taylor Rd., Suite 100 Wisconsin Public ServiceGahanna, OH 43230 Gahanna, OH 43230 Green Bay, WI 54313614-335-6223 x 13 614-335-6223 x34 [email protected] [email protected] [email protected]

Wisconsin Public Service Territory Review
• 453,000 electric customers• 11,000 square miles

Wisconsin Public Service Territory Coverage
• 77% of existing distributioninfrastructure is Overhead
• 7800 miles (71%)considered Medium toHeavy Density Forest

SAIDI Comparisons:
WPSC 6 year SAIDI average (336.39)was higher than the averages of other
state utilities over the same period(160.17 minutes)

Outage Comparisons by Event
Approximately 75% of all WPS outage eventswere associated with overhead facilities andfall into categories that normally would notaffect an underground system (i.e. wildlife,
weather, vegetation, etc.)

Outage Comparisons by Territory• 33,167 customers (7.6%) experienced
an average of 5+ outages per year• 72% of those outages were located in
high density forest areas
• 5,413 customers (1.2%) experienced anaverage of 10+ outages per year
• 90% of those outages were located inhigh density forest areas

System Modernization and Reliability Overview(SMRP)
• Pilot Program in 2012 (15 miles and 238 customers)• Project officially began in Fall of 2012• First Construction Season in 2014 (Spring)• Initial project duration was for 5 years (2014 - 2018)• Approximately 200 - 300 miles per year• Expected to decrease outage minutes of project areas by 75%
• 20-25% reduction in WPSC overall SAIDI numbers by the end of 2018• Assuming similar weather severity, this reduction would move WPSC from
the 3rd quartile into the 2nd quartile based on national SAIDI benchmarks• SMRP Phase 2 approved by Public Commission of Wisconsin for 3 additional
years in 2017 for construction through 2021

System Modernization and Reliability Overview
• Identify and prioritize the overheadcircuits that would provide themaximum reliability benefit for the costinvestment
• Begin to contact customers and gaugeoverall interest in project• Begin Field Design, Collecting assets,
and creation of Construction Prints• Environmental Walk-throughs
• General Permitting and Applications• Send out Easement Drawings to Customers
and Begin to Acquire Necessary Easements• Staking and Construction• Removal of Existing Overhead Facilities• Complete As-Builts and update GIS

Project Locations by Year
2014
2015
2016
2017
2018
2019

Field Design ToolDesign Tool Creation:• Proprietary and Open-Source GIS• WPSC’s Existing Utility Data• Aerial Imagery• Surveying Monuments• Property Information• Customer Responses to Communications• Easement Information• Permitting and Environmental Information• Additional Base-Map features
Designs with sub-foot accuracy:• ESRI’s ArcPad Mobile Data Collection• Trimble GPS Receivers• Trimble Positions Extensions• MiFi mobile hotspots
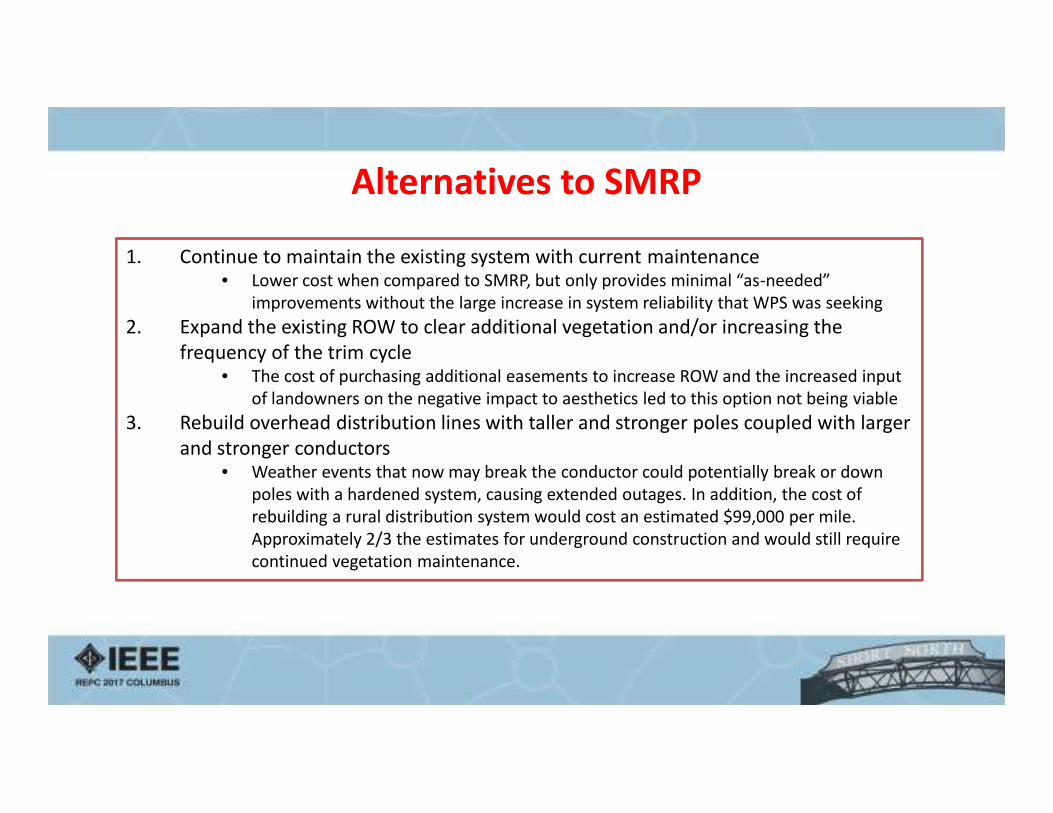
Alternatives to SMRP
1. Continue to maintain the existing system with current maintenance• Lower cost when compared to SMRP, but only provides minimal “as-needed”
improvements without the large increase in system reliability that WPS was seeking2. Expand the existing ROW to clear additional vegetation and/or increasing the
frequency of the trim cycle• The cost of purchasing additional easements to increase ROW and the increased input
of landowners on the negative impact to aesthetics led to this option not being viable3. Rebuild overhead distribution lines with taller and stronger poles coupled with larger
and stronger conductors• Weather events that now may break the conductor could potentially break or down
poles with a hardened system, causing extended outages. In addition, the cost ofrebuilding a rural distribution system would cost an estimated $99,000 per mile.Approximately 2/3 the estimates for underground construction and would still requirecontinued vegetation maintenance.

Estimated Cost of SMRP
Installation CostInstallation Cost Cost Per Mile1Φ Primary Circuit $105,0003Φ Primary Circuit $110,000 to $170,000Service Installation $7,000Design Cost $77,000Overhead Removal Cost $30,000Distribution Automation $50,000
Cost to Customers
• A typical residential customerwould see an approximateincrease of $0.45/month(0.5%) in the initial year ofSMRP and at the end of theinitial 5 year constructionperiod; a typical residentialcustomer would experiencethe highest increase atapproximately $4.30/month.
• Over the initial five year plan, total SMRPcosts were estimated at $218 million.
• $40 million/year for UndergroundConstruction and the balance for DistributionAutomation
• Cost to be offset by the reduced operationand maintenance, and an increase in thetraditional cost of service to assigndistribution cost to mostly residential andsmall commercial customers.

Feeder Prioritization
Created an internal weightedreliability matrix which includes:
• Total Length of Line• Length of Line Cross Country• Total Connected Transformer kVA• Existing Overhead Conductor Size
and Remaining Service Life• Estimated Cost to Rebuild Line• Annual Trimming Costs• Customer Minutes of Interruption• Reliability Cost

Gauging Customer Interest
Option 1: Choose to bury their existing overhead service from the last overhead point to the service entrance. If theservice was less than a certain distance from the last WPS pole then the work would be completed at no cost to thecustomer if they were ready to accept the new service at the time of cut-over and all electrician work had beencompleted.
Option 2: Choose to leave their existing service overhead and WPS would bury the overhead system up to the lastpole.
For those services within the projects that were already underground, WPS would remove the service from theoverhead system and splice it into the new underground system at no additional cost to the customers.
A self-addressed stamped post card was provided so that they could easily reply to essentiallyone of two options regarding their participation in the project.
Additional Information Gathered from Customers:• If access is granted to the parcel for design• If customer is interested in converting service to underground• If customer would consider granting an easement• If additional follow-up was requested by parcel owner

Developing the Design
Basic Construction Methods used
• Directional Bore (Trenchless method)• Plowing (Both vibratory and plug)• Open Cut Trenching
Each method offers various benefits and consequences in regards to soil impact, cost,and constructability.
With parcel owners interest confirmed and Right of Entry granted, the SMRP designers wouldalso attempt to utilize public ROW whenever possible and practical in order to minimize thenumber of easements required to construct each project.

Developing the DesignHighway Construction Preference Township Road Construction Preference

Desk Design Tool (QGIS)
QGIS provides:– Customizable Interface
• Create custom symbology– Access to Data Attributes
• Anyone has the ability to access theattributes collected in the field at anytime
– Ability to develop custom scripts andplugins
• Run Quality Control Checks• To summarize project details such as
asset counts, conductor lengths, billablecriteria, or accounting details.
– Ease of Use• Data could be easily transferred
between field and design states with nodata conversion translator was required

Construction PrintsCreate custom asset symbology and notations

Environmental DataImport environmental data to be visualized with construction design

PermittingExport Data for General Permitting and Applications

Easement Drawings
Export data for Easement Exhibits Import Exhibits to check with design
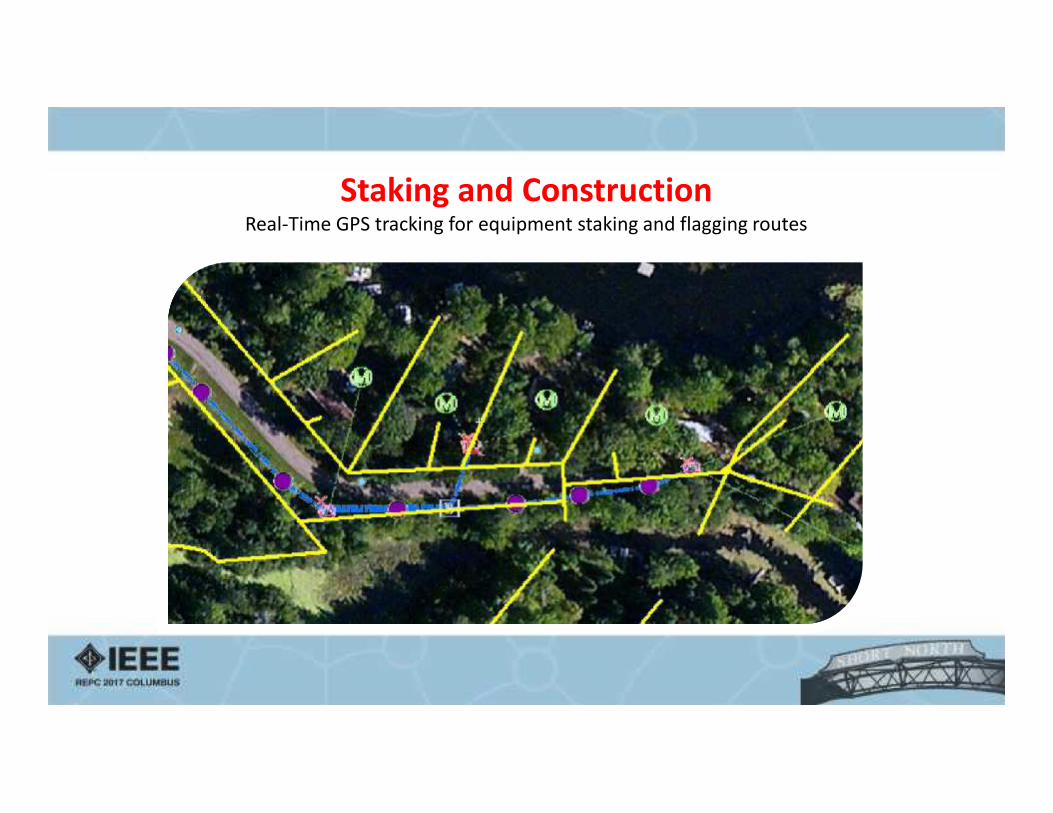
Staking and ConstructionReal-Time GPS tracking for equipment staking and flagging routes

Overhead RemovalPreset Layer Control that allows formultiple prints from one data file

As-BuiltReconciliation
Collect and compare separate layerswithin one project

Post Construction Early ObservationsThe first two full years of the SMRP included an installation of:
– 4,997,683’ of primary and secondary underground conductor– Over 934 Junction Enclosures– 492 Pad-mounted Switchgear devices– 2,742 Pad-mounted Transformers– 1,349 new underground services– Over 280 miles of overhead conductor removed from the system– There were 9,710 parcels involved including parcels with electric services and vacant parcels
• Only 437 landowners (approximately 4.5%) that refused right-of-entry for design purposes
SAIDI Impact:
– From 2008 through 2011 specifically for the 2014 underground segments, the average annual SAIDI impactswas 22.84 minutes with an average of 126 outage events annually.
– During 2015 there were a total of 16 outage events in those same 2014 project areas with a total SAIDIimpact of 0.76 minutes.
– Other detailed examples of immediate benefits and some important “lessons learned” are summarized in theannual post construction reports that were submitted to the Public Service Commission.

Questions?

Thank you!