Smart Metering and Smart Grids Strategy - ecra.gov.sa Metering... · Client ECRA – Electricity &...
254
Mod. RAPP v. 7 Smart Metering and Smart Grids Strategy for the Kingdom of Saudi Arabia Final Report: Strategy, Business Case, and Minimum Functional Requirements 2 nd June 2013
Transcript of Smart Metering and Smart Grids Strategy - ecra.gov.sa Metering... · Client ECRA – Electricity &...

Mo
d. R
AP
P v
. 7
Smart Metering and Smart Grids Strategy
for the Kingdom of Saudi Arabia
Final Report:
Strategy, Business Case, and Minimum Functional Requirements
2nd June 2013

CESI S.p.A. Via Rubattino 54 I-20134 Milano - Italy Tel: +39 02 21251 Fax: +39 02 21255440 e-mail: [email protected] www.cesi.it
Capitale sociale € 8.550.000 interamente versato C.F. e numero iscrizione Reg. Imprese di Milano 00793580150 P.I. IT00793580150 N. R.E.A. 429222 © Copyright 2013 by CESI. All rights reserved
Mo
d. R
AP
P v
. 7
Client ECRA – Electricity & Co-generation Regulatory Authority
Subject Smart Metering and Smart Grids Strategy for the Kingdom of Saudi Arabia
Phase 2 final report
Order 95/433
Notes
Partial reproduction of this document is permitted only with the written permission from CESI and A.T. Kearney
No. of pages 124 No. of pages annexed 133
Issue date 2nd June 2013
Prepared CESI : Marcelo Tardio, Marco Gobbi, Ettore De Berardinis, Giuseppe Pannunzio, Ciro Palumbo
AT Kearney: Ugo Bello, Jose Alberich, Riad Zantout
Verified Marcelo Tardio, CESI Ugo Bello, AT Kearney Tariq Khan, ECRA
Approved Dr Abdullah Al Shehri, Governor, ECRA
REPORT B3006974
Page 3
Table of contents
GLOSSARY ........................................................................................................................... 9
1 FOREWORD ................................................................................................................ 11
2 OBJECTIVES OF THE REPORT ....................................................................................... 11
3 EXECUTIVE SUMMARY ................................................................................................ 12
3.1 The KSA Electricity Market ............................................................................................... 12
3.2 Smart Meters and Smart Grids Opportunities and Benefits............................................... 12
3.3 Technology options .......................................................................................................... 16
3.4 The business case options and scenarios ............................................................................ 17
3.5 Customers and Regulatory issues ...................................................................................... 20
3.6 Implementation roadmap ................................................................................................. 21
3.6.1 SM/SG Programme governance .............................................................................. 21
3.6.2 Implementation phases .......................................................................................... 22
4 KEY CHALLENGES IN THE KSA ELECTRICITY MARKET ................................................... 24
4.1 Growing Consumption and peak demand ......................................................................... 24
4.2 Increases of power capacity .............................................................................................. 26
4.3 Network losses ...................................................................................................................27
4.4 Quality of supply ............................................................................................................... 28
4.5 Conclusions ....................................................................................................................... 29
5 SMART METERS AND SMART GRIDS SOLUTIONS ......................................................... 30
5.1 Overview of Smart Grids concepts ..................................................................................... 31
5.1.1 Transmission Network ............................................................................................ 32
5.1.2 Distribution Network .............................................................................................. 33
5.1.3 Customer-side Solutions ......................................................................................... 41
5.2 Smart Metering technologies and solutions ...................................................................... 45
5.2.1 Smart Metering systems architecture ..................................................................... 45
5.2.2 Communications technology options ..................................................................... 49
5.2.3 Standards and Protocols ......................................................................................... 54
5.2.4 Overview of Smart Meters functional requirements ................................................ 59
5.3 Smart Meters and Smart Grids International solutions ...................................................... 62
5.3.1 Smart Meters and Smart Grids solutions ................................................................ 62
5.3.2 SM/SG Communication Technologies and International Standards ........................ 63
5.3.3 Regulation, Funding and Roadmap. ....................................................................... 64
5.4 Proposed Smart Meters and Smart Grids options for KSA ................................................ 67

REPORT B3006974
Page 4
5.4.1 Smart Grids proposal for KSA .................................................................................. 67
5.4.2 Smart Meters proposal for KSA .............................................................................. 68
6 BUSINESS CASE ANALYSIS ...........................................................................................75
6.1 The Business Case Model ................................................................................................... 75
6.1.1 Cost Benefit Analysis ............................................................................................... 75
6.1.2 Base Assumptions ................................................................................................... 76
6.2 Business Case for Smart Grids ............................................................................................78
6.2.1 Summary of assessed benefits and costs [SG] ......................................................... 78
6.2.2 Direct Benefits Assumptions [SG] ........................................................................... 79
6.2.3 Indirect Benefits Assumptions [SG] ........................................................................ 80
6.2.4 Capex and Opex costs [SG] ..................................................................................... 81
6.2.5 Base Case Results [SG] ............................................................................................ 85
6.2.6 Sensitivity Analysis [SG] ......................................................................................... 86
6.3 Business Case for Smart Meters solutions ......................................................................... 89
6.3.1 Summary of assessed benefits and costs [SM] ....................................................... 89
6.3.2 Direct Benefit Assumptions [SM] ............................................................................ 91
6.3.3 Indirect Benefit Assumptions [SM] .......................................................................... 93
6.3.4 Capex and Opex costs [SM] .................................................................................... 94
6.3.5 Base Case Results [SM] ......................................................................................... 100
6.3.6 Sensitivity Analysis [SM] ....................................................................................... 102
7 CUSTOMER MANAGEMENT IMPLICATIONS ................................................................. 105
7.1 Customers Participation and Government Commitment ................................................ 106
7.2 New Paradigm for Appliances and Customers ................................................................. 107
7.3 Privacy and Security of data ............................................................................................ 108
7.3.1 Data protection by design and data protection by default settings ....................... 109
7.3.2 Data protection measures ..................................................................................... 109
7.3.3 Data security ......................................................................................................... 109
7.3.4 Information and transparency on smart metering ................................................. 110
7.3.5 Privacy and data security recommendations ......................................................... 110
7.4 Social aspects (special needs customers) ......................................................................... 111
7.5 Customer Engagement Actions ....................................................................................... 111
8 REGULATORY AND POLICY REQUIREMENTS .............................................................. 113
8.1 Implementation approach / policy .................................................................................... 113
8.2 Financing schemes ........................................................................................................... 115
8.3 Defining and monitoring of KPIs on progress and results ................................................. 115
8.4 Pricing Policy ................................................................................................................... 116

REPORT B3006974
Page 5
9 IMPLEMENTATION ROADMAP .................................................................................... 119
9.1 Programme Governance .................................................................................................. 119
9.1.1 Tasks of the Steering Committee .......................................................................... 120
9.1.2 Project Management Company ............................................................................ 120
9.1.3 Technical Working Groups .................................................................................... 121
9.2 Implementation Roadmap .............................................................................................. 122
9.2.1 Initial Steps (year 0) ............................................................................................... 122
9.2.2 Design phase (year 1) ............................................................................................ 122
9.2.3 Pre-rollout phase (year 2-3) ................................................................................... 123
9.2.4 Smart Meters and Smart Grids Implementation Phase (year 4-8) ......................... 123
9.2.5 Roadmap timeline ................................................................................................. 124
ANNEX I – COMMUNICATION COST ANALYSIS .......................................................................... 129
ANNEX II – MINIMUM FUNCTIONAL REQUIREMENTS ................................................................ 165
ANNEX II – SMART GRIDS TECHNOLOGIES ................................................................................. 239

REPORT B3006974
Page 6
List of Tables
Table 1: Support of SG and SM solutions to strategic objectives ............................................................ 15
Table 2: Cost and benefits from the Smart Grid solution ......................................................................... 17
Table 3: Cost and benefits from the Smart Meters solution ..................................................................... 19
Table 4: Public and private telecommunication networks ....................................................................... 42
Table 5: Wired and wireless communications.......................................................................................... 42
Table 6: Communications requirements for Transmission and Distribution networks ........................... 43
Table 7: Comparison of wireless communication technologies ............................................................... 52
Table 8: Advantages and disadvantages of Communications options ..................................................... 53
Table 9: IEC 62056 suite of protocols. Source: IEC ................................................................................ 55
Table 10: Current situation for the communication profiles. Source: IEC ............................................... 55
Table 11: Example of Communication among Meters ............................................................................. 57
Table 12: Some Protocols and communication technologies used in Open standards ............................. 58
Table 13: Summary of the Minimum Functional Requirements .............................................................. 61
Table 14: Smart Metering development status ......................................................................................... 63
Table 15: Smart Meters: Standard development and sourcing method .................................................... 64
Table 16: Smart Grids: progress and regulatory status in selected markets ............................................. 65
Table 17: Regulatory instruments on Smart Meters and Smart Grids ...................................................... 66
Table 18: Smart Metering implementation plans ..................................................................................... 66
Table 19: Model’s structure and scenarios ............................................................................................... 71
Table 20: GPRS & PLC scenario ............................................................................................................. 72
Table 21: Only GPRS scenario ................................................................................................................ 72
Table 22: Wi-Fi & Fibre-optic scenario ................................................................................................... 73
Table 23: RF & GPRS scenario ............................................................................................................... 73
Table 24: Business Case model structure ................................................................................................. 75
Table 25 Smart Grids Business Case – summary of major assumptions ................................................. 83
Table 26 Smart Meters Business Case – summary of major assumptions ............................................... 98

REPORT B3006974
Page 7
List of Figures
Figure 1 – Overview of Smart Meters and Smart Grid solutions ............................................................. 13
Figure 2 – Major benefits for the electricity system ................................................................................. 14
Figure 3 – Proposed Smart Meters and Smart Grids solutions for KSA .................................................. 15
Figure 4 – Smart Grids – Business Case Results – Direct Benefits ......................................................... 18
Figure 5 – Smart Grids – Business Case Results – Direct and Indirect Benefits ..................................... 18
Figure 6 – Smart Meters – Business Case Results – Direct Benefits ....................................................... 19
Figure 7 – Smart Meters – Business Case Results – Direct and Indirect Benefits ................................... 20
Figure 8 – Steering Committee Structure ................................................................................................. 22
Figure 9 – Smart Meters / Smart Grids implementation roadmap ........................................................... 23
Figure 10 – Electricity and Peak demand in KSA – Historical growth .................................................... 24
Figure 11 – Electricity demand – Breakdown by sector .......................................................................... 25
Figure 12 – Forecast of peak demand ...................................................................................................... 26
Figure 13 – Total installed capacity and electricity production by fuel type ........................................... 26
Figure 14 – Peak demand and existing /planned capacity ........................................................................ 27
Figure 15 – Network losses in KSA and international comparison ......................................................... 28
Figure 16 – Smart Grid conceptual representation ................................................................................... 31
Figure 17 – Smart Grid core components ................................................................................................ 32
Figure 18 - Voltage change in presence of Capacitor Banks or Line Voltage Regulators ....................... 34
Figure 19 - Reactive power capability of DGs for MV connection ......................................................... 35
Figure 20 - Volt-VAR control system for distributed generation ............................................................ 36
Figure 21 - Newer devices behaviour ....................................................................................................... 36
Figure 22 - ENTSO-e LVRT capability ................................................................................................... 37
Figure 23 – Over frequency response according to CENELEC TS 50549-1-2 ........................................ 38
Figure 24 – Over frequency response according to Italian CEI 0-16 ....................................................... 38
Figure 25 – Under frequency response according to ENTSO-e Rule for Generators (draft) ................... 38
Figure 26 – Under frequency response according to Italian CEI 0-16 ..................................................... 39
Figure 27 - Wireless public and private access networks ......................................................................... 43
Figure 28 – Key features of a Smart Meter .............................................................................................. 45
Figure 29 – Example and overview of Smart Meter Architectures .......................................................... 47
Figure 30 – Example of Software Applications Structure ........................................................................ 48
Figure 31 – Status of development for Smart Grid applications .............................................................. 62
Figure 32 – Preferred communication technology in EU for Smart Meters............................................. 63
Figure 33 – Communication architecture options for Smart Meters ........................................................ 69
Figure 35 – NPV for Smart Grids including indirect benefits .................................................................. 86

REPORT B3006974
Page 8
Figure 36 – Smart Grids – Sensitivity analyses........................................................................................ 87
Figure 37 – Smart Grids – Aggregated Base, Worst and Best Case ........................................................ 88
Figure 38 – NPV for Smart Meters by cost and direct benefit component ............................................ 101
Figure 39 – NPV for Smart Meters including indirect benefits ............................................................. 101
Figure 40 – Smart Meters – Sensitivity analyses ................................................................................... 103
Figure 41 – Smart Meters – Aggregated Base, Worst and Best Case .................................................... 104
Figure 42 – Smart buildings applications ............................................................................................... 107
Figure 43 – Key areas of Regulatory and policy framework for SG and SM ........................................ 113
Figure 44 – Steering Committee Structure ............................................................................................. 120
Figure 45 – Smart Meters / Smart Grids Implementation Roadmap ...................................................... 124
FINAL REPORT B3006974
Page 9
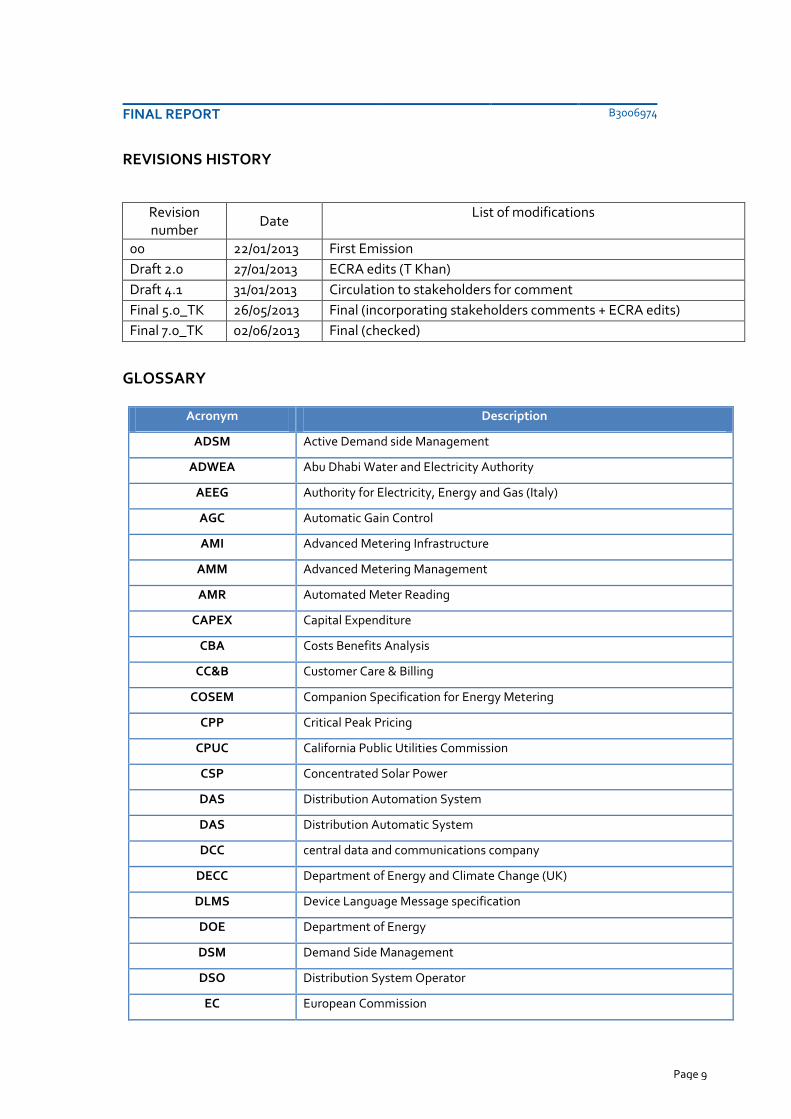
REVISIONS HISTORY
Revision number
Date List of modifications
00 22/01/2013 First Emission
Draft 2.0 27/01/2013 ECRA edits (T Khan)
Draft 4.1 31/01/2013 Circulation to stakeholders for comment
Final 5.0_TK 26/05/2013 Final (incorporating stakeholders comments + ECRA edits)
Final 7.0_TK 02/06/2013 Final (checked)
GLOSSARY
Acronym Description
ADSM Active Demand side Management
ADWEA Abu Dhabi Water and Electricity Authority
AEEG Authority for Electricity, Energy and Gas (Italy)
AGC Automatic Gain Control
AMI Advanced Metering Infrastructure
AMM Advanced Metering Management
AMR Automated Meter Reading
CAPEX Capital Expenditure
CBA Costs Benefits Analysis
CC&B Customer Care & Billing
COSEM Companion Specification for Energy Metering
CPP Critical Peak Pricing
CPUC California Public Utilities Commission
CSP Concentrated Solar Power
DAS Distribution Automation System
DAS Distribution Automatic System
DCC central data and communications company
DECC Department of Energy and Climate Change (UK)
DLMS Device Language Message specification
DOE Department of Energy
DSM Demand Side Management
DSO Distribution System Operator
EC European Commission

FINAL REPORT B3006974
Page 10
Acronym Description
ECRA Electricity & Co-generation Regulatory Authority
EER Energy Efficiency Ration
ETSI European Telecommunications Standards Institute
HAN Home Area Network
HV High Voltage
ICT Information & Communication Technologies
IEC International Electro-technical Commission
K.A.CARE King Abdullah City for Atomic and Renewable Energy
KACST King Abdulaziz City for Science and Technology
KPI Key Performance Indicator
MDM Metering Data Management
MV Medium voltage
NAN Neighborhood Area Network
OBIS Object identification system
Ofcom Office of Communications (UK) - Authority
OFGEM The Office of Gas and Electricity Markets (UK)
OPEX Operating Expenditure
PLC Power Line Communication
PV Photovoltaic
RES Renewable Energy Sources
RTU Remote Terminal Unit
SCADA Sending System Control and Data Acquisition
SEC Saudi Electricity Company
SEEC Saudi Energy Efficiency Centre
SG Smart Grid
SM Smart Metering
SPP State-wide Pricing Pilot
STC Saudi Telecommunications Company
TOU Time Of Use
TSO Transmission System Operator
UAE United Arab Emirates
V2G Vehicle to grid
WAN Wide Area Network

FINAL REPORT B3006974
Page 11
1 FOREWORD
The Electricity & Co-generation Regulatory Authority (“ECRA”) of the Kingdom of Saudi Arabia (KSA) was established in 2002 as an administratively and financially independent Regulator. ECRA’s primary goal is to ensure the provision of high quality and reliable electricity and desalinated water services at fair prices to customers.
In view of its responsibilities, ECRA is committed to consider new technologies, innovations and related developments in the Electricity Industry which may have sound, viable and sustainable potential impact to bring efficiency savings and enhanced services for customers in the Kingdom. The advent of Advanced Metering Infrastructure (AMI), Smart Meters, Information & Communication Technologies (ICT) and other emerging techniques bring the prospect of setting-up the “Smart Grid” (SG) concept. Thus, a dramatic contribution could be made to energy efficiency and generation capacity savings and whilst bringing new service enhancements to all customers in the Kingdom.
In this framework, CESI and A.T. Kearney have been selected to assist ECRA in the development of a strategic plan for Smart Meters and Smart Grids that can deliver the above aims along a well-defined and phased roadmap for implementation.
The primary objectives of the Study, as defined in the project Terms of Reference, are as follows:
Identifying Saudi Arabia’s current and future challenges which a Smart Meter / Smart Grid (SM / SG) strategy can help overcome.
Reviewing available smart metering technologies that are best suited for the Saudi Electricity Industry and its customers;
Assisting ECRA and representatives of the major Stakeholders of the Electricity Industry in the Kingdom of Saudi Arabia (KSA) in determining and finalizing the salient functional requirements of proposed Smart Meters to be deployed,
Developing a high level Smart Grid deployment strategy for Saudi Arabia, and
Advising on and help preparing the most efficient implementation, gradual and timely rolling-out of Smart Meters.
2 OBJECTIVES OF THE REPORT
This report is aimed at providing strategic guidelines for a Smart Grids and Smart Metering strategy in the Kingdom of Saudi Arabia, leveraging international experiences, local initiatives already in place and perception of priorities of local stakeholders in addressing local energy challenges.
This report includes a description of proposed technology solutions for Smart Meters and Smart Grids for KSA, a cost and benefit analysis on such solutions, customer implications and regulatory and policy requirements and a proposed implementation roadmap. A comprehensive set of minimum functional requirements for Smart Meters is provided in Annex II. The previous phase 1 report (available separately) covered a review of International Comparators, Current KSA Initiatives, Stakeholders Workshop, Survey, Interviews and Site Visits.

FINAL REPORT B3006974
Page 12
3 EXECUTIVE SUMMARY
3.1 The KSA Electricity Market
The electricity market of the Kingdom of Saudi Arabia (“KSA”) is facing a series of important challenges that reflect the underlying impressive growth of the national economy and the peculiar characteristics of the energy sector, strongly linked to the wide availability of the oil natural resource.
Such challenges relate to the impressive consumption and peak demand growth (+5% steady growth expected), the consequent need for additional power capacity (+70 GW by 2032), the improvable level of network losses (now equal to 10%) and of quality of supply.
In order to face these challenges, several stakeholders within the electricity sectors have already identified and/or launched, within the scope of their role, a portfolio of initiatives aimed at developing alternative energy sources, nuclear and renewables (K.A.CARE), promoting energy efficiency within end-users (SEEC) and beginning trials of Smart Meters and Smart Grid solutions (SEC, Marafiq).
ECRA itself is committed to provide its contribution to the resolution of the challenges outlined, in line with its mandate of being the regulatory authority for the electricity sector, by defining a Smart Grid and Smart Meter strategy for KSA aimed at:
Addressing the deployment strategy of Smart Meters and Smart Grids by network operators (SEC, Marafiq), with the proper regulatory framework
Enabling the development of alternative energies, energy efficiency and DSM measures, driven by other system authorities (K.A.CARE and SEEC)
3.2 Smart Meters and Smart Grids Opportunities and Benefits
A smart grid is an electricity network that uses digital and advanced technologies to monitor and manage the transport of electricity from all generation sources to meet the varying electricity demands of end-users. Smart grids co-ordinate the needs and capabilities of all generators, grid operators, end-users and electricity market stakeholders to operate all parts of the system as efficiently as possible, minimising costs and environmental impacts while maximising system reliability, resilience and stability.
Besides, Smart Grids refer to an integrated portfolio of network technical solutions which are spread across the whole electricity value chain and include the central and distributed generator, the high-voltage network and distribution system, the industrial users and building automation systems, and the end-use customers including their appliances and other household devices. Smart Metering is the first step or ‘building block’ toward a smart grid providing a highly advanced link between the utility and the end-user. The Smart Grid is characterized by a two-way flow of electricity and information to create an automated, widely distributed energy delivery network. It incorporates into the grid the benefits of distributed computing and communications to:
deliver real-time information;
enable the near instantaneous balance of supply and demand at the device level.
FINAL REPORT B3006974
Page 13
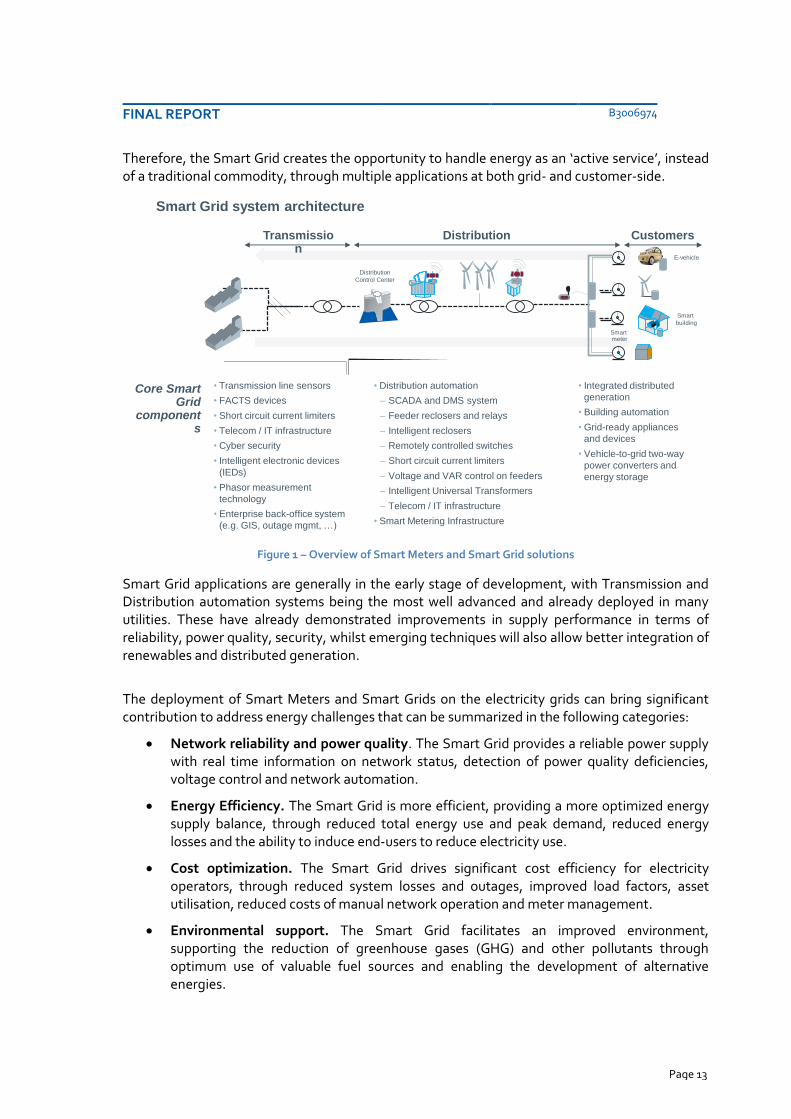
Therefore, the Smart Grid creates the opportunity to handle energy as an ‘active service’, instead of a traditional commodity, through multiple applications at both grid- and customer-side.
Figure 1 – Overview of Smart Meters and Smart Grid solutions
Smart Grid applications are generally in the early stage of development, with Transmission and Distribution automation systems being the most well advanced and already deployed in many utilities. These have already demonstrated improvements in supply performance in terms of reliability, power quality, security, whilst emerging techniques will also allow better integration of renewables and distributed generation.
The deployment of Smart Meters and Smart Grids on the electricity grids can bring significant contribution to address energy challenges that can be summarized in the following categories:
Network reliability and power quality. The Smart Grid provides a reliable power supply with real time information on network status, detection of power quality deficiencies, voltage control and network automation.
Energy Efficiency. The Smart Grid is more efficient, providing a more optimized energy supply balance, through reduced total energy use and peak demand, reduced energy losses and the ability to induce end-users to reduce electricity use.
Cost optimization. The Smart Grid drives significant cost efficiency for electricity operators, through reduced system losses and outages, improved load factors, asset utilisation, reduced costs of manual network operation and meter management.
Environmental support. The Smart Grid facilitates an improved environment, supporting the reduction of greenhouse gases (GHG) and other pollutants through optimum use of valuable fuel sources and enabling the development of alternative energies.
-
Overview of Smart Grids and Smart Meters solutions
Smart Grid system architecture
E-vehicle
Smart
building
…
Smart meter
Distribution
Control Center
Core Smart Grid
components
• Transmission line sensors
• FACTS devices
• Short circuit current limiters
• Telecom / IT infrastructure
• Cyber security
• Intelligent electronic devices
(IEDs)
• Phasor measurement
technology
• Enterprise back-office system
(e.g. GIS, outage mgmt, …)
Transmission
Distribution
• Distribution automation
– SCADA and DMS system
– Feeder reclosers and relays
– Intelligent reclosers
– Remotely controlled switches
– Short circuit current limiters
– Voltage and VAR control on feeders
– Intelligent Universal Transformers
– Telecom / IT infrastructure
• Smart Metering Infrastructure
• Integrated distributed
generation
• Building automation
• Grid-ready appliances
and devices
• Vehicle-to-grid two-way
power converters and
energy storage
Customers

FINAL REPORT B3006974
Page 14
Market unbundling. The Smart Grid supports unbundling and the opening of the electricity sector, through providing enhanced data on customer accounts and usage, advanced tariff structures, and the ability to switch supply contracts easily.
Such benefits are distributed among all the key stakeholders of the electricity systems, as follows:
T&D companies. Network utilities can reduce their operating costs, improve the quality of supply and optimize network control and automation.
Electricity Supply companies. Electricity retailers can provide service differentiation to compete in an open market and enrich the customer experience.
Customers. Customers can balance and optimized their energy consumption with the real-time supply of energy, with opportunities to save money through variable pricing. Smart grid information infrastructure will support additional services to customers not available today.
Regulator. The regulator can pursue its objectives to increase quality and reliability of supply and to push sector development.
National Economy. The National Economy as a whole can enjoy benefits from the diversification of the energy generation mix and significant financial impact from optimum fuel usage.
Figure 2 – Major benefits for the electricity system
Considering specific characteristics of the KSA electricity sector, the Smart Meters and Smart Grids Strategy for KSA needs to cover three key areas:
1. Renewable Energy: enable the achievement of Renewables targets and the deployment of such technologies within the grid
2. Network: improve network reliability, quality of service and efficiency
3. Customers: provide additional services to customers and enable energy efficiency targets.
-
National economy
Distribution network operator
Supply companies
Comsumer
Regulator
Generation mix
diversification
“Smart industry”
development
Innovation boost
Operational cost reduction
Losses reduction
Network control and
management optimization
Active consumption
management
More options to choose
Sector development
Increased Quality and
reliability of supply
Enriched customers
experience
Service differentiation
Major benefits for the electricity system
Smart Grid benefits for market stakeholders

FINAL REPORT B3006974
Page 15
Figure 3 – Proposed Smart Meters and Smart Grids solutions for KSA
Smart Meters and Smart Grids solutions in KSA can effectively support the achievement of such objectives in different ways, as illustrated in the following table.
Table 1: Support of SG and SM solutions to strategic objectives
-
Proposed Smart Grids and Smart Meters solutions for KSA
Smart Grids and Smart MeteringStrategy in KSA
Enable Renewable targets and deployment
on the network
Improve network reliability, quality of
service and efficiency
Provide additional services to
customers and enable energy
efficiency1 2 3
Major objectives of Smart Grids and Smart Metering Strategy in KSA
FINAL REPORT B3006974
Page 16
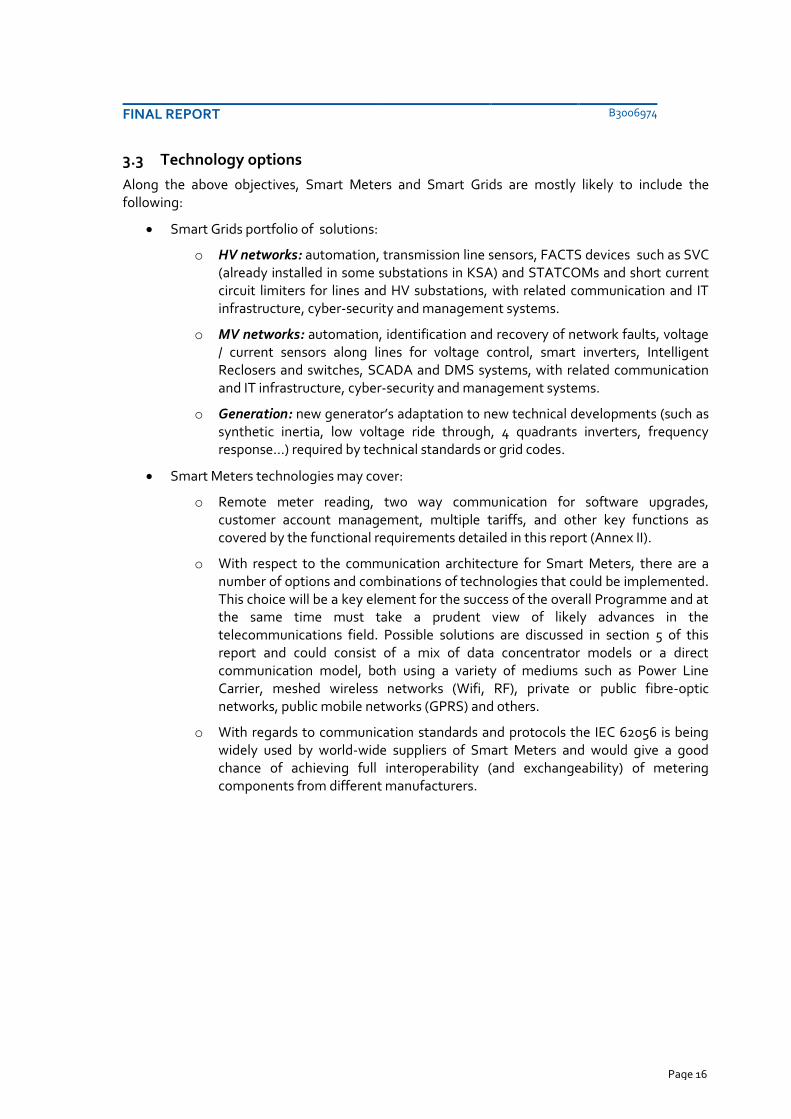
3.3 Technology options
Along the above objectives, Smart Meters and Smart Grids are mostly likely to include the following:
Smart Grids portfolio of solutions:
o HV networks: automation, transmission line sensors, FACTS devices such as SVC (already installed in some substations in KSA) and STATCOMs and short current circuit limiters for lines and HV substations, with related communication and IT infrastructure, cyber-security and management systems.
o MV networks: automation, identification and recovery of network faults, voltage / current sensors along lines for voltage control, smart inverters, Intelligent Reclosers and switches, SCADA and DMS systems, with related communication and IT infrastructure, cyber-security and management systems.
o Generation: new generator’s adaptation to new technical developments (such as synthetic inertia, low voltage ride through, 4 quadrants inverters, frequency response…) required by technical standards or grid codes.
Smart Meters technologies may cover:
o Remote meter reading, two way communication for software upgrades, customer account management, multiple tariffs, and other key functions as covered by the functional requirements detailed in this report (Annex II).
o With respect to the communication architecture for Smart Meters, there are a number of options and combinations of technologies that could be implemented. This choice will be a key element for the success of the overall Programme and at the same time must take a prudent view of likely advances in the telecommunications field. Possible solutions are discussed in section 5 of this report and could consist of a mix of data concentrator models or a direct communication model, both using a variety of mediums such as Power Line Carrier, meshed wireless networks (Wifi, RF), private or public fibre-optic networks, public mobile networks (GPRS) and others.
o With regards to communication standards and protocols the IEC 62056 is being widely used by world-wide suppliers of Smart Meters and would give a good chance of achieving full interoperability (and exchangeability) of metering components from different manufacturers.

FINAL REPORT B3006974
Page 17
3.4 The business case options and scenarios
The Business Case for Smart Meters and Smart Grids solutions in KSA highlights that, according to specific assumptions (detailed in Chapter 6), there is a positive cost-benefit based on direct costs (to the network companies). There are also indirect benefits, reflecting savings to the national economy, but these are not required to justify the deployment.
For the Smart Grids mid-case, over a 15-year time frame, the cumulated NPV is equal to 2,189 million SAR, composed as follows:
Table 2: Cost and benefits from the Smart Grid solution
Item Billion (SAR)
Costs for Smart Grid Solution
Smart Grids solution on the transmission network 5.6
Smart Grids solution on the distribution network 9.5
total operating costs of transmission 0.3
total operating costs of distribution 1.2
Total Cost (not discounted) 16.6
Total Costs discounted (NPV) 6.8
Benefits from the Smart Grids
reduced operating costs, through remote and automated operations 4.3
improved quality of service, mainly driven by reduction of technical losses 4.4
reduction of duration of outages. Such benefit, even if relatively lower, is significantly the most important for the perception of continuity of service by customers
0.24
Total Benefits (NPV) 9.0

FINAL REPORT B3006974
Page 18
Figure 4 – Smart Grids – Business Case Results – Direct Benefits
Besides the direct benefits for T&D operators, indirect benefits for the Saudi Arabia economy, are strongly higher and make NPV significantly soar, as illustrated in the following figure, mainly due to the increased availability of fuel for sale on international markets.
Figure 5 – Smart Grids – Business Case Results – Direct and Indirect Benefits
The Business Case analysis on Smart Meters in KSA (with detailed assumptions described in Chapter 6) shows positive value, considering costs and direct benefits of the base-case. Over a 15-year time frame, the cumulated NPV for a massive roll-out of Smart Meters is equal to 1.6 billion SAR, composed as follows:
-
Smart Grids – NPV by cost and direct benefit component-SAR Mn, 15 year timeframe-
Cumulated NPV
2,189
Increased continuity of
service
245
Improved qualityof services and
losses
4,448
Reduced operating
costs
4,330
Costs (capex and
opex)
6,834
Smart Grids – Business Case Results
-
Smart Grids – NPV by cost and direct and indirect benefit component-SAR Mn, 15 year timeframe-
Cumulated NPV
12,023
Reduced GHG
emissions
1,791
Increased availability of
fuel for sale to int’l markets
8,095
Optimized energy
capacity mix
52
Direct benefit
9,023
Costs (capex and
opex)
6,834
Smart Grids – Business Case Results
Indirect benefits

FINAL REPORT B3006974
Page 19
Table 3: Cost and benefits from the Smart Meters solution
Item Billion (SAR)
Costs for Smart Meter Solution
CAPEX required for installing SM massively 12.3
operating costs to operate and maintain equipment and systems 2.6
Total Cost (not discounted) 14.9
Total Costs discounted (NPV) 7.6
Benefits from the Smart Meters
reduced operating costs, through remote meter reading and management 2.5
Benefits which the greatest component is mainly driven by reduction of non-technical losses
5.5
improved billing accuracy 0.5
avoided replacement of traditional meters 0.7
Total Benefits (NPV) 9.2
Figure 6 – Smart Meters – Business Case Results – Direct Benefits
Besides the direct benefits linked to the initiative for T&D operators, indirect benefits, not only for T&D operators, but for the whole system, related to the opportunity to realize peak shaving are much higher and make the NPV significantly jump, as illustrated in the following figure, due
-
Smart Meters – NPV by cost and direct benefit component-SAR Mn, 15 year timeframe-
Cumulated NPV
1,615
Avoided replacement of
traditional meters
686
Improved billing
accuracy
465
Improved network losses
5,541
Reduced operating
costs
2,470
Costs (capex and
opex)
7,548
Smart Meters– Business Case Results
FINAL REPORT B3006974
Page 20
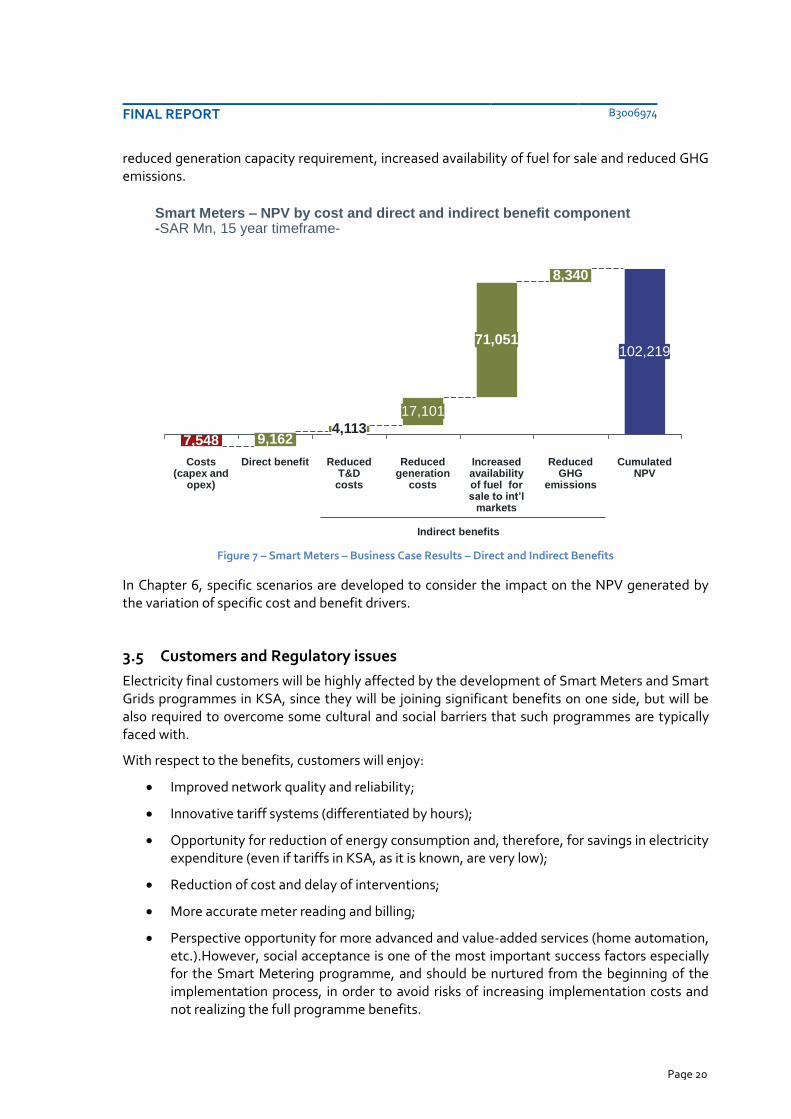
reduced generation capacity requirement, increased availability of fuel for sale and reduced GHG emissions.
Figure 7 – Smart Meters – Business Case Results – Direct and Indirect Benefits
In Chapter 6, specific scenarios are developed to consider the impact on the NPV generated by the variation of specific cost and benefit drivers.
3.5 Customers and Regulatory issues
Electricity final customers will be highly affected by the development of Smart Meters and Smart Grids programmes in KSA, since they will be joining significant benefits on one side, but will be also required to overcome some cultural and social barriers that such programmes are typically faced with.
With respect to the benefits, customers will enjoy:
Improved network quality and reliability;
Innovative tariff systems (differentiated by hours);
Opportunity for reduction of energy consumption and, therefore, for savings in electricity expenditure (even if tariffs in KSA, as it is known, are very low);
Reduction of cost and delay of interventions;
More accurate meter reading and billing;
Perspective opportunity for more advanced and value-added services (home automation, etc.).However, social acceptance is one of the most important success factors especially for the Smart Metering programme, and should be nurtured from the beginning of the implementation process, in order to avoid risks of increasing implementation costs and not realizing the full programme benefits.
-
Smart Meters – NPV by cost and direct and indirect benefit component-SAR Mn, 15 year timeframe-
Cumulated NPV
102,219
Reduced GHG
emissions
8,340
Increased availability of fuel for sale to int’l
markets
71,051
Reduced generation
costs
17,101
Reduced T&D
costs
4,113
Direct benefit
9,162
Costs (capex and
opex)
7,548
Smart Meters – Business Case Results
Indirect benefits

FINAL REPORT B3006974
Page 21
3.6 Implementation roadmap
3.6.1 SM/SG Programme governance
Smart Meters and Smart Grids solutions will directly influence other energy-related initiatives in KSA, such as the development of alternative energies and energy efficiency actions. Hence, an effective governance of the programmes should effectively involve all the relevant electricity market stakeholders, with specific mechanisms and roles.
To this extent, it is recommended to create a “Smart Meters and Smart Grids Steering Committee” (SM/SG SC), involving major electricity stakeholders, responsible for:
Development of a proper Smart Meters and Smart Grids National Plan, following the strategic guidelines of this Study and including the major topics to be regulated for the programmes, as illustrated above, in strong alignment with other energy initiatives as soon as these will be finalized and / or planned (alternative energies, energy efficiency);
Development of proposals for regulatory and legal framework upgrades, in line with the strategic guidelines, to ensure that the legislative background properly fits with Smart Grids and Smart Meters objectives;
Monitoring of implementation progress and benefit achievements for both Smart Grids and Smart Meters programmes, eventually proposing corrective actions in case actual results differ from original plans.
In order to be representative of key energy market stakeholders, the Steering Committee should be chaired by ECRA, as the energy regulatory authority, and composed on a fixed basis also by government bodies and utilities:
The Ministry of Water and Electricity (MOWE)
KA.CARE
SEEC
SEC
National Grid
Marafiq
Aramco
Representative of the customers and/or Customer Protection Associations
Representatives from manufacturing Industry
Representatives from telecommunications industry (including CITC)
Representatives from Academia (Universities and research organisations)
A Programme Management Company will also be established, to take ownership of the delivery timeline, as well as Technical Working groups reporting to the SM/SG Steering Committee.

FINAL REPORT B3006974
Page 22
Figure 8 – Steering Committee Structure
3.6.2 Implementation phases
It is proposed that the implementation roadmap will consist of the following 4 phases (see chapter 9.0 for details):
Initial Steps (year 0)
Establish SM/SG Steering Committee (and seek high level government approval for the SM/SG plan)
Establish Technical Working groups
Appoint Programme Management Company (PMC)
Design phase (year 1)
Complete SEC 60,000 meters trial (mainly non-residential)
Scope of work and tendering for pre-rollout phase activities
Finalise project execution / delivery schedule for complete roll-out (under project management company service agreement)
Complete work of Technical Working groups
Pre-rollout phase (year 2-3)
Pre roll-out trials: 150,000 meters: Urban (6 cities), minimum 4 suppliers
Pre roll-out trials: 100,000 meters: Rural (6 regions), minimum 4 suppliers
Field testing of AMM system (in second year of pre-rollout phase, with 2 AMM companies)
SM/SG Steering Committee
Government Entities:
ECRAMOWE
KA.CARESEECSEC
National GridMarafiqAramco
Industry / Telecommunications
AECInternational
manufacturersMobily, STC, Zain
CITC
Customer Representation
Consumer GroupsComplaints Committee
Academia / Research
UniversitiesSchools
KAPSARCKACST
Project Management Company
Technical Working Groups

FINAL REPORT B3006974
Page 23
Field testing of transmission and distribution network automation
Smart Meters and Smart Grids Implementation Phase (year 4-8)
Leveraging the pre-rollout trials phase, the massive roll-out of Smart Meters begins in year 4, including the residential sector, to be completed in 5 years. Also in this phase will be implemented the results of the pilots on Demand Response, new tariff rates, and other transitional policies.
The Smart Grids Implementation Phase has two important goals:
i) the automation of the transmission network by 2016 (taking into account the current degree of automation); and
ii) the automation of the distribution network by 2020.
Other components of Smart Grids implementation will be determined by the Technical Committees during the Design Phase (by end of year 1).
Figure 9 – Smart Meters / Smart Grids implementation roadmap
2013 2014 2015 2016 2017 2018 2019 2020 2021
Initial Steps
Design Phase
Programme Monitoring
Appoint Project Management Company
Smart Grids (network automation)
Smart Grids future technologies
Pre-rollout
Smart Meters Trials Smart Meters massive rollout

FINAL REPORT B3006974
Page 24
4 KEY CHALLENGES IN THE KSA ELECTRICITY MARKET
The electricity market of the Kingdom of Saudi Arabia (“KSA”) is facing a series of important challenges that reflect the underlying impressive growth of the national economy and the peculiar characteristics of the energy sector, strongly linked to the wide availability of the oil natural resource.
Such challenges, highly interconnected and outlined in the following sections, are already a reality and will become even more serious in years to come, requiring the need to be addressed today.
4.1 Growing Consumption and peak demand
Electricity consumption in the KSA has been growing significantly over the last years. In 2011, it reached a total of 219,662 GWh of energy, equal to an average increase of 6.7% yearly since 2007. Simultaneously, in the same period, the number of customers grew on average by 5.2% yearly, reaching 6.34 million users in 2011, from 5.18 million users in 2007. These values significantly reflect the underlying growth of the whole national economy and of the population.
Figure 10 – Electricity and Peak demand in KSA – Historical growth
Considering the past decade (2002-2011)1:
Energy consumption increased by 70.8% from 128,629 GWh in 2002 to 219,662 GWh in 2011
1 Source: ECRA, Activity Report, 2011
-
Growing Consumption and peak demand
Source: ECRA Activity Reports
Electricity demand in KSATWh
Peak demand in KSAGW
+6.7%
Others
Industrial
Government
Commercial
Residential
2011
220
8
42
28
33
109
2009
193
9
35
26
23
101
2007
169
6
31
24
19
89
2007-2011C.A.G.R.
+5.1%
+14.3%
+3.5%
+8.3%
+7.6%
# of customers
(‘000)
+5.2%5,183 5,702 6,341
4845
4037
35
8.2%
20112010200920082007
FINAL REPORT B3006974
Page 25
Number of customers grew from 4.03 million in 2002 to 6.34 million in 2011, an increase of 57.5 %
Peak demand increased by 102.1% from 23.938 GW in 2002 to 48.367 GW in 2011.
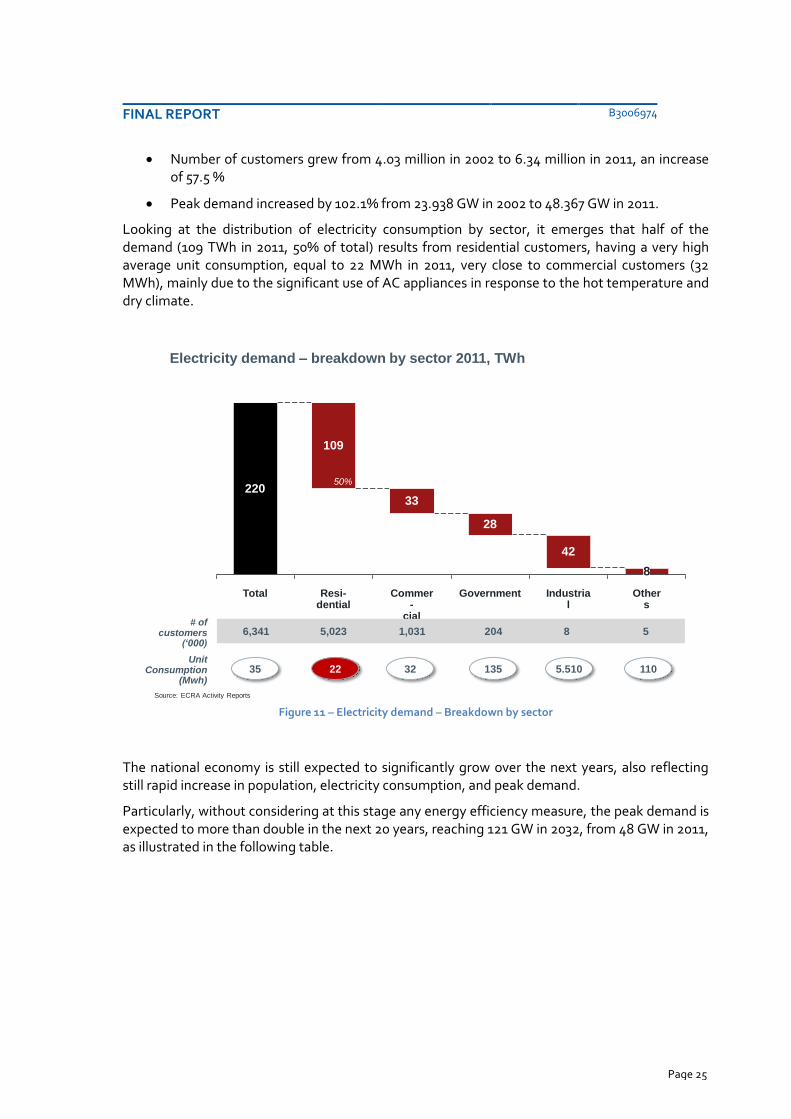
Looking at the distribution of electricity consumption by sector, it emerges that half of the demand (109 TWh in 2011, 50% of total) results from residential customers, having a very high average unit consumption, equal to 22 MWh in 2011, very close to commercial customers (32 MWh), mainly due to the significant use of AC appliances in response to the hot temperature and dry climate.
Figure 11 – Electricity demand – Breakdown by sector
The national economy is still expected to significantly grow over the next years, also reflecting still rapid increase in population, electricity consumption, and peak demand.
Particularly, without considering at this stage any energy efficiency measure, the peak demand is expected to more than double in the next 20 years, reaching 121 GW in 2032, from 48 GW in 2011, as illustrated in the following table.
-
Source: ECRA Activity Reports
Electricity demand – breakdown by sector 2011, TWh
# of customers
(‘000)
Others
8
Industrial
42
Government
28
Commer-
cial
33
Resi-dential
109
Total
220
UnitConsumption
(Mwh)
6,341 5,023 1,031 204 8 5
35 22 32 135 5.510 110
50%
Growing Consumption and peak demand

FINAL REPORT B3006974
Page 26
Figure 12 – Forecast of peak demand
4.2 Increases of power capacity
In the last years, the installed power capacity increased dramatically to support the growth of electricity consumption and of the peak demand specifically, in order to provide an adequate reserve margin for the stability and continuity of electricity to customers.
At 2011, the total installed capacity reached 57 GW, with +20 GW increase since 2007, equal to an average annual capacity growth of 12%. In terms of power generation mix, nearly 63% of the electricity production is covered with oil-based sources (crude oil, diesel and heavy fuel oils).
Figure 13 – Total installed capacity and electricity production by fuel type
In order to cover the impressive growth in peak demand expected in the next years (121 GW in 2032, without considering energy efficiency measures), the power capacity will have to nearly double by 2032, with 70 GW of new plants needed.
-
Source: ECRA DSM study
Forecast of Peak Demand in KSA2009-2032, GW
121
484540
140
120
100
80
60
40
20
0
+5%
+10%
2032202720222009 2010 2011 2012 2017
Growing Consumption and peak demand
-
Strong increase of power capacity
Source: ECRA Activity Reports
Total installed capacity2011, GW
50%
20112007
+12%
2009
51
37
57
Electricity production by fuel type2011, % on total
Crude Oil
Natural Gas
Diesel
37%
37%
Heavy Fuel Oils
5%
21%
FINAL REPORT B3006974
Page 27
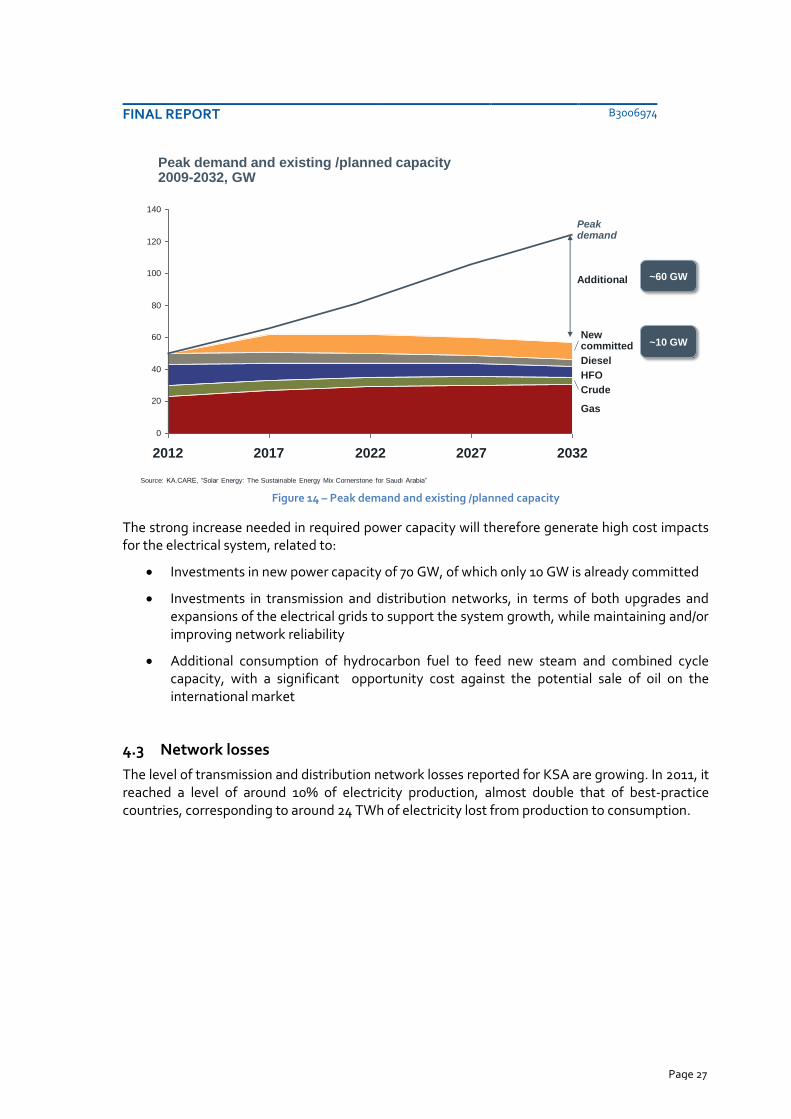
Figure 14 – Peak demand and existing /planned capacity
The strong increase needed in required power capacity will therefore generate high cost impacts for the electrical system, related to:
Investments in new power capacity of 70 GW, of which only 10 GW is already committed
Investments in transmission and distribution networks, in terms of both upgrades and expansions of the electrical grids to support the system growth, while maintaining and/or improving network reliability
Additional consumption of hydrocarbon fuel to feed new steam and combined cycle capacity, with a significant opportunity cost against the potential sale of oil on the international market
4.3 Network losses
The level of transmission and distribution network losses reported for KSA are growing. In 2011, it reached a level of around 10% of electricity production, almost double that of best-practice countries, corresponding to around 24 TWh of electricity lost from production to consumption.
-
Source: KA.CARE, “Solar Energy: The Sustainable Energy Mix Cornerstone for Saudi Arabia”
100
20
80
60
40HFO
Diesel
New committed
20322027202220172012
0
Gas
Crude
140
120
Peakdemand
~60 GW
Peak demand and existing /planned capacity2009-2032, GW
Strong increase of power capacity
Additional
~10 GW
FINAL REPORT B3006974
Page 28
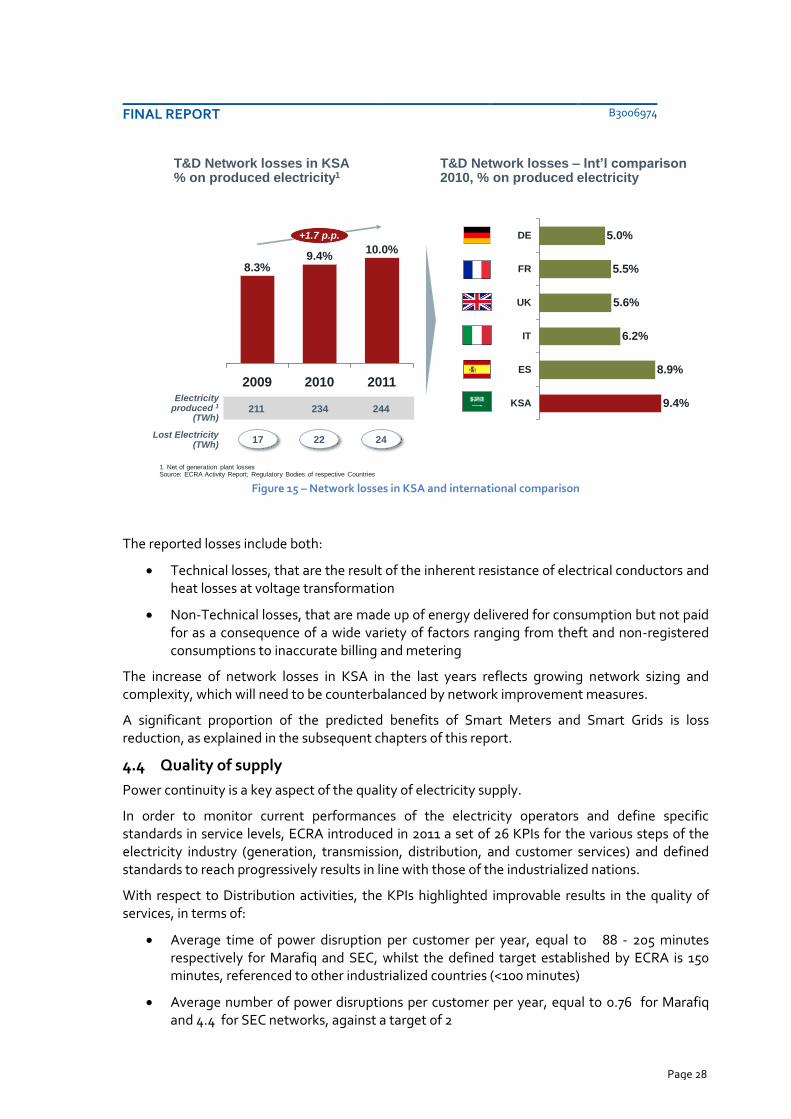
Figure 15 – Network losses in KSA and international comparison
The reported losses include both:
Technical losses, that are the result of the inherent resistance of electrical conductors and heat losses at voltage transformation
Non-Technical losses, that are made up of energy delivered for consumption but not paid for as a consequence of a wide variety of factors ranging from theft and non-registered consumptions to inaccurate billing and metering
The increase of network losses in KSA in the last years reflects growing network sizing and complexity, which will need to be counterbalanced by network improvement measures.
A significant proportion of the predicted benefits of Smart Meters and Smart Grids is loss reduction, as explained in the subsequent chapters of this report.
4.4 Quality of supply
Power continuity is a key aspect of the quality of electricity supply.
In order to monitor current performances of the electricity operators and define specific standards in service levels, ECRA introduced in 2011 a set of 26 KPIs for the various steps of the electricity industry (generation, transmission, distribution, and customer services) and defined standards to reach progressively results in line with those of the industrialized nations.
With respect to Distribution activities, the KPIs highlighted improvable results in the quality of services, in terms of:
Average time of power disruption per customer per year, equal to 88 - 205 minutes respectively for Marafiq and SEC, whilst the defined target established by ECRA is 150 minutes, referenced to other industrialized countries (<100 minutes)
Average number of power disruptions per customer per year, equal to 0.76 for Marafiq and 4.4 for SEC networks, against a target of 2
-
Network losses
1. Net of generation plant losses Source: ECRA Activity Report; Regulatory Bodies of respective Countries
T&D Network losses in KSA% on produced electricity1
50%
+1.7 p.p.
2011
10.0%
2010
9.4%
2009
8.3%
T&D Network losses – Int’l comparison2010, % on produced electricity
Electricity produced 1
(TWh)211 234 244
Lost Electricity (TWh)
17 22 24
KSA 9.4%
ES 8.9%
IT 6.2%
UK 5.6%
FR 5.5%
DE 5.0%

FINAL REPORT B3006974
Page 29
In order to optimize the performance level, network operators are already performing specific investments on the electrical grid.
4.5 Conclusions
In order to address the imperative challenges discussed above the opportunity for Smart Grid and Smart Meter systems, the subject of this strategic study, are seen to be a major solution to these needs. A timely and well managed deployment of these technologies will therefore be a major economic and social contributor to the KSA.

FINAL REPORT B3006974
Page 30
5 SMART METERS AND SMART GRIDS SOLUTIONS
The words “Smart Grid” refer to an integrated portfolio of network technical solutions aimed at modernizing the electricity delivery system, making it able to monitor, protect and automatically optimize the operation of its interconnected elements. Such elements are spread across the whole electricity value chain and include the central and distributed generator, the high-voltage network and distribution system, the industrial users and building automation systems, and the end-use customers including their thermostats, electric vehicles, appliances and other household devices. This chapter starts with the description of the main technologies applied to typical Smart Grid (transmission and distribution networks) and Smart Metering solutions (communication and advance metering infrastructure). The same technologies are then evaluated in the context of Saudi Arabia to assess which are the most feasible and profitable ones. Starting from the technological assumptions of this chapter, the next chapters illustrate key aspects of a proper strategy framework for the development of both Smart Meters and Smart Grids solutions in KSA:
Business Case analysis (Chapter 6), assessing their profitability for T&D operators – under current structure - and whole system
Customer Management implications (Chapter 7), describing additional services available to customers, expected barriers and implications
Regulatory and Policy Framework requirements (Chapter 8), that are needed to push the proper development of such solutions
Proposed implementation approach (Chapter 9), to realistically implement such solutions and start capturing related benefits
FINAL REPORT B3006974
Page 31
5.1 Overview of Smart Grids concepts
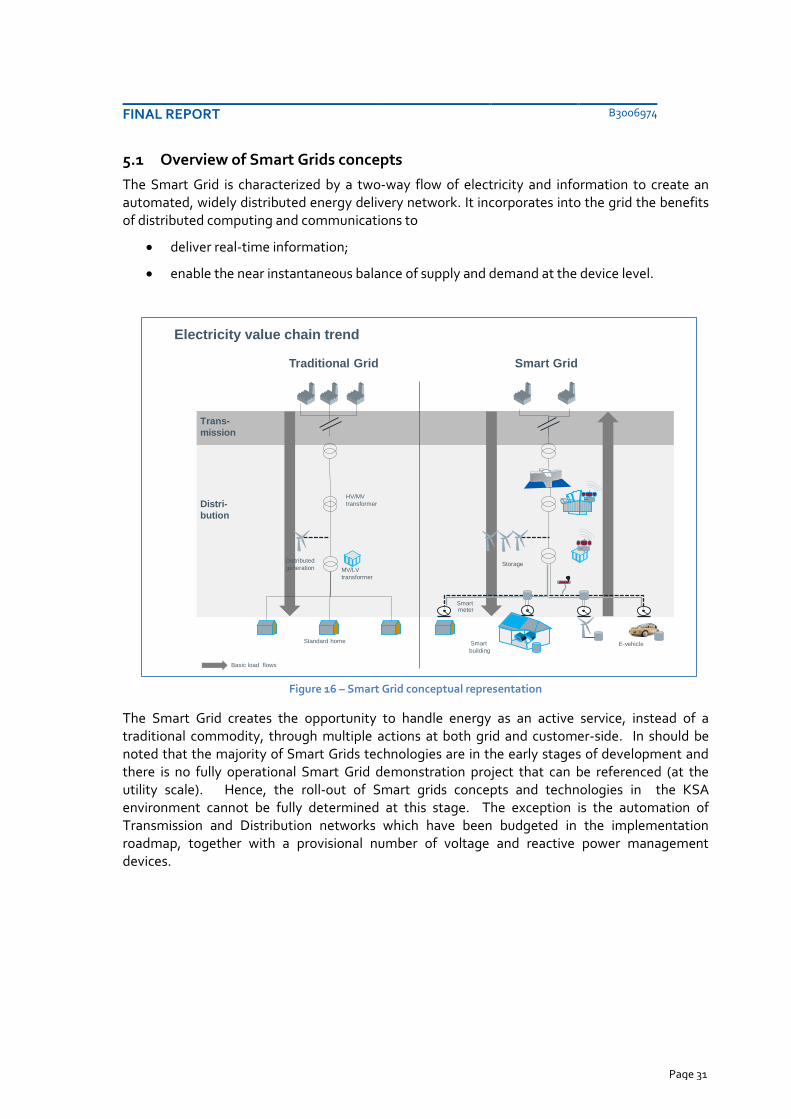
The Smart Grid is characterized by a two-way flow of electricity and information to create an automated, widely distributed energy delivery network. It incorporates into the grid the benefits of distributed computing and communications to
deliver real-time information;
enable the near instantaneous balance of supply and demand at the device level.
Figure 16 – Smart Grid conceptual representation
The Smart Grid creates the opportunity to handle energy as an active service, instead of a traditional commodity, through multiple actions at both grid and customer-side. In should be noted that the majority of Smart Grids technologies are in the early stages of development and there is no fully operational Smart Grid demonstration project that can be referenced (at the utility scale). Hence, the roll-out of Smart grids concepts and technologies in the KSA environment cannot be fully determined at this stage. The exception is the automation of Transmission and Distribution networks which have been budgeted in the implementation roadmap, together with a provisional number of voltage and reactive power management devices.
-
Traditional Grid Smart Grid
Overview of Smart Grids and Smart Meters solutions
Electricity value chain trend
Basic load flows
Standard homeE-vehicleSmart
building
MV/LV
transformer
Distri-
bution
Distributed
generation
…
HV/MV
transformer
Storage
Smart meter
Trans-
mission

FINAL REPORT B3006974
Page 32
Figure 17 – Smart Grid core components
Grid-side applications include a combination of current and advanced technologies that are introduced within the Transmission and Distribution electricity networks to improve supply performance in terms of reliability, power quality, security, ability to integrate renewables and distributed generation and provide enhanced services to customers.
5.1.1 Transmission Network
Transmission networks have already quite some intelligence incorporated because there are already devices that can be controlled remotely (circuit breakers, switches, generators, etc.). Nevertheless some other solutions can today be applied to make smarter a Transmission network.
Transmission line sensors, enabling the monitoring of real-time system data (voltage/current, conductor temperature, etc.) that can be processed and turned into useful operational predictive information: for instance to perform Dynamic Thermal Ratings in order to increase utilization of existing transmission network assets, to enhance the power flow, to solve congestions, to predict/know line sag, so optimising the use of existing transmission assets, without the risk of causing overloads. In this category also Intelligent Electronic Devices (“IED”), encompassing a wide array of microprocessor-based controllers of power system equipment, useful to perform automatic operations in the stations or on the lines.
Flexible AC Transmission Systems (“FACTS”) enhance the controllability of transmission networks and maximise power transfer capability. The deployment of this technology on existing lines can improve efficiency by managing active and reactive power flows and defer the need for additional investment. Renewable generation on HV would benefit from the introduction of such devices which would increase the hosting capacity of the network.
-
Overview of Smart Grids and Smart Meters solutions
Smart Grid system architecture
E-vehicle
Smart
building
…
Smart meter
Distribution
Control Center
Core Smart Grid
components
• Transmission line sensors
• FACTS devices
• Short circuit current limiters
• Telecom / IT infrastructure
• Cyber security
• Intelligent electronic devices
(IEDs)
• Phasor measurement
technology
• Enterprise back-office system
(e.g. GIS, outage mgmt, …)
Transmission
Distribution
• Distribution automation
– SCADA and DMS system
– Feeder reclosers and relays
– Intelligent reclosers
– Remotely controlled switches
– Short circuit current limiters
– Voltage and VAR control on feeders
– Intelligent Universal Transformers
– Telecom / IT infrastructure
• Smart Metering Infrastructure
• Integrated distributed
generation
• Building automation
• Grid-ready appliances
and devices
• Vehicle-to-grid two-way
power converters and
energy storage
Customers

FINAL REPORT B3006974
Page 33
Short circuit current limiters, limiting fault current to a level acceptable for normal operation of the existing power system and particularly where a new generation (renewables) is injected at distributed locations.
Phasor measurement units (“PMU”) technology (also known as synchro-phasors) for wide area monitoring, providing real-time information about the power system’s dynamic performance and therefore providing the ability to monitor and manage the reliability and security of the grid over large areas. In fact, the ability to monitor grid conditions and receive automated alerts in real-time is essential for assuring reliability. Synchro-phasor technology provides an accurate picture of grid conditions giving to TSOs (Transmission System Operators) wide-area situational awareness so allowing coordination with neighbouring control areas. The synchro-phasor technology consists of a Wide Area Measurement System (WAMS) that uses real-time data/measures coming from Peripheral Measurement Units (PMU) installed on well-defined nodes. PMUs provide voltage & current measurements that can be used to detect grid events, to assess and to maintain system stability in order to reduce the likelihood of an event causing widespread grid instability. More details are given in Annex III.
As regards communications and IT infrastructure, they are already available because the devices may already be controlled remotely. Therefore only upgrades will be necessary when new applications will be implemented (for instance Cascading Events Detection and Mitigation, Condition based Maintenance of Circuit Breakers).
5.1.2 Distribution Network
On the other hand, with respect to the Distribution network, Smart Grid applications usually apply to the following fields:
Volt-VAR control (also known as VVC, Variable Voltage Control)
Ancillary services
Automation for fault selection of the smaller number of branches along MV lines
Advanced control systems using DMS
Potential development and use of micro-grids
5.1.2.1 Volt-VAR control
Volt-VAR control in the distribution networks are generally aimed
at maintaining acceptable voltages at all points along the feeder under all loading conditions by using:
o Transformer Tap Changer Control, o Power factor set-point control for PV/Wind plants o Line Drop Compensation
at operating the distribution system at the lowest possible voltage without violating any load and voltage constraints
at reducing losses along the lines
Voltage profiles along MV lines are generally controlled by imposing a defined value at the MV bus-bar by means of the HV/MV tap-changer. The choice of this value is taken into consideration

FINAL REPORT B3006974
Page 34
the voltage drop along the lines so is maintaining voltage limit within defined ranges for the electrically more distant node (see Figure 18).
Figure 18 - Voltage change in presence of Capacitor Banks or Line Voltage Regulators
The voltage profile may be enhanced in long and loaded lines by using Switched Capacitor Banks or Line Voltage Regulators because they can compensate the reactive power (VAR) requested from loads2.
Another element to be taken into account is the presence of distributed generators (DGs) on the distribution networks. In fact, they may change the voltage so determined a radical change in the voltage profile of MV lines. This results in an increase of the voltage at that node and, more generally, in a variation of the voltage profile along the entire line that can reach critical (too high) values according to the size of the generator itself.
On the other hand, the presence of Distributed Generators (DGs) may be a chance for the voltage control as they may exchange reactive power with the network as Capacitor Banks or Line Voltage Regulators if they would have suitable characteristics like shown in CENELEC Technical Standard. At this aim, also Grid Code should be updated to include such requirements.
2 “Case Study: How the Commission Used a Smart Grid Programme to Identify, Resolve & Prevent Losses”, Ohio Public
Utilities Commission

FINAL REPORT B3006974
Page 35
Figure 19 - Reactive power capability of DGs for MV connection
In cases in which the energy produced by distributed generation is greater than that consumed by passive loads in the network, the MV network can become "active" in the sense that it can export energy to the high-voltage network. The voltage profile along the MV lines, in such cases, is strongly influenced by the presence, and of course the size, of the generators installed.
Assuming to have available a suitable communication system and in the perspective of Distributed Generation, the Voltage – VAR control suited for KSA might be based on:
the measurement of the MV bus bar voltage,
the measurement of the voltage at the nodes where the generator is connected or in other critical point of the network.
the exchange of information between the generators on the MV network and the control centre that knows in real time the trim network.
FINAL REPORT B3006974
Page 36
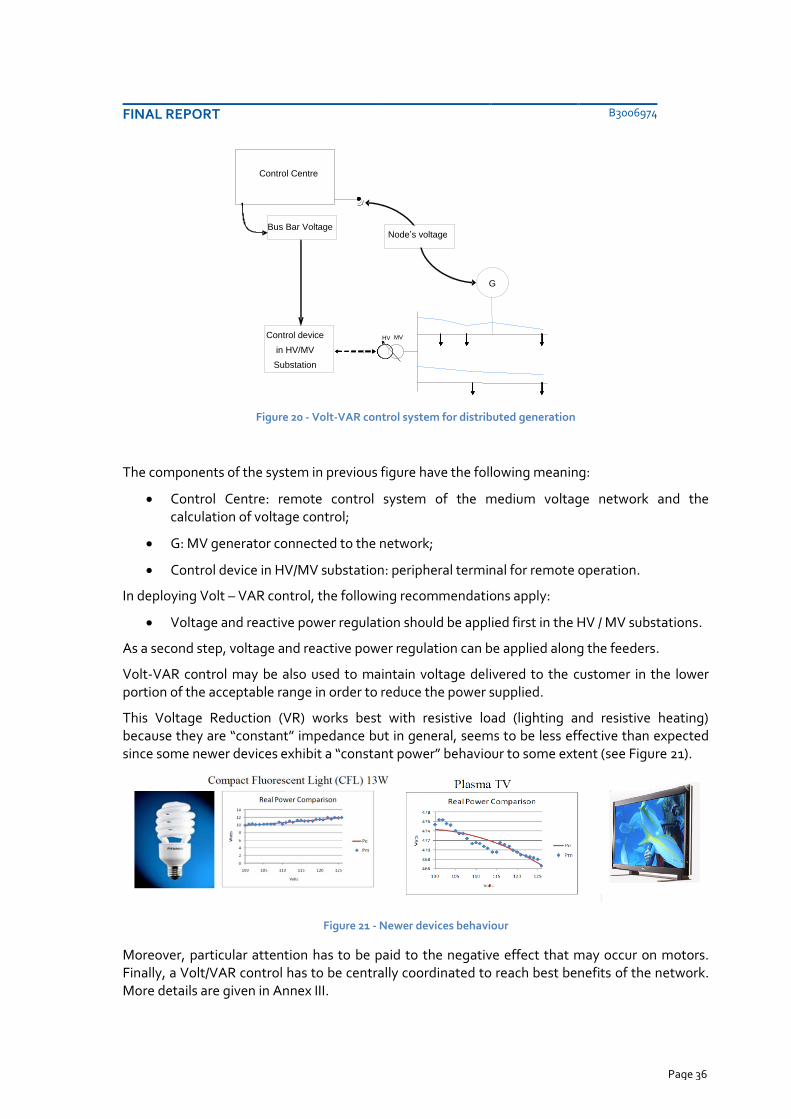
Figure 20 - Volt-VAR control system for distributed generation
The components of the system in previous figure have the following meaning:
Control Centre: remote control system of the medium voltage network and the calculation of voltage control;
G: MV generator connected to the network;
Control device in HV/MV substation: peripheral terminal for remote operation.
In deploying Volt – VAR control, the following recommendations apply:
Voltage and reactive power regulation should be applied first in the HV / MV substations.
As a second step, voltage and reactive power regulation can be applied along the feeders.
Volt-VAR control may be also used to maintain voltage delivered to the customer in the lower portion of the acceptable range in order to reduce the power supplied.
This Voltage Reduction (VR) works best with resistive load (lighting and resistive heating) because they are “constant” impedance but in general, seems to be less effective than expected since some newer devices exhibit a “constant power” behaviour to some extent (see Figure 21).
Figure 21 - Newer devices behaviour
Moreover, particular attention has to be paid to the negative effect that may occur on motors. Finally, a Volt/VAR control has to be centrally coordinated to reach best benefits of the network. More details are given in Annex III.
Control Centre
HV MV
Bus Bar Voltage
G
Control device
in HV/MV
Substation
Node’s voltage

FINAL REPORT B3006974
Page 37
5.1.2.2 Ancillary services
As ancillary services, inverter should provide:
Low Voltage Ride Through (LVRT)
In some European countries (Germany, Denmark, Italy…) the LVRT capability has been already applied according to National rules. Furthermore, European Standards as ENTSO-E RFG and CENELEC Technical Specification 50438 and 50549-1-2 require the LVRT capability as shown in Figure 22.
Figure 22 - ENTSO-e LVRT capability
Voltage Control as described previously
Frequency response to power variation
In a transmission network, it is important to keep the frequency as stable as possible because the biggest generating resources, all of which are synchronous machines, work at their most efficient point at exactly 60Hz. Also, the speed governors on these machines must operate in lock-step to share the generation load between machines to the specified schedule. For the frequency to remain stable the generated active power must match the power demand at all times. Active power curtailment and ramp rates are commonly used in big power plants to mitigate site-specific concerns and help improve grid stability. However, whether the amount of distributed generation reaches critical levels (which depends on the network’s features and needs specific analysis), DGs should contribute to the frequency stability as well. At this aim, in Europe, the standard bodies are developing rules requesting under and over frequency response by the inverters (Figure 23, Figure 24, Figure 25 and Figure 26).

FINAL REPORT B3006974
Page 38
Figure 23 – Over frequency response according to CENELEC TS 50549-1-2
Figure 24 – Over frequency response according to Italian CEI 0-16
Figure 25 – Under frequency response according to ENTSO-e Rule for Generators (draft)

FINAL REPORT B3006974
Page 39
Figure 26 – Under frequency response according to Italian CEI 0-16
Participation in emergency plan
Each Country has to handle its own defence plan to take into account load / generation conditions. As an example, in Italy the TSO requires the possibility to disconnect generation plants above 100 kW by remote or planned command.
5.1.2.3 Automation for fault location and isolation on radial MV lines
A permanent fault may occur at any time on MV lines and it will result in an outage involving a number of customers (SAIFI) for some time (SAIDI). The number of customers involved and the outage duration depends on the procedures adopted to locate / isolate the fault.
MV network automation can dramatically reduce both the number of customers (SAIFI) involved and the outage duration (SAIDI) by automatically performing the same operation carried out by personnel.
Essentially, it is necessary to install switches / circuit breakers along the lines, peripheral units (PUs) operating on them and able to communicate with a central control room.
Many types of automation are of course possible but often they are based on re-closing cycles operated in the HV/MV station: the open / close circuit breakers cycles allow to isolate the fault on the lines on the basis of fault passage indicators (FPIs) and voltage absence/presence information provided by PUs locally or remotely assisted/coordinated.
More details are given in Annex III.
5.1.2.4 Advanced control systems using DMS
Distribution (MV) networks are typically operated radially but the normal running arrangements may need to be changed as a consequence of faults or operational needs (e.g. due to load balancing or active/reactive power flows). Changes are traditionally carried out on the basis of

FINAL REPORT B3006974
Page 40
off-line calculation or operator “experience”. It’s therefore clear that a tool able to ”give” suggestions on the best operation “options” would allow the operator to manage the network more dynamically and efficiently.
Such tools, necessary for dynamic network management, are generally called DMS (distribution management systems). These can provide system to the engineer and dispatcher information / suggestions to effectively and efficiently engineer, plan and operate the distribution network. In fact, it can analyse dynamically changing distribution networks in real-time, while providing scenarios capability for both backward and forward review to identify options to improve network reliability while lowering losses.
Advanced DMS can hence solve the critical distribution network condition (for instance overload in some branches) or can give suggestion on the best network configuration for choosing objectives (for instance, technical losses reduction, voltage profile optimization).
Furthermore, DMS can better integrate a large number of renewable energy resources into the distribution network, maintaining the balance needed to reliably operate different energies. Some functions of DMS include:
State Estimation (SE): it is mainly aimed at providing a reliable estimate of the system voltages.
Load Flow Applications (LFA): it analyses the power systems in normal steady-state operation.
Fault Management & System Restoration (FMSR): the DMS application receives faults information from the SCADA system and processes the same for identification of faults and in running switching management application; the results are converted into action plans by the applications and may be used to enhance the continuity of service.
Distribution Load Forecasting (DLF): it provides a structured interface for creating,
managing and analysing load forecasts. Accurate models for electric power load
forecasting are essential to the operation and planning for a utility company.
Automatically re-configure the network (this feature is not usually utilized).
DMS is actually used in several countries, and also in Italy by ENEL, in order to give information on the State Estimation, on the better network re-configuration in case of fault, on the short circuit currents”. More details are given in Annex III.
5.1.2.5 Potential development and use of micro-grids
A micro-grid is a smaller power grid that can operate either by itself or connected to a larger utility grid. The proposition is that "if your home is part of a micro-grid, you could continue to receive power even when the utility power goes out”, because "it gives you the ability to ride through any disturbances or outages by seamlessly switching over to locally generated power"3.
It's important to note that a backup power system — like a diesel generator — is not the same as a micro-grid because they can supply power to local loads in the event of an outage, but there is usually a delay after the disconnect from the utility grid. In addition, a backup system is not intended to run continuously, nor put power into the grid.
3 NREL (National Renewable Energy Laboratory).

FINAL REPORT B3006974
Page 41
A micro-grid therefore consists in a “local” grid where generators (solar, wind, storage) are able to supply loads in a well-coordinated and stable way in order to have a good quality and continuity of service even in the event of an outage of the “main” grid: in fact, it can disconnect from the “main” grid without any additional transient.
This means that a suitable control centre has to coordinate properly flexible generators (with suitable capabilities today not always available) in order to balance loads in real-time; moreover, the re-synchronization of the micro-grid to the “main” grid is an additional challenge because the same control centre has to carry out a parallel between two grids, the “main” grid and the micro-grid composed by many different generators and loads. Last, but not least, the protection system has to be usually changed in order to properly operate in all the possible conditions (in parallel with the “main” grid or isolated from it).
Because of the very challenging above mentioned issues, until now only limited experiences have been achieved and this is the reason why at this stage of the project is not advisable to take the microgrids in consideration. the business case model doesn’t take into account this item. As a general recommendation, micro-grids may have some applications for an islanded network but they require special devices in order to control the network by means of:
Balancing generated and absorbed power
Regulating voltage
As regards communications and IT infrastructure, they have to be realized for the distribution network control in order to implement the above mentioned applications. More details are given in Annex III.
5.1.3 Customer-side Solutions
Besides the described grid-side applications, Smart grids also include a portfolio of customer-side solutions that are enabled by the previous ones and encompass new services and functionalities provided to customers as a result of full integration with electricity supply systems and emerging of new electrical and electronic technologies.
Such customer side applications can be summarized in the following:
Demand Response, based on differentiated tariffs (for example, by Time of Use), able to alter demand patterns and therefore electricity peak demand. This may include ‘direct load control’ of large loads on the customer side (such as air conditioning, heating, pumping) via a utility-controlled scheme.
Building automation and grid-ready “intelligent” appliances and devices, able to improve energy management in the home and commercial buildings, reducing peak demand and improving energy efficiency.
Integrated distributed generation, including a variety of customer-owned systems, such as rooftop photovoltaic (PV) systems.
All these solutions may be coordinated via electricity meter or gateway. Therefore, a local communication network is required, usually called a Home Area Network (HAN). HAN is a residential local area network (LAN) for communication between digital devices typically deployed in the home. Home networks may use wired or wireless technologies. Wired technologies include fibre optical cable, Digital Subscriber Line (DSL) on copper wires or PLC.

FINAL REPORT B3006974
Page 42
Wireless technologies are also common solutions. They include: Wi-Fi, Bluetooth and ZigBeSmart Grids Communication Networks
A communications infrastructure can be built from copper cable, fibre, or wireless technologies utilizing the radio frequency spectrum, such as microwave and satellite. The investment and ownership of such infrastructure may be either by public services companies (in KSA: Mobiliy, STC, Zain) or private networks in which the utility has invested, either singularly or in partnership with other entities. Various combinations of the above can be seen across the world, including joint investment with public telecommunications companies, whilst in the past utilities would prefer to have separate systems due to concerns on national security during emergency conditions.
The choice between public or proprietary networks is therefore a key concern implementing a Smart Grid or / and a Smart Metering project. In particular, for the Smart Grid a fast response network would be required (for example to respond to system blackout or cascade events), especially at the transmission level (380 kV substations and major power plants).
Proprietary networks are often considered to be the best solution if the infrastructure is available (such as private RF stations and utility allocated radio bands) but this is less common at the distribution level (13.8kV for Saudi Arabia) because the Distribution Companies generally do not have dedicated networks to cover all the substations, in particular the MV / LV ones.
A comparison of public and private access networks is given in Table 4 below:
Table 4: Public and private telecommunication networks
Public access networks Private access networks
+ Low CAPEX - Very high CAPEX
- High OPEX + Very low OPEX
- Low security + High security
- Availability / coverage determined by the carrier
+ Deployment and Quality of Service under utility control
Quality according the telecommunications regulations and a negotiated agreement
Quality according the specific needs of the SM/SG project
In addition, the selection of the media is a key issue. A comparison of wire-line (or fibre optic) communication vs. wireless media in given below (Table 5):
Table 5: Wired and wireless communications
Wire-line/fibre communication Wireless communication
+ High guaranteed bandwidth + Low latency - High deployment costs
- Bandwidth and latency determined by the technology / spectrum
+ Flexible deployment
Wireless technologies are generally preferred to create a geographical communication network spread over a wide territory (e.g. for the Distribution network). Under this category the most
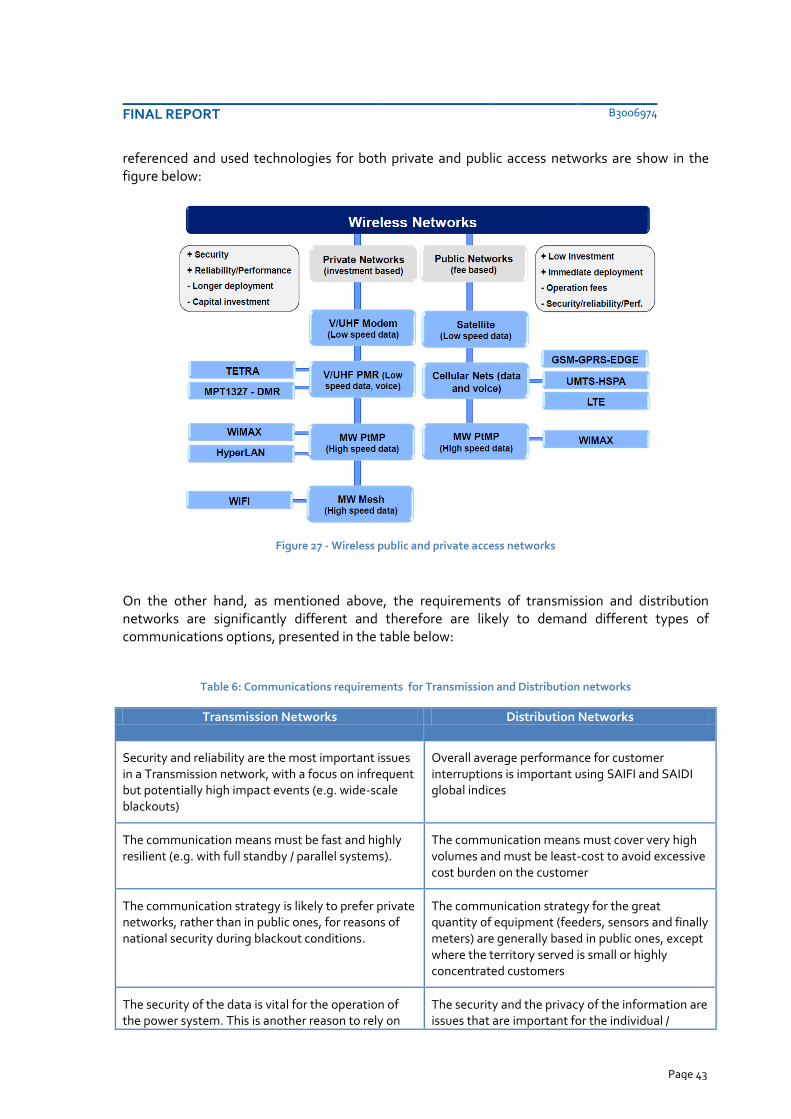
FINAL REPORT B3006974
Page 43
referenced and used technologies for both private and public access networks are show in the figure below:
Figure 27 - Wireless public and private access networks
On the other hand, as mentioned above, the requirements of transmission and distribution networks are significantly different and therefore are likely to demand different types of communications options, presented in the table below:
Table 6: Communications requirements for Transmission and Distribution networks
Transmission Networks Distribution Networks
Security and reliability are the most important issues in a Transmission network, with a focus on infrequent but potentially high impact events (e.g. wide-scale blackouts)
Overall average performance for customer interruptions is important using SAIFI and SAIDI global indices
The communication means must be fast and highly resilient (e.g. with full standby / parallel systems).
The communication means must cover very high volumes and must be least-cost to avoid excessive cost burden on the customer
The communication strategy is likely to prefer private networks, rather than in public ones, for reasons of national security during blackout conditions.
The communication strategy for the great quantity of equipment (feeders, sensors and finally meters) are generally based in public ones, except where the territory served is small or highly concentrated customers
The security of the data is vital for the operation of the power system. This is another reason to rely on
The security and the privacy of the information are issues that are important for the individual /

FINAL REPORT B3006974
Page 44
private networks rather than in public ones. customers and can be mitigated.
In summary, the strategy for Smart Grid communications is a primary driver in the selection of the most appropriate communications medium. In addition, whichever option is selected should coordinate and overlay the communications requirements for Smart Metering (discussed in chapter 5.2).
It is likely that fibre optics already installed by the transmission operator (private network) and grid substations would be used for the Smart Grid, incorporating potential applications such as transmission line sensors, dynamic volt-var control and network automation4. Smart Grids communication for the distribution network is likely not to use fibre optic as a private network would be prohibitively expensive whilst the number of distribution network points is high (230,000 in 2011). The volume required for Smart Metering is an order of magnitude higher (6.2 million at end 2011) and is discussed in detail in section 5.2.2 .
4 for KSA the number of transmission substations which are to be connected to a private fibre-optic network is around 642 (at year
2011, increasing at 50 per year). For the distribution network (13.8kV / LV) the number of distribution substations is around 230,000 (at year 2011, increasing at 20,000 per year) and the direct communication connection of these to a private fiber network would be
prohibitively expensive; hence, wireless communication options are more likely to be preferred.

FINAL REPORT B3006974
Page 45
5.2 Smart Metering technologies and solutions
A smart meter is usually an electrical meter that records the consumption of electric energy in intervals of an hour or less and communicates that information at least daily back to the utility for monitoring and billing purposes. With the introduction of Advance Metering Infrastructure (AMI) technology, two-way communication between the smart meter and the control centre, as well as between the smart meter and customer loads would be facilitated for many applications, including demand response, dynamic pricing, system monitoring and the mitigations of greenhouse gas emissions. In the next paragraphs an overview of the following topics is presented:
Smart Metering systems architecture
Communications technology options
Standards and Protocols
Minimum Smart Meter Functional Requirements
5.2.1 Smart Metering systems architecture
Deploying an Advanced Metering Infrastructure (AMI) is a fundamental early step to grid modernization. The smart meter is the focal point of a “Smart Metering Architecture” and is as an electricity meter with embedded computing and networking capabilities. It combines electronic metering with a programmemable communication terminal that can interface with multiple networks and devices.
Figure 28 – Key features of a Smart Meter
Three Smart Metering systems are typically categorized under three types of architecture, beginning with the least advanced:
-
Smart MeterTraditional electricity meter
• Existed for over 50 years without changes
• Is a paragon of reliability and economy
• Just measures energy use; does nothing else
• Merges measurement equipment and ICT
• May become part of a network of devices
(smart grid)
Source: Echelon; Landis+Gyr, E.ON; A.T. Kearney
Strengths:
• Reliable over a very long lifetime (> 30 years)
• Many vendors can Ferraris meters for good prices
Shortcomings:
• Meter readings have to be collected manually
• Does not support flexible tariffs
• Does not support free market processes
• Provides little insight about energy use
Expected benefits:
• Lowers cost for meter readings
• Provides detailed insight in energy use
• Supports flexible tariffs and market processes
• Supports decentralized generation
• Can be used for intelligent load management
Challenges:
• Detailed readings introduce privacy issues
• Short lifetime of meter due to ICT lifecycle (~ 15y)
• No standards yet („stranded assets‟, vendor lock-in)
Smart Metering architecture
FINAL REPORT B3006974
Page 46
AMR (Automated Meter Reading) is a remote reading system based on an advanced technology that permits utilities to read electronic meters remotely through “one-way” communication. Through AMR, the energy consumption (and maximum demand) can be read on an annual, monthly, weekly, daily or on an hourly basis. Consumption and status data, such as time stamps, are transmitted through various connection media to a central system for billing and analysis. The automatic data collection enables billing based on real time consumption as opposed to an estimated consumption.
AMM (Advanced Metering Management), or Smart Metering, is another expansion of a remote reading system that includes the possibility of gathering technical measurements and functions and carrying out customer-orientated services via the system. The question arises, not only how to get the data, but how to manage this data for the best technical and commercial use. This is in fact the core function of the smart meter: it enables a sensible and economically viable allocation of the resources from data collection to analysed data.
AMI (Advanced Metering Infrastructure), refers to systems that measure, read and analyse energy consumption and demand. These systems are also able to read electricity, gas, heat and water meters remotely. AMI systems can be defined as an evolution of the simpler AMR-system. The AMI always communicates two-way and comprises the whole range of metering devices, software, communication media, and data management systems This exchange of information with the customer can improve consumption behaviour and enable them to take energy-efficiency measures as well as implement Demand Response programmes. Through the integration of multiple technologies (such as smart metering, home area networks, integrated communications, data management applications, and standardized software interfaces) with existing utility operations and asset management processes, AMI provides an essential link between the grid, customers and their loads, and generation and storage resources
The general architecture of smart metering systems consists of three blocks: Software Application layer, Communication Network layer, and Smart Meters (physical layer).5
5 Note: the terminology used in IEC62056 is: Application Layer, Communications Profile/Layer, and the Physical Layer

FINAL REPORT B3006974
Page 47
Figure 29 – Example and overview of Smart Meter Architectures
The software application layer represents the uppermost block of the smart metering system and its objectives are: Gathering data from Smart Meters, Sending commands and/or data to Smart Meters, Monitoring the meters working status, query analysis and storage of data. Some typical applications of this layer are described as follows:
AMM: is the software application that communicates with Smart Meters directly. It’s the
interface application that manages the requests send by Enterprise applications to the
field. Some of its functionalities are:
-
Smart Metering architecture
Smart metering system architecture
IT Infrastructure
layer
Communications layer
Smart meters layer
PLC
GPRS
WiMax
Others
Home Area Network

FINAL REPORT B3006974
Page 48
o Commissioning of Smart Meters
o Consumptions collections from Smart Meters
o Send technical data to Smart Meters (clock updating, firmware updating)
o Send commands to Smart Meters (Connections, disconnections)
o Send Contract information (Power, tariffs, etc.)
o Monitoring of Smart Meters status in the Network (detection of tampering,
reachability of Meters, etc..).
MDM: Meter Data Management has the main objective to collect, to manage and to
store the consumption data of all customers. Main functionalities among others, are:
o Collection of data Consumptions from Smart Meters
o Management of data to send, periodically, to the Billing Software for the
calculation of invoices.
o Aggregation of Data Consumptions for reporting, forecast, etc. (provides
data for example, to Business Intelligence Software)
o Availability of Consumptions Data for Front End applications (Customers
Portal, Help Desk, etc.)
Figure 30 – Example of Software Applications Structure
The Communication Network Layer ensures the interface between the IT infrastructure and the main smart meters area and through to the electricity network. Various communications technologies exist, such as a middle-layer of data concentrators, equipped with balancing meters. The existence of balancing meters is especially important in countries where the level of commercial grid losses is high. This helps accurately identify the area where such losses are occurring, by analysing the difference between the power transmitted to the household and the registered consumption. With this middleware layer, a data concentrator makes the connection between the meters and the IT systems. In its absence, the connection is made directly, or a combination of the two layers, in which a data concentrator only intervenes in certain connections depending on the topology of the network, and the additional connections between meters and home devices and other meters are ensured.
The smart meters represent the lower part of the infrastructure, connecting the first two blocks of the system with the home area network. In advanced cases, the home area network may include a number of devices installed on a customer‘s premises.

FINAL REPORT B3006974
Page 49
5.2.2 Communications technology options
This section analyses the options of communications for the Smart Metering system. It emphasizes technical aspects, standards and capabilities of communication technologies being considered. The issue of future changes in the technology and the telecoms market are discussed and the business case implications and cost-benefit analysis of various options is presented in Annex I. Technologies for the Home Area Network are not considered in detail as they are not essential for the initial Metering Infrastructure.
The options for establishing a suitable communication network are usually divided into two categories:
Wired: such as fibre optic (FTTX) and power line carrier (PLC) / Broadband over power line (BPL), DSL (telephone line)
Wireless: such as Wi-Fi / WiMAX, Radio Frequency (RF), GSM / GPRS, satellite
The data will be encrypted and often transferred using VPN. The operator / provider will not threat the data or elaborate them. The contract will be signed only by the utility. The service will not be in any way usable and used by the household.
All these technologies have their benefits and limitations. For this reason an AMI will generally use several of these technologies to cover the range of requirements for an entire country network.
5.2.2.1 Power line carrier (PLC) / Broadband over power line (BPL)
When LV distribution feeders are considered, PLC is well suited because it is a no-cost medium for the utility (for the cable) and already covers the entire distribution system. Traditional PLC has the potential to transmit data at a maximum rate of 11 Kbit/s, and the maximum data rate can be achieved only in a narrow frequency range of 9 to 95 kHz. This low rate of communication may sometimes be not enough for supporting applications where large amounts of data may be transferred, for example, when a large number of smart meters connected to end-user loads send periodic information using the AMI. PLC technology has been used in Italy and other countries as the “last mile” communications (from the meter to the DCU in the MV / LV substation). This provides the benefit of aggregating data from a number of meters before the data is sent via the Data Collector, making for a more cost effective system (the DCU can compress data and reduce traffic charges as well). The reliability of PLC systems has improved dramatically over the past decade with better filtering and frequency multiplexing methods compared to the first introduction of PLC over 2 decades ago. With bulk production of PLC chip sets modems can be integrated within Smart Meters at very low cost. The only concern is the choice of frequency band which needs to be reserved and assigned by the appropriate communications regulatory authority.
Broadband over power line (BPL) is a relatively newly developed technology, with very few trials/implementation in utility networks. The main reference case is Korea and the consultant KEPCO is advising SEC on this option. CITC document “RI089”, described Power-line communication in the band 1.6 MHz - 30MHz, like the Home-plug standard. In RI089, the Power-line band is defined for all devices which will use the PLC communication, not exclusively reserved for Distribution utility. A potential risk of interference, not only for radiating emission and interactions with other devices, but also for conducting disturbances and traffic collision with commercial “Home-plug” devices must be considered. Any commercial PLC device compliant with RI089 (there are many devices on the international market, like in-home PLC modem for

FINAL REPORT B3006974
Page 50
Ethernet, video Senders, audio and video surveillance devices, etc.…), working in the same band can affect the Broadband communication for meters. Furthermore there is some risk of frequency overlapping with broadband PLC and other Amateur Radio transmitter. For reference, see CITC Specification RI094 “Amateur Radio and Ancillary Equipment” and RI019 “Citizens’ Band radio and Ancillary Equipment”. Even if modulation is completely different, CB devices with TX power up to 4 Watt could obscure the broadband PLC communication (it is an immunity, not an emissions issue).
In addition the attenuation in a radial distribution feeder is high, and this would limit the distance from Smart Meter to DCU (or regenerators are needed, possibly via adjacent meters). Thus, even if the medium of communication is free in BPL, there are infrastructure costs involved. In addition, the high-frequency signals may cause problems by being blocked by voltage regulators, reclosers, and shunt capacitors that are common in long radial feeders. The cost of BPL systems is substantially higher than traditional PLC but this additional cost may be supported by non-utility and non-regulated services (i.e. internet to home) under a separate commercial arrangement.
5.2.2.2 Fibre optical connection
One of the main issues with copper wire connections is interference and attenuation. Fibre optic cables provide an interference-free solution, but it is a very high cost option, unless shared with other services (e.g. internet to home). Newly developing cities could install a fibre optic communication network close to or alongside power cables, thus enabling the infrastructure to be shared for both the power grid and customer communication needs. One cost sharing option is where the utility would bear only the costs of the terminal equipment and for leasing the line. On the other hand, the utility would not have control over the medium because, in most cases, it would not own the entire network. However, an example where a utility fibre network has been installed (in conjunction with WiFi) is Abu Dhabi6. This system is proposed to be used by a number of utility applications including Smart Metering, network automation, SCADA and corporate data (LAN). A backhaul fibre network between HV / MV (transmission) substations has been installed by many utilities (alongside power cables and on overhead lines), including by the SEC transmission company. This provides a very high capacity and high speed (over 20 Mbit/sec) network for use by transmission network applications and other corporate data needs. The option to use this network for long distance data collection for Smart Metering will depend on discussion between the transmission and distribution business of SEC7.
5.2.2.3 Mobile networks (GSM / GPRS or 3G)
As in other countries, KSA mobile network operators have national networks with high data capacity and functionality. A technical challenge exists in establishing signal strength (likely to result in more than one operator being used) and any mobile-based solution will likely work alongside a fixed network to some degree (to ensure coverage of homes without a mobile signal, e.g. via RF or satellite). A choice needs to be made on which mobile network technology to use. GPRS (GSM) has been used in many projects (Italy, Spain…) to connect DCUs or industrial meters to the Control Centre and it is usually considered the base-case for calculations. However, 2G networks will be decommissioned at some point in the future, meaning an expensive upgrade to
6 Presentation notes of Abu Dhabi meeting 5-12-12
7 National Grid-SA meeting 17-12-12

FINAL REPORT B3006974
Page 51
all meters, or modems would need to be 3G enabled from the start. A 3G-based solution is more challenging in terms of signal requirements and equipment cost. In some countries 3G is not as widespread as GPRS is, so that only the 2G solution may be offered. As this technology is reliable and considered to be secure the overwhelming consideration is cost of connections and data traffic. This is predominantly an issue of market development, competition and pricing structure by the telecoms operators in the country. Competition issues have arisen in other countries and the telecoms regulators have intervened to ensure prices are fair and mobile companies are not enjoying excessive profits arising from the advances in technology (and cost reductions). For Smart Metering the data volume requirement is relatively low, only a machine to machine connection is required, and most of the data can be transferred at night when the mobile network cost is very low (see further discussion in Annex I).
5.2.2.4 VHF and UHF Radio Frequency (VHF & UHF RF)
Compared to cellular technologies, an advantage of using RF technologies is that these typically use the unlicensed bands that do not incur carrier costs to the utility. However, the utility must own the terminal units, and possibly repeater stations, which might have significant costs depending on the technology. There are several connections and architectures that might be built up: point to point (PtP), point to multipoint (PtMP) and meshed. In PtP, a device can communicate only with one other device (e.g. a meter that sends data only to a concentrator without any hopping or repeating mechanism), in PtMP a device can communicate with different devices (e.g. it’s the case of the DCU that receives or sends data from / to the meters beneath, or a meter that receives data and forward them to another meter using repeating mechanisms along a pre-defined path) and the meshed configuration where as for PtMP, the devices can communicate with each other but the path from the meter to the DCU is dynamically created depending on the availability of the single meter, the traffic and the distance. The range of frequencies in RF communication is typically in the VHF and UHF band (100 – 800 MHz). In some countries, RF systems are widely used by the utilities due to the long range and sparse networks in PtMP (United States and Australia) or meshed configuration (Abu – Dhabi) in order to create a so-called Neighbour Area Network (NAN). Some carriers/frequencies have become available from old legacy systems (e.g. RF radio phones) previously allocated to utilities. The cost options for RF are considered in Annex I.
5.2.2.5 Wi-Fi / WiMAX
Although current thinking is based around the use of mobile (GSM and GPRS) or fixed-based technology, there may yet be room for a new operator to emerge with a Wi-Fi / WiMAX (wireless broadband technology) or other radio-based solutions. Trials of WiMAX for smart metering applications have begun in Michigan in the United States while Wi-Fi radio mesh networks are operating in Abu Dhabi. Compared to Wi-Fi, WiMax is a good alternative for some areas where feeder sections between consecutive poles tend to be longer than the typical communication range of Wi-Fi. Range issues of Wi-Fi could be mitigated to some extent with improved receivers and directional antennas. The disadvantages of wireless communication could be interference due to the presence of buildings and trees, which could result in the “multi-path effect” where signals arrive over different paths making the capture and decoding of the signal challenging. But careful planning and design can mitigate such effects. A major concern with a wireless medium is easy accessibility, which could result in security issues. This could be avoided by using security mechanisms like (cryptography). Maintenance can also be harder with communication nodes

FINAL REPORT B3006974
Page 52
scattered geographically compared to a power line solution. The cost options for Wi-Fi are considered in Annex I.
Table 7: Comparison of wireless communication technologies
Attribute GSM / GPRS UMTS VHF / UHF
RF Wi-Fi WiMAX
Cost Medium High Medium Medium High
Range 2 – 3 km 2 – 3 km 500 m
up to 3 km 100 – 200 m
< 1 km
4 km (rural)
Max Data Rate 30 – 70 Kbits 7.2 – 14.4
Mbps – 54 Mbps 70 Mbps
Frequency Band 700MHz, 2.1
GHz 700MHz, 2.1
GHz 300 MHz – 3
GHz 2.4 GHz 2.3 – 5.8 GHz

FINAL REPORT B3006974
Page 53
Table 8: Advantages and disadvantages of Communications options
Advantages Disadvantages Recommendation Foreign
Experiences
Power Line Carrier (PLC)
- No need of dedicated infrastructure.
- Aggregating data from a Number of Meters before the data is sent via the Data Collector
- Reliability of communication due to introduction of better filtering methods and frequency multiplexing methods
- PLC chip sets modems is integrated within Meters at very low cost
- Pilot installations in KSA have been tested over a 4 year period (1,500 meters using PLC 200 – 400kHz, FSK modulation)
- Usually is used for the “last mile” connection
- Low rate of communication
- Frequency band Need to be reserved by Communication Regulatory Authority ( i.e CENELEC band A)
- susceptible to noise and selected frequencies / modulation will require field tests”
- Use in Urban Area - Italy (31.5 Million) - Spain (13 Million) - Montenegro
(200,000 Meters) - Sweden - German - Finland - Idaho - Norway
Fibre Optical Connection
- Interferences-free solution - High capacity and high speed
network
- Very high cost solution because of dedicated cabling, unless sharing fibre with other services (i.e for distribution automation or other smart grid applications)
- Option for the backhaul infrastructure
- Abu Dhabi
Mobile (GSM/GPRS/ 3G)
- No need of dedicated infrastructure
- Widely available - Interoperability assured - Implemented quickly - Already proven in pilot
installations in KSA
- The High cost of data transfer but tariffs could be negotiated
- Use in the rural areas where the PLC is not an economical solution (i.e few customers)
- This is the Second option for the massive roll-out
- U.S (160,000 Meters)
- Denmark (250,000 Meters)
- Sweden (150,000) Meters
VHF & UHF Radio Frequency
- These technologies typically use unlicensed band at low R.F Power
- Usually is used in countries where is a long range and sparse network (i.e U.S)
- Higher costs due to repeater stations and infrastructure (if not already installed)
- Susceptible to noise - Sensitive to obstacles
- Not recommended for the KSA
- U.S (2.5 Million) - Canada (1.9
Million) - Australia (7500
Meters)
Wi-Fi / WiMAX
- Could be shared with other services (i.e. transportations, Internet connection, etc..)
- Interoperability assured
- High costs if infrastructure is not installed
- WiMAX is not yet developed in KSA
- Communication is affected by
- Option for the urban area
- Abu Dhabi

FINAL REPORT B3006974
Page 54
Advantages Disadvantages Recommendation Foreign
Experiences
interferences - Hacking of the network
security - Expensive technology
5.2.3 Standards and Protocols
All data collected from the meter must be transferred to the Centre in order to be properly used. Furthermore, the Centre must be able to send commands to the meters in order to perform changes in meter parameterization, clock alignment and remote disconnections.
Thus, the meter must provide both local and remote communication functions.
Communication between the meter and different devices both local and remote (hand terminals, communication modules, data concentrators, etc.) is performed via the interfaces described in the previous chapters.
A very important topic is related to the choice of the proper suite of protocols.
The choice of some specific suite of protocols greatly influences the way of representation of data, the associated payload and the physical mediums to be used for the exchange of data.
The choice of frequency range and bandwidth depends on many factors, related to normative aspects (EMC compatibility in the chosen band), performances on network, requirements for transmission rate and costs. Furthermore, the interoperability issues must be considered.
5.2.3.1 Proprietary versus standardized suite of protocols
There are two main classes of protocols, the proprietary ones and the standardized. Some protocols, especially the proprietary ones, can be more oriented to reduce payload (data traffic, efficiency and speed) thus increasing the efficiency of data transmission, but being not completely standardized can obstruct the adoption from different Manufacturers.
In recent years the standardization of protocols, often pushed by regulatory agencies and international mandates, is growing. It may be that an initial proprietary protocol is “opened” to the market by the developer, creating associations and consortiums, trying to increase the number of manufacturers that will adopt it instead of developing a new one. This can be a good starting point for the development of a field-proof technology, which can then be proposed to the standardization bodies. The standardization process is quite long because it has to generalize and include different technologies and principles. Furthermore different standardization bodies are oriented to different protocols. The adoption of an open standard and of a standardized suite of protocols, paves the way to interoperability and even to interchangeability of meters coming from different manufacturers. In order to have future-proof functional requirements for meters, the proposed architecture for communication must be open, especially for integration of new communication devices.
Given the wide acceptance on the meter market of the IEC 62056 standards (particularly for the PLC communication option) and previous experience of pilot projects in KSA, it is considered as the reference guide for this strategy and plan. IEC 62056 also offers comprehensive security structures, for Access, Authentication and Encryption.

FINAL REPORT B3006974
Page 55
5.2.3.2 Considerations on the status of IEC 62056
Many meter associations, particularly in the European market, have adopted the IEC 62056 suit of standards for the higher levels of the communication stacks and application level. The meter Manufacturers often differentiate in the implementation of the lower level of protocols, especially for the PLC transmission of data on the LV network. The IEC 62056 suite of standards includes some mature standards and some which are under the evaluation/approval process after having been proposed by different associations and Manufacturers.
Table 9: IEC 62056 suite of protocols. Source: IEC
In particular, the PLC physical layer in the IEC 62056 has different potential suitable implementations, some of which is supported by many Manufacturers.
Table 10: Current situation for the communication profiles. Source: IEC

FINAL REPORT B3006974
Page 56
The higher levels of IE C62056 are transversal to the different physical mediums. Nowadays, the data model and the application level objects are almost the same, with differentiation of intermediate levels which are necessary to adapt the lower levels (medium dependent) from the higher levels. The use of IPv4, UDP/TCP with GPRS, LAN and Wi-Fi (which are fully standardized) can be considered as stable, ensuring meters of different Manufacturers using these media to be interoperable, if they adopt the same data modelling paradigm.
PLC implementation is only partially defined, and many different proposals are currently under examination by the IEC. Currently the following PLC techniques are under consideration, but not all are yet integrated in the IEC 62056 suite:
PLC S-FSK, defined
PLC OFDM, type 1 (also known as PRIME)
PLC OFDM, type 2 (also known as G3)
PLC PSK, SMITP (also known as Meters and More). Some others are under proposal, like the KEPCO hi-speed DMT PLC 8
At the moment, the IEC 62056 suite in evolving. With reference to the same kind of data modelling, different technologies with profiles covering all the protocol stacks could be presented.
5.2.3.3 Interoperability and interchangeability
The wider definition of interoperability considers the possibility to substitute (remove and replace) meters in whatever sites of installation with the guarantee the previous performances of the system. This definition is also referred to as “interchangeability”. Hence, the term interoperability would apply to the middle layer (e.g. different meters can talk to the same DCU), whilst interchangeability applies at the physical layer (e.g. exchange of one manufacturer’s meter for another at a customer’s site).
8 DMT PLC proposed by KEPCO (Korea) is being considered by SEC

FINAL REPORT B3006974
Page 57
The perfect interchangeability of meters coming from different Manufacturers requires a fully defined and agreed set of functionalities and specifications, from the higher levels of the stack defined in the suite of protocols to the lower levels of communication. An example of a consortium of meter manufacturers acting in this direction is represented by the IDIS association, which is also based upon IEC 62056.
The adoption of an open standard and of a standardized suite of protocols can greatly help the interoperability and even to interchangeability of meters coming from different manufacturers. On the other hand, simply by adopting the same suite of protocols does not necessarily guarantee interoperability. Problems of interoperability can arise even on same physical medium or even the same type of modulation. This can be because different types of PLC are using different frequencies and modulation method and they are not compatible and hence not interoperable. Interoperability therefore needs to be verified and tested at all levels of the AMI architecture.
Interoperability should be provided by manufacturers and be tested during the tendering phase. It’s very important to perform a general test before massive roll-out otherwise the risk is to deploy meters that are not able to communicate with the Data Concentrator having additional costs for integrations and modification in the devices and firmware. To mitigate the risks, the tender documentation should consider a test on real field before signing a contract and of course, before a massive roll-out.
5.2.3.4 Interoperability at “meter level”
It is possible but challenging to achieve complete interoperability at the meter levels. This means that meters of different manufacturers, operating under the same concentrator, can work reciprocally without affecting the functionalities, including communication. The requirement of interchangeability necessitates that the replacement of one meter from one manufacturer with another one of a second manufacturer will ensure the complete interactions among the new meters, including the services at lower levels, such as the repeater mechanism. This is particularly hard to be achieved in residential meters with concentrators.
Table 11: Example of Communication among Meters
An example: type B can talk only with type B, type A can talk only with type A, type A could potentially prevent proper communication for Type B and vice-versa.

FINAL REPORT B3006974
Page 58
5.2.3.5 Interoperability at “concentrator level”
Defining interoperability at the concentrator level (middle layer) releases some of the constraints at meter the level, since the communication between meters and concentrator can be freely defined and adopted, while the concentrators of different Manufacturers must adopt a common way of communication with the AMM centre.
Interoperability at DCU level is recommended at the first stages of implementation, thus avoiding the coexistence of PLC Smart meters produced by different Manufacturers on the LV network under the same substation.
5.2.3.6 Interoperability at “AMM level”
This level is the one with fewer constraints, since the AMM software will be in charge of requesting information and sending commands according to different standards, thus practically integrating the whole system which may consist of incompatible layers.
5.2.3.7 Open standards and associations
To achieve interoperability, the most important instrument is the introduction of open standards at the system level (AMM) which will ensure that the utility can procure meters from different manufacturers. This can be achieved down to the DCU level where communication will be with all meter types. The following section describes some example of communication technologies used in Open Standards:
Table 12: Some Protocols and communication technologies used in Open standards
Different Associations were born to create different Open standards. The following describes some of the most important associations:

FINAL REPORT B3006974
Page 59
OPENmeter (European Project. www.openmeter.com): “The result of the project will be a set of draft standards, based on already existing and accepted standards wherever possible. These standards include the IEC 61334 series PLC standards, the IEC 62056 standards for electricity metering, the EN 13757 series of standards for utility metering other than electricity using M-Bus and other media.”
Prime Alliance (Powerline Related Intelligent Metering Evolution www.prime-alliance.org): “The end objective of PRIME is to establish a complete set of standards on an international level that will permit interoperability among equipment and systems from different manufacturers.”
IDIS (www.idis-association.com):“The IDIS association develops, maintains and promotes publicly available technical interoperability specifications, known as ‘IDIS specifications’, based on open standards and supports their implementation in interoperable products.”
G3 (www.g3-plc.com): “G3-PLC enables high-speed, highly reliable communications on existing power lines needed to make the "energy Internet" a reality”
Meters and more. (www.metersandmore.com): “The main goal of the Association is to provide the industry with a proven open protocol for smart metering, thus being a tangible answer to the European Commission’s Mandate 441 to achieve standard AMM solutions across the continent.”
Specifications are available and many other Manufacturers have bought them. It is not necessary to be part of the alliances and/or associations to have the same open specifications.
5.2.4 Overview of Smart Meters functional requirements
A separate Minimum Functional Requirements report has been prepared for this study, whilst a summary relevant to the overall strategy is provided here.
Smart meters are usually considered as “smart” because, compared to traditional meters, they have more functions that enable system operators to use two-way communication with installed smart meters. A "smart" meter has the following capabilities:
Real-time or near-real-time registration of electricity use and possibly electricity generated locally e.g., in the case of photovoltaic cells;
Offering the possibility to read the meter both locally and remotely (on demand)
Remote limitation of the throughput through the meter (in the extreme case cutting off the electricity to the customer)
Interconnection to premise-based networks and devices (e.g., distributed generation, automated appliances, electric vehicles charging)
Many advantages are attributed to smart metering, including lower metering cost, energy savings for residential customers, more reliability of supply, variable pricing schemes to attract new customers and easier detection of fraud. Additional benefits are foreseen in relation to distributed generation (DG). The smart meter can be used to separately measure electricity delivered by the DG to the grid and the smart metering communication infrastructure can be used to remotely control DG.

FINAL REPORT B3006974
Page 60
Smart meters offer benefits to multiple parties. Benefits can be explained by looking at the differences between the current situation with the old meter and the future situation with the new meter.
Demand response of domestic energy users is not yet a common practice, but would be enabled by smart metering. Smart meters are capable of limiting or even cutting the energy use when triggered by market developments. When all households and small to medium enterprises (SME's) in a country would be able to adapt their energy use during a period of high prices or diminished availability, this would improve the reliability of supply and enhance energy market transactions, energy savings, energy awareness and energy efficiency. In the shorter term, energy users benefit from the smart meter as they have a direct review possibility of their energy use. By adjusting their behaviour, they can reduce their energy cost. Also, they may receive a final bill on a monthly basis instead of paying an advance (although some customers prefer a fixed monthly payment anyway).
The metering company faces the challenge of initially replacing old meters with smart meters. When smart meters are installed, this requires another type of operation for data collection and data communication. As smart meters introduce a high amount of frequent data flows, processes and systems must be adapted and prepared accordingly. The data collection process will not depend on clients being at home but will be a continuous, automated process, which should simplify daily operation of the metering company.
When all energy use is monitored by smart meters, grid companies will receive a much more actual and accurate overview of energy consumption in their region. This means they can examine suspicious areas where energy use is higher than expected, and thus smart metering will provide grid operators with a tool to detect fraud. In times of electricity shortage, the grid operator has the option to limit electricity use. Gathering all data, the grid operator will be able to predict electricity flows more accurately and use this knowledge in network and maintenance planning. The automation of the data collection process, with more, recent data on a higher frequency, will put higher requirements on systems. This will also have an impact on market facilitating processes, as reconciliation of formerly profiled users may become unnecessary.
To the supplier, the smart meter offers possibilities to offer new and dedicated service to their customers. The smart meter may become a gateway into the home of the customer, to provide new value added services. Also in the billing process, real consumption data can be used, simplifying the current process of advances and recalculation
A summary of the Smart Meter capabilities listed in the Minimum Functional Requirements detailed in the Annex II is shown below.

FINAL REPORT B3006974
Page 61
Table 13: Summary of the Minimum Functional Requirements
1Smart meter must have an interface /display by mean of
which the Customer can obtain readings.
2The reading informat ion must be frequent ly updated,
to allow the Customer to achieve energy savings
3
Readings must be provided in an easily understandable
way, also by untrained Consumer. Customer can use to
bet ter control their energy consumpt ion.
4Meter operators and ent it led third part ies must be able
to obtain remote reading of meter registers
5Allows readings to be taken frequent ly enough to
allow the informat ion to be used for network planning
6
Bidirect ional communicat ion between the meter and
external networks for maintenance and control of the
meter
7 Provides for the monitoring of Power Quality
8 Supports advanced tarif f system.
9 Supports energy supply by pre-payment and on credit
10Allows remote ON/OFF control of the supply and/or
f low or power limitat ion
11 Provides Secure Data Communicat ions
12 Fraud prevent ion and detect ion
13 Provides Import / Export & React ive Metering
Funct ionalit ies to allow dist ributed generat ion
Requirement Functionality
Funct ionalit ies for the Customer’s side
Grid and Network Support
Commercial/Business processes
Security and privacy

FINAL REPORT B3006974
Page 62
5.3 Smart Meters and Smart Grids International solutions
A comprehensive review of international comparators was provided in the project phase 1 report (Interim Report). In the following section a summary is provided of the most relevant lessons learnt from such experiences with respect to the Smart Meters and Smart Grids strategy framework to be developed for KSA:
5.3.1 Smart Meters and Smart Grids solutions
The strategy roadmap needs to include the proper portfolio of SM and SG measures, to address the future and expected local energy challenges, while considering local system characteristics and peculiarities.
According to international benchmarks, as reported in Project “Interim Report”, not all Smart Grid applications have the same level of maturity. Specifically, they are progressively developing downward along the electricity value chain, with higher maturity on transmission and distribution automation and smart meters and still under development for more advanced customer side applications, as reported in the following figure.
Figure 31 – Status of development for Smart Grid applications
With respect to Smart Metering specifically, AMR and AMM are solutions already in place, while AMI is not yet implemented due to customer and industry un-maturity on related new services. Even if Smart Meter specifications are generally prepared for some remote control or Home Automation, these are not widely implemented in customer homes.
-
Smart Grid implementation stages
Smart metering (AMR / AMM) and DRP1
Ele
ctr
icit
y v
alu
e c
hain
Time +-
Transmissionenhancements
Distribution automation
Demand side management (AMI)
Energy storage and Electro (alternative)
mobility
Key learnings from international experiences for strategy setting
Maturity level:
1Demand Response ProgramsSource: IEA
High Medium Low
• First “smart” enhancements put in place,
needed to ensure power reliability, network
balancing and system integration
Maturity level Rationale
• Significant development achieved
• Major drivers were regulatory push to support
market liberalization and energy saving and
DSO cost efficiencies
• Needed to support distribution generation
integration and power quality
• Now progressively developing, following
transmission maturity
• Even if smart meters are generally prepared,
services still under development, due to
offering and demand un-maturity
• Some pilots in place, especially on the e-
vehicle field
• Still costly due to early technology
Still 3-5 years needed to reach technology and cost stability
Status of development for Smart Grid applications

FINAL REPORT B3006974
Page 63
Table 14: Smart Metering development status
5.3.2 SM/SG Communication Technologies and International Standards
Technologies need to be “forward focused”, able to support short-mid-term applications and enable eventual long term ones, provided that the business case will be sustainable. Moreover, communication, data management and functionalities will need to be tailored to specific issues of the Country. As anticipated, there are several communication technologies in place for both Smart Grids and Smart Metering applications. The dominant EU technology for Smart Meters in the short term is likely to be power line carrier (PLC) with an expected penetration of 80% to 95%.
Figure 32 – Preferred communication technology in EU for Smart Meters
-
Ch
ara
cte
risti
cs
Fu
nc
tio
ns
AMR Advanced MeteringReading AMM Advanced Metering
Management AMI Advanced MeteringInfrastructure
• First generation of Smart Meters
• "One-way" communication
• Able to collect, store, dispatch meter data
• Remote metering
• Second generation of Smart Meters
• "Two-way" communication
• Metering of meter data and control
• Switching of external facilities
• Remote metering
• Remote switching
• Remote metering
• Remote switching
• Home Automatione.g. remote control of HH appliances
• Italy (ENEL)
• Sweden (AMM enabled)
• Netherlands (AMM enabled)
• Pilot projects:Energie AG, StadtwerkeFeldkirch, Linz AG
• Currently not yet implemented; meters partly prepared
Ex
am
ple
Key learnings from international experiences for strategy setting
Source: International Benchmarking
Smart Metering development status
-
tbd
GPRS
Mix
PLC
Preferred communication technology in EU for Smart Meters
1: Germany 75% PLC, Netherlands 60% PLC, Nordics 50% PLC, Ireland 50%Source: Smart Metering in Western Europe, M2M research series 2011, Berg Insight
• GPRS was the only performing solution
available in 2005 – 2010
• PLC is preferred by DSOs
– dependency/ lock-in prevention from Telecom
– GPRS requires long term frequency
– Telecom costs perceived lower
– Initial performance problems solved in new
generations (OFDM, etc.)
– Open standard (non-proprietary) PLC
solutions are in development
• Based on current choices of DSOs and market
requirements PLC penetration will range from 80%
to 95%
• When PLC is for the „last mile‟, the DC still
needs to have its own connection with the data
collection system (GPRS, 3G, fiber optic, etc.)
Indicative
Key learnings from international experiences for strategy setting

FINAL REPORT B3006974
Page 64
With respect to technical standards, while the early meters were developed independently for DSOs (e.g. Italy and France), recently open standards, maintaining product customization, became the common practice, as illustrated in the following table.
Table 15: Smart Meters: Standard development and sourcing method
5.3.3 Regulation, Funding and Roadmap.
In order to effectively support the Smart Meters and Smart Grids roadmap, regulation will have to foresee roll-out targets and proper incentive schemes to split related benefits among stakeholders, while ensuring a proper level of service for the future network.
According to international benchmarking, defining implementation targets is key to push the Smart Grid development and those Countries that did it are the ones with higher levels of progress, as illustrated in the following table.
-
Smart Meters: Standard development and sourcing method
2000 -
2010
2008 -
current
Period Approach
– DSO specifies required functionality
– Own standard developed or vendor standards altered for use in local market
– Standards are proprietary and not open for others
– Meters were custom developed on current platforms
– Meter vendors mostly use available components
Examples
– Nordics
– ENEL
– Netherlands: pre-NTA & NTA-meters
– Spain/ EU: Prime
– France/ EU: G3-alliance
– EU: Open Meter (joint specificationdevelopment)
– Netherlands: DSMR 4.0 (joint development withdifferent vendors)
– Standards are developed in alliances by strong cooperation with different vendors
– Standards are open and submitted at standardization bodies for international recognition
– Meter vendor products are specially designed and developed for client-base
– Chip manufacturers design specific chipsets for new meter types/ designs optimizing cost and performance
Key learnings from international experiences for strategy setting
Source: International Benchmarking
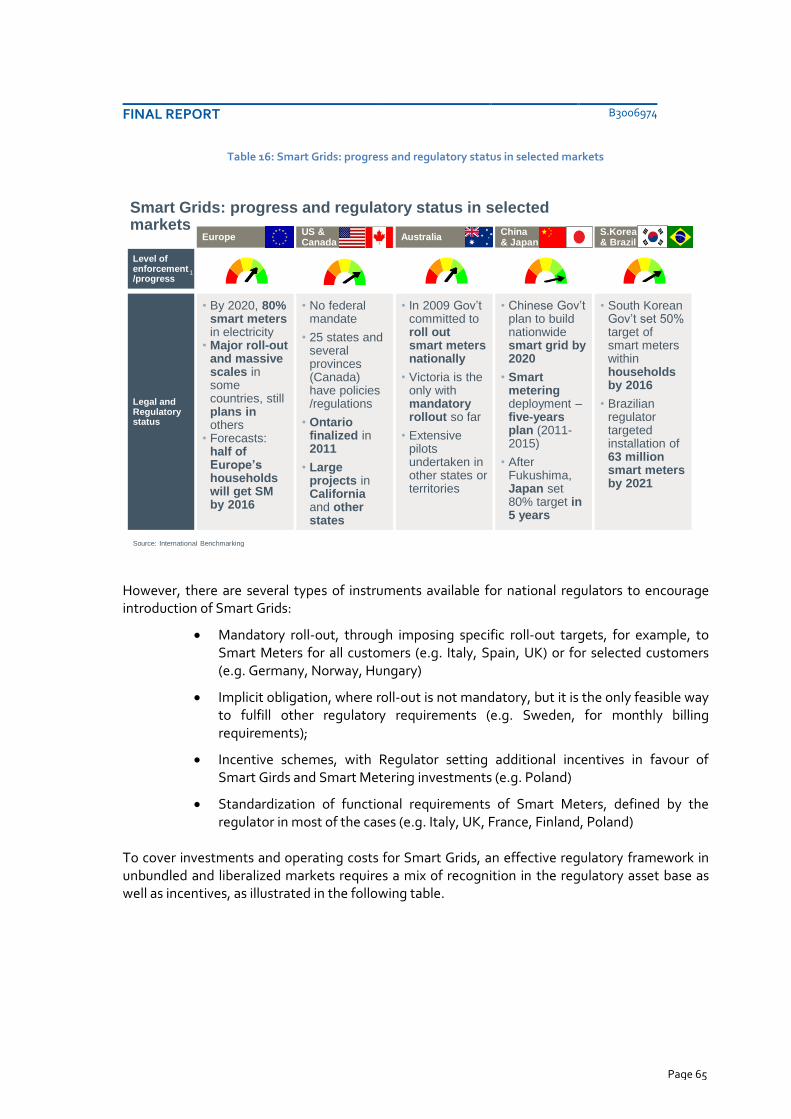
FINAL REPORT B3006974
Page 65
Table 16: Smart Grids: progress and regulatory status in selected markets
However, there are several types of instruments available for national regulators to encourage introduction of Smart Grids:
Mandatory roll-out, through imposing specific roll-out targets, for example, to Smart Meters for all customers (e.g. Italy, Spain, UK) or for selected customers (e.g. Germany, Norway, Hungary)
Implicit obligation, where roll-out is not mandatory, but it is the only feasible way to fulfill other regulatory requirements (e.g. Sweden, for monthly billing requirements);
Incentive schemes, with Regulator setting additional incentives in favour of Smart Girds and Smart Metering investments (e.g. Poland)
Standardization of functional requirements of Smart Meters, defined by the regulator in most of the cases (e.g. Italy, UK, France, Finland, Poland)
To cover investments and operating costs for Smart Grids, an effective regulatory framework in unbundled and liberalized markets requires a mix of recognition in the regulatory asset base as well as incentives, as illustrated in the following table.
-
Legal and Regulatory status
Level of enforcement/progress
Europe
• By 2020, 80% smart meters in electricity
• Major roll-out and massive scales in some countries, stillplans in others
• Forecasts: half of Europe’s households will get SM by 2016
US &Canada
• No federal mandate
• 25 states and several provinces (Canada) have policies /regulations
• Ontario finalized in2011
• Large projects inCalifornia and other states
Australia
• In 2009 Gov‟t committed to roll out smart meters nationally
• Victoria is the only with mandatory rollout so far
• Extensive pilots undertaken in other states or territories
China & Japan
• Chinese Gov‟t plan to build nationwide smart grid by 2020
• Smart metering deployment –five-years plan (2011-2015)
• After Fukushima, Japan set 80% target in 5 years
S.Korea& Brazil
• South Korean Gov‟t set 50% target of smart meters withinhouseholds by 2016
• Brazilian regulator targeted installation of 63 million smart meters by 2021
1
Smart Grids: progress and regulatory status in selected markets
Key learnings from international experiences for strategy setting
Source: International Benchmarking

FINAL REPORT B3006974
Page 66
Table 17: Regulatory instruments on Smart Meters and Smart Grids
With respect to implementation timings, for Smart Meters specifically, there are different cases reported in other Countries, mainly driven by different targets defined by regulators and resources allocated to the project realization. However, a term of 7 years is typical for large scale implementation projects worldwide.
Table 18: Smart Metering implementation plans
-
• In UK, an OFGEM decision in 2003 instated a competitive market
by making retailers responsible for purchasing metering services
• In parallel, 2 mechanisms have been implemented to promote DSO
innovation : IFI (Innovation Funding Initiative) and RPZ (Registered
Power Zones).
• No explicit incentives
• In Italy, DNOs who perform certain type of investments deemed
crucial for the development and efficiency of distribution grid
infrastructures get an additional 2% at the rate of return on invested
capital on a period of 8-12 years.
• No direct incentive
• Romania aims at incentivizing DNOs to increase quality of service
by introducing a quality penalty /rewarding “factor S” (+/- 4%
from total revenues)
• No explicit incentivesGermany
UK
Nordic
region
Southern
region
Eastern
region
Country panel
Regulatory instruments on Smart Grids and Smart Meters
Remuneration in
regulatory asset
base Incentives on Network innovationSmart GridsSmart
Meters
Key learnings from international experiences for strategy setting
Source: International Benchmarking
-
Project duration
Average number of meters installed (per month)
2002 – 2008 2003 - 2008
Ca. 30 million 860 000
Utility
Ca. 800 000
Ca. 40 000
Ca. 12 000
Ca. 600
Number of meters installed
Average number of meters installed (daily)
2011 - 201604.2010 –10.2010
300 000
Ca. 43 000
Ca. 2 150
(plans) (plans)
3,07 mln
Ca. 42.000
Ca. 2.100
Smart Metering implementation plans
Source: International Benchmarking
Key learnings from international experiences for strategy setting
FINAL REPORT B3006974
Page 67
5.4 Proposed Smart Meters and Smart Grids options for KSA
5.4.1 Smart Grids proposal for KSA
Smart Grids solutions should be focused on a comprehensive set of grid-side applications in automated and remote control and management of both transmission and distribution networks (enabling connection and management of renewable sources, the improvement of network performance and efficiency and the developments, as soon as they will become mature on the market. The opportunity of their application depends on the needs of the Transmission System Operator as well as wider benefits. Smart Grid’s strategy for KSA relies on:
“Smart” devices
Communication network
Smart metering, Distribution Automation, SCADA are considered as sub-systems of Smart Grids. They will exchange a subset of information produced by each. The above-mentioned subsystems require different features, i.e. quantity of data and time-response. Not all the information generated by a sub-system is necessary exchanged among the others.
Therefore dedicated interfaces will act as a gateway for filtering, translating and adapting the information to be exchanged. A detailed analysis of the interfaces requires a dedicated study which is beyond the scope of the present work.
Below is a summary of the SG applications recommended for KSA (refer to section 5.1.1 and 5.1.2 for a detailed explanation of the technologies).
5.4.1.1 Transmission grid
The HV grid can be considered already “smart” to a degree because it already has smart equipment and an available communication system. Some further enhancements can be performed in power control using smart technologies such as FACTS, HVDC, PMUs (see section 5.1). The choice for the location, the features and rating should be performed only after dedicated and detailed grid studies.
5.4.1.2 Distribution grid
While considering the MV grid, the situation is much different because there is limited remote control, apart from the HV / MV substations. Many improvements can be performed applying the solutions of section 5.1.2. However, further considerations about communication infrastructure are required.
HV / MV substations:
These substations are already connected with a high speed fibre-optic backbone. No other infrastructures are required unless some improvements for future expandability.
MV / LV substations and MV feeders:
With regard to the solution in section 5.1.2, GPRS is the best suited communication infrastructure for those substations which don’t have any communication network. It copes with the requirements (in terms of throughput and latency) for voltage control and fault clearance using switch-disconnector (aimed at avoiding interruptions longer than 1 minute).

FINAL REPORT B3006974
Page 68
In fact, GPRS is a best-effort service providing data rates of 56–114 Kbit/second by using unused time division multiple access (TDMA) channels in, for example, the GSM system. GPRS supports the following protocols:
Internet protocol IP
Point-to-point protocol (PPP).
X.25 connections
When TCP/IP is used, each device can have one or more IP addresses allocated. GPRS will store and forward the IP packets to the device even during handover. The TCP handles any packet loss (e.g. due to a radio noise induced pause).
In case of advanced and distributed automation systems such as the faulted line segment selection and clearance with circuit breakers along feeders (aimed at avoiding interruptions longer than 1 minute) higher speed wireless communication technologies are required, for example public 3G or proprietary Wi-Fi. The choice between 3G or Wi-Fi should be performed after a proper evaluation with the telecommunication companies (in case of public access network) about the use of reserved channel and the minimum latency required by the automation. Latency must be as low as possible in order to complete the fault selection process in less than 1 minute. KSA’s public infrastructure for wireless communication is already able to add many new connections (more than 6 million new users)9.
5.4.2 Smart Meters proposal for KSA
In order to have fully enable benefit capturing in terms of reduction of network costs on meter reading and management, enablement of the full potential for distributed generation and of Demand Response Programmes to be provided to end-users, Smart Meters should be massively rolled out to KSA electricity customers. The Business Case analysis supports this recommendation considering all potential benefits and the estimated cost for a complete roll-out.
With respect to the communication architecture for Smart Meters, it is important to outline here that the solutions will be based on a mix of data concentrator models, with an intermediate layer among meters, a central system, and a direct communication model, applicable as illustrated in the following figure.
9 Reference from STC interview in February 2013
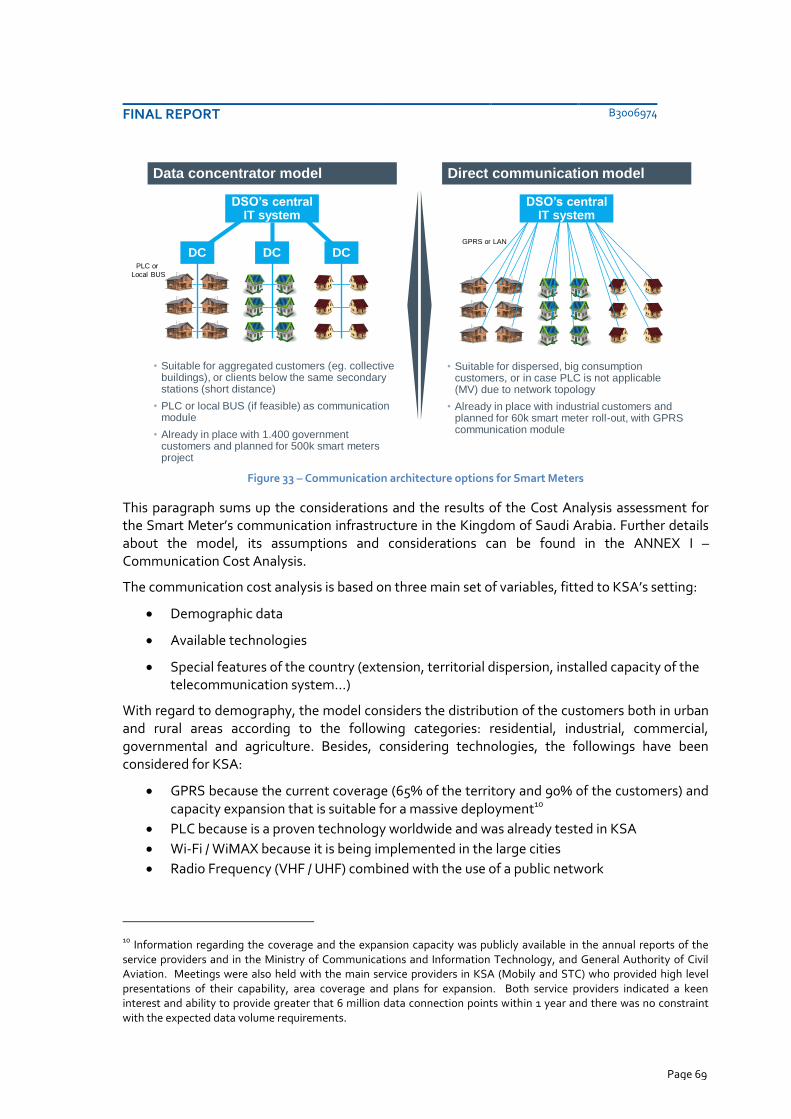
FINAL REPORT B3006974
Page 69
Figure 33 – Communication architecture options for Smart Meters
This paragraph sums up the considerations and the results of the Cost Analysis assessment for the Smart Meter’s communication infrastructure in the Kingdom of Saudi Arabia. Further details about the model, its assumptions and considerations can be found in the ANNEX I – Communication Cost Analysis.
The communication cost analysis is based on three main set of variables, fitted to KSA’s setting:
Demographic data
Available technologies
Special features of the country (extension, territorial dispersion, installed capacity of the telecommunication system…)
With regard to demography, the model considers the distribution of the customers both in urban and rural areas according to the following categories: residential, industrial, commercial, governmental and agriculture. Besides, considering technologies, the followings have been considered for KSA:
GPRS because the current coverage (65% of the territory and 90% of the customers) and capacity expansion that is suitable for a massive deployment10
PLC because is a proven technology worldwide and was already tested in KSA
Wi-Fi / WiMAX because it is being implemented in the large cities
Radio Frequency (VHF / UHF) combined with the use of a public network
10
Information regarding the coverage and the expansion capacity was publicly available in the annual reports of the service providers and in the Ministry of Communications and Information Technology, and General Authority of Civil Aviation. Meetings were also held with the main service providers in KSA (Mobily and STC) who provided high level presentations of their capability, area coverage and plans for expansion. Both service providers indicated a keen interest and ability to provide greater that 6 million data connection points within 1 year and there was no constraint with the expected data volume requirements.
-
Communication architecture options
DC DC DC
DSO’s central IT system
Data concentrator model
DSO’s central IT system
Direct communication model
• Suitable for aggregated customers (eg. collective buildings), or clients below the same secondary stations (short distance)
• PLC or local BUS (if feasible) as communication module
• Already in place with 1.400 government customers and planned for 500k smart meters project
• Suitable for dispersed, big consumption customers, or in case PLC is not applicable (MV) due to network topology
• Already in place with industrial customers and planned for 60k smart meter roll-out, with GPRS communication module
PLC or
Local BUS
GPRS or LAN

FINAL REPORT B3006974
Page 70
Fibre optic considering the existing ones connecting the HV/MV substations of the Transmission Company. This means could be used for the communications ‘backbone’ if the costs are shared between distribution and transmission businesses.
And others have not been considered:
Broadband communication (fibre optic to the customer, DSL broadband PLC) has not been recommended for the core metering functions for the utility as it applies only when the company is seeking other commercial business (internet/broadband services). Also, there is the risk of there being few and costly suppliers of this relatively new technology.
New Fibre optic deployment and installation to carry signals from the MV/LV substations to the AMI centre.
3G is not required as the higher communication speed (with respect to GPRS) doesn’t represent a critical issue for smart meters while the lower coverage is.
The model has been developed upon four different scenarios (according with the assumptions) and has the following structure:

FINAL REPORT B3006974
Page 71
Table 19: Model’s structure and scenarios
Each scenario has its respective architecture and also considers a subset of options for the main variables:
o Three different options for the reading cycles
o Three different options for the meters by concentrator
o Three different options for the traffic data
o Two options for data connections (flat, on-demand)
The communication infrastructure for each scenario with the customers’ allocation on both urban and rural settings is shown in the following tables and figures.

FINAL REPORT B3006974
Page 72
Table 20: GPRS & PLC scenario
Urban Area Rural Area
Table 21: Only GPRS scenario
Urban Area Rural Area

FINAL REPORT B3006974
Page 73
Table 22: Wi-Fi & Fibre-optic scenario
Urban Area Rural Area
Table 23: RF & GPRS scenario
Urban Area Rural Area
Meter Type: GPRS Meters RF Meters Not Connected
Residential 1% 99% 0%
Industrial 100% 0% 0%
Commercial 20% 80% 0%
Government 100% 0% 0%
Agriculture & Others 100% 0% 0%
Meter Type: GPRS Meters RF Meters Not Connected
Residential 65% 30% 5%
Industrial 100% 0% 0%
Commercial 65% 35% 0%
Government 100% 0% 0%
Agriculture & Others 65% 25% 10%

FINAL REPORT B3006974
Page 74
The simulations in analysis show that PLC & GPRS scenario is the least-cost solution for the AMI in KSA; in fact it has the lowest CAPEX, regardless the number of meters connected under a single Data Concentrator Unit. CAPEX doesn’t rely on the reading cycle or the contract for the communication services (see Annex I for details).
The least cost scenario considers:
The architecture of communication according to the PLC and GPRS communication. PLC whenever is possible and GPRS communication for the 100% of the industrial and government buildings.
Optimum reading cycle
Typical quantity of meters by Data Unit Concentrator (20)
The current coverage of GPRS
A reduction of the current GPRS rates published by STC operator by 50%, because of the likelihood of bulk contracts and according to the previous experience of the Consultant in negotiations with other telecommunication operators.
On-demand connection with GPRS.
The PLC concentrator has internal modem with the option for add-on communication modules in the future (e.g. for switching to the Wi-Fi option)
The PLC communication is performed in the CENELEC band (assumption of exclusive frequency allocation by the Telecoms Regulator, supported by the national policy to foster SM/SG)
From a reliability point of view, the quality offered by the combination of PLC and GPRS for Residential Customers is acceptable. Besides, the technology is proven in many countries with European and American standards and there are more than 50 million of meters installed under these technologies (PLC and GPRS). The distribution networks (communication mean) are no so different around the world, so the quality of the communication mean (distribution network) is acceptable. The quality of the GPRS network normally is considered in the negotiation process with the telecommunications provider.
A more detailed results and analysis is provided in Annex I.
The minimum functional requirements for Smart Meters deployment are given in section 5.2.4 and Annex II.

FINAL REPORT B3006974
Page 75
6 BUSINESS CASE ANALYSIS
6.1 The Business Case Model
The proposed solutions of Smart Meters and Smart Grids for KSA have been assessed through a Business Case model to verify their profitability in terms of costs and benefits.
This model is structured to compare the Net Present Value (over a 15 year period at 7.5% discount rate11) of the Smart Meters and Smart Grids Strategy elements. The model can simulate a number of scenarios to reflect possible changes in the speed of roll-out, predicted savings/benefits, estimated costs for key items (such as meters, communications, smart grid new technologies, etc.). Some of the key data items have been taken from the KSA local environment, whilst others have been sourced from international references (all sources are stated).
Table 24: Business Case model structure
6.1.1 Cost Benefit Analysis
The specific Business Case scenarios, which are illustrated in detail within the following sections, consider separately both Smart Meters and Smart Grids, are structured under the following Cost Benefit Analysis (CBA) elements:
Costs, in terms of capital (capex) and operating expenditures (opex) needed respectively to realize such investments within the networks and to run related operations (the value of assets not yet depreciated is considered in the terminal value calculation).
Benefits linked to the deployment of such technologies, corresponding to reducing costs or arising revenues, divided into:
11
the model can be adjusted for different discount rates
-
Business Case Analysis
Cost Calculation Benefits calculation
Input variables and assumptions:
• General assumptions on electricity systems (Peak demand, Consumption, Number
of customers, Power capacity mix, T&D network sizins)
• Specific assumptions on Smart Grids and Smart Meters
– costs (capex, opex)
– direct benefits (reduced operating costs, reduced losses, …)
– indirect benefits (reduced peak demand, increase fuel availability, …)
• Discount rate for Cash Flow: 7.5%
• Considered timeframe: 10 years
NPV scenarios
Smart Grids and Smart Meters: Business Case structure
Illustrative
15 years

FINAL REPORT B3006974
Page 76
o Direct, if strictly connected to SG and SM solutions and directly realized by the T&D operators responsible for such initiatives (under the current structure)
o Indirect, if supported indirectly by SG and SM, since also requiring other system initiatives, and not directly realized by the T&D operators12
6.1.2 Base Assumptions
The business case for Smart Grid HV and MV solutions has been developed considering specific assumptions on the expected evolution of the electricity system (under business as usual scenario), and on benefits and costs as described in the previous section.
Such assumptions have been formulated using public institutional sources for KSA electricity market (as stated hereafter) and, where not available, leveraging direct project experiences of both Consultants in other Countries, properly customized to reflect knowledge and/or perception of KSA electricity market peculiarities.
It is important to outline that all assumptions have been submitted to local market stakeholders, in order to ensure consistency with local market characteristics and projects already performed in the Country.
Specifically, the following assumptions have been considered for current status of the electrical system and expected development under a business as usual scenario:
(i) Peak demand. The Current value of peak demand (2011) has been considered equal to 47 GW, composed of residential customers at 27 GW (the highest share, and therefore the contribution to such peak demand, as previously stated), industrial customers at 8 GW, Government customers at 6 GW, commercial customers at 5 GW and Agricultural / Others at 1 GW.
Growth rates over a 15 year time frame (considered in the base business case) have been considered equal to 5% for residential customers, 8% for industrial customers, 3% for Government customers, 7% for commercial customers and 3% for Agricultural / Others13.
(ii) Consumption. The Current value of electricity consumption (2011) has been considered equal to 231 TWh, composed of residential customers at 118 TWh, industrial customers at 50 TWh, Government customers at 31 TWh, commercial customers at 26 TWh and Agricultural / Others at 5 TWh.
Growth rates over a 15 year timeframe, have been considered equal to 5% for residential customers, 9% for industrial customers, 3% for Government customers, 7% for commercial customers and 3% for Agricultural and Others14.
(iii) Number of customers. Current number of customers (2011) has been considered equal to 6.2 million, with 5.1 million residential customers, 840,000 commercial
12 The business case presented in this chapter shows the direct benefits to be sufficient to justify the proposed
deployment of SM/SG technologies detailed in chapter 5.0. The indirect benefits reflect the savings to the national economy but are not required to justify the deployment. 13
Source: Demand Side Management Study, ECRA, 2011 (for both current values and growth rates) 14
Source: Demand Side Management Study, ECRA, 2011 (for both current values and growth rates)

FINAL REPORT B3006974
Page 77
customers, 228,000 Government customers, 72,000 Agricultural and others and 8,000 industrial customers.
Growth rates in the number of customers over a 15 year timeframe have been considered equal to 5% for residential and industrial customers, 10% for Government customers, 7% for commercial customers and 3% for Agricultural and Others15.
(iv) Power capacity mix. Current installed power capacity (2011) has been considered equal to 55 GW, made of HFO and GAS16. Installed capacity in 2028 has been assumed equal to 130 GW17.
(v) T&D network sizing. The electrical grid in KSA has been sized considering the following assumptions18:
o Transmission lines: 49,675 km (2011), +6%/year growth rate
o Distribution lines: 409,298 km (2011), +8%/year growth rate
o Transmission substations: 642 (2011), ~50 new substations/year
o Distribution substations (MV/LV): 230,000 (2011), ~20,000 new substations/year1
o Feeders: 5,136 (2011), +6%/ year growth rate
(vi) T&D network performances. The major indicators of network level of service, SAIFI and SAIDI, have been considered as respectively 4.40 interruptions/customer and 205 minutes/customer in 201119, assuming a 1 % growth rate for SAIFI, based on historical values. T&D network losses have been considered equal to 10% in 201120, with a composition among technical and non-technical losses assumed equal respectively to 70% and 30%, based on international cases, being not available any official data for KSA.
(vii) T&D electricity tariffs. Electricity tariffs currently in place in KSA, have been assumed growing at 5% growth rate, considering that in the past years tariffs have been increased for all customers (directly or through applying tariffs differentiated by consumption levels), except residential ones.
(viii) Discount rate: the business case model can be adjusted for different discount rates and a central case of 7.5% was used. Varying the discount rate in the range 5.0% – 7.5% does not materially affect the results
15
Source: Demand Side Management Study, ECRA, 2011 (for both current values and growth rates) 16
Source: Demand Side Management Study, ECRA, 2011 (for both current values and growth rates) 17
Source: KA.CARE -Sustainable Energy Promotion and Procurement in Saudi Arabia 18
Source: Annual Report, SEC, 2011 (Baseline data, except feeders), assumptions based on international experiences for growth rates 19
Source: ECRA 20
Source: ECRA
FINAL REPORT B3006974
Page 78
6.2 Business Case for Smart Grids
6.2.1 Summary of assessed benefits and costs [SG]
The wide implementation of Smart Grid solutions on the grids, including HV and MV automation offers, as anticipated, a wide-range of benefits for the whole electrical system.
The Business Case developed to verify the sustainability of Smart Grids proposed solutions in KSA consider the following quantified benefits, divided into direct and indirect, described as follows (note: assumptions on predicted reduction / benefits are discussed in section 6.2.2):
Direct benefits, that can be achieved by T&D operators under the current structure:
o Reduced operating costs. Reduction / optimization of resources involved in the manual operations and maintenance of the electrical grids, enabled by the implementation of HV and MV automation solutions;
o Improved quality of services and losses. Reduction of technical losses on the electricity networks due to automated control of grid voltage and power factor systems, optimization of load dispatching and management;
o Increased continuity of service. Improved reliability of automated responses to some types of outages and faster scouting and repair for others, reducing the duration or scale of outages;
Indirect benefits, that can be generated for the whole electrical system and are based on the development of alternative energies, and especially distributed renewable ones (according to K.A. CARE Plans mentioned in Chapter 1), enabled by Smart Grid solutions in terms of hosting and integration on the electricity grids. Such energy sources will cover mainly electricity demand during peak hours, contributing to reduce simultaneously the need of additional oil-based power capacity. Such benefits can be distinguished in:
o Optimized energy generation mix and peak reduction. Perspective of lower costs (including both capital expenditures and operating costs) not incurred for the avoided construction and operations of new oil-based power capacity needed to cover peak demand, under the business as usual scenario, and replaced by distributed renewables energies. Costs for such sources is in fact expected to strongly decrease in the next years due to further innovation and technology maturity;
o Increased fuel availability. This consists of the reduced fuel consumption in generation enabled lower by oil-based production needed and the consequent opportunity for a wider availability of hydrocarbon not directed anymore to internal consumption, but to the sale on international markets, at related higher price.
o Reduced GHG emissions. This benefit will be related to the lower emissions of GHG (CO2), linked to a reduction of the internal consumption of oil fuel, to lower oil-based electricity production. In case a system for trading GHG emission certificates would be in place, as it is already the case in several Countries, this reduction would imply a cost reduction for the national entity responsible for GHG emissions, that would on the contrary be obliged to purchase certificates to cover such emissions.
With respect to cost components of Smart Grids, the following items have been considered in the development of Business Cases:

FINAL REPORT B3006974
Page 79
Transmission capex, including:
o procurement of transmission network equipment for automation and installation on the grid, including transmission line sensors, FACTS devices and HVDC terminals, short circuit current limiters, and phasor measurement technology for wide area monitoring;
o cost of enterprise back-office systems and equipment (including GIS, outage management and transmission management);
o cost of supporting IT / Cyber Security and communication infrastructure for transmission lines and substations;
SG systems opex (Transmission), including cost of maintenance and operations of the above mentioned automation systems and equipment;
Distribution capex, including:
o procurement of distribution network equipment for automation and installation on the network, such as distribution feeder circuit automation (Intelligent reclosers and relays at the head end and along feeders), power electronics, including distribution short circuit current limiters, voltage and VAR control on feeders
o Cost of Control Rooms enhancement, needed to remotely operate and control the above mentioned equipment and system
o Cost of supporting IT and communication infrastructure between all digital devices on the distribution system
SG systems opex (Distribution), including cost of maintenance and operations of the above mentioned automation systems (including data traffic costs) and equipment.
6.2.2 Direct Benefits Assumptions [SG]
With respect to the previously highlighted benefits, the following assumptions have been formulated on direct benefits:
Reduced operating costs. The optimization of operating costs due to automated operations has been assumed considering international experiences (e.g. Italy Case) that reported savings ranging between -5% and -10%. Such benefits can of course vary significantly according to specific network characteristics and architecture, intensity and productivity of resources involved in network operations and maintenance and level of service provided. Without having an inside out knowledge of KSA network system, based on the improvable level of service of network performances (SAIFI, SAIDI), and therefore on the probably higher utilization of resources in ensuring network operations and restoring functionalities when needed, the value of operating cost reduction potential has been assumed equal to -8% a more pessimistic figure would be 5%. Such saving potential has been applied to transmission and distribution operations and maintenance costs (with a learning curve reaching full impact at the end of investment time frame, in 7 years), calculated respectively as 22,000 SAR per CKM and 7,000 SAR per CKM21.
21
Source: SEC Annual Report, 2011

FINAL REPORT B3006974
Page 80
This benefit item is worth 1.1 billion SAR yearly at the end of the analysed period (15th year);
Improved load management and losses. The reduction of technical losses on the electricity T&D networks due to automated control of grid voltage and power factor systems, optimization of load dispatching and management has been assumed equal to -10% of technical losses value [a more ambitious figure would be 20%], according to international experiences shared with KSA stakeholders. Assuming technical losses equal to 7% of energy consumption (as previously explained), such losses are therefore assumed to reduce by -0.7% at the end of the period
This benefit item is worth 1.2 billion SAR yearly at the end of the analysed period (15th year).
Increased continuity of service. This benefit considers the reduced duration of outages due to automated responses to some types of outages and faster scouting and repair for others. It has been assumed considering a potential reduction of SAIFI equal to 50% against current levels [a more pessimistic figure would be 30%], considering that, according to international experiences, the reduction might be also higher (e.g. In Italy the average minute of breakdown dropped from 128 to 46 min, equal to -65%). Such reduction has been valued considering a consequent increase of consumption at related electricity tariff, although other benefits include meeting regulatory targets, for which there could also be some avoided costs (penalties). The impact of reduction in operating costs of the avoided outages is included in the Opex item above.
This benefit item is worth 70 million SAR yearly at the end of the analysed period (15th year).
6.2.3 Indirect Benefits Assumptions [SG]
With respect to indirect benefits, as anticipated, they reflect the Smart Grids solutions and integration of alternative energies within the electrical grids that will cover mainly electricity demand during the peak hours, contributing to reduce simultaneously the need of additional oil-based power capacity. While Smart Grid solutions will enable specifically the network integration of distributed renewable sources, mainly responsible for production during peak hours, they will also support a more efficient and balanced use of whole energy generation capacity, with the feature previously illustrated.
The perspective development of alternative technologies has been assumed in line with K.A. CARE plan22, considering at 2028 an installed capacity of 130 GW, covered, in such scenario, by HFO & Gas plants for 60%, Large Solar Plants for 23%, Nuclear for 11%, Biomass and others for 9% and small Solar Plants for 3%. Linked to the development of this last technology, PV distributed generation, the following assumptions have been formulated on indirect benefits:
Optimized energy generation mix. The replacement of HFO plants with PV distributed generation (besides other alternative energies) to cover growing peak demand (against the business as usual scenario), brings different costs of construction and operations of new power plants. In order to estimate such value, It has been considered the levelized cost of energy (“LCOE”), corresponding to the cost of generating electricity (capex) at the
22
Source: K.A. CARE, Sustainable Energy Promotion and Procurement in Saudi Arabia
FINAL REPORT B3006974
Page 81
point of connection to a load or electricity grid including the cost of operations and fuel (opex) at domestic market prices. Based on international references, properly customized to KSA and cross-checked with major local stakeholders, current LCOE has been assumed equal to 0.47 for HFO plants and 0.90 SAR / KWh for small / rooftop Solar plants. Considering expected technology maturity, current levels is expected to decrease for small Solar plants (-6% yearly), while increasing for thermoelectric plants due to the oil price increase (+3% yearly). This different trend will therefore generate such cost reduction benefit in the long term. The production from solar distributed generation has been calculated considering a load factor of 0.2 on the installed capacity expected23.
This benefit item is very significant and worth 1.2 billion SAR yearly at the end of the analysed period (15th year);
Increased fuel availability. The reduced fuel consumption has been assumed considering, on the reduced HFO power capacity substituted by distributed solar generation, assumed as previously highlighted, an amount of fuel needed to produce one MWh of energy equal to 7.94 MBTU/MWh, based on an industry average, a barrel Oil Price of 396 SAR in 2012, growing at 0.3%24 yearly, and an MBTU per Barrel of 5.5 based on industry average.
This benefit item is worth 3.3 billion SAR yearly at the end of the analysed period (15th year);
Reduced GHG emissions. This benefit has been assumed considering a CO2 price of 37 SAR per tonne, based on industry average, growing yearly at 16% up to 2020 and then to 5%25, and an emission rate of 0.635 tonnes of CO2 per MWh (average between gas and oil), avoided on the oil-based capacity not needed due to the development of alternative energies (distributed solar energy), as previously assumed26.
This benefit item is very significant and worth 600 million SAR yearly at the end of the analysed period (15th year).
6.2.4 Capex and Opex costs [SG]
With respect to costs for implementation of Smart Grids solutions, the following assumptions have been considered:
Implementation pace. For the massive implementation of Smart Grids solutions identified, an implementation pace of 7 years has been considered, corresponding to one typical investment cycle and considering the network scale compared to other Countries (e.g. Italy) with a higher level of automation developed. However, the proper implementation pace will have to be developed considering specific network characteristics and architecture, availability and productivity of resources involved in such investment by T&D operators.
23
Source: K.A. CARE, Sustainable Energy Promotion and Procurement in Saudi Arabia 24
Source: Worldbank Commodity Forecast Sept 2012 25
Source: A.T. Kearney study on CO2 trading schemes 26
Source: K.A. CARE, Sustainable Energy Promotion and Procurement in Saudi Arabia
FINAL REPORT B3006974
Page 82
Transmission capex
o the installation cost of network equipment for automation has been calculated assuming the installation of Intelligent Electronic Devices (IEDs) on all HV substations (FACTS devices and HVDC terminals, transmission line sensors, …) and of Phasor Measurement Units in 1/3 of HV-HV substations, with specific unit costs per components based on industry standards. This item is worth 4.9 billion SAR over the analysed period (15 years);
o cost of enterprise back-office system and equipment (including GIS, outage management and distribution management), has been assumed equal to 75 mln SAR, according to industry standards, with a lifecycle of 10 years;
o cost of supporting IT / Cyber Security and communication infrastructure to support transmission lines and substations, has been assumed equal to 300,000 SAR per substation (as a sizing indicator based on industry standards), considering an optical fibre communication infrastructure (as already used by National Grids). This item is worth 514 million SAR over the analysed period (15 years);
In summary, total capex related to HV automation are worth 5.6 billion SAR over the analysed period (15 years), corresponding to around 3.2 million SAR per automated substation, at the end of the period;
SG systems opex (Transmission). The cost of maintenance and operations of the above mentioned HV automation systems and equipment has been assumed equal to 20,000 SAR per year, for each automated substation as an all-inclusive synthetic opex indicator, based on industry standards.
This item is worth 33 mln SAR yearly at the end of analysed period (15th year).
Distribution capex
o the installation cost of network equipment for automation has been calculated assuming the installation of distribution automation systems (Intelligent reclosers and relays, witches, Reclosers, Sensors Capacitor Banks, Direct Load and Generator Control, Voltage and Power Flow control equipment, …) to all network feeders, with specific unit costs per components based on industry standards;
o the cost of supporting IT and communication infrastructure between all digital devices on the distribution system (including 4 Control Centers, one for each Region) has been assumed equal to 75,000 SAR per feeder (as a sizing indicator based on industry standards),
o In summary, total capex related to MV automation are worth 9.5 billion SAR over the analysed period (15 years), corresponding to around 0.5 million SAR per new automated feeder, and including also refurbishment investments after 10 year lifecycle.
SG systems opex (Distribution). The cost of maintenance and operations of the above mentioned MV automation systems and equipment has been assumed equal to 10,000 SAR per year, for each automated feeder as an all-inclusive synthetic opex indicator, based on industry standards.

FINAL REPORT B3006974
Page 83
This item is worth 135 million SAR yearly at the end of the analysed period (15th year).
Based on the mentioned assumptions, the Business Case has been built up using a Discounted Cash Flow (DCF) method, with final results presented as a net present value (NPV) of cash-flows for a period of 15 years, assuming a discount rate of 7.5 percent.
The Business Case has been assessed considering rising costs needed to build and operate from greenfield the proposed solutions, even if, as previously mentioned, some project was already on-going in the field in KSA.
Table 25 Smart Grids Business Case – summary of major assumptions
Topic Major assumptions
Peak demand Baseline data (2011) in GW: Residential: 27, Commercial: 5, Government:
6, Industrial: 8, Agricultural & Others: 1
Growth rate over a 15 year time frame: Residential: 5%, Commercial: 7%, Government: 3%, Industrial: 8%, Agricultural & Others: 3%
Consumption Baseline data (2011) in TWh equal to 231: Residential: 118, Commercial:
26, Government: 31, Industrial: 50, Agricultural & Others: 5
Growth rate over a 15 year time frame: Residential: 5%, Commercial: 7%, Government: 3%, Industrial: 9%, Agricultural & Others: 3%
Number of customers Baseline data (2011) equal to 6.2 million: Residential: 5.1 million,
Commercial: 840,000, Government: 228,000, Industrial: 8,000, Agricultural & Others: 72,000
Growth rate over a 15 year time frame: 5% for residential and industrial customers, 10% for Government customers, 7% for commercial customers and 3% for Agricultural and Others
Power capacity mix Baseline data (2011) of installed capacity in GW: HFO and Gas: 55
2028 installed capacity: 130 GW
T&D network sizing Transmission lines: 49,675 km (2011), +6%/year growth rate
Distribution lines: 409,298 km (2011), +8%/year growth rate
Transmission substations: 642 (2011), ~50 new substations/year
MV/LV substations: 230,000 (2011), ~20,000 new substations/year1
Feeders: 5,136 (2011), +6%/ year growth rate
T&D network performances and electricity tariffs
SAIDI (2011): 205 minutes/customer, 1%/year growth rate
Network losses equal to 10%, whose technical assumed 70% and non-technical 30%
Average electricity tariff increase: 5% / year
SG Benefit: opex reduction
Transmission O&M costs (2011): 22.629 SAR per ckm
Distribution O&M costs (2011): 7.262 SAR per ckm
Target reduction through Smart Grids: -8%

FINAL REPORT B3006974
Page 84
Topic Major assumptions
SG Benefit: losses improvement
Reduction of technical losses rate: -10% of technical losses value
SG Benefit: quality of service improvement
Rate of reduction of outages (SAIFI): -50%
Learning curve reaching 100% efficiency of the system in 3 years
SG Benefit: optimized energy capacity mix
Current LCOE equal to 0.47 SAR / KWh for HFO plants, 0.90 SAR / KWh for distributed Solar plants
Current levels expected to decrease for renewable plants (e.g. -5%/-6% yearly for solar), while increasing for thermoelectric plants due to oil price increase (+3% yearly).
SG Benefit: additional oil available for sale to int’l
markets
Amount of fuel needed to produce one MWh of energy: 7.94 MBTU/MWh
Barrel oil price forecast: 396 SAR/ Barrel in 2012 (0.3% p.a. price growth)
MBTU per barrel: 5.55
Target avoided consumption equal to 212,792*104 MBTU of Fossil energy source
SG Benefit: reduction of GHG emissions
Fossil energy carbon emissions: 0.635 Tonnes CO2/ MWh
Tonnes of CO2 price: 37 SAR (Growth 16% from 2012-2020 and 5% from 2020-2050)
Transmission capex 7 years of investment time frame
Installation of Intelligent Electronic Devices (IEDs) on all HV substations: FACTS devices, sensors; Phasor Measurement Unit in 1/3 of the HV-HV substations; cyber security and a communication (fibre) and IT infrastructure; enterprise back-office system for automated control and analysis
Capex value indicator: total transmission automation capex per automated substation equal to 3,2 million SAR
Transmission opex Ongoing maintenance and operations of new installed equipment and
systems
Opex value indicator: total transmission automation opex per automated substation equal to 20 k SAR / year
Distribution capex 7 years of investment time frame
Installation of distribution automation systems to all network feeders, including Intelligent reclosers and relays, switches, Reclosers, Sensors Capacitor Banks, Direct Load and Generator Control, Voltage and Power Flow control equipment; Communication and IT infrastructure; SCADA and DMS system; Control center (4)
Capex value indicator: total distribution automation capex per automated feeder equal to 0,5 million SAR
Distribution opex Ongoing maintenance of installed equipment and systems and operations
Opex value indicator: total distribution automation opex per automated feeder equal to 10 k SAR / year

FINAL REPORT B3006974
Page 85
6.2.5 Base Case Results [SG]
The Business Case on the basis of the illustrated assumptions (Base Case) highlights that Smart Grids solutions in KSA, including HV and MV automation, can be a profitable investment, considering costs and direct benefits.
Specifically, over a 15-year time frame, the cumulated NPV is equal to 2.2 billion SAR, composed as follows:
Costs show a negative NPV of 6.8 billion SAR (around 16.7 billion SAR in total, not discounted), that reflects total capex of 5.6 billion SAR to build up the assumed Smart Grids solution on the transmission network and of 9.5 billion SAR on the distribution network (including refurbishment after lifecycle), besides total operating costs of around 308 million SAR in the transmission network and 1.2 billion SAR in the distribution network to operate and maintain equipment and systems;
Benefits show an overall positive NPV of about 9.0 billion SAR, of which:
o 4.3 billion SAR, related to reduced operating costs, through remote and automated operations;
o 4.4 billion SAR, related to reduction of technical losses and quality of service (SAIDI) improvement;
o residual 245 million SAR due to reduction of duration of outages. Such benefit, even if relatively lower, is significantly the most important for the perception of continuity of service by customers.
Figure 34 – NPV for Smart Grids by cost and direct benefit component
Besides the direct benefits for T&D operators, that already seems to overcome solution costs, indirect benefits for the whole system, as previously detailed, are markedly higher and make the NPV significantly soar, as illustrated in the following table. As previously discussed this (paragraph 6.2.3) is mainly due to the evolution of the energy capacity mix (distributed solar plants), increased availability of fuel for sale and reduced GHG emissions derived from the Renewables Plan (lead by K.A.CARE) and facilitated by introducing these new technologies. The
-
Smart Grids – NPV by cost and direct benefit component-SAR Mn, 15 year timeframe-
Cumulated NPV
2,189
Increased continuity of
service
245
Improved qualityof services and
losses
4,448
Reduced operating
costs
4,330
Costs (capex and
opex)
6,834
Smart Grids – Business Case Results

FINAL REPORT B3006974
Page 86
NPV of indirect benefits linked to revised energy capacity mix with distributed solar plants is however slightly negative due to initial negative flows (LCOE higher than that of HFO plants), that become positive only in 2023 (LCOE for distributed solar plants lower than that of HFO plants), not being able to provide a positive NPV over a 15 year time frame.
Figure 35 – NPV for Smart Grids including indirect benefits
Such impressive level of benefits for the whole electricity system will have to be considered when defining the financing scheme for Smart Grids, especially in view of market opening and asset-value tariff definition of regulated activities, as explained in following Chapter 8.
6.2.6 Sensitivity Analysis [SG]
Sensitivity analyses have been conducted in order to test the elasticity of NPV results to changes in major assumptions. Since, as highlighted in the previous section, the level of indirect benefits is very high and have a different scale compared to cost and direct benefits of such solutions, they have not been considered in sensitivity analyses (they would be anyhow significantly higher).
Sensitivity analyses have been performed on the following major cost and direct benefit components, such as:
Costs and penetration of Smart Grids and HV and MV automation capex
Level of operating cost reduction, generated by Smart Grids through automated operations
Level of reduction of technical losses
Specifically, from the sensitivity analysis on these factors it emerges that:
The extent of Smart Grids investments, that might have a different value of what it has been preliminarily assumed in the base case due to review of technical parameters in planning phase, different needs and/or realizable prices, can dramatically affect the Smart Grids programme NPV. A change of ±10 % against the level assumed in the base
-
Smart Grids – NPV by cost and direct and indirect benefit component-SAR Mn, 15 year timeframe-
Cumulated NPV
12,023
Reduced GHG
emissions
1,791
Increased availability of
fuel for sale to int’l markets
8,095
Optimized energy
capacity mix
52
Direct benefit
9,023
Costs (capex and
opex)
6,834
Smart Grids – Business Case Results
Indirect benefits

FINAL REPORT B3006974
Page 87
case (15.1 bln SAR for both HV and MV) can make the NPV increase / decrease by 40% (around 800 million SAR), still remaining positive. Therefore, it will be extremely important in the execution phase to push investment optimization as much as possible;
Level of operating cost reduction is very sensitive for the positive results of Smart Grids programme NPV. A change of ±4 % against the level assumed in the base case (-8%) can make the NPV increase / decrease by 100% (2.2 billion SAR). Therefore, it will be extremely important to ensure investments on Smart Grids are designed along proper cost reduction targets;
Level of reduction of technical losses is as well key to NPV sustainability, and a reduction of 5% of current technical losses is the minimum level to make the assumed investments covered (-10% is the assumed base case).
Figure 36 – Smart Grids – Sensitivity analyses
As described in following Chapter 8, monitoring first results achieved through Smart Grids programme implementation will be key to properly verify the level of cost and benefits, maximizing optimization opportunities and eventually launch other promoting actions at system level, considering the very high level of indirect benefits.
Moreover, considering simultaneously worst and best case on the 3 drivers analysed, is possible to derive an aggregated worst and best case for Smart Grids solutions, with an NPV equal respectively to -2,999 million SAR and 7,377 million SAR against the Best Case (2,189 million SAR). Such cases are anyhow presented just for completeness, being the Best Case the more
-
Smart Grids – Sensitivity analyses
Smart Grids – Business Case Results
Cost /
Benefit
component
Business Case NPV for driver
value
Sensitized
Driver
Reduced
operating costs
(benefit)
Improved quality
of services and
losses (benefit)
Reduction in T&D
operating costs
Reduction of
technical losses
24
4,3542,189
NPV1
Driver
values
WORST CASE BASE CASE BEST CASE
4% 8% 12%
1. Mln SAR; considering only direct benefits
4,4132,189
-35NPV1
Driver
values
WORST CASE BASE CASE BEST CASE
-5% -10% -15%
Transmission
and distribution
capex (cost)
Smart Grids HV and
MV automation capex
needed
(Bln SAR)
2,9882,189
1,390NPV1
Driver
values
WORST CASE BASE CASE BEST CASE
16.6 15.1 13.6

FINAL REPORT B3006974
Page 88
confident scenario27, with acceptable variance potentially on specific drivers, but not simultaneously on all analysed ones.
Figure 37 – Smart Grids – Aggregated Base, Worst and Best Case
27
A sensitivity analysis considering a different discount rate ±3% does not cause a material change to the results.
-
Smart Grids – Business Case Results
Smart Grids – Sensitivity analyses-SAR Mn, NPV over 15 year timeframe-
Best Case
7,377
Base Case
2,189
Worst Case
2,999

FINAL REPORT B3006974
Page 89
6.3 Business Case for Smart Meters solutions
6.3.1 Summary of assessed benefits and costs [SM]
As illustrated in previous sections, a massive roll-out of Smart Meters to all electricity customers in the KSA brings a significant contribution to address some of the local energy challenges.
For the Business Case calculations, the following quantified benefits, divided into direct and indirect, have been considered:
Direct benefits, that can be achieved by T&D operators under the current structure:
o Reduced operating costs. Reduction / optimization of resources involved in meter reading and meter management activities performed by T&D operators. Currently the cost incurred for the labour force to read meters (typically once per month) will be reduced, as well as the cost related to connection and disconnection, due to personnel no longer visiting client locations.
Finally, restoration costs will be reduced due to a reduction of time needed to identify the location of a failure, with an impact on resources.
o Improved network losses. This refers to decreasing non-technical losses or volume of energy that is delivered to final customers, but not invoiced. Smart metering can help accurately measure the energy balance (electricity inflows and outflows), identifying customers and consumption now experiencing commercial losses;
o Improved billing accuracy. Besides non-technical losses, Smart Metering will also bring opportunities for revenue increase for electricity suppliers due to the fact the information on real electricity consumption is more precise against traditional meters and generate more precise billing;
o Avoided replacement of traditional meters. Reduction of costs due to avoided replacement of traditional meters. It has been considered as a baseline for the business as usual case, without any smart meters installed, where traditional meters are replaced based on their life duration, based on damages, and meters installed for new customers.
Indirect benefits, that can be generated for the whole electrical system and are enabled by Smart Metering installations, due to peak demand shaving connected to the development of different consumption patterns against today, with lower consumption during peak hours pushed by higher tariffs (especially for residential customers) in peak hours versus off peak hours, and consequently re-alignment of the new delivery of oil-based power capacity, in line with the reduced need to be covered. Such benefits can be distinguished in:
o Reduced generation cost. Lower costs (including both capital expenditures and operating costs) not incurred for the avoided construction and operations of new power capacity needed to cover peak demand, under the business as usual scenario;
o Reduced T&D costs. Lower costs (including both capital expenditures and operating costs), not incurred for the avoided construction and operations of extensions of the electrical grids needed to connect new power capacity built up to cover peak demand, under the business as usual scenario;

FINAL REPORT B3006974
Page 90
o Increased fuel availability. This consists of the reduced fuel consumption in generation enabled by lower generation production needed and the consequent opportunity for a wider availability of hydrocarbon not directed anymore to domestic consumption, but to the sale on international markets, at related higher price;
o Reduced GHG emissions. This benefit will be in related to the lower emissions of GHG (CO2), linked to a reduction of the domestic consumption of oil fuel, to lower peak demand. In case a system for trading GHG emission certificate would be in place, as it is already the case in several Countries, this reduction would imply a cost reduction for the national entity responsible for GHG emissions, that would otherwise be obliged to purchase certificates to cover such emissions.
As anticipated, a key prerequisite for peak demand shaving is the introduction of differentiated tariff by Time-of-Use, with higher price for peak hours. Considering KSA peculiarities, with very high level of average unit consumption for residential users (22 MWh, as reported in Chapter 4), this differentiation should be applied to this customer segment as well. However, considering that in past years residential customers have been traditionally protected from by price variations by the government, tariff differentiation for peak and off-peak hours could be applied eventually maintaining the average price aligned to current levels.
With respect to cost components of Smart Meters, the following items have been considered in the development of the Business Case:
Smart Metering Costs - Capex, including the procurement of equipment and systems and the related installation within the network, at each layer
o Meter layer:
Procurement of modular meters and procurement of communication modules or costs of meters integrated with communication modules (depending on type of meter – single phase or three phase and on the type of communication module used – GPRS/ mobile data and PLC);
We recommend the integrated modem because of the lower costs. Nevertheless in the future, in the case of switch or change of communication means, the Minimum Functional Requirements considers a port to connect to an external modem.
Costs of installation of new meters;
Gateway to the Home Area Network (but not appliances or building demand systems)
Depreciation (of meters and other assets) – added back to the investment value not yet depreciated at the end of considered timeframe, for calculation of the residual value;
o Intermediate layer:
Cost of concentrators and balancing meters;
Costs of modems and couplers;

FINAL REPORT B3006974
Page 91
Costs of installation of concentrators, balancing meters and other assets;
Depreciation of assets – added back to the investment value not yet depreciated at the end of considered timeframe, for calculation of the residual value;
o Application layer:
Cost of development, testing and implementation of the AMI central application;
Integration with external systems (interfaces);
Procurement and installation of computer equipment (servers, disk spaces, cost of data back-up, etc.) and licenses;
Depreciation of assets – added back to the investment value not yet depreciated at the end of considered timeframe, for calculation of the residual value;
Smart Metering Costs - Opex, including cost of maintenance and operations of Smart Metering System (including data traffic costs) and equipment, such as:
o Project costs – mainly costs for training relevant personnel, costs for the management and provision of resources (both FTEs engaged in the project and additional costs such as travel), costs for professional services;
o Communication/connectivity costs – costs of connectivity generated by each type of meter and concentrator (data traffic);
o Consumed energy costs – the cost of energy consumed by the measuring system (by meter layer, by intermediate or concentrator layer);
o Costs of service, maintenance and development – costs for replacing damaged meters, servicing and repairing meters, replacing damaged communication modules, servicing and repairing communication modules, manual meter reading (for defective Smart Meters), servicing and repairs of concentrators and communication lines, maintenance of telecommunication infrastructure, AMI application maintenance and maintaining licenses,
Employment costs – labour costs associated with maintenance of the intermediate layer, application, verification of event alerts, and so on.
6.3.2 Direct Benefit Assumptions [SM]
Specifically, the following assumptions have been formulated on direct benefits:
Reduced operating costs.
o Meter reading costs: The average cost of a single reading (per meter per year) has been assumed equal to around 3 SAR, considering average labour costs of 5,000 SAR/month and 3,200 employees dedicated to reading all the meters in place 12 times per year28, with an average productivity of 85 readings per day. Such costs will be progressively avoided through the massive implementation of
28
Source: interviews with SEC

FINAL REPORT B3006974
Page 92
Smart Metering, freeing up resources that can be allocated to other activities (e.g. Meter installation in the first phase, with appropriate training programmes, then other customers oriented activities that will be created by a market unbundling process).
This benefit item is worth 584 million SAR yearly at the end of the analysed period (15th year);
o Meter management costs: The current number of connection / disconnection has been assumed equal to 350,000/year29, while the average number of connection / disconnection per FTE per day has been assumed equal to 10. This cost, growing in line with customer growth, will be progressively avoided through the massive implementation of Smart Metering, freeing up resources that can be allocated to other activities.
This benefit item is worth 18 million SAR yearly at the end of the analysed period (15th year);
o Restoration costs. The reduction in restoration cost, due to faster reduction of time needed to identify the location of a failure, has been assumed calculating the overall amount of hours spent with unplanned system interruptions/year, as a result of SAIDI (2011 level equal to 205 minutes/customer30) multiplied by SAIFI (2011 level equal to 4.4 interruption/customer31) and number of customers, assuming a 10% potential reduction of time needed, with a progressive learning curve linked to Smart Metering implementation.
This benefit item is worth 35 million SAR yearly at the end of the analysed period (12th year).
Improved network losses. The achievable decrease of non-technical losses for low-voltage lines has been assumed equal to -40%, considering that international experiences provide even higher results, due to Smart Metering infrastructure and the possibility to measure the energy balance at each delivery point. Linked to this reduction, it has been also considered the indirect benefits on technical losses due to less energy distributed through the system, and reduction of the energy consumed by the measurement system. However, the consequent reduction of technical losses is assumed as very low and equal to a peak of -1.2% of the overall technical losses.
This benefit item is overall significant and worth 1.3 billion SAR yearly at the end of the analysed period (15th year).
Improved meter threshold. Revenue increase due to the improved meter threshold (minimum energy that can be metered) has been calculated assuming an annual volume of energy not registered in current traditional meters equal to 0.02 MWh, according to international references, at the electricity tariffs of KSA, and an average inductive meter power of 4 watts against 2.7 watts for smart meters.
This benefit item is worth 120 million SAR yearly at the end of the analysed period (15th year);
29
Source: interviews with SEC 30
Source: ECRA 31
Source: ECRA

FINAL REPORT B3006974
Page 93
Avoided replacement of traditional meters. The reduction of costs for replacement and installation of traditional meters have been calculated assuming 75 SAR as cost for an inductive 3 phase meter, with a lifecycle of 24 years and 50 SAR as cost per installation, in terms of effort of the workforce.
This benefit item is worth 118 million SAR yearly at the end of the analysed period (15th year);
6.3.3 Indirect Benefit Assumptions [SM]
With respect to indirect benefits, they reflect, as anticipated, the underlying assumption that that Demand Response Programmes are introduced to all customers, especially residential, in the form of ToU differentiated tariffs, with higher price for peak hours against off-peak hours. In this case a potential for peak demand shaving may vary between -5% and -15%, according to international experiences. However, considering the low level of electricity tariffs in KSA, the Business Case considers the -5% assumption of peak demand shaving. Linked to peak demand shaving, the following assumptions have been formulated on indirect benefits:
Reduced generation cost. Lower costs have been assumed considering a reduction of -5% (assumption on peak demand shaving), with a progressive learning curve, on the new installation of power capacity needed yearly (3-4GW32), considering 85% of utilization and a capex for HFO plants of 4 billion SAR / GW33. On the same avoided installed capacity, it has been assumed savings on operations and maintenance costs equal to 0.017 SAR/KWh.
This benefit item is very significant and worth 1.8 billion SAR yearly at the end of the analysed period (15th year);
Reduced T&D costs. Lower costs not incurred for the avoided construction and operations of extensions of the electrical grids due to reduced peak demand have been assumed considering 1.5 billion SAR of T&D capex per GW of power capacity34, and 7,262 SAR/CKM of distribution operations and maintenance costs and 22,629 SAR/CKM of transmission operations and maintenance costs35 applied respectively to saved distribution and transmission lines in line with peak demand shaving.
This benefit item is very significant and worth 1.1 billion SAR yearly at the end of the analysed period (15th year);
Increased fuel availability. The reduced fuel consumption has been assumed considering, on the reduced HFO power capacity calculated as previously highlighted, an amount of fuel needed to produce one MWh of energy equal to 7.94 MBTU/MWh, based on an industry average, a barrel Oil Price of 396 SAR in 2012, growing at 0.3%36 per year, and an MBTU per Barrel of 5.5 based on industry average.
32
Source: ECRA-DSM Study, 2011 33
Source: Jeddah South example 34
Source: Previous project experiences in KSA 35
Source: SEC Annual Report 2011 36
Source: Worldbank Commodity Forecast Sept 2012

FINAL REPORT B3006974
Page 94
This benefit item is very significant and worth 17.1 billion SAR yearly at the end of the analysed period (15th year), as a result of 29 TWh of production, sold on the international market at a price of 592 million SAR per TWh;
Reduced GHG emissions. This benefit has been assumed considering a CO2 price of 37 SAR per tonne, based on industry average, growing yearly at 16% up to 2020 and then to 5%37, and an emission rate of 0.635 tonnes of CO2 per MWh (average between gas and oil), avoided on the capacity not needed due to peak demand shaving, as previously calculated.
This benefit item is very significant and worth 2.5 billion SAR yearly at the end of the analysed period (15th year).
6.3.4 Capex and Opex costs [SM]
With respect to capital expenditures for the massive implementation of Smart Metering, the following assumptions have been considered, with respect to each layer:
Meter layer:
o Implementation pace. For the massive implementation of Smart Metering to all customers, including residential, an implementation pace of 7 years has been considered, in line with indications provided by SEC38 with respect to massive roll-out to commercial and residential customers (2014-2021), and therefore reflecting the underlying organizational and human resource efforts. Moreover, this timeframe is consistent with massive programmes in other Countries (although higher implementation volumes have been achieved)
o Procurement of modular meters and of communication modules. For the estimation of such components, it has been considered three-phase smart meters (as the current meters installed in KSA) are equipped with specific communication modules.
As communication standards, it has been assumed a general model based on a mix of PLC (with a middleware) and GPRS (or UMTS / LTE when available, without middleware) modules, considering current projects in place, level of availability and applicability in KSA.
Additional details are available at Annex I.
Specifically:
PLC modules will require lower capex and opex, but will not ensure 100% reachability, being applicable for LV meters under the same transformers. It has been assumed that such modules will be applied to 90% of residential customers and 20% of commercial customers and that the price for smart meters with the related PLC module is equal to 475 SAR according to industry standards shared with KSA major stakeholders. (The price considered is an average for three phase direct meter at the exchange rate of 4.75 €/SAR. The international prices range from 78€ to 130 €). A key prerequisite for this
37
Source: A.T. Kearney study on CO2 trading schemes 38
Source: “Strategic Plan for Deployment of Smart Meters”, SEC, 15.02.2012

FINAL REPORT B3006974
Page 95
module will be the frequency usage exclusive assignment, that will need to be ensured. In some cases, local Bus might be used as an alternative to PLC for aggregated customers, with meters in the same Cabinet (e.g. collective buildings).
GPRS modules (and then UMTS/LTE when available) will generate higher data costs and will require a proper coverage of the public network infrastructure, but will need for only HV and MV meters and Data Concentrators, isolated sites, and when PLC not available. It has been assumed that such modules will be applicable to remaining 10% of residential customers, 80 % of commercial customers and 100% of others, and that the price for smart meters with related modules is equal to 690 SAR, according to industry standards shared with KSA major stakeholders. A key prerequisite for this module will be the public infrastructure availability and capability. WIFI/LAN might represent an alternative to GPRS if available in the future (see Annex I for the analysis of alternative communications options).
For both types of meters, a lifecycle of 12 years has been considered, according to industry standards shared with KSA major stakeholders. Moreover, all meters have been assumed to be equipped with home displays, for the provisioning of Demand Response Programmes and, prospectively, of home automation services, with a price assumed equal to 150 SAR (for in Home Display), according to industry standards shared with KSA major stakeholders.
The extent of participation and willingness of customers to engage with the above technologies will need to be assessed specifically in the piloting phase.
o Costs of installation of new meters. These have been calculated considering 2 FTEs required for each meter installed and a number of 8 meters installed per FTE per day, according to industry standards shared with KSA major stakeholders.
In summary, total capex related to the smart meter layer is 9.8 billion SAR over the analysed period (15 years).
Intermediate layer, including cost of concentrators and balancing meters, modems and couplers, and installation costs.
o This cost item has been calculated assuming the installation of a balancing meter on each distribution transformer and on each MV/HV substation and a number of 20 PLC meters managed by each data concentrator. Data Concentrators are supposed to mainly communicate via GPRS (and UMTS/LTE when acquired) with 98% share and residual 2% via PLC. The price for balancing meters (including communication module) has been assumed equal to 1,000 SAR, for distribution transformer, and 4,800 SAR for MV/HV substation, according to international experiences shared with KSA major stakeholders. Moreover, the installation costs have been calculated assuming 2 FTEs required for each balancing meter / data concentrator installation and a number of 3 balancing meters / data concentrators installed per FTE per day.
FINAL REPORT B3006974
Page 96
o In summary, total capex related to the intermediate layer is 2.0 billion SAR over the analysed period (15 years).
Application layer. This capital expenditure component has been calculated assuming, based on international experiences shared with KSA major stakeholders:
o Cost of development, testing and implementation of the AMI central application equal to around 70 million SAR, including the cost of implementation of customer web portal;
o Cost of integration with external systems (interfaces) of T&D operators equal to around 40 million SAR;
o Procurement and installation of computer equipment (servers, disk spaces, cost of data back-up, etc.) and licenses, equal to 4 million SAR per million customers;
o For application layer equipment and software a depreciation period of 5 years has been considered, therefore they are recurring after this time frame.
In summary, total capex related to the application layer are worth 463 million SAR over the analysed period (15 years).
Finally, with respect to operating expenditures for the massive implementation of Smart Metering, the following assumptions have been considered
Project costs (training relevant personnel, costs for the management and provision of resources, costs of professional services) varies from 16 million SAR in the peak implementation years to 2 million SAR in the last year of the analysed period (15 years), according to international experiences;
Communication/connectivity costs, calculated assuming a flat cost per SIM within each smart and balancing meter with data mobile connectivity (as previously identified) equal to 50 SAR per year. This cost is based on international prices and is considered significantly higher than current data traffic cost of local operator (STC), that would suggest a price of 10-20 SAR yearly per SIM, without considering the potential savings due to higher volumes / number of users. However, it has been assumed prudentially a higher level of cost, to take into consideration potential needed to upgrade TLC networks to provide the proper level of service and network coverage;
This cost item is worth 128 mln SAR yearly at the end of the analysed period (15th year).
Consumed energy costs of the measuring system. This cost item has been calculated considering an average consumption of 2.5W per year for smart meters and 40 W per year for data concentrator, according to international experiences, shared with KSA major stakeholders, supplied at the energy wholesale price, calculated assuming a 20% supply margin on electricity tariff;
This cost item is worth 124 mln SAR yearly at the end of the analysed period (15th year).
Costs of service, maintenance and development (including employment costs). These cost items, that are limited in terms of amount, are calculated according to international experiences, with specific sizing indicators taking into account the number of smart meters to be progressively rolled out.
The value of such cost items is assumed equal to 33 million SAR yearly at the end of the analysed period (15th year).

FINAL REPORT B3006974
Page 97
In line with Smart Grids, the Business Case for Smart Meters have been developed using the above mentioned assumptions into a Discounted Cash Flow (DCF) model, with final results presented as a net present value (NPV) of cash-flows for a period of 15 years, assuming a discount rate of 7.5 percent. Moreover, the Business Case has been assessed considering rising costs needed to build and operate from greenfield the proposed solutions.
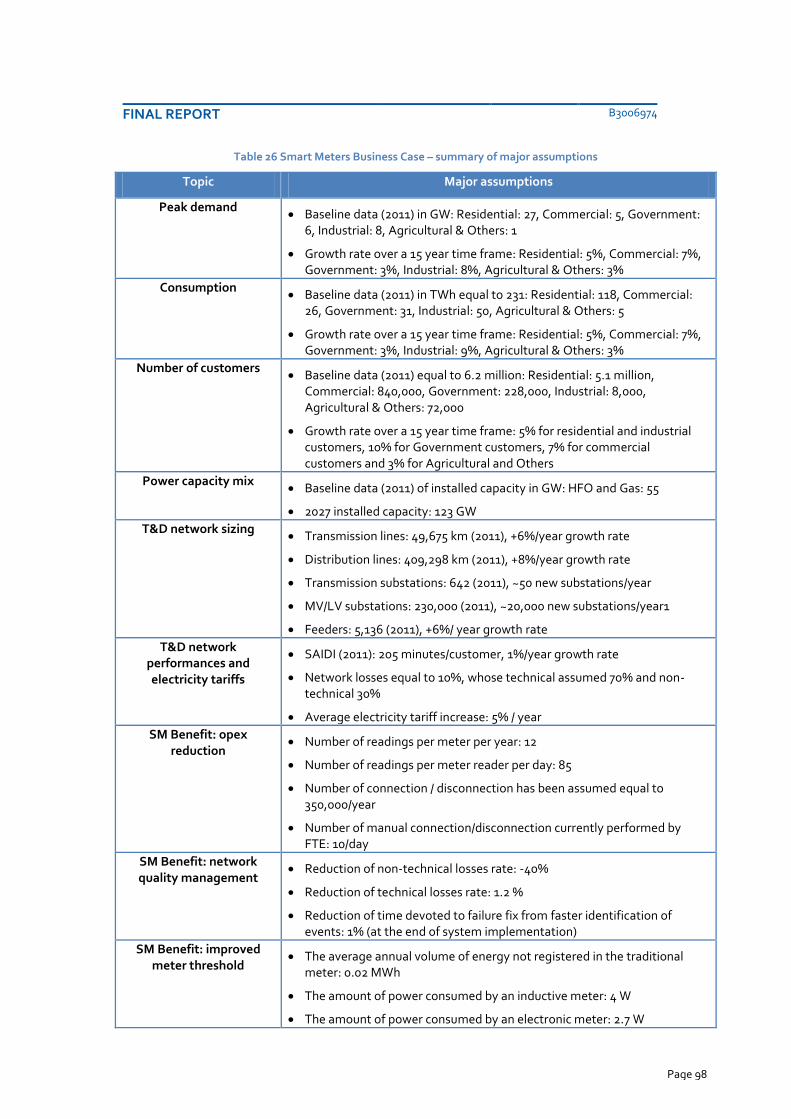
FINAL REPORT B3006974
Page 98
Table 26 Smart Meters Business Case – summary of major assumptions
Topic Major assumptions
Peak demand Baseline data (2011) in GW: Residential: 27, Commercial: 5, Government:
6, Industrial: 8, Agricultural & Others: 1
Growth rate over a 15 year time frame: Residential: 5%, Commercial: 7%, Government: 3%, Industrial: 8%, Agricultural & Others: 3%
Consumption Baseline data (2011) in TWh equal to 231: Residential: 118, Commercial:
26, Government: 31, Industrial: 50, Agricultural & Others: 5
Growth rate over a 15 year time frame: Residential: 5%, Commercial: 7%, Government: 3%, Industrial: 9%, Agricultural & Others: 3%
Number of customers Baseline data (2011) equal to 6.2 million: Residential: 5.1 million,
Commercial: 840,000, Government: 228,000, Industrial: 8,000, Agricultural & Others: 72,000
Growth rate over a 15 year time frame: 5% for residential and industrial customers, 10% for Government customers, 7% for commercial customers and 3% for Agricultural and Others
Power capacity mix Baseline data (2011) of installed capacity in GW: HFO and Gas: 55
2027 installed capacity: 123 GW
T&D network sizing Transmission lines: 49,675 km (2011), +6%/year growth rate
Distribution lines: 409,298 km (2011), +8%/year growth rate
Transmission substations: 642 (2011), ~50 new substations/year
MV/LV substations: 230,000 (2011), ~20,000 new substations/year1
Feeders: 5,136 (2011), +6%/ year growth rate
T&D network performances and electricity tariffs
SAIDI (2011): 205 minutes/customer, 1%/year growth rate
Network losses equal to 10%, whose technical assumed 70% and non-technical 30%
Average electricity tariff increase: 5% / year
SM Benefit: opex reduction
Number of readings per meter per year: 12
Number of readings per meter reader per day: 85
Number of connection / disconnection has been assumed equal to 350,000/year
Number of manual connection/disconnection currently performed by FTE: 10/day
SM Benefit: network quality management
Reduction of non-technical losses rate: -40%
Reduction of technical losses rate: 1.2 %
Reduction of time devoted to failure fix from faster identification of events: 1% (at the end of system implementation)
SM Benefit: improved meter threshold
The average annual volume of energy not registered in the traditional meter: 0.02 MWh
The amount of power consumed by an inductive meter: 4 W
The amount of power consumed by an electronic meter: 2.7 W
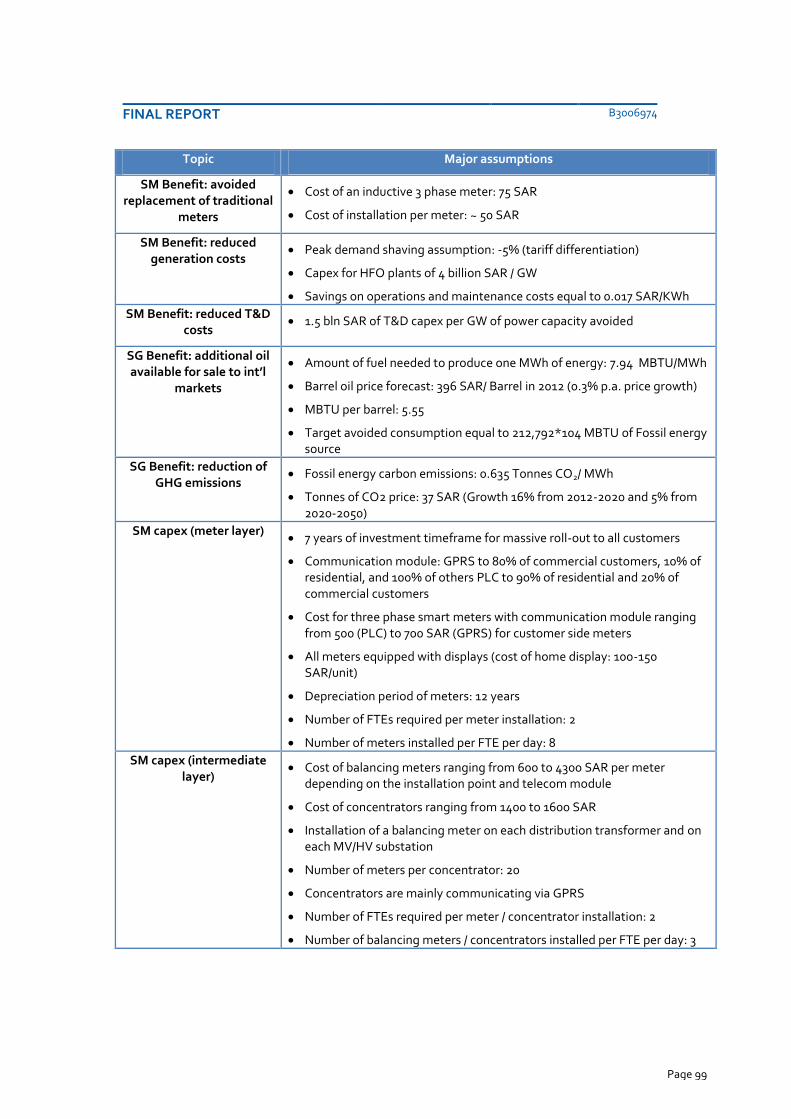
FINAL REPORT B3006974
Page 99
Topic Major assumptions
SM Benefit: avoided replacement of traditional
meters
Cost of an inductive 3 phase meter: 75 SAR
Cost of installation per meter: ~ 50 SAR
SM Benefit: reduced generation costs
Peak demand shaving assumption: -5% (tariff differentiation)
Capex for HFO plants of 4 billion SAR / GW
Savings on operations and maintenance costs equal to 0.017 SAR/KWh
SM Benefit: reduced T&D costs
1.5 bln SAR of T&D capex per GW of power capacity avoided
SG Benefit: additional oil available for sale to int’l
markets
Amount of fuel needed to produce one MWh of energy: 7.94 MBTU/MWh
Barrel oil price forecast: 396 SAR/ Barrel in 2012 (0.3% p.a. price growth)
MBTU per barrel: 5.55
Target avoided consumption equal to 212,792*104 MBTU of Fossil energy source
SG Benefit: reduction of GHG emissions
Fossil energy carbon emissions: 0.635 Tonnes CO2/ MWh
Tonnes of CO2 price: 37 SAR (Growth 16% from 2012-2020 and 5% from 2020-2050)
SM capex (meter layer) 7 years of investment timeframe for massive roll-out to all customers
Communication module: GPRS to 80% of commercial customers, 10% of residential, and 100% of others PLC to 90% of residential and 20% of commercial customers
Cost for three phase smart meters with communication module ranging from 500 (PLC) to 700 SAR (GPRS) for customer side meters
All meters equipped with displays (cost of home display: 100-150 SAR/unit)
Depreciation period of meters: 12 years
Number of FTEs required per meter installation: 2
Number of meters installed per FTE per day: 8
SM capex (intermediate layer)
Cost of balancing meters ranging from 600 to 4300 SAR per meter depending on the installation point and telecom module
Cost of concentrators ranging from 1400 to 1600 SAR
Installation of a balancing meter on each distribution transformer and on each MV/HV substation
Number of meters per concentrator: 20
Concentrators are mainly communicating via GPRS
Number of FTEs required per meter / concentrator installation: 2
Number of balancing meters / concentrators installed per FTE per day: 3

FINAL REPORT B3006974
Page 100
Topic Major assumptions
SM capex (application layer)
Cost of development and implementation of AMI application: ~70 million SAR
Integration cost of AMI with external systems (including implementation cost of customer web portal): ~40 million SAR
Cost of hardware equipment needed for 1 million customers: ~4 million SAR
Depreciation period of application layer equipment and software : 5 years
Distribution opex Project costs (training relevant personnel, costs for the management and
provision of resources, costs for professional services) variable from 16 mln SAR in the peak implementation years to 5 mln SAR in the last year of analysed period
Communication/connectivity costs: flat cost per SIM equal to 50 SAR per year.
Average consumption of 2.5W per year for smart meters and 40 W per year for data concentrator;
6.3.5 Base Case Results [SM]
Based on the above described assumptions, the base case Business Case analysis on Smart Meters in KSA shows a positive value, considering costs and direct benefits.
Specifically, over a 15-year time frame, the cumulated NPV for a massive roll-out of Smart Meters is equal to 1.6 billion SAR, composed as follows:
Costs show a negative NPV of 7.5 billion SAR (around 14.9 billion SAR in total, not discounted), that reflects total capex of 12.3 billion SAR to install Smart Meters massively and 2.6 billion SAR of operating costs to operate and maintain equipment and systems
Benefits show an overall positive NPV of 9.2 billion SAR , of which:
o 2.5 billion SAR, related to reduced operating costs, through remote meter reading and management
o 5.5 billion SAR, the greatest component, mainly driven by reduction of non-technical losses
o residual 465 million SAR and 686 million SAR related respectively to improved minimum metering threshold and avoided replacement of old meters.
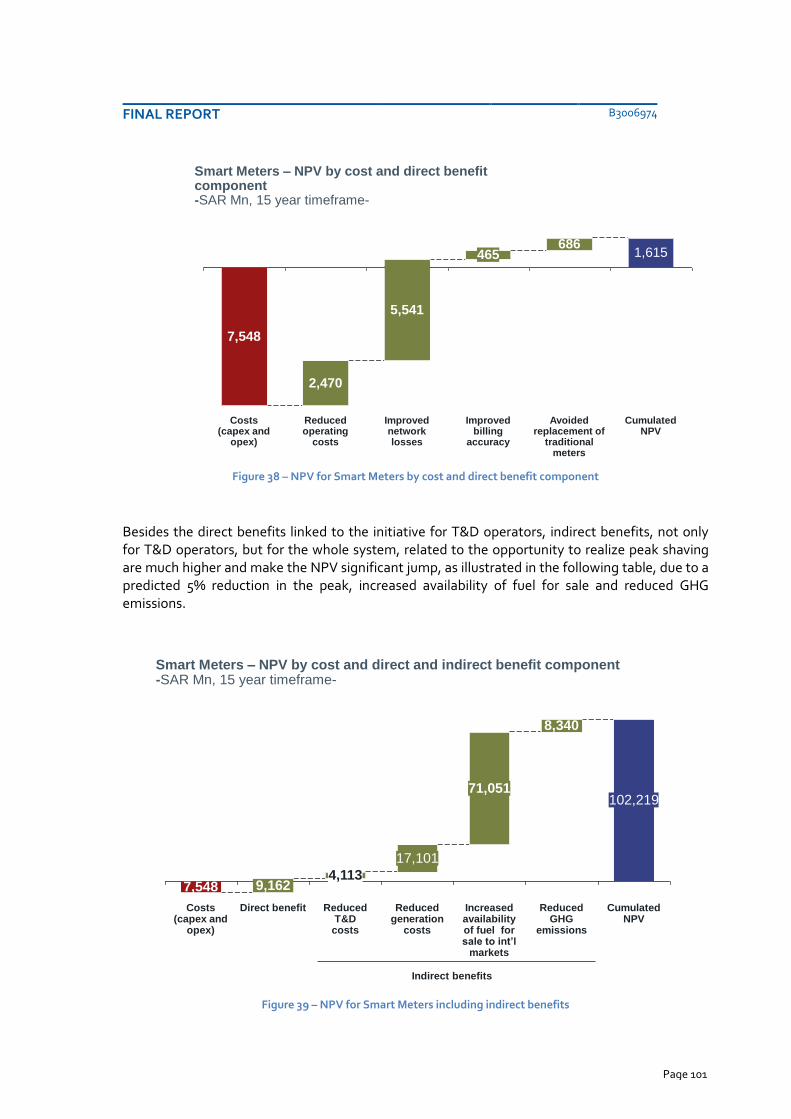
FINAL REPORT B3006974
Page 101
Figure 38 – NPV for Smart Meters by cost and direct benefit component
Besides the direct benefits linked to the initiative for T&D operators, indirect benefits, not only for T&D operators, but for the whole system, related to the opportunity to realize peak shaving are much higher and make the NPV significant jump, as illustrated in the following table, due to a predicted 5% reduction in the peak, increased availability of fuel for sale and reduced GHG emissions.
Figure 39 – NPV for Smart Meters including indirect benefits
-
Smart Meters – NPV by cost and direct benefit component-SAR Mn, 15 year timeframe-
Cumulated NPV
1,615
Avoided replacement of
traditional meters
686
Improved billing
accuracy
465
Improved network losses
5,541
Reduced operating
costs
2,470
Costs (capex and
opex)
7,548
Smart Meters– Business Case Results
-
Smart Meters – NPV by cost and direct and indirect benefit component-SAR Mn, 15 year timeframe-
Cumulated NPV
102,219
Reduced GHG
emissions
8,340
Increased availability of fuel for sale to int’l
markets
71,051
Reduced generation
costs
17,101
Reduced T&D
costs
4,113
Direct benefit
9,162
Costs (capex and
opex)
7,548
Smart Meters – Business Case Results
Indirect benefits

FINAL REPORT B3006974
Page 102
Even in this case, the high level of benefits for the whole electricity system will have to be taken into account when defining the financing scheme for Smart Meters, as explained in following Chapter 8.
6.3.6 Sensitivity Analysis [SM]
Sensitivity analyses have been conducted for the Business Case of Smart Meters in order to test the elasticity on NPV positive results for different values of major assumptions. Since, as highlighted in the previous section, the level of indirect benefits is very high and have a different scale compared to cost and direct benefits of such solutions, they have not been considered in sensitivity analyses (they would be anyhow significantly higher).
Sensitivity analyses have been performed on the following major cost and direct benefit components, such as:
Change of Smart Meters capex (cost components)
Change of Smart Meters opex
Level of operating cost reduction, driven by automated meter readings, disconnections and outage management
Level of reduction of non-technical losses
Specifically, from the sensitivity analysis on these factors it emerges that:
A different estimate of Smart Meter capex (due to precise technical evaluations in planning phase, different realizable prices, shorter lifecycle, etc…) can affect significantly NPV. Particularly, an increase by 10% on 12.3 Bln SAR assumed, might affect NPV by 50% (around 800 million SAR). Therefore, it will be extremely important in further Smart Meters pilots to test and fine tune technical specifications and functionalities and related costs;
With respect to Smart Metering systems opex, whose main component is represented by communication cost, as previously highlighted, the level on NPV sensitivity is much lower. A change in such level of costs by -30%/+30% would affect Smart Metering NPV by around +/-25%. Therefore, even an increase of communication costs, due to different conditions or technologies than assumed would not make negative profitability;
Level of operating cost reduction driven by automated meter reading is very sensitive for the positive results of Smart Meters programme NPV. The calculation of such cost is linked, in the base case, to a productivity ratio (number of meters read per FTE per day) of 85 (meaning almost 11 meters read per hour). Assuming a lower level of 55, the NPV would increase by 1.7 times (1.1 bln SAR) and a higher level of (current) meter reading productivity of 115 reads per day would generate an NPV of 1 bln SAR;
Level of reduction of non-technical losses is key to NPV sustainability. Considering a level of reduction equal to -30% (against the level of 40% reported in the base case) the NPV would become slightly higher than zero (+228 million SAR). However, the level considered in the base case is confidently achievable, according to Smart Metering embedded functionalities and a level of losses in KSA.

FINAL REPORT B3006974
Page 103
Figure 40 – Smart Meters – Sensitivity analyses
As described in following Chapter 8, acquiring and monitoring results achieved with pilots on Smart Meters in KSA will be key to properly verify the level of cost and benefits, maximizing opportunities and eventually launch other supporting actions at system level, considering the very high level of indirect benefits.
Moreover, considering simultaneously worst and best case on the 3 drivers analysed, is possible to derive an aggregated worst and best case for Smart Grids solutions, with an NPV equal respectively to 235 million SAR and 3,614 Mln SAR against the Best Case (2,189 million SAR). Such cases are anyhow presented just for completeness, being the Best Case the more confident scenario39, with acceptable variance potentially on specific drivers, but not simultaneously on all analysed ones.
39
A sensitivity analysis considering a different discount rate ±3% does not cause a material change to the results.
-
Smart Meters – Sensitivity analyses
Smart Meters – Business Case Results
Cost /
Benefit
component
Business Case NPV for driver
value
Sensitized
Driver
8652,3641,615
NPV1
Driver
values
WORST CASE BASE CASE BEST CASE
13.5 12.3 11.0
1. Mln SAR; considering only direct benefits
1,2292,0011,615
NPV1
Driver
values
WORST CASE BASE CASE BEST CASE
3.4 2.6 1.8
Smart Meter
capex (cost)
Smart Meter opex
(cost)
Smart Meter total
capex (Bln SAR, 15
years)
Smart Meter total
opex (Bln SAR, 15
years)
2,7561,6151,027
NPV1
Driver
values
WORST CASE BASE CASE BEST CASE
115 85 55
228
2,9981,615
NPV1
Driver
values
WORST CASE BASE CASE BEST CASE
-30% -40% -50%
Reduced
operating costs
(benefit)
Improved
network losses
(benefit)
Number of traditional
meters read per FTE
per day
Reduction of non
technical losses

FINAL REPORT B3006974
Page 104
Figure 41 – Smart Meters – Aggregated Base, Worst and Best Case
-
Smart Meters – Business Case Results
Smart Meters – Sensitivity analyses-SAR Mn, NPV over 15 year timeframe-
Best Case
3,614
Base Case
2,189
Worst Case
235

FINAL REPORT B3006974
Page 105
7 CUSTOMER MANAGEMENT IMPLICATIONS
Electricity final customers will be dramatically affected by the development of Smart Meters and Smart Grids programmes in KSA, since they will be enjoying significant benefits on one side, but will be also required to overcome some cultural and social barriers that such programmes are typically faced with.
With respect to the benefits, customers will enjoy:
Improved network quality and reliability;
Innovative tariff systems (differentiated by hours);
Opportunity for reduction of energy consumption and, therefore, for savings in electricity expenditure (even if tariffs in KSA are, as now, are very low);
Reduction of cost and delay of interventions (connection/disconnections);
More accurate meter reading and billing;
Prospective opportunity for more advanced and value-added services (e.g. home information and automation).
In order to support the achievements of wider benefits from Smart Meters for the whole system, in terms of peak demand shaving, it is recommended to update electricity tariffs differentiating them by hourly profile, also since residential customers, with their consumption patterns, are significantly affecting the demand profile. Changes in consumption behaviours in the direction of an increased energy awareness, enabled by Time-of-Use differentiated tariffs with higher prices at peak time (eventually maintaining average prices aligned with actual ones), will be necessary to achieve such objectives.
Moreover, the development of Smart Grids and Smart Metering solutions will create the opportunity to provide new “smart” applications (e.g. smart appliances, home automation, smart thermostat, Direct Load Control,), as soon as they will become technologically stable and mature.
However, social acceptance is one of the most important success factors especially for the Smart Metering programme, and should be nurtured from the beginning of the implementation process, in order to avoid the risks of a ‘backlash’ which in turn may cause delays, increase implementation costs and not realize the full programme benefits.
Typical customer concerns on Smart Metering include:
Fears of increase of prices due to more precise consumption measurement, acquisition of consumption profiles and more advanced technology;
Fears of unauthorized access to data on power consumption and perception of personal privacy violation, with data on power consumption used by third parties (e.g. for commercial / marketing purposes)
In order to address such issues, detailed social acceptance campaigns will need to be put in place for all stages of the roll out by relevant stakeholders, starting with an early awareness phase (including education of employees, opinion leaders, and customers prior to investments), through the initial installation phase (media coverage), web portal access, and so on.
The general message to be conveyed is that in the long run, benefits from the new technology will far outweigh the cost, focusing specifically on the solutions the programme has to offer
FINAL REPORT B3006974
Page 106
customers in real-time, including meaningful data on prices and consumption that would allow them to make optimal decisions on energy usage.
7.1 Customers Participation and Government Commitment
One of the main drivers and challenges in the implementation of the Smart Meters is the engagement of customers in all classes: residential, commercial, government and industrial. They are all important players in the analysis and their participation is essential. Since the cost-benefit relies on this participation in Demand Side Management and because of their actions, the entire system and overall customers will be the beneficiaries.
As we observed in this report, one of the important benefits in the analysis performed comes from the curtailing of peak demand and in enabling customers to better manage their electricity costs and demand. The roll-out of smart meters will help to reduce peak demand in two ways:
through smart meters’ enhanced load management capabilities (e.g. direct load control of heavy usage appliances); and
through time-of-use pricing providing customers with an economic incentive to reduce or shift their electricity usage to less costly periods of the day.
A clear policy is needed from the regulator and government and concrete actions from the stakeholders in order to achieve a significant reduction in peak demand and avoid the need for additional generation and network capacity investment. Detailed recommended actions are proposed in the next chapter of this report.
The main driver and the most important signal is the commitment of all the key government entities related to this programme. It must be clear to all stakeholders, and especially for the customers, that the government of KSA supports the programme to improve the efficiency of the energy sector, and one of the tools chosen and promoted are the Smart Meters. In that sense, the benefits derived from this analysis should be well publicized to all stakeholders.
It must highlighted a necessary condition to go ahead is the adoption of a national policy and a commitment from the government. Otherwise, the program or project will be set back or stalled. The first steps of the program can only be followed once the policy is set and there is explicit support and commitment from the government.
The Dutch case40 demonstrated that mistakes in the preparatory phase have high impact on implementation. The procedure of the Dutch Smart Meter roll-out was quite unstructured. The underlying aims of the roll-out changed numerous times during the discussion. It started with the national aim to improve the demand and response of small customers. Some years later, the aims of the meter were described as providing an opportunity for the energy supplier to offer additional energy services to customers, and to help the Distribution Companies to optimize the network.
In comparison to the Dutch case, the European Union has paid more attention to a coordinated national policy including the European Commissions’ obligation to involve certain representatives of public interest such as customers, environment and labour associations. This is an important source of information and deliberation that otherwise would be lost.
40
The Neglected Customer: The Case of the Smart Meter Rollout in the Netherlands, Robin Hoenkamp, George B. Huitema and Adrienne J.C. de Moor-van Vugt

FINAL REPORT B3006974
Page 107
Making sure the meter benefits the end-user not only serves the interests of the customer, the roll-out also depends on their cooperation. If there is too much resistance the whole process can be delayed. If the involvement of representatives of public interest groups during the process is complicated or even unfeasible, other solutions must be explored.
Finally, considering the international experience, the current conditions of the electricity sector and stakeholder involvement we recommend:
To adopt as a national policy the Smart Meter roll-out and spread the benefits derived.
The commitment of the government is a necessary condition for proper development and legitimacy.
The adoption of the good governance principles41, especially of effectiveness principle42 may offer a good safeguard against customer worries, concerns and inquiries.
Promote the participation of the representative organizations of the Customers in the “Smart Meters and Smart Grids Steering Committee” proposed in section 8.4.
7.2 New Paradigm for Appliances and Customers
As mentioned earlier, the development of Smart Grids and Smart Metering solutions will create the opportunity to provide new “smart” applications (e.g. smart appliances, home automation, smart thermostat, Direct Load Control), as soon as they will become technologically stable and mature.
Figure 42 – Smart buildings applications
41
There are six governance principles: Independence, Openness and transparency, Accountability, Integrity, Clarity of purpose and Effectiveness. “Guide to principles of good governance”, British and Irish Ombudsman Association. 42
Effectiveness Principle: Ensuring that the scheme delivers quality outcomes efficiently and represents good value for money. “Guide to principles of good governance”, British and Irish Ombudsman Association.
-
Customer management implications
New applications - Smart buildings Examples
Gate-way
Gate-way
electricity gas water heat
Household customer Mobile
de-central own generation
Vacation home/ second home
Electro car
Smart Meter
• Smart appliances
• Home automation
• Smart thermostate
• Load control
• …

FINAL REPORT B3006974
Page 108
The use of smart appliances by customers shifts the paradigm for appliances and the customers. In the case of appliances, they will be no longer merely passive devices that drive emissions but active participants in the electricity infrastructure that can be drawn upon for energy reduction, energy storage, and the optimization of the electrical grid for greater compatibility with its greenest energy generation sources. By providing a variable load, smart appliances connected to the smart grid are ideal complements to renewable sources of energy such as wind and solar power, which are inherently variable in supply.
In the case of household customers, they will no longer be merely passive actors that consume energy and accept flat tariff rates but active participants in the electricity infrastructure that take decisions for energy reduction, energy storage, and indirectly with their decisions, optimizing the electrical grid and indirectly adapting the grid for the use of renewable generation sources.
The customers play a key role in reducing peak demand while lowering costs overall. A key feature to implement a Smart Grid is demand response (DR); this refers to a set of scenarios whereby the customer and its appliances reduce energy consumption during peak usage or other critical energy use periods.
Therefore, to turn the customers into active actors it is necessary to give them the proper incentives and control over their smart products. From the customer’s perspective, they perceive three benefits:
Reduction in costs of its energy bill
Keep or improve quality of living
Contribution to social responsibility for the environment
The customer will effectively participate in the energy market (active actor) when incentives and savings perceived are significant (compared to monthly expenses). This perception would lead to change in habits in usage of energy. On the other hand, where tariffs continue to be non-reflective of costs, benefits in demand response and energy reduction are less likely to be realized. Because of this, the development of tariffs is a key issue and requires further study and effective policy.
7.3 Privacy and Security of data
Privacy and a security of the data from the customer’s point of view is another important concern that must be properly addressed.
This concern has been the subject of discussion in many countries, particularly in the United Kingdom, United States and Australia.
The United States passed an Energy Independence and Security Act (EISA) in 2007. The EISA laid out the formal U.S. policy for modernizing the electric grid. The EISA included new energy efficiency standards for appliances and required the adoption of interoperability and functionality standards for the smart grid. The EISA directs the National Institute of Standards and Technology (NIST) to develop interoperability and functionality standards. The standards must address physical security, cyber security, and a common information framework. Once the standards are approved by the Federal Regulator (FERC) they will adopt at national level.
The European Union has also issued direct recommendations about the privacy and security of the data. The European Union published in the Official Journal of the EU, the Commission Recommendations of March 9th of 2012 on preparations for the roll-out of smart metering systems. Some of the most important points of these recommendations are summarized below:
FINAL REPORT B3006974
Page 109
7.3.1 Data protection by design and data protection by default settings
The European Commission strongly encouraged network operators to incorporate data protection by design and data protection by default settings in the deployment of smart grids and smart metering. Data protection by design and data protection by default settings should be incorporated in the methodologies of parties involved in the development of smart grids when personal data are processed.
Data protection by design should be implemented at the legislative level (through legislation that has to be compliant with data protection laws) at the technical level (by setting appropriate requirements in smart grid standards to ensure that infrastructure is fully consistent with the data protection laws) and organizational level (relating to processing).
Data protection by default should be implemented so that the most data protection friendly option is provided to the customer as a default configuration.
7.3.2 Data protection measures
When deciding the range of information allowed for processing within smart grids, the European Union recommended to take all necessary measures to impose, as much as possible, use of data rendered anonymous in such a way that the individual is no longer identifiable. In cases where personal data are to be collected, processed and stored, it should ensure that the data are appropriate and relevant. Data collection should be limited to the minimum necessary for the purposes for which data are processed and data should be kept in a form which permits identification of data subjects for no longer than is necessary for the purposes for which the personal data are processed.
The processing of personal data by third parties offering value-added energy services should also be lawful and based on one or more of the six grounds for legitimate processing listed in Article 7 of Directive 95/46/EC. Where consent is chosen as the ground for processing, the consent of the data subject should be freely given, specific, informed and explicit and be given separately for each value-added service. The data subject should have the right to withdraw his or her consent at any time. The withdrawal of consent should not affect the lawfulness of the processing based on consent before the withdrawal.
It was also recommended to take into account the following principles:
the principle of data minimization,
the principle of transparency — by ensuring that the end customer is informed in a user-friendly and intelligible form using clear and plain language, for the purposes, timing, circumstances, collection, storage and all other processing of personal data, and
The principle of empowerment of the individual — by ensuring that the measures taken to safeguard the individual’s rights.
7.3.3 Data security
Regarding the security, the European Union recommended to ensure that personal data security is designed in at an early stage as part of the architecture of the network, within a data protection by design process. This should encompass measures to protect personal data against accidental or unlawful destruction or accidental loss and to prevent any unlawful forms of processing, in particular any unauthorized disclosure, dissemination, access to or alteration of personal data.
The use of encrypted channels is recommended as it is one of the most effective technical means against misuse.
FINAL REPORT B3006974
Page 110
The European Union recommended that the Member States should take into account that all present and future components of smart grids ensure compliance with all the ‘security-relevant’ standards developed by European standardization organizations. The international security standards should also be taken into account, in particular the ISO/IEC 27000 series (‘ISMS family of standards’).
7.3.4 Information and transparency on smart metering
Regarding the transparency, the European Union recommended that it should be required that network operators develop and publish an accurate and clear information policy for each of their applications.
Where personal data relating to a data subject are collected, the controller should also provide the data subject with at least the following information:
1) the identity and the contact details of the controller and of the controller’s representative and of the data protection officer, if any;
2) the purposes of the processing for which the personal data are intended, including the terms and general conditions and the legitimate interests pursued by the controller;
3) the period for which the personal data will be stored;
4) the right to ask the controller for access to and rectification or erasure of the personal data concerning the data subject or to object to the processing of such personal data;
5) the right to lodge a complaint with the supervisory authority and the contact details of the supervisory authority;
6) the recipients or categories of recipients of the personal data;
7) any further information necessary to guarantee fair processing in respect of the data subject, having regard to the specific circumstances in which the personal data are collected.
In the UK, to alleviate the above concerns and issues of data security and privacy, a separate government sponsored agency will be formed (the DCC, Data Collection Company). This entity will mediate Smart Metering data collection for all companies and allow such data to be available to others in accordance with the UK competitive market arrangements.43
7.3.5 Privacy and data security recommendations
From the above information and international experience in these topics, we recommend in the case of data security and data privacy the following:
To adopt the principle of Transparency. This will mean that drafts of the Minimum Functionality Requirements and other important policies and standards regarding the Smart Meters and Smart Grids must be publicly available for comments. Standards and procedures developed by the Transmission and Distribution company should also be publicly consulted.
43
GB-wide smart meter roll out for the domestic sector, Impact Assessment, 2010

FINAL REPORT B3006974
Page 111
To adopt the principle of Openness. This principle relates to the way in which institutions communicates about their decision-making. A public consultation process should be established.
With regard to evaluating future privacy impacts, establish “privacy by design” to ensure that privacy protection is taken into account at the design stage of products. This also applies to the stage of standardization.
Promote the participation of the customer representatives in the “Smart Meters and Smart Grids Steering Committee” to define the open standards to be used, and specially the functionalities of the meters regarding the privacy and security issues.
The Minimum Functional Requirements proposed in this Consultancy work, should be shared with customer representatives to be commented and after approved following the principles of governance.
To define in the “Smart Meters and Smart Grids Steering Committee” the personal data to be collected and stored, considering the participation of the customer representative.
7.4 Social aspects (special needs customers)
Any policy that causes the most disadvantaged and vulnerable members of society to be even worse off than they already are should be avoided.
In other countries time-of-use pricing has the potential to increase costs, particularly to low income groups. Companies are usually required to put measures in place to avoid this impact. In KSA residential prices are already protected but potential time of use tariffs should be carefully designed. One of the important roles of government is to foster economic efficiency, the rationale use of natural resources and to protect vulnerable members of the society.
Considering the other international experience, we recommend to adopt a clear policy to subsidize only the most vulnerable part of the society and give strong economic signals to the remaining users towards the efficiency through an economic time-of-use tariffs.
7.5 Customer Engagement Actions
Finally, considering the overall topics on customer implications on Smart Grid / Smart Meters, we recommend some minimum actions to be addressed in order to promote and foster the participation of the customers in the new paradigm and the new challenges towards the efficiency of the KSA electricity sector.
• Adopt a national policy regarding Smart Grids and Smart Meters.
This should have the involvement and commitment of the national government;
• Set national targets and goals to be achieved.
Set the targets to be achievable in the medium term regarding the massive roll-out of meters. These targets should be compatible and coordinated with the national targets of renewable energy and generation mix led by KA.CARE and with the energy efficiency targets, at the same time considering organizational capabilities.
• Provide customers the appropriate signals towards efficiency

FINAL REPORT B3006974
Page 112
Promote tariff rates more closely reflecting the real economic value of the service. Together with the tools to more closely monitor energy usage and appropriate price signals this is expected to deliver valuable reductions in the country’s peak electricity demand. The users should be able to choose between the Time of Use Tariffs and flat tariff rates (this must be a voluntary action taken by the user, and can be made an easy remotely managed process using Smart Meters communications functions).
• Adopt a subsidy policy for the low-income customers.
Determine the low-income customers based on the consumption’s pattern. Explicitly subsidize only the low income customers. Bills should provide information on the full cost of service delivered to the clients, and the subsidy offered, in order to create awareness of the true cost of energy use.
• SM/SG Steering Committee to include Customer Groups
The creation of the “Smart Meters and Smart Grids Steering Committee” must include and promote the participation of the customer representatives and/or Customer Protection Associations.
Customer participation surveys
Since the success of the SM/SG implementation roadmap hinges on active participation of customers a comprehensive customer survey should be carried out in the preliminary stages of the project to gauge the level of interest and concerns of customers. The findings of this survey should enable fine tuning of the implementation steps and mitigating measures.
Customer awareness and education campaigns
The Distribution Companies should establish educational campaigns and marketing regarding the forthcoming Smart Meters and Smart Grids implementation, the functions and benefits, new tariff rates and the savings that a user can achieve. These could be targeted at specific customer segments such as house owners, workers, young people, etc.

FINAL REPORT B3006974
Page 113
8 REGULATORY AND POLICY REQUIREMENTS
As discussed in section 6.0 the Business Case analysis shows that Smart Meters and Smart Grids can be profitable when considering direct benefits (utility and network side), and become definitely a “success story” if considering the benefits for the whole energy sector (addressing demand growth, enabling renewable, and reducing domestic consumption of oil).
In order to effectively push the deployment of such technologies and ensure a fair distribution of costs and benefits among stakeholders in the regulatory and policy framework of the electricity sector need to be properly updated, also leveraging lessons learnt from international experiences.
The regulatory and policy framework for Smart Meters and Smart Grids should cover three main areas:
Agreement with stakeholders regarding the implementation approach
Proper financing schemes for such investments
Definition and monitoring of KPIs on implementation progress and results
Figure 43 – Key areas of Regulatory and policy framework for SG and SM
8.1 Implementation approach / policy
With respect to the implementation approach, regulation will have to clearly outline which are the roll-out targets and the models to be followed. These overall steps are discussed here and should be read in conjunction with the more detailed implementation roadmap presented in section 9.0.
As reported in the previous sections of this report, several initiatives for both Smart Meters and Smart Grids are already in place in KSA. Lessons learnt from other Countries outline how regulation plays a key role in turning such “pilot projects” into massive roll-out investment programmes for network operators. For this purpose, it is important to:
Define mandatory timing and targets for Smart Meters and Smart Grids investments. Such targets will have to be consistent with target development of alternative renewable
-
Regulatory and policy requirements
Implementationapproach
Financingscheme
KPI on projectprogress and
results
Key areas of Regulatory and policy framework for SG and SM
• Implementation timing / deadlines
and models
Needed to ensure a proper
deployment in line with electricity
system characteristics, energy
demand increase, and renewable
development
• Coverage of SG and SM
capex and opex
Needed to split benefits
among all stakeholders
and avoid resistances /
lack of commitments
• Definition and monitoring
of KPIs on SG and SM
Needed to monitor project
progress against plan and
benefit capturing
1
23

FINAL REPORT B3006974
Page 114
energies and energy efficiency targets (being realistic considering organizational capabilities).
In the previously described business case, it was assumed an implementation timing of 5-8 years, that is aligned to international best practices and to the roll-out expectations of the Strategic Plan for Smart Meters provided by SEC. As will explain in the next pages, is key to fine tune jointly the target implementation approach with both T&D operators (SEC, Marafiq, …) and also other government bodies active in related fields (KA.CARE for renewables and SEEC for energy efficiency), to maximize synergies with interconnected initiatives
Reflect roll-out targets within the Investment Plans of T&D operators. Smart Meters and Smart Grids roll-out will coordinate with specific investments that T&D operators will have to commit (and partially already committed) in the next years, absorbing significant financial and organizational and operational resources.
The detailed design of such investment programmes, based on KSA network characteristics and available technologies, will have to be made directly by T&D operators, reflecting targets and other guidelines defined by the Regulator, and will have to be reflected in the Investment Plans that they propose periodically to the Regulator and Ministry of Water and Electricity.
The implementation models defined within regulatory and policy frameworks should cover:
Minimum functional requirements, in terms of:
o Performance requirements (e.g. frequency of meter reading and transmission of information, period of data storage, etc., …)
o Networking and Metering functions
o Reporting and information functions (privacy defined)
o Technical properties: security, scalability and standards used
Approach to contracting vendors. It is recommended that T&D operators may have the possibility of diversification with different suppliers, however respecting the general recommendation/obligation of interoperability of systems, and the option to use their own resources and assets to implement parts of the system.
Implementation footprint. Since the deployment of Smart Meters and Smart Grids solutions will take significant time to be completed, it is important to both proceed with the pilots already planned / committed and to define prioritization of areas of deployment, following specific guidelines (e.g. areas with high level of losses, areas with high level of SAIDI and SAIFI, areas with high number of new connections, …).
Moreover, with respect to Smart Meters, in order to realize not only direct benefits, mainly due to cost reduction for meter reading and management and reduction of non-technical losses, but also the significant indirect benefits outlined, electricity tariffs for all customers, especially residential, should be differentiated by peak and off-peak hours, requiring the updated of related legislation.

FINAL REPORT B3006974
Page 115
8.2 Financing schemes
The regulation and policy framework should also define the proper coverage and remuneration for capital and operating expenditures needed to build up and run Smart Meters and Smart Grids solutions.
Since such solutions will become part of the investment programme of T&D operators, first financial coverage will be provided through current electricity tariffs. The analysed Business Cases, based on illustrated assumptions, highlights that profitability of both Smart Meters and Smart Grids is positive considering only direct benefits and therefore seem to be affordable by T&D operators themselves. However, due to variability in costs and predicted benefits some element of government support is recommended (as is the case in most other countries).
The overall sustainability of Smart Meters and Smart Grids solutions against current tariff levels need to be evaluated considering:
The overall level of investments and operating expenses afforded by T&D operators
A proper return on invested capital recognized to T&D operators
In case overall investment programmes of T&D operators (including SG and SM) would be not covered by electricity tariffs and / or a proper return on invested capital would not be reached, the Regulator may decide to:
Increase the level of electricity tariffs
Increase the level of government subsidies to T&D operators, justified by high level of benefits generated by Smart Meters and Smart Grids for the whole system
Besides these considerations, should T&D operators need financial resources to cover the cash flow of Smart Meters and Smart Grids programmes, the Legislator might decide to provide proper facilitation (financing) schemes, as an incentive for deployment programmes.
Moreover, as soon as the electricity market in KSA will be unbundled and liberalized and proper rules for tariff definition among all steps of the electricity value chain (generation, transmission, distribution, supply) will be set, principles should be defined to include Smart Meters and Smart Grids costs in T&D tariffs and to cross-subsidize them for their positive implications for the whole system.
8.3 Defining and monitoring of KPIs on progress and results
In order to properly ensure the achievement of implementation targets for Smart Meters and Smart Grids, as well as to monitor the progressive realization of expected benefits, calling for eventual fine-tuning actions, regulatory framework will need to provide a set of key performance indicators for the T&D operators that can be tracked.
With respect to project implementation, some indicators to be monitored should include both physical and financial values of investments realized and put into operations within the grids, against agreed Plans, such for example:
number of Smart meters installed, eventually by segment and/or geographical area;
number of meters remotely read and managed (planned and actual for each year of the Programme);
number of HV substations automated;
FINAL REPORT B3006974
Page 116
number of automated feeders installed;
number of customers under automated networks, eventually by segment and/or geographical area.
With respect to the achievements of Smart Grids and the Smart Meters direct benefits, indicators to be defined and monitored should include:
reduction of operating costs (such, for example, meter reading and management for Smart Meters and other operations costs for Smart Grids);
reduction of technical losses;
reduction of non-technical losses;
reduction of number and duration of outages.
In case achieved benefits will differ from the initial assumption/predictions, the Business Case for both initiatives would have to be updated. Specific actions in terms of benefits distribution among stakeholders and cross-subsidies will have to be undertaken in case profitability for T&D operators will not be ensured.
Therefore, T&D operators will have to report the following information to the regulator:
Progress on the implementation: update the general implementation schedule (time frame and pace, planned values of the benefits), detailed implementation schedule for next year, analysis and mitigation of risks;
Value of benefits achieved: losses and reading costs
Values of KPIs achieved: levels, reasons for lying below the KPIs (if the case), mitigation measures.
The above regulatory changes should be considered in the performance standards for the transmission and distribution system, which needs to be revised annually based on the results and progress of implementation.
8.4 Pricing Policy
A range of pricing options can reflect actual generation and delivery costs, from static (non-time differentiated) for real-time pricing. The capability to deliver dynamic rather than static pricing is an important benefit of smart grids, but has raised fundamental questions about energy prices, including whether they should reflect real costs in real time, provide customers with choice and eliminate cross-subsidies. Dozens of smart customer pilot projects around the world have shown that time-differentiated pricing can reduce peak demand by at least 5%; adding technology on the customer side of the meter can more than double these impacts44. That research shows a relationship between information and consuming behaviour, with more detailed and more frequent information yielding greater efficiency improvements and peak demand reductions.
Generally, the benefits to be delivered by smart customers who respond to price signals make up a large part of the business case for smart grid deployments. For example, the United Kingdom’s national smart meter roll-out is expected to reduce domestic electricity consumption by 3% and peak demand by 5%, generating almost half of the USD 22 billion annual estimated savings –
44
Demand Response & Energy Efficiency, Ahmad Faruqui, New York, August 2010
FINAL REPORT B3006974
Page 117
providing benefits to both customers and utility stakeholders. Electricity providers in California and elsewhere estimate that demand response and energy efficiency benefits made possible by smart customers will be one-third to one-half of the total benefits from smart grid deployment45.
With flat-rate pricing, common to most retail markets globally, customers are charged the same price for electricity throughout the day and the evening. The result is that customers are overcharged for some electricity (typically at non-peak times) and undercharged for some electricity (typically during peak times). Such pricing does not encourage customers to shift demand to different times, thereby reducing stress on the infrastructure when needed, but does provide a simple cost structure. The other end of the spectrum is real-time pricing (including Critical Peak Pricing), in which electricity is priced based on actual costs of generation, transmission and distribution. There is no overcharging or undercharging for electricity, but customers may not be able to reduce electricity demand during peak times and therefore risk incurring higher costs. A third option for retail customers falls between these two extremes. Time-of-use (TOU) pricing mechanisms take advantage of the general predictability of electricity costs on a daily and seasonal basis. TOU pricing also reduces the risk for customers by providing certainty
In deciding pricing policies for smart grid deployments, we recommend to be considered next:
To adopt as a pricing policy the Time-of-Use tariffs, because they give more certainty to the users, they are known in advance (the user can anticipate and take appropriate measures) and because the multi-tariffs are already approved and implemented in the country in the industrial sector.
The pricing policy should be a mandatory policy for all the users in the industrial, commercial, government and agriculture (as is already the case for KSA)
The pricing policy should be voluntary only for the low-income customers and mandatory for the remaining residential customers (in the final scheme after the customer testing phase).
The regulator should perform a study to determine the best ToU tariffs for the customers of each category, considering the incentives to be given to customers with the aim to obtain the expected Demand Response.
Also as result will be obtained transitional tariffs to be progressively applied to the customers as a measure to help to overcome their inertia and their risk aversion.
The regulator should approve a Pilot Project on "Demand Response" that will be conducted by the Distribution Companies. It should test several differentiations in peak and off-peak prices and determine which scheme delivers the best "demand-response" benefits. The customer's enrolment should be voluntary and must be a proper mix to cover the most important ranges of consumption of each category.
The objective is to know the precise "demand-response" according to the incentive to better design the pricing scheme which encourages customers to shift their demand to different off-peak times.
Transitional policies should be adopted to overcome customer resistance, their inertia and risk aversion.
45
These are estimated benefits usually based on extrapolation of pilot projects to large-scale roll-outs. They include a number of assumptions on market penetration and capacity/energy impacts of pricing and service options.

FINAL REPORT B3006974
Page 118
Transition strategies and policies are especially important considering the opposition by some customer representatives to smart metering deployments and new ToU tariffs to be applied. The results of the pilot Project on Demand Response will give a result of the best differentiated pricing to be finally applied to each category.
The transition strategies to be adopted include:
o customer communications schemes,
o shadow pricing,
o bill protection mechanisms
o transition scheme for applying new tariff rates, from the actual prices to the new ones. The new tariffs will consider the real cost of the service and the proper incentives for peak shifting.

FINAL REPORT B3006974
Page 119
9 IMPLEMENTATION ROADMAP
9.1 Programme Governance
Smart Meters and Smart Grids solutions will directly influence other energy-related initiatives in KSA, such as the development of alternative energies and energy efficiency actions. Hence, an effective governance of the programmes should effectively involve all the relevant electricity market stakeholders, with specific mechanisms and roles.
To this extent, it is recommended to create a “Smart Meters and Smart Grids Steering Committee” (SM/SG SC), involving major electricity stakeholders, responsible for:
Development of a proper Smart Meters and Smart Grids National Plan, following the strategic guidelines of this Study and including the major topics to be regulated for the programmes, as illustrated above, in strong alignment with other energy initiatives as soon as these will be finalized and / or planned (alternative energies, energy efficiency);
Development of proposals for regulatory and legal framework upgrades, in line with the strategic guidelines, to ensure that the legislative background properly fits with Smart Grids and Smart Meters objectives;
Monitoring of implementation progress and benefit achievements for both Smart Grids and Smart Meters programmes, eventually proposing corrective actions in case actual results differ from original plans.
In order to be representative of key energy market stakeholders, the Steering Committee should be chaired by ECRA, as the energy regulatory authority, and composed on a fixed basis also by government bodies and utilities:
The Ministry of Water and Electricity (MOWE)
KA.CARE
SEEC
SEC
National Grid
Marafiq
Aramco
Representative of the customers and/or Customer Protection Associations
Representatives from manufacturing Industry
Representatives from telecommunications industry (including CITC)
Representatives from Academia (Universities and research organisations)
Following the decisions of the Steering Committee, ECRA would maintain the responsibility to issue regulations for Smart Grids and Smart Meters, with the same authorization process as of today.
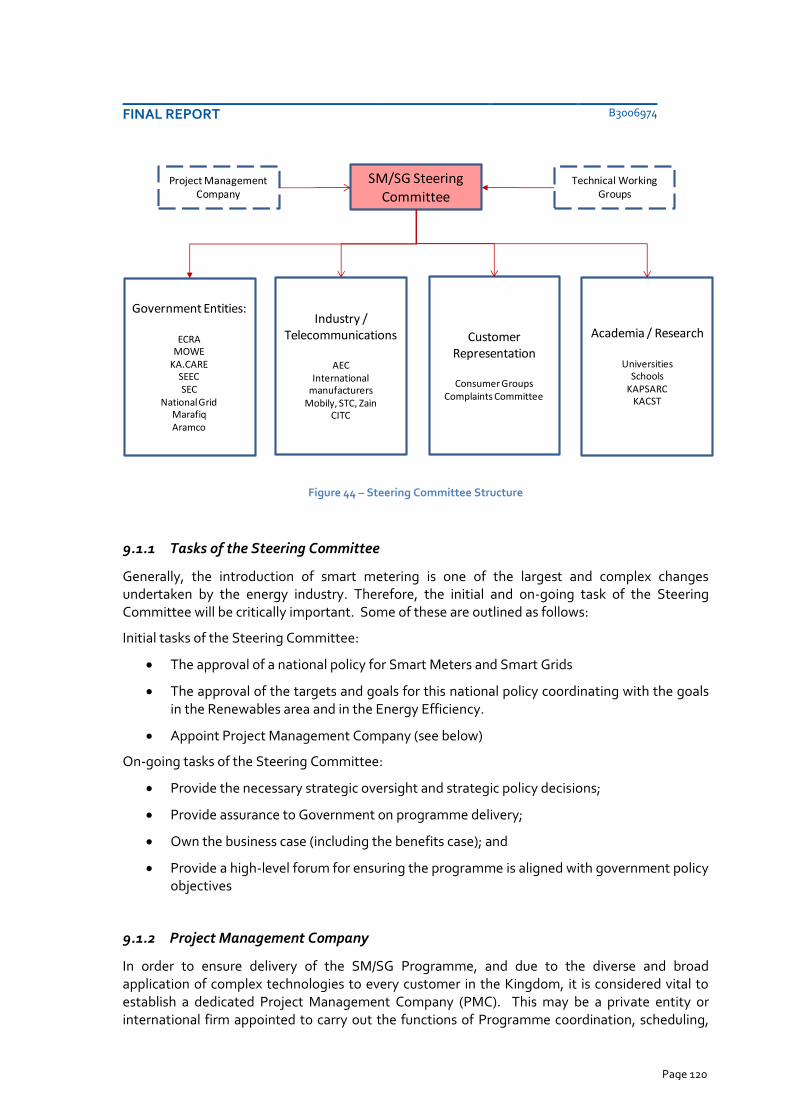
FINAL REPORT B3006974
Page 120
Figure 44 – Steering Committee Structure
9.1.1 Tasks of the Steering Committee
Generally, the introduction of smart metering is one of the largest and complex changes undertaken by the energy industry. Therefore, the initial and on-going task of the Steering Committee will be critically important. Some of these are outlined as follows:
Initial tasks of the Steering Committee:
The approval of a national policy for Smart Meters and Smart Grids
The approval of the targets and goals for this national policy coordinating with the goals in the Renewables area and in the Energy Efficiency.
Appoint Project Management Company (see below)
On-going tasks of the Steering Committee:
Provide the necessary strategic oversight and strategic policy decisions;
Provide assurance to Government on programme delivery;
Own the business case (including the benefits case); and
Provide a high-level forum for ensuring the programme is aligned with government policy objectives
9.1.2 Project Management Company
In order to ensure delivery of the SM/SG Programme, and due to the diverse and broad application of complex technologies to every customer in the Kingdom, it is considered vital to establish a dedicated Project Management Company (PMC). This may be a private entity or international firm appointed to carry out the functions of Programme coordination, scheduling,
SM/SG Steering Committee
Government Entities:
ECRAMOWE
KA.CARESEECSEC
National GridMarafiqAramco
Industry / Telecommunications
AECInternational
manufacturersMobily, STC, Zain
CITC
Customer Representation
Consumer GroupsComplaints Committee
Academia / Research
UniversitiesSchools
KAPSARCKACST
Project Management Company
Technical Working Groups

FINAL REPORT B3006974
Page 121
monitoring and reporting to the Steering Committee, with a service delivery contract including guaranteed timescales.
9.1.3 Technical Working Groups
The Steering Committee should create Technical Groups to further investigate and define solutions in key areas. The initial suggestions for areas that will require specialized Technical Groups are as follows:
(i) Business Case Review
Update of the Business Case, using updated (and localised) cost and benefits estimates;
(ii) Communications Options Plan
Finalise the open standards as recommended, and the framework and functional requirements of the communications infrastructure for the KSA46.
(iii) SM functional requirements / specifications
Finalise Smart Metering functional requirements (based on Annex II of this report) and develop to final specifications
(iv) AMM system functional requirements / specifications
Finalise functional requirements for AMM system and DCUs interfacing/applications and develop to final specifications
(v) Distribution and Transmission Automation
Study of technical options for deployment, forecast network improvements, and investment costs.
(vi) Characterisation of load study
Collection of available data from existing Smart Meters and network load points to carry out load characterisation analysis and support business case calculations
(vii) Smart Grids technologies
Study of developing Smart Grids technologies to determine timeline and extent of deployment (e.g. voltage monitoring and control)
(viii) Tariffs review and energy efficiency
Review of tariffs to determine best options for taking advantage of Smart Metering functions and incentivise customer demand management and energy efficiency.
46
The open standard must consider the key factors like:
Meter Manufacturer’s competition. It is recommended that there must exist at least three different manufacturers with at least a capacity of manufacturing 100,000 meters per year.
Concentrator manufacturer’s competition. It is recommended that there must exist at least three different manufacturers with at least a capacity of manufacturing 10,000 DCU per year.
Fostering the local manufacturers
Do not introduce barriers of entry to international manufacturers
No discrimination

FINAL REPORT B3006974
Page 122
(ix) Regulatory and legal frameworks
Propose regulatory and legal framework update, as highlighted in strategic guidelines included in this report.
It is recommended that these technical groups co-opt the most qualified technical people (in SM / SG) from the Distribution Companies, from the Regulator, from the Ministry, manufacturers and from the Universities.
9.2 Implementation Roadmap
After consideration of the important issues discussed in earlier sections of this report, the implementation plan will clearly be a critical success factor for the SM/SG programme. It is proposed the implementation plan should be formed of the following 4 phases.
Initial Steps (year 0)
Design Phase (year 1)
Pre-rollout trials (years 2 – 3)
Smart Meters and Smart Grids massive rollout (years 4 – 8)
These steps are explained in the sub-paragraphs below:
9.2.1 Initial Steps (year 0)
Prior to commencement of the implementation plan the three key working entities to be established are as follows:
Establish SM/SG Steering Committee (and seek high level government approval for the SM/SG plan)
Establish Technical Working groups
Appoint Programme Management Company (PMC)
9.2.2 Design phase (year 1)
During this phase further the following steps will be required:
Complete SEC 60,000 meters trial (mainly non-residential)
Scope of work and tendering for pre-rollout phase activities
Finalise project execution / delivery schedule for complete roll-out (under project management company service agreement)
Complete work of Technical Working groups

FINAL REPORT B3006974
Page 123
9.2.3 Pre-rollout phase (year 2-3)
It is possible to initiate an early deployment of smart meters and to have a complete roll-out in 5 years, based on other countries experiences. However, for the KSA it is recommended to have a comprehensive utility scale trial Programme in years 1 – 2 of the roadmap. This is because there are risks involved adopting new solutions development of technologies, and recent protocols to adopt as well the functionalities of the smart meters to be fully tested in the field.
The developed countries like USA, Australia and European countries (included the European Commission) spent some years in creating consensus, governance, performing Pilot Projects on Smart Meters technologies, conducting Pilot Projects in Demand Response, adapting the tariff mechanisms for the new technologies, training their staff, adapting the organizations, systematizing the key lessons and conducting studies and developments regarding the Smart Meters and Smart Grid Technologies.
Therefore, the pre-rollout phase will include trials of potential Home Area Network functions (HAN), In Home Displays (IHD), Demand Side Management functions (load control), TOU tariffs and load limit / remote disconnection functions. Also included will be customer participation trials / surveys in demand response and Time of Use tariffs and a review of other potential customer management implications (e.g. data security)
The pre-rollout phase will consist of the following steps:
Pre roll-out trials: 150,000 meters: Urban (6 cities), minimum 4 suppliers
Pre roll-out trials: 100,000 meters: Rural (6 regions), minimum 4 suppliers
Field testing of AMM system (in second year of pre-rollout phase, with 2 AMM companies)
Field testing of transmission and distribution network automation
9.2.4 Smart Meters and Smart Grids Implementation Phase (year 4-8)
Leveraging the pre-rollout trials phase, the massive roll-out of Smart Meters begins in year 4, including the residential sector, to be completed in 5 years. Besides the massive roll-out, in this phase will be implemented the results of the pilots on Demand Response, new tariff rates, and other transitional policies.
The Smart Grids Implementation Phase has two important goals:
i) the automation of the transmission network by 2016 (taking into account the current degree of automation); and
ii) the automation of the distribution network by 2020.
Other components of Smart Grids implementation will be determined by the Technical Committees during the Design Phase (by end of year 1). These detailed studies will include the updated cost-benefit analysis for the Smart Grids which will in turn update the rollout activities and provide an optimized timeline for the investments.
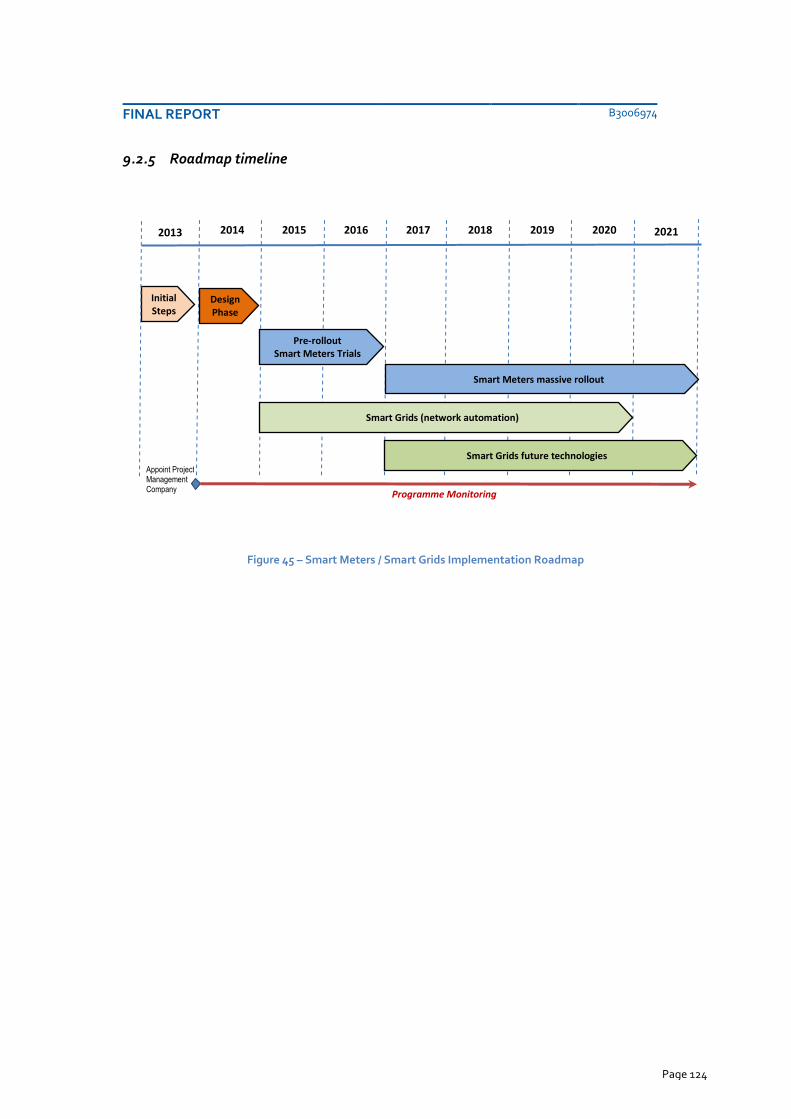
FINAL REPORT B3006974
Page 124
9.2.5 Roadmap timeline
Figure 45 – Smart Meters / Smart Grids Implementation Roadmap
2013 2014 2015 2016 2017 2018 2019 2020 2021
Initial Steps
Design Phase
Programme Monitoring
Appoint Project Management Company
Smart Grids (network automation)
Smart Grids future technologies
Pre-rollout Smart Meters Trials
Smart Meters massive rollout

FINAL REPORT
Annex 1 – Communication Cost Analysis Page 129
ANNEX I - Communication Cost Analysis
ahwadei
Typewritten Text
ahwadei
Typewritten Text
ahwadei
Typewritten Text
ahwadei
Typewritten Text
ahwadei
Typewritten Text
ahwadei
Typewritten Text
ahwadei
Typewritten Text
ahwadei
Typewritten Text
ahwadei
Typewritten Text
ahwadei
Typewritten Text
ahwadei
Typewritten Text
ahwadei
Typewritten Text
ahwadei
Typewritten Text
ahwadei
Typewritten Text
ahwadei
Typewritten Text
ahwadei
Typewritten Text
ahwadei
Typewritten Text
ahwadei
Typewritten Text
ahwadei
Typewritten Text
ahwadei
Typewritten Text
ahwadei
Typewritten Text
ahwadei
Typewritten Text
ahwadei
Typewritten Text

FINAL REPORT
Annex 1 – Communication Cost Analysis Page 130
1 COMMUNICATION COST ANALYSIS ............................................................................ 131
1.1 Considerations ................................................................................................................... 131
1.1.1 Demography .............................................................................................................. 132
1.1.2 Communication Technologies .................................................................................... 134
1.1.3 Particular Features of KSA .......................................................................................... 136
1.2 Assumptions ...................................................................................................................... 139
1.2.1 Meters per Concentrator ............................................................................................ 141
1.2.2 Kind of meter per Customer ....................................................................................... 141
1.2.3 Reading Cycle ............................................................................................................. 142
1.2.4 Data traffic ................................................................................................................. 142
1.2.5 Cost of the communication ........................................................................................ 143
1.3 Scenarios ........................................................................................................................... 144
1.3.1 PLC & GPRS ............................................................................................................... 145
1.3.2 Only GPRS .................................................................................................................. 148
1.3.3 Wi-Fi & Fibre Optic ..................................................................................................... 150
1.3.4 RF & GPRS .................................................................................................................. 152
1.4 Results ............................................................................................................................... 154
1.4.1 Present Value of the Costs .......................................................................................... 154
1.4.2 CAPEX Analysis .......................................................................................................... 158
1.4.3 OPEX Analysis ............................................................................................................ 159
1.5 Sensitivity Analysis ............................................................................................................ 161
1.6 Conclusions ........................................................................................................................ 164

FINAL REPORT
Annex 1 – Communication Cost Analysis Page 131
1 COMMUNICATION COST ANALYSIS
The success of wireless communications, the creation of more complete and smaller devices, and the emergence of the Internet have transformed communications not only in residential and business environments but also in electrical framework. The emergence of new communication means such as PLC (Power Line Communication), GPRS (General Packet Radio Service), UMTS (Universal Mobile Telecommunications System), WLANs (Wireless Local-Area Networks) and WiMAX (Worldwide Interoperability for Microwave Access) allows the introduction of innovative services and opens up a new range of opportunities for the Utilities to overcome those challenges (such as generation diversification, greenhouse gas emissions regulation, energy conservation, demand response and a new liberalized market system), that are affecting the existing networks.
It is clear that these problems cannot be resolved with the current infrastructure. A next-generation grid, commonly referred to as “the smart grid” is expected to be the solution to these issues. Effectively, a smart grid is the convergence of ICT with power systems engineering. A first step toward the implementation of the smart grids is the introduction of Smart Meters and an AMI (Advance Metering Infrastructure) system able to exchange data in a bidirectional way with the meters.
Whatever be the case, the selection of a proper communication system is always a key issue for a Distribution Company which has to choose the best reliable solution at the lowest cost. For this reason the preparation of a detailed Cost Analysis is the only way to achieve this objective. This Annex introduces the Cost Analysis assessment of the Smart Meter’s communication infrastructure in the Kingdom of Saudi Arabia. The model is described through its assumptions and considerations while the last paragraph reports the results obtained with respect to different selected scenarios.
1.1 Considerations
Smart metering architecture, design parameters, and technology can greatly affect the Cost analysis outcome. In defining the system architecture, particular attention should be devoted to three main set of variables:
Demographic data, like:
• Customers’ location in KSA
• Density of population in urban and rural areas
Available technologies:
• Proven technologies worldwide
• Technologies used in the region
• Tested technologies in the country
Special features of the country:
• Extension
• Territorial dispersion
• Frequency allocation legislation
• Installed capacity of the telecommunication system
• Communications Technologies available in the country
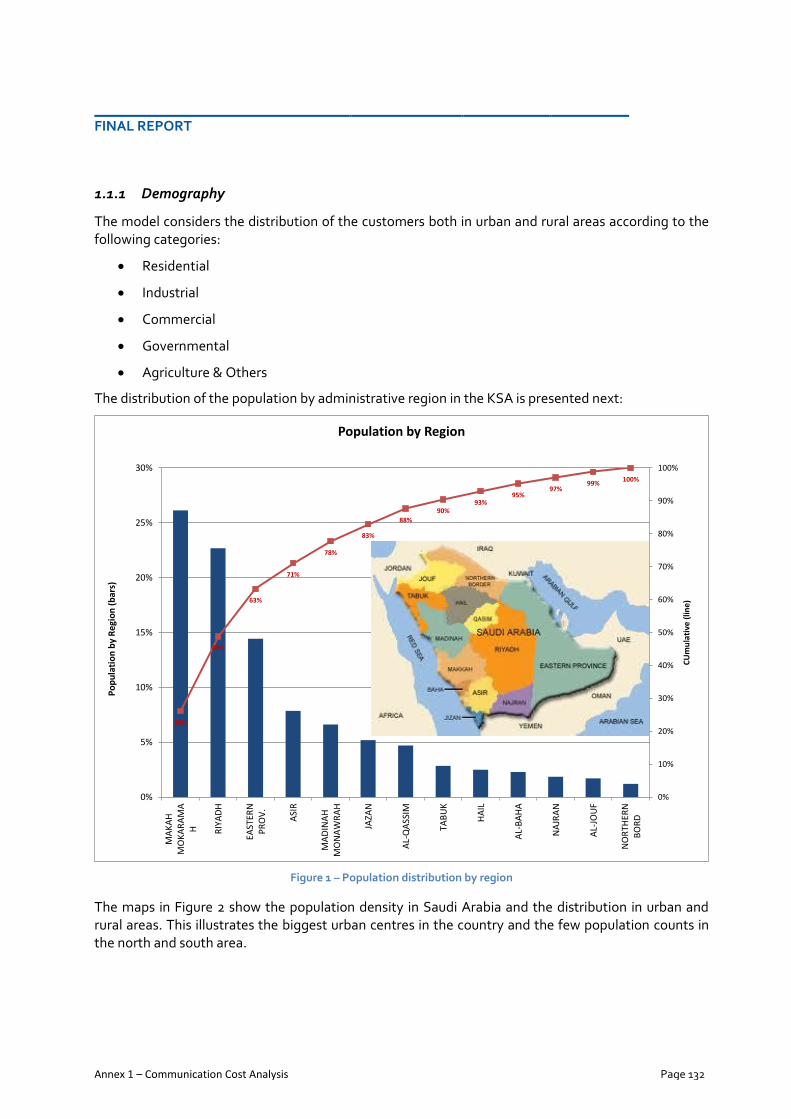
FINAL REPORT
Annex 1 – Communication Cost Analysis Page 132
1.1.1 Demography
The model considers the distribution of the customers both in urban and rural areas according to the following categories:
Residential
Industrial
Commercial
Governmental
Agriculture & Others
The distribution of the population by administrative region in the KSA is presented next:
Figure 1 – Population distribution by region
The maps in Figure 2 show the population density in Saudi Arabia and the distribution in urban and rural areas. This illustrates the biggest urban centres in the country and the few population counts in the north and south area.
26%
49%
63%
71%
78%
83%
88%
90%93%
95%97%
99%100%
0%
10%
20%
30%
40%
50%
60%
70%
80%
90%
100%
0%
5%
10%
15%
20%
25%
30%
MA
KA
HM
OK
AR
AM
AH RIY
AD
H
EAST
ERN
PR
OV
.
ASI
R
MA
DIN
AH
MO
NA
WR
AH
JAZA
N
AL-
QA
SSIM
TAB
UK
HA
IL
AL-
BA
HA
NA
JRA
N
AL-
JOU
F
NO
RTH
ERN
BO
RD
CU
mu
lati
ve (
line
)
Po
pu
lati
on
by
Reg
ion
(b
ars)
Population by Region

FINAL REPORT
Annex 1 – Communication Cost Analysis Page 133
Source: NASA and Socioeconomic Data and Applications Centre (SEDAC).
Figure 2 – Population density and distribution in urban and rural areas
The top 20 cities in population in KSA are:
Rank City name Region Pop.
1 Ar-Riyadh Riyadh 5,328,228
2 Jeddah Makkah 3,456,259
3 Makkah Makkah 1,675,368
4 Al-Madinah Al Madinah 1,180,770
5 Al-Ahsa Eastern 1,063,112
6 At-Taif Makkah 987,914
7 Ad-Dammam Eastern 903,597
8 Buraidah Al-Qassim 614,093
9 Al-Khobar Eastern 578,500
10 Tabuk Tabuk 569,797
11 Al-Qatif Eastern 524,182
12 Khamis Mushait 'Asir 512,599
13 Ha'il Ha'il 412,758
14 Hafer Al-Batin Eastern 389,993
15 Al-Jubail Eastern 378,949
16 Al-Kharj Riyadh 376,325
17 Abha 'Asir 366,551
18 Najran Najran 329,112

FINAL REPORT
Annex 1 – Communication Cost Analysis Page 134
Rank City name Region Pop.
19 Yanbu Al Madinah 298,675
20 Al Qunfidhah Makkah 272,424
Table 1 –Population of the most important cities in KSA
The population of these cities represent near the 74% of the total population of the KSA in 2010 and this proves that near 80% of the population are concentrated in urban areas.
The number of customers considered has divided by tariff category and by urban and rural areas as shown in the Table 2 below.
Source: Own elaboration based on Demographics of Saudi Arabia & Word Bank Indicator (2011)
Table 2 – Costumers and population density in the model
1.1.2 Communication Technologies
The selection of the communications technologies (PLC, GPRS / 3G, Wi-Fi / WiMAX, RF...) is another critical element, as it has different implications on CAPEX (Capital Expenditures) and OPEX (Operational Expenditures) throughout the life of the meter system. Besides, different communication technologies can allow different functionalities which imply different costs in terms of initial investment and operational costs.
The first step to evaluate the different technologies is to consider the current available technologies in place in KSA and in particular the well tested ones. So these are the strongest candidates for the meter’s communication infrastructure. In this first step we have considered the following technologies for the KSA:
PLC
GPRS / 3G
Wi-Fi / WiMAX
Satellite communication
There are also other technologies that can be implemented in the KSA, for example:
Broadband PLC implemented by KEPCO, consultant of SEC Company.
Customers
# of Customers 6,300,000.00
% Residential 81.7% 5,147,100
% Industrial 0.1% 6,300
% Commercial 13.4% 844,200
% Government 3.6% 226,800
% Agriculture & Others 1.2% 75,600
Population Density
Urban Rural
% Residential 82.0% 18.00%
% Industrial 90.0% 10.00%
% Commercial 82.0% 18.00%
% Government 100.0% 0.00%
% Agriculture & Others 0.0% 100.00%

FINAL REPORT
Annex 1 – Communication Cost Analysis Page 135
Radio Frequency (RF) implemented in Abu Dhabi (and widely used in USA) as an example of using a private network
However, the Broadband PLC1 implemented by KEPCO has other targets like commercial purposes.
At the moment, there are many concerns regarding the standardization of this technology, as detailed in the International Symposium on Powerline Communications and its Applications2:
There are also not enough manufacturers of this technology, so there it could be possible to have low competition in the procurement phase and there are risks of market power and the oligopoly of Manufacturers. Furthermore estimated costs for the chipset are much higher than narrowband PLC. Further detailed comments are reported in the document:”B2039040 – Smart Metering and Smart Grids Strategy for the Kingdom of Saudi Arabia - Comments on KEPCO presentation”.
On the other hand, the use of radio frequency has the possible advantage of being a private network. The investments, operation and maintenance and administrative costs, required will have to be performed by the distribution company itself. Generally, such activities that are not the main focus or are not part of the core business of the Distribution Company are outsourced.
In Communications, there is a competitive market environment with several companies whose main activity and expertise is to develop communications. They are obliged to be efficient in cost and operations to be competitive to survive in the market and get an important share of the market. Hence, outsourcing the telecommunication services to an external company already engaged in a competitive telecommunications environment is likely to be the least cost and efficient solution (depending on profit/pricing policies).
On the other hand the distribution company should conduct suitable due diligence processes in selecting an appropriate third party service provider and in monitoring its ongoing performance.
Finally, the Distribution Companies may in any case choose any communication means according their top management strategic decisions. But only the efficient cost of development would be approved by the regulator to be recovered through tariffs (or subsidy allocation). The users should only have to pay for an efficient and least cost solution considering a competitive market.
1 PLC allows simultaneous provision of two-way data access and electrical power on the same media granting electricity users to access a wide range of services avoiding in some cases the needs of new cabling infrastructures. 2 Standards & Regulations Framework for LV-MV-HV Powerline Communication Systems, Romano Napolitano, ENEL, Pisa Italy

FINAL REPORT
Annex 1 – Communication Cost Analysis Page 136
1.1.3 Particular Features of KSA
Building a cost analysis for the introduction of a technology implies a great number of variables which strongly depend upon the characteristics of the County under consideration. One of the key aspects is the coverage of a particular technology over the whole Country. The maps in Figure 3 show the coverage of GPRS and Wi-Fi in KSA (for STC). According to these sources, the coverage of the GPRS service at the end of 2012 is 65% of territory and 97% of the population3 while 3G or 3.5G (W-CDMA with HSDPA evolution) and Wi-Fi technologies are limited to the main cities and they don’t offer a wide coverage over the whole Country.
GPRS Picture sources: http://gsma.streetmap.co.uk/
Wi-Fi Picture sources http://www.m3com.com.sa/en/wifi/map Source data: http://www.telegeography.com
Figure 3 – GPRS (up) and Wi-Fi (bottom) coverage in KSA
Another important issue to consider is the capacity of the telecommunication network and the capacity that operators may have to expand the system in the case of a massive roll-out of Smart Meters. From the official figures from the local operators and from the Ministry4, we obtained the growth rates for mobile phones and also for broadband subscribers.
3 TeleGeography – GlobalComms Database – Saudi Telecom Company (STC) 4 Ministry of Communications and Information Technology, and General Authority of Civil Aviation

FINAL REPORT
Annex 1 – Communication Cost Analysis Page 137
We observe from the charts in Figure 4 that there are higher growth rates for mobile phone connections, reaching 44% in 2008. The new mobile connections reached to 8.7 million in 2007; 7.6 million in 2008, 8.8 million in 2009 and 6.8 million in the recession year 2010 (right side of Figure 4).
Own elaboration with Telecom. Operators data and Ministry of Communications and Information Technology, and General Authority of
Civil Aviation.
Figure 4 – Evolution of mobile phone connection (up) and new mobile phone connection per year (bottom)
These charts illustrate the capability of the Telecommunication Operators to expand their systems in such quantities in only 1 year. Since a massive deployment for residential customers could be performed in 2 years, the capacity to expand the network appears to be not a concern for the telecommunication strategy analysis.
Finally, there has been a fast evolution of the broadband subscribers (a gross indicator of the Wi-Fi): in 2011 were added 8.9 million of new subscribers, this means that STC company has a good capacity to implement new broadband connections.
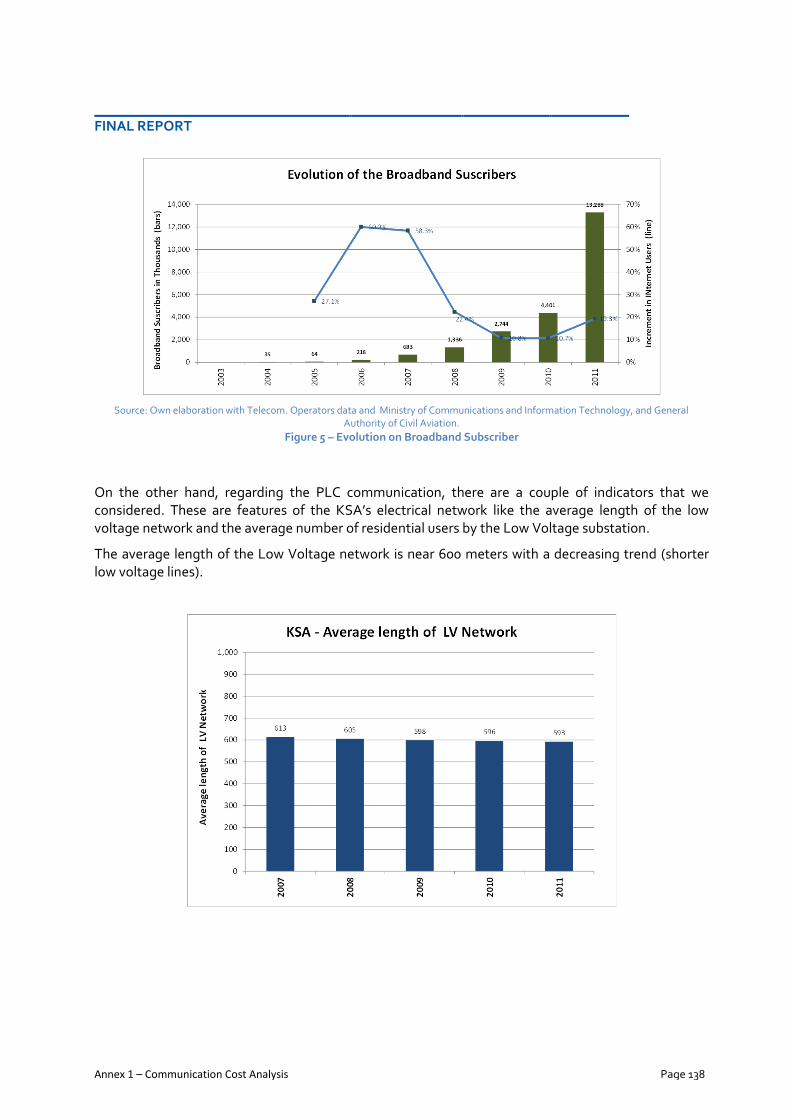
FINAL REPORT
Annex 1 – Communication Cost Analysis Page 138
Source: Own elaboration with Telecom. Operators data and Ministry of Communications and Information Technology, and General
Authority of Civil Aviation.
Figure 5 – Evolution on Broadband Subscriber
On the other hand, regarding the PLC communication, there are a couple of indicators that we considered. These are features of the KSA’s electrical network like the average length of the low voltage network and the average number of residential users by the Low Voltage substation.
The average length of the Low Voltage network is near 600 meters with a decreasing trend (shorter low voltage lines).

FINAL REPORT
Annex 1 – Communication Cost Analysis Page 139
Source: Own elaboration with SEC Data
Figure 6 – Average length of LV Network (up), Residential Consumers on LV Substation (bottom)
The average number of residential clients in the Low Voltage network (per MV/LV substation) is near 15 (see the bottom side of Figure 6). However, the range is large: from less than 5 to over 100 customers per substation5. These values are important when analysing the PLC communication and its costs.
1.2 Assumptions
For initial consideration, a cost breakdown is based on some preliminary hypotheses that help lead the analysis toward the definition of one or more scenarios. Therefore, bearing in mind the previous consideration about telecommunication coverage and electrical features of the network, among many different available technologies, the followings have been considered:
GPRS because the current coverage is suitable for a massive deployment
PLC because it is a proven technology worldwide and was already tested in KSA
Wi-Fi because it is already implemented in the major cities
Radio Frequency (VHF / UHF) combined with the use of a public network (for remote areas).
And others have not been considered:
WiMAX (802.16e standard) because its evolution has been shut down by the major TLC companies6.
3G (and its evolution) because of the low coverage over the Country.
Broadband PLC
However, 3G and Broadband PLC technologies deserve some notes and remarks. 3G (and its evolutions) provides higher communication speed (with respect to GPRS) but its coverage is limited only to cities and highways. Meters don’t need high bandwidth for typical reading traffic. A higher bandwidth would be required if other enhanced services (e.g. related to Demand Side
5 Source: SEC Distribution KPIs analysis 2012 6 TeleGeography – GlobalComms Database – Saudi Telecom Company (STC)

FINAL REPORT
Annex 1 – Communication Cost Analysis Page 140
Management) had been provided. Having considered GPRS doesn’t mean that 3G technology should be a priori discarded or that it can be used later in time when this technology will be more widespread and the costs for modems and connections will be lower.
Regarding Broadband PLC (BPL), it has not been considered in the analysis mainly for the following reasons:
For the purpose of metering narrowband PLC is enough, especially considering the low number of meters under the same transformer (max 50) and the short length of LV cables. Furthermore meters are outside houses and communication should take advantage of this, with fast response even with low baud rate PLC.
BPL is more expensive (local manufacturers stated that the cost of a BPL modem is equal or higher than the GSM/GPRS modem), on the opposite the cost of PLC components is very cheap.
BPL connected via RS-485 to the meter finds the bottleneck in the RS-485, so the high-speed is not completely exploited.
Standards for management of appliances are still at a low level of standardization and, at the current status of art, it is better to keep the functionalities of meter and gateway for advanced Demand management in two different devices. A gateway can take advantage of the adoption of a BPL, but the meter few or nothing, compared with the cheaper narrowband.
Before defining a PLC technology, some assessments should be performed. The pilot project that SEC has set up with PLC is using a different technology, not the KEPCO broadband power line.
The problem is not only the technology, but its application. If the distribution company wants to provide additional services to the final Customers, then it could be a good opportunity to include the BPL in the specification of a meter. But the additional services will be of less quality of whatever type of xDSL or 3G services. Furthermore, to provide these services, a dedicated gateway is necessary. It would be better if this gateway had a communication port for the meter, not the opposite, i.e. the meter acting as a direct gateway to the appliances.
Nothing in this annex excludes the implementation of different type of communication than those considered. It is extremely important to underline that even the Functional Requirement7 is open to integrate current and future technologies for communication. According to the implementation plan, the Residential Customers will be the last ones to be equipped with Smart meters. In the meanwhile many years will pass and development of technologies, aside the necessary on-field assessment and testing, will suggest the final solution.
Apart from technologies, the further key assumptions for the AMI architecture have been considered:
Meters per Concentrator (minimum, typical, maximum)
Kind of meter per Customer (basic meter or with peak power)
Reading cycle
Data traffic (volume)
Cost for the communications (fixed and variable costs)
7 Minimum Functional Requirement report

FINAL REPORT
Annex 1 – Communication Cost Analysis Page 141
1.2.1 Meters per Concentrator
Three different assumptions for each category of customers have been implemented in the model (Figure 7Source: Own elaboration based on the interviews with SEC and Marafiq
Figure 7):
Minimal number of Meters for each DCU equal to 15, assuming PLC is applied only to residential customers
Typical (in KSA) number of Meters for each DCU considered as 20
Maximum number of Meters for each DCU assuming the double of the minimum (30).
This assumption allows a check on how fix and variable costs vary with the number of DCUs required.
Source: Own elaboration based on the interviews with SEC and Marafiq
Figure 7 – Meters per DCU for each kind of customer
1.2.2 Kind of meter per Customer
Another fundamental component for the communication cost estimation is the volume of data exchanged between Meters / DCU and AMM Centre. The first assumption to achieve this objective is to define, for each category, the usual kind of meter:
Meter without Peak Power
Meter with Peak Power
Meter in MV Customers and MV/LV Substation
Each kind of meter sends a different volume of data. Therefore, the communication with the AMM Centre may have a different cost for each of the above described categories (Figure 8). In the minimum case residential customers are assumed not to require peak power meters since one of the main issues from the Distributor’s point of view is to know the peak consumption of a cluster of users (if possible of the same kind) or of the aggregated loads under a single MV / LV substation. If a single customer had to exceed his contract power, the meter would automatically cut off the absorption.
Source: Own elaboration based on the Consultant experience
Figure 8 – % of typcustomerMeters for each customers category
Min Typ Max
# Meters per DCU (Residential) 15 10 10
# Meters per DCU (Industrial) 0 0 0
# Meters per DCU (Commercial) 0 5 10
# Meters per DCU (Government) 0 5 10
# Meters per DCU (Agriculture) 0 0 0
Total meters per DCU 15 20 30
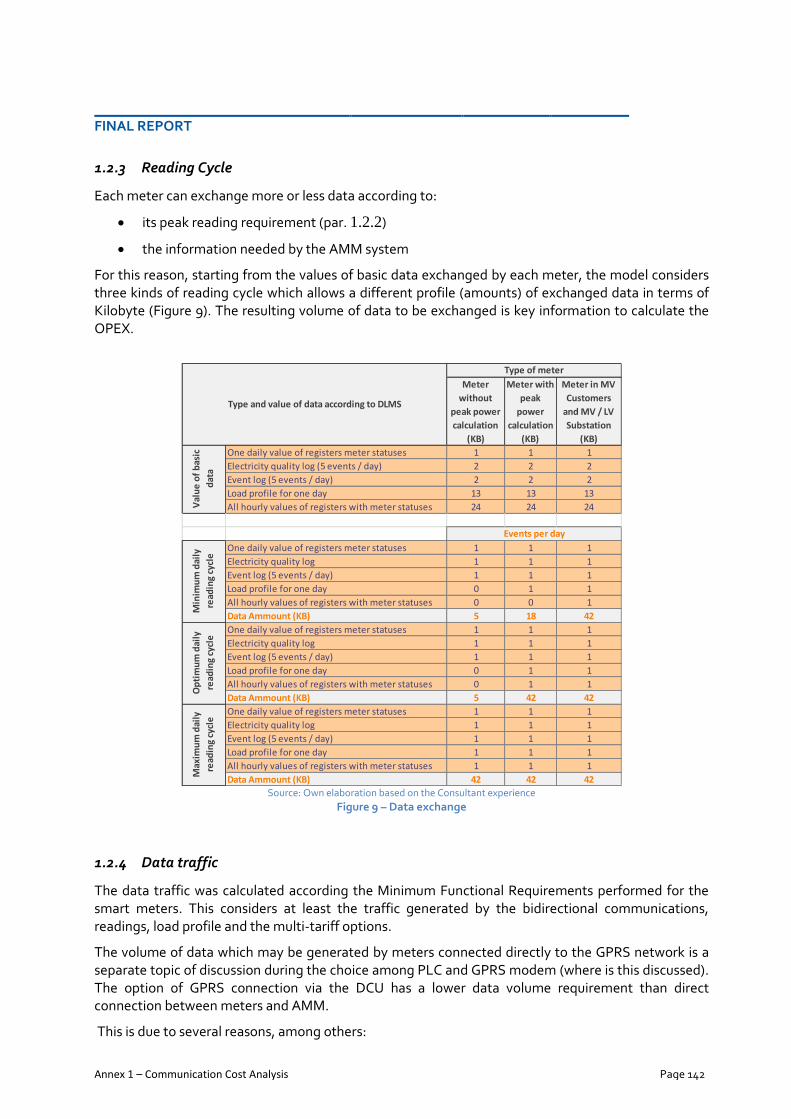
FINAL REPORT
Annex 1 – Communication Cost Analysis Page 142
1.2.3 Reading Cycle
Each meter can exchange more or less data according to:
its peak reading requirement (par. 1.2.2)
the information needed by the AMM system
For this reason, starting from the values of basic data exchanged by each meter, the model considers three kinds of reading cycle which allows a different profile (amounts) of exchanged data in terms of Kilobyte (Figure 9). The resulting volume of data to be exchanged is key information to calculate the OPEX.
Source: Own elaboration based on the Consultant experience
Figure 9 – Data exchange
1.2.4 Data traffic
The data traffic was calculated according the Minimum Functional Requirements performed for the smart meters. This considers at least the traffic generated by the bidirectional communications, readings, load profile and the multi-tariff options.
The volume of data which may be generated by meters connected directly to the GPRS network is a separate topic of discussion during the choice among PLC and GPRS modem (where is this discussed). The option of GPRS connection via the DCU has a lower data volume requirement than direct connection between meters and AMM.
This is due to several reasons, among others:
Meter
without
peak power
calculation
(KB)
Meter with
peak
power
calculation
(KB)
Meter in MV
Customers
and MV / LV
Substation
(KB)
One daily value of registers meter statuses 1 1 1
Electricity quality log (5 events / day) 2 2 2
Event log (5 events / day) 2 2 2
Load profile for one day 13 13 13
All hourly values of registers with meter statuses 24 24 24
One daily value of registers meter statuses 1 1 1
Electricity quality log 1 1 1
Event log (5 events / day) 1 1 1
Load profile for one day 0 1 1
All hourly values of registers with meter statuses 0 0 1
Data Ammount (KB) 5 18 42
One daily value of registers meter statuses 1 1 1
Electricity quality log 1 1 1
Event log (5 events / day) 1 1 1
Load profile for one day 0 1 1
All hourly values of registers with meter statuses 0 1 1
Data Ammount (KB) 5 42 42
One daily value of registers meter statuses 1 1 1
Electricity quality log 1 1 1
Event log (5 events / day) 1 1 1
Load profile for one day 1 1 1
All hourly values of registers with meter statuses 1 1 1
Data Ammount (KB) 42 42 42
Max
imu
m d
aily
read
ing
cycl
e
Val
ue
of
bas
ic
dat
a
Type and value of data according to DLMS
Type of meter
Min
imu
m d
aily
read
ing
cycl
e
Op
tim
um
dai
ly
read
ing
cycl
e
Events per day

FINAL REPORT
Annex 1 – Communication Cost Analysis Page 143
DCU GPRS connections send a fewer number of data files (data from several meters is combined in one file)
Updating information (i.e., the clock data, firmware update, etc.) is sent from the AMM Centre to DCU through GPRS. DCU then sends this data to meters through PLC connection.
An element of data compression can be carried out by the DCU for the meters it covers
By this reason, we considered a data reduction factor (Source: Own elaboration based on the Consultant
experience
Figure 10) for the meters to DCU scenario:
Min: 40% of data reduction
Typ: 50% of data reduction
Max: 70% of data reduction
Source: Own elaboration based on the Consultant experience
Figure 10 – GPRS traffic reduction factor
1.2.5 Cost of the communication
Several costs characterize the kind of communication in the AMI architecture:
Costs of Communication Device (Figure 11)
Costs of Communication Services (Figure 12)
The cost of communication devices are those considered in the study and are sourced from international competitive tenders of these devices in many countries.
Source: Own elaboration based on international average costs
Figure 11 – Cost of the devices
On the other hand, the costs of the services are taken from the local and current prices published by the telecommunication operators.
Min Typ Max
Reduction GPRS Traffic Factor 40% 50% 70%
CENELEC Band OtherExternal PLC Modem 199.09SAR 300.00SAR 199.09SAR
Internal PLC Modem 82.96SAR 150.00SAR 82.96SAR
FALSO FALSO
Modem GPRS 339.52SAR
Satellite Modem + Antenna 7,200.00SAR
Router WiFi 779.79SAR
RF Modem 696.83SAR RS 485 to PLC Mini Concentrator 1,000.00SAR
MV PLC Modem 1,000.00SAR
Other Modem 1,000.00SAR
Other no CENELEC BandInternal PLC Modem
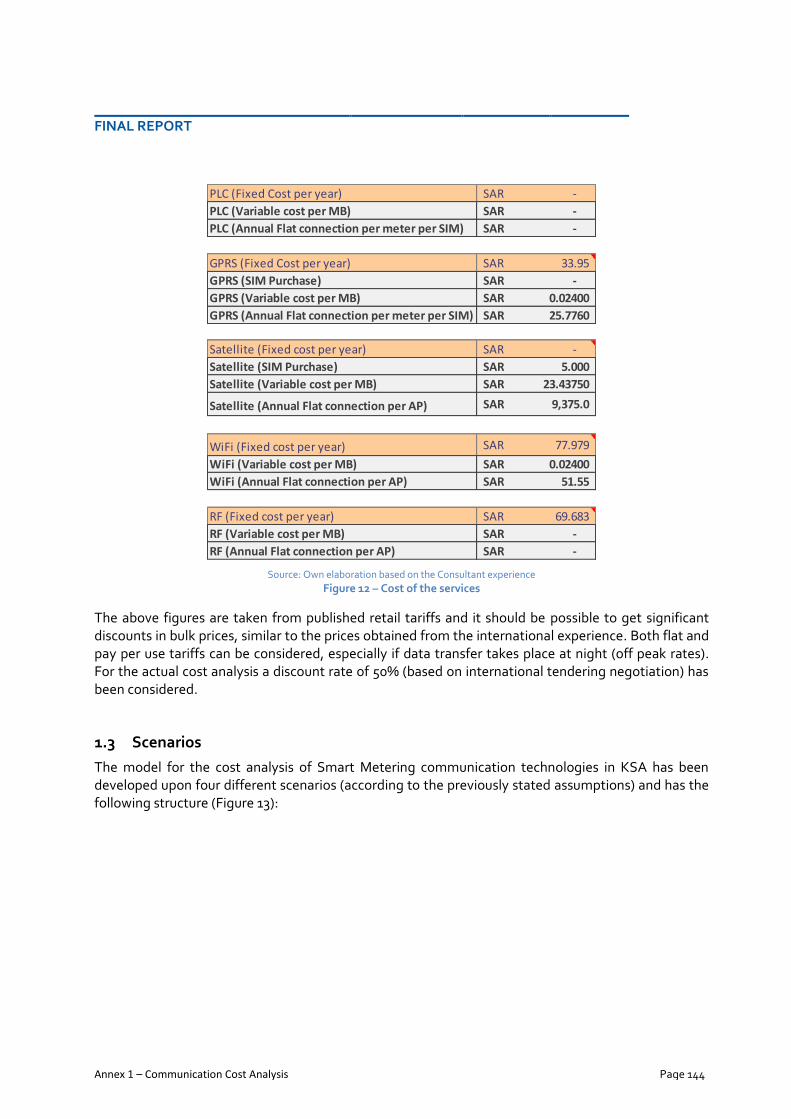
FINAL REPORT
Annex 1 – Communication Cost Analysis Page 144
Source: Own elaboration based on the Consultant experience
Figure 12 – Cost of the services
The above figures are taken from published retail tariffs and it should be possible to get significant discounts in bulk prices, similar to the prices obtained from the international experience. Both flat and pay per use tariffs can be considered, especially if data transfer takes place at night (off peak rates). For the actual cost analysis a discount rate of 50% (based on international tendering negotiation) has been considered.
1.3 Scenarios
The model for the cost analysis of Smart Metering communication technologies in KSA has been developed upon four different scenarios (according to the previously stated assumptions) and has the following structure (Figure 13):
PLC (Fixed Cost per year) -SAR
PLC (Variable cost per MB) -SAR
PLC (Annual Flat connection per meter per SIM) -SAR
GPRS (Fixed Cost per year) 33.95SAR
GPRS (SIM Purchase) -SAR
GPRS (Variable cost per MB) 0.02400SAR
GPRS (Annual Flat connection per meter per SIM) 25.7760SAR
Satellite (Fixed cost per year) -SAR
Satellite (SIM Purchase) 5.000SAR
Satellite (Variable cost per MB) 23.43750SAR
Satellite (Annual Flat connection per AP) 9,375.0SAR
WiFi (Fixed cost per year) 77.979SAR
WiFi (Variable cost per MB) 0.02400SAR
WiFi (Annual Flat connection per AP) 51.55SAR
RF (Fixed cost per year) 69.683SAR
RF (Variable cost per MB) -SAR
RF (Annual Flat connection per AP) -SAR

FINAL REPORT
Annex 1 – Communication Cost Analysis Page 145
Figure 13 – Model’s structure and scenarios
Each scenario has its respective architecture and also considers a subset of options for the main variables:
Three different options for the reading cycles
Three different options for the meters to the data concentrator
Three different options for the data traffic
Two options for data connections/charges (flat, on-demand)
All these variations were implemented for each scenario in the model. The detailed descriptions and the results are shown next.
1.3.1 PLC & GPRS
This scenario is widely implemented solution in the Smart Metering International Projects, particularly in Europe. The GPRS communications requirements can be implemented and the coverage could be improved. The GPRS and PLC communications are proven technologies. The analysis considers separately the following (Figure 14):
Urban Areas: in which there is a concentration of major telecommunications services
Rural Areas: which is characterized by a low concentration of Customers and incomplete coverage of public telecommunications services
Government and Industrial customers, due to their size, would normally have a stand-alone communication with the AMM Centre (via GPRS or other available communication). Regarding PLC, meters in the European market are cheaper than GPRS meters where they incorporate inbuilt modems and use the CENELEC band «A».
For this option it would be recommended to obtain the allocation of CENELEC band «A» for the KSA national strategy because:

FINAL REPORT
Annex 1 – Communication Cost Analysis Page 146
Commercially available meters are cheaper
There are many manufacturers in the world (and locally) for these type of meters
The use of an existing communication Standard is advantageous for the purpose of commissioning, installation and substitution with other similar products, etc.
There is a low cost option for the modem to be integrated into the meter (modems can be specified as external or removal, at a higher cost).
Urban Area

FINAL REPORT
Annex 1 – Communication Cost Analysis Page 147
Rural Area
Figure 14 – GPRS & PLC scenario

FINAL REPORT
Annex 1 – Communication Cost Analysis Page 148
1.3.2 Only GPRS
Bearing in mind the GPRS coverage in KSA (65% of rural territory for residential and agriculture, 97% of customers), this scenario provides each meter to be directly connected to the AMM centre, regardless of the kind of customer (Figure 15). This solution implies that the AMM centre is able to manage all the communications and traffic from / to the meters or, as an alternative, the Distributor could request the TLC company to retrieve the data through its infrastructure and send them via wired links
Urban Area

FINAL REPORT
Annex 1 – Communication Cost Analysis Page 149
Rural Area
Figure 15 –Only GPRS scenario

FINAL REPORT
Annex 1 – Communication Cost Analysis Page 150
1.3.3 Wi-Fi & Fibre Optic
This scenario uses public Wi-Fi where available (i.e. major cities) at the commercial values published by STC and Distributor’s property fibre-optic backbone technology. The solution aims at designing a more efficient communication combination through reduction of costs of connection and those for sharing the Wi-Fi Network with other services. In this case, OPEX will benefit by the subdivision of the costs within the other Wi-Fi users. It is a feasible option in the urban area, where there is a high connectivity and a high number of customers. It has been proposed to use PLC and GPRS solution for the rural areas without Wi-Fi coverage. Attention should be paid to determine in which areas there is a high number of customers, in order to evaluate Wi-Fi implementation and maintenance. In this scenario, a value of 63% for urban areas has been considered8. Wi-Fi in rural areas would be a complex activity of installation and high investments where the infrastructure unlikely to be implemented in the near future.
Urban Area
8 This value has been calculated matching the Wi-Fi coverage with the costumers in KSA. It results of a 63% of urban costumers’ coverage.
Meter Type: PLC Meters WiFi Meters Not Connected
Residential 37.00% 63.00% 0.00%
Industrial 37.00% 63.00% 0.00%
Commercial 37.00% 63.00% 0.00%
Government 37.00% 63.00% 0.00%
Agriculture & Others 37.00% 63.00% 0.00%

FINAL REPORT
Annex 1 – Communication Cost Analysis Page 151
Rural Area
Figure 16 –PLC & Wi-Fi scenario
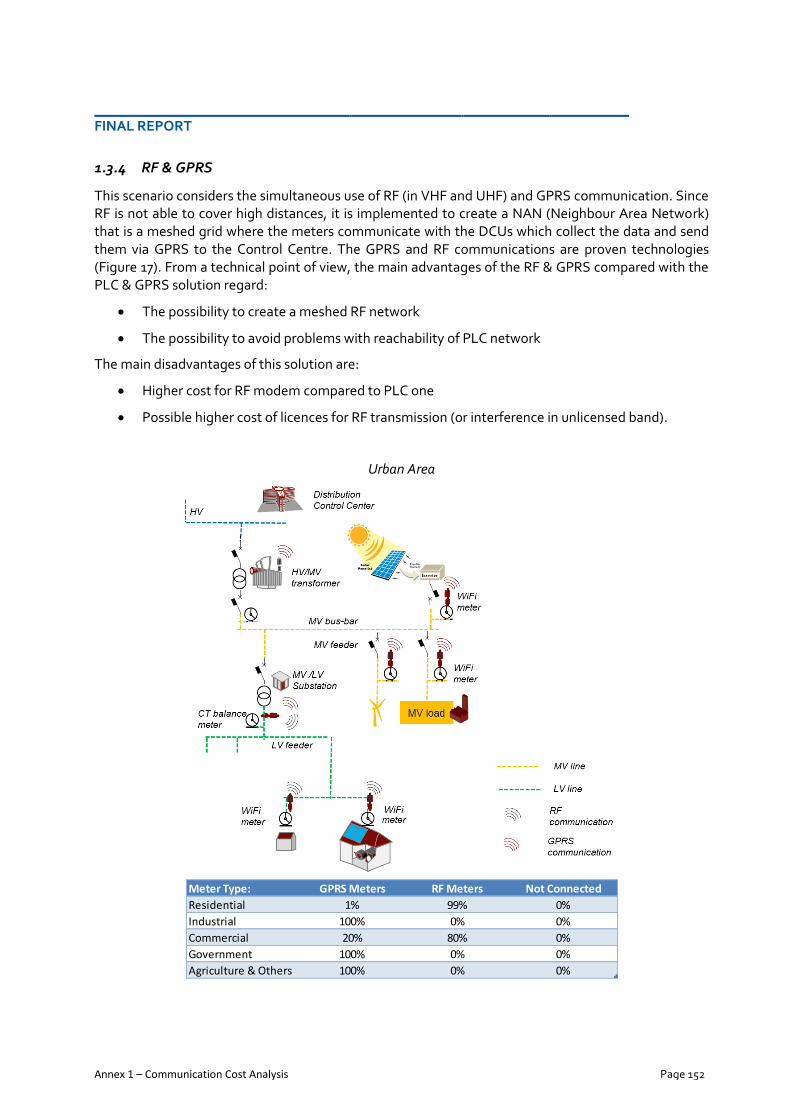
FINAL REPORT
Annex 1 – Communication Cost Analysis Page 152
1.3.4 RF & GPRS
This scenario considers the simultaneous use of RF (in VHF and UHF) and GPRS communication. Since RF is not able to cover high distances, it is implemented to create a NAN (Neighbour Area Network) that is a meshed grid where the meters communicate with the DCUs which collect the data and send them via GPRS to the Control Centre. The GPRS and RF communications are proven technologies (Figure 17). From a technical point of view, the main advantages of the RF & GPRS compared with the PLC & GPRS solution regard:
The possibility to create a meshed RF network
The possibility to avoid problems with reachability of PLC network
The main disadvantages of this solution are:
Higher cost for RF modem compared to PLC one
Possible higher cost of licences for RF transmission (or interference in unlicensed band).
Urban Area
Meter Type: GPRS Meters RF Meters Not Connected
Residential 1% 99% 0%
Industrial 100% 0% 0%
Commercial 20% 80% 0%
Government 100% 0% 0%
Agriculture & Others 100% 0% 0%

FINAL REPORT
Annex 1 – Communication Cost Analysis Page 153
Rural Area
Figure 17 – RF & GPRS scenario
Meter Type: GPRS Meters RF Meters Not Connected
Residential 65% 30% 5%
Industrial 100% 0% 0%
Commercial 65% 35% 0%
Government 100% 0% 0%
Agriculture & Others 65% 25% 10%
FINAL REPORT
Annex 1 – Communication Cost Analysis Page 154
1.4 Results
The communication cost analysis has been compared using the Present Value of Costs, CAPEX and OPEX, among the different scenarios. The analysis also implements a sensitivity test based on:
The number of meters connected under a single DCU (only for those scenarios with PLC meters):
o High (lowest number of meters under a DCU)
o Typ (typical number of meters)
o Low (higher number of meters)
The reading cycle according to meter’s typology (only of OPEX):
o Minimum annual reading
o Optimum annual reading
o Optimum annual reading
The contract for telecommunication services (only of OPEX):
o Flat tariffs
o Pay per use
1.4.1 Present Value of the Costs
In Figure 18, Figure 19, Figure 20 and Figure 21 are reported the Present Value of Costs, the CAPEX and OPEX costs (in Million SAR) for the different scenarios. The “Least Cost Scenario” refers to the case which has the least cost among the different scenarios considered.
This scenario considers:
The architecture of communication according the PLC and GPRS communication. PLC whenever possible alongside GPRS communication for the 100% of the industrial and government buildings.
Optimum reading cycle
Typical quantity of meters by Data Unit Concentrator (20)
The current coverage of GPRS (65%of the territory and 97% of the population)
A reduction of the current GPRS rates published by STC operator by 50%, assuming bulk contracts and according to previous experience of the Consultant in negotiations with other telecommunication operators.
The PLC concentrator has the modem internally (not external unit)
The PLC communication is performed in the CENELEC band (assumption of exclusive frequency allocation by CITC according to a national policy and support to foster Smart Metering)

FINAL REPORT
Annex 1 – Communication Cost Analysis Page 155
Figure 18 – Present Value of the Cost for PLC & GPRS, Pay per Use (up), Flat Tariffs (bottom)

FINAL REPORT
Annex 1 – Communication Cost Analysis Page 156
Figure 19 – Present Value of the Cost for Only GPRS, Pay per Use (up), Flat Tariffs (bottom)

FINAL REPORT
Annex 1 – Communication Cost Analysis Page 157
Figure 20 – Present Value of the Cost for PLC & Wi-Fi, Pay per Use (up), Flat Tariffs (bottom)
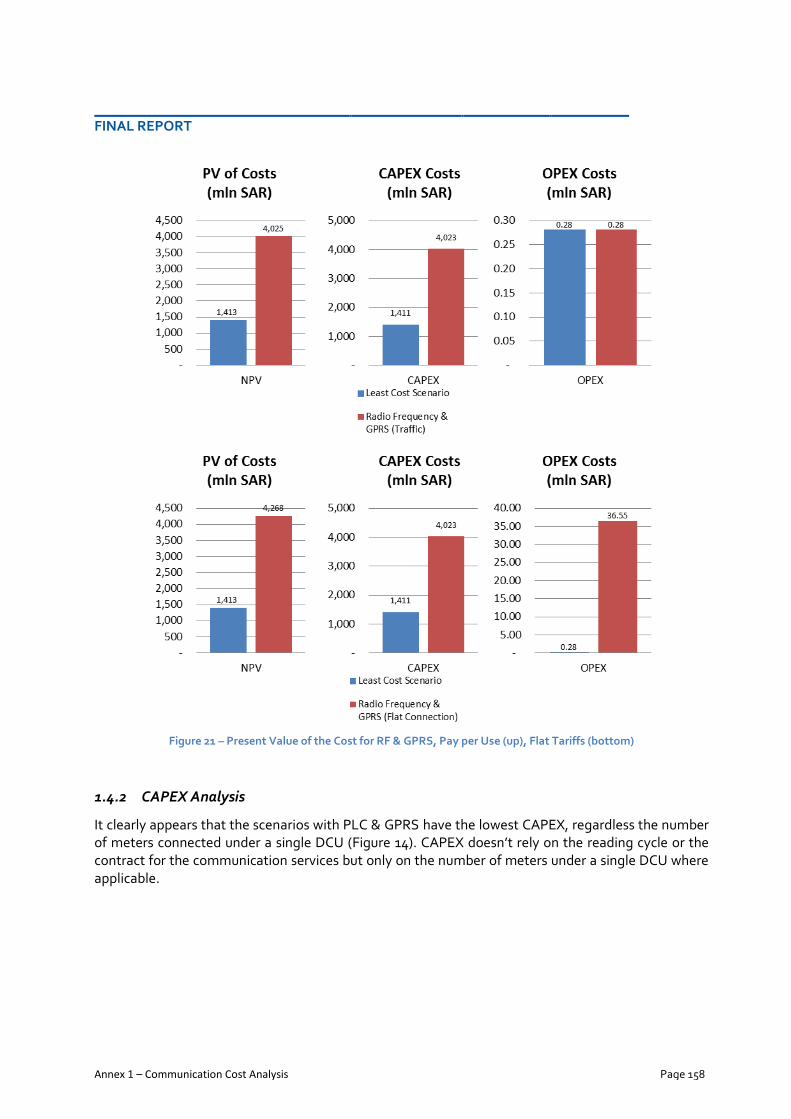
FINAL REPORT
Annex 1 – Communication Cost Analysis Page 158
Figure 21 – Present Value of the Cost for RF & GPRS, Pay per Use (up), Flat Tariffs (bottom)
1.4.2 CAPEX Analysis
It clearly appears that the scenarios with PLC & GPRS have the lowest CAPEX, regardless the number of meters connected under a single DCU (Figure 14). CAPEX doesn’t rely on the reading cycle or the contract for the communication services but only on the number of meters under a single DCU where applicable.
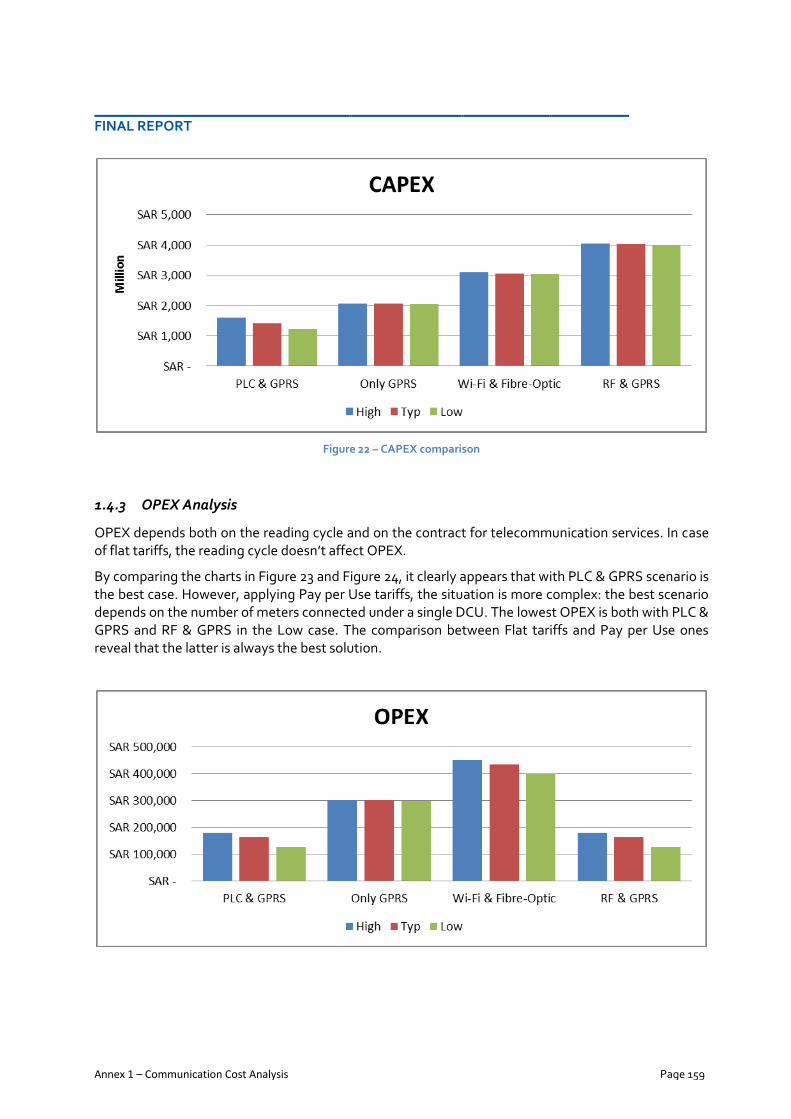
FINAL REPORT
Annex 1 – Communication Cost Analysis Page 159
Figure 22 – CAPEX comparison
1.4.3 OPEX Analysis
OPEX depends both on the reading cycle and on the contract for telecommunication services. In case of flat tariffs, the reading cycle doesn’t affect OPEX.
By comparing the charts in Figure 23 and Figure 24, it clearly appears that with PLC & GPRS scenario is the best case. However, applying Pay per Use tariffs, the situation is more complex: the best scenario depends on the number of meters connected under a single DCU. The lowest OPEX is both with PLC & GPRS and RF & GPRS in the Low case. The comparison between Flat tariffs and Pay per Use ones reveal that the latter is always the best solution.

FINAL REPORT
Annex 1 – Communication Cost Analysis Page 160
Figure 23 – OPEX comparison for pay per use tariffs (Minimum, Optimum, Maximum Annual Reading)

FINAL REPORT
Annex 1 – Communication Cost Analysis Page 161
Figure 24 – OPEX comparison for flat tariffs (Minimum, Optimum, Maximum Annual Reading)
1.5 Sensitivity Analysis
While developing the model, it appears that some variables or assumption are more influential than others on the final results. This is true also for this analysis where three main sets of variable can be marked as the most effective:
The number of modems (for meter and DCU)
The cost of each kind of modem
The cost of connection (and data transfer)
The first variable represents a straightforward scaling factor ; the higher is the number of the modem (both for the modem and the DCU), the higher will be the CAPEX. It is worth noting that the number of meters is fixed (it is strictly related to the customers), but the number of DCUs is variable and depends on the communication solution so the latter is the key variable that really affects CAPEX on a fixed scenario. In this case, no sensitivity analysis is reported because all the charts in the previous paragraphs already consider the possibility to have different “quantity” of meters under a single DCU (“High”, “Typ”, “Low”).

FINAL REPORT
Annex 1 – Communication Cost Analysis Page 162
The second and the third variables (the first for CAPEX and the latter for OPEX), represent the unit cost by which the number of modems is multiplied (in a very rough approximation). A change in these variables has a great effect on the final results. For example, instead of having an external PLC modem, if the meter integrated the modem, a reduction of about 50% could be achieved on the PLC modem and a 30% (average) on CAPEX for all those scenarios using PLC communication (Figure 25). Nevertheless, it’s worth noting that the reduction is evident for the PLC & GPRS scenario but not for the PLC & Wi-Fi one. This happens because the costs for Wi-Fi modems are one order of magnitude higher than those for PLC so the reduction is completely hidden by the cost of Wi-Fi.
Figure 25 –Sensitivity on PLC modem Cost: external modem (up), internal modem (bottom)
In case of the OPEX, the most important cost is the GPRS connection because it affects the majority of the scenarios. For example, if the GPRS flat tariff is reduced by 10%, there will be a corresponding reduction in OPEX (Figure 26) in all the scenarios. This means that attention must be paid in the selection of the best communication tariffs especially for GPRS communication.
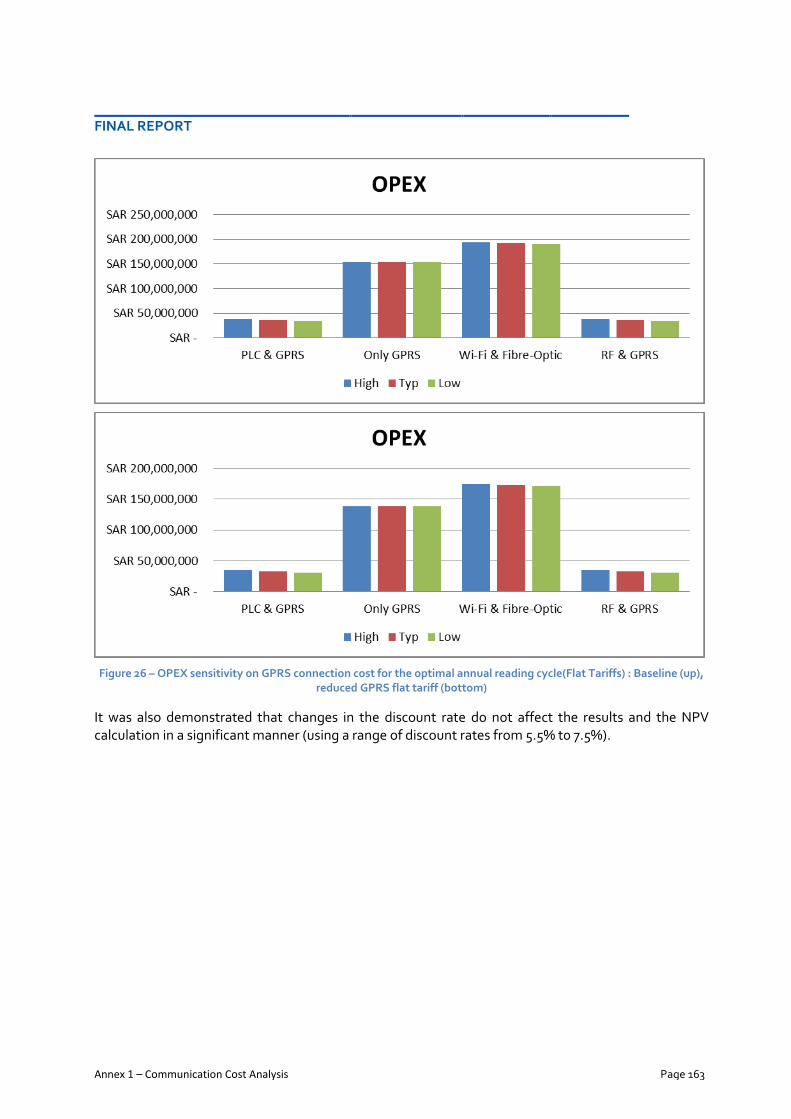
FINAL REPORT
Annex 1 – Communication Cost Analysis Page 163
Figure 26 – OPEX sensitivity on GPRS connection cost for the optimal annual reading cycle(Flat Tariffs) : Baseline (up), reduced GPRS flat tariff (bottom)
It was also demonstrated that changes in the discount rate do not affect the results and the NPV calculation in a significant manner (using a range of discount rates from 5.5% t0 7.5%).

FINAL REPORT
Annex 1 – Communication Cost Analysis Page 164
1.6 Conclusions
The communication cost analysis has taken into consideration three main set of variables:
Demographic
Technology
Characteristics of the country
Regarding technologies, the following main technologies have been considered :
GPRS
PLC
Wi-Fi
Radio Frequency (VHF / UHF)
And others have not been considered:
WiMAX (802.16e standard)
3G (and its evolution)
Broadband PLC
Besides, it has been assumed that:
GPRS coverage of 65% (97% of the population) in the country and capacity of the local operators to expand the network
The PLC communication considered and recommend is for CENELEC band.
The modem is internal to the meter.
The comparison among the four different scenarios (PLC & GPRS, Only GPRS, PLC & Wi-Fi, RF & GPRS) shows that, considering PV of Costs, CAPEX and OPEX, the GPRS & PLC scenario is the least-cost solution.

FINAL REPORT B3000838
Annex II – Minimum Functional Requirements Page 165
ANNEX II – Minimum Functional Requirements

FINAL REPORT B3000838
Annex II – Minimum Functional Requirements Page 166
Table of contents
1 FOREWORD ................................................................................................................ 170
2 OBJECTIVES OF THE REPORT ...................................................................................... 170
3 FUNCTIONAL REQUIREMENTS .................................................................................... 171
3.1 Functionalities for the Customer / End-user ....................................................................... 173
3.1.1 Functionality 1: Smart meter must have an interface / display by means of which the End-user can obtain readings ................................................................ 173
3.1.2 Functionality 2: The reading information must be frequently updated, to allow the end-user to achieve energy savings ........................................................ 174
3.1.3 Functionality 3: Readings must be provided in an easily understandable way, also by untrained end-user. End-user can use to better control their energy consumption ......................................................................................................... 174
3.2 Functionalities for Metering System Operators ................................................................. 174
3.2.1 Functionality 4: Metering System operators and entitled third parties must be able to obtain a remote reading of meter registers ............................................... 174
3.2.2 Functionality 5: Allows readings to be taken frequently enough to allow the information to be used for network planning ........................................................ 175
3.2.3 Functionality 6: Bidirectional communication between the meter and external networks for maintenance and control of the meter ............................................. 175
3.2.4 Functionality 7: Provides for the monitoring of Power Quality .............................. 176
3.3 Supplier Commercial / Business Processes ......................................................................... 176
3.3.1 Functionality 8: Supports advanced tariff system .................................................. 176 3.3.2 Functionality 9: Supports energy supply by pre-payment and on credit ................ 177 3.3.3 Functionality 10: Allows remote ON/OFF control of the supply and/or flow or
power limitation .................................................................................................... 177
3.4 Security and privacy ........................................................................................................... 178
3.4.1 Functionality 11: Provide Secure Data Communications ....................................... 178 3.4.2 Functionality 12: Fraud prevention and detection ................................................. 178
3.5 Functionalities to allow distributed generation .................................................................. 178
3.5.1 Functionality 13: Provide Import / Export & Reactive Metering.............................. 178
4 SMART METER REQUIREMENT - PHYSICAL ..................................................................180
4.1 Environmental .................................................................................................................. 180
4.1.1 Climate conditions ............................................................................................... 180 4.1.2 Operative Range .................................................................................................. 180 4.1.3 Storage Range ..................................................................................................... 180
4.2 Lifecycle ........................................................................................................................... 180
4.3 Mechanical ....................................................................................................................... 180
4.3.1 Housing ................................................................................................................ 180

FINAL REPORT B3000838
Annex II – Minimum Functional Requirements Page 167
4.3.2 Fixing Points .......................................................................................................... 181
5 ELECTRICAL ............................................................................................................... 182
5.1 Electrical connections ....................................................................................................... 182
6 CERTIFICATION .......................................................................................................... 182
6.1 Metrological ..................................................................................................................... 182
6.1.1 Class ..................................................................................................................... 182
6.2 EMC compatibility ............................................................................................................ 182
7 DESCRIPTION OF SMART METER FUNCTIONS .............................................................. 183
7.1 Basic measurements .......................................................................................................... 183
7.2 Real time clock function and Time synchronization ........................................................... 183
7.3 Management of multiple tariffs ......................................................................................... 183
7.4 Load profiles ...................................................................................................................... 183
7.5 Integrated Display ............................................................................................................ 184
7.5.1 Support / Information for Customer / End User .................................................... 184 7.5.2 Information for testing or Operator ...................................................................... 184
7.6 External display. In-home monitor .................................................................................... 184
7.7 Disconnection/ reconnection relay ..................................................................................... 185
7.7.1 Local and remote disconnection functionality ....................................................... 185
7.8 Firmware organization and upgrading ............................................................................... 185
7.8.1 Firmware upgrade ................................................................................................. 185
7.9 Anti-tampering protection ................................................................................................ 186
7.10 Log and status of the meter .............................................................................................. 186
7.11 Security and privacy ........................................................................................................... 187
7.12 Stand-alone working modality of meter ............................................................................ 187
8 QUALITY ASSURANCE ............................................................................................... 188
8.1 Warranty ........................................................................................................................... 188
8.2 Product life cycle .............................................................................................................. 188
8.3 Spare parts ....................................................................................................................... 188
8.4 Procedure for calibration .................................................................................................. 188
9 CLASSIFICATION OF CUSTOMERS AND TYPES OF INSTALLATION IN KSA .................... 189
9.1 “Case 1”, Residential Customers, on LV, in a collective building, urban area ..................... 189
9.2 “Case 2”, Residential Customers in individual building, urban or medium density area ..... 189
9.3 “Case 3”, Residential Customers in rural area or low density area ..................................... 190
9.4 “Case 4”, Commercial and small industrial Customers, on LV ........................................... 190

FINAL REPORT B3000838
Annex II – Minimum Functional Requirements Page 168
9.5 “Case 5”, Customers on MV (Industrial) ............................................................................. 190
10 DESCRIPTION OF METER INTERFACES......................................................................... 192
10.1 Data connections .............................................................................................................. 192
10.1.1 Optical interface .................................................................................................. 192 10.1.2 RS-485 - Local bus ................................................................................................. 193 10.1.3 M-bus .................................................................................................................... 193 10.1.4 Digital Output for impulse test, consumption monitoring and future external
device for load management ................................................................................. 193
11 COMMUNICATION FUNCTION AND PROTOCOLS .........................................................194
11.1 Proprietary versus standardized suite of protocols ........................................................... 194
12 CONSIDERATIONS ON STATUS OF IEC 62056 ...............................................................194
12.1 Open standards and associations ...................................................................................... 196
12.2 Interoperability and interchangeability .............................................................................. 197
12.2.1 Interoperability at “meter level” ............................................................................ 197 12.2.2 Interoperability at “concentrator level” ................................................................. 197 12.2.3 Interoperability at “AMM level” ............................................................................. 197
12.3 Description of the meters architecture with respect of the communication protocols according to IEC 62056 ..................................................................................................... 198
12.3.1 Meter connected to Concentrator ........................................................................ 198 12.3.2 Meters directly connected to the communication network .................................. 199 12.3.3 Data Concentrators connected to the communication network ........................... 199 12.3.4 The main requirements of meters, Concentrator and AMM related to IEC
62056 ................................................................................................................... 199
13 DATA CONCENTRATOR UNIT ...................................................................................... 201
13.1 Functional Requirements – Data Concentrator Unit.......................................................... 202
Functionalities for Configuration & Management ..................................................................... 202
13.1.1 Functionality 1: Execute commissioning, research/query, status check, decommissioning of the meters ........................................................................... 202
13.1.2 Functionality 2: Receive information, setting and software updates from AMM Centre and forwarding them to all the meters or to a subset ...................... 203
13.1.3 Functionality 3: Administration Commands ......................................................... 203 13.1.4 Functionality 4: Operator Indicators ..................................................................... 203
Functionalities for Metering ..................................................................................................... 204
13.1.5 Functionality 5: Collect reading from Meter, elaboration and sending to the AMM Centre of clustered data ............................................................................. 204
Functionalities for Meters Monitoring ...................................................................................... 205
13.1.6 Functionality 6: DCU must be able to monitor and record, detected events, alarms of a meter ................................................................................................. 205
Functionalities for Data Management & Storage ...................................................................... 206

FINAL REPORT B3000838
Annex II – Minimum Functional Requirements Page 169
13.1.7 Functionality 7: The DCU shall have sufficient memory to store resident software and data ................................................................................................ 206
Functionalities for Data Communication .................................................................................. 206
13.1.8 Functionality 8: Communication with Meters ....................................................... 206 13.1.9 Functionality 9: Communication with AMM Centre ............................................... 207 13.1.10 Functionality 10: Secure Communication AMM-DCU-Meters............................... 208
13.2 Data Concentrator Unit – Interfaces ................................................................................. 209
13.2.1 Local access ......................................................................................................... 209 13.2.2 External devices ................................................................................................... 210 13.2.3 Remote Communication Interfaces ...................................................................... 210
13.3 Data Concentrator Unit - Characteristics .......................................................................... 210
13.3.1 Physical –Environmental ...................................................................................... 210 13.3.2 Lifecycle ................................................................................................................ 211
14 FUNCTIONAL AND TECHNICAL REQUIREMENTS COMPARISON BY COUNTRIES ........... 212
14.1 Functionalities Comparison by Country ............................................................................. 213
14.2 Technical Comparison by Country ..................................................................................... 215
15 FUNTIONAL AND TECHNICAL REQUIREMENTS COMPARISON BY MANUFACTURERS ... 219
15.1 Functionalities Comparison by Manufacturer ................................................................... 220
15.2 Technical Requirements Comparison by Manufacturer ..................................................... 221
15.3 Information from international Manufacturers ................................................................. 223
15.4 Information from Local Manufacturer AEC ........................................................................ 231
16 REFERENCES FOR SMART METERS MANUFACTURERS ................................................. 234
17 GENERAL REFERENCES .............................................................................................. 235
18 APPLICABLE CODES AND STANDARDS ....................................................................... 236

FINAL REPORT B3000838
Annex II – Minimum Functional Requirements Page 170
1 FOREWORD
The Electricity & Co-generation Regulatory Authority (“ECRA”) of the Kingdom of Saudi Arabia (KSA) was established in 2002 as an administratively and financially independent Regulator. ECRA’s primary goal is to ensure the provision of high quality and reliable electricity and desalinated water services at fair prices to consumers.
In view of its responsibilities, ECRA is committed to consider the possibility to implement new technologies, innovations and related developments in the global Electricity Industry which may have sounded viable and sustainable potential impact to bring efficiency savings and enhanced services for customers in the Kingdom. The advent of Advanced Metering Infrastructure (AMI), Smart Meters, Network Communications and Information & Communication Technologies (ICT) and all the technologies and infrastructures which somehow contributes in setting-up the “Smart Grid” (SG) concept, are pertinent areas which may provide a substantial contribution to the energy efficiency enhancement as well as to the savings and active involvement of the final customers of the Kingdom.
In this framework, CESI and A.T. Kearney have been selected in order to assist ECRA in the development of strategic policies and plans and to define the specifications and functional requirements of the best suited Smart Metering and Advanced Metering Infrastructure for Saudi Arabia. The primary objectives of the Study are:
• Identifying Saudi Arabia’s current and future challenges which a Smart Meter / Smart Grid (SM / SG) strategy can help to overcome.
• Reviewing available smart metering technologies that are best suited for the Saudi Electricity Industry and its customers;
• Assisting ECRA and representatives of the major Stakeholders of the Electricity Industry in the Kingdom of Saudi Arabia (KSA) in determining and finalizing the salient functional requirements of proposed Smart Meters to be deployed,
• Developing a high level Smart Grid deployment strategy for Saudi Arabia, and
• Advising on and help preparing the most efficient implementation, gradual and timely rolling-out of Smart Meters.
2 OBJECTIVES OF THE REPORT
The objective of this report is to present the Minimum Functional Requirements for Smart meters and accessories for the Kingdom of Saudi Arabia (KSA). The functional requirements are generally a description of what the Smart Metering equipment must supply. They do not specify how the functions will be delivered. As such, multiple solutions may be possible using a variety of components. The specifications performed are derived from the definitions of the Outlook and Strategy for the KSA and from the Communication Technologies Costs Analysis performed. They also consider the proven technologies existing in the market, the competition to be fostered between manufacturers (avoiding market power) and the open standards rather than proprietary standards.

FINAL REPORT B3000838
Annex II – Minimum Functional Requirements Page 171
The functional requirements are organized according to the different classes of functionalities which a
smart meter can offer.
3 FUNCTIONAL REQUIREMENTS
The following devices are considered in the Minimum Functional Requirements: TYPES OF METERS
Direct three-phase
CT three-phase
CT-VT three phase ACCESSORIES TO BE CONNECTED
Data concentrator – Gateway
External display
GPRS modem
PLC modem
Accessory for local bus connection This chapter contains the minimum hi-level functional requirements, gathered as functionalities, organized according to the following main aspects:
MinimunFunctional Requirements
Market Competition
and Open Standards
Comm. Tech. Cost Analysis
Outlook & Strategy

FINAL REPORT B3000838
Annex II – Minimum Functional Requirements Page 172
A set of functions is then specified for the functionalities. The functionalities can pertain to different side: the Demand side, mainly related to the Customer and the Supply side, mainly related to the Distribution Company. In fact the two entities have strong interactions, for exchange of energy and commercial relationship (processes). As mentioned before, these functionalities are defined according the Outlook and Strategy for the KSA, the performed Communication Technologies Costs Analysis, the proven technologies existing in the market, the competition to be fostered between manufacturers (avoiding market power) and the open standards rather than proprietary standards.
Customer
Grid and Operator support
Commercial / business
Security & Privacy
Distributed Generation
Supply side
Demand side
Positive energy flow
Negative energy flow
Minimum Functional
Requirements

FINAL REPORT B3000838
Annex II – Minimum Functional Requirements Page 173
Figure 1 – Meter Functional Requirements divided by Area
3.1 Functionalities for the Customer / End-user
These hi-level functionalities grant that the end-user will receive, from the installation of the Smart meter, the benefits of accurate and real time readings, with information related to the tariff in use and the costs due to the consumptions.
3.1.1 Functionality 1: Smart meter must have an interface / display by means of which the
End-user can obtain readings
The minimum requirement consists of one display, capable of showing data related to consumption. Since in the Kingdom of Saudi Arabia, for most of the Residential Customers the Smart meter will be installed outside their house, an external, remote display should be foreseen, at least as optional.
1Smart meter must have an interface /display by mean of
which the Customer can obtain readings.
2The reading informat ion must be frequent ly updated,
to allow the Customer to achieve energy savings
3
Readings must be provided in an easily understandable
way, also by untrained Consumer. Customer can use to
bet ter control their energy consumpt ion.
4Meter operators and ent it led third part ies must be able
to obtain remote reading of meter registers
5Allows readings to be taken frequent ly enough to
allow the informat ion to be used for network planning
6
Bidirect ional communicat ion between the meter and
external networks for maintenance and control of the
meter
7 Provides for the monitoring of Power Quality
8 Supports advanced tarif f system.
9 Supports energy supply by pre-payment and on credit
10Allows remote ON/OFF control of the supply and/or
f low or power limitat ion
11 Provides Secure Data Communicat ions
12 Fraud prevent ion and detect ion
13 Provides Import / Export & React ive Metering
Funct ionalit ies to allow dist ributed generat ion
Requirement Functionality
Funct ionalit ies for the Customer’s side
Grid and Network Support
Commercial/Business processes
Security and privacy
Demand side

FINAL REPORT B3000838
Annex II – Minimum Functional Requirements Page 174
The external display can be in future upgraded to be a Smart programmable gateway, to interact with home appliances and achieving progressive load disconnection, in order to reduce the overall load. The minimum functions that should be implemented in order to assure the Functionality 1 are listed following.
LCD display with indication of consumptions, used Units, codes and messages to the user (in English and/or in Arabic language, as per the utility requirements)
External display, replicating the same information on the LCD
Communication channel between meter and external display and/or home gateway Details on functions are reported in following chapters.
3.1.2 Functionality 2: The reading information must be frequently updated, to allow the
end-user to achieve energy savings
In order to help the end-user in achieving real energy savings, the Smart meters must have updated information about consumptions and tariff in use. The end-user can thus adapt his habits, modulating the use of energy in function of the costs. The minimum functions that should be implemented in order to assure the Functionality 2 are listed following.
Management of multiple tariff and computation of consumption according to the tariff in use, with appropriate registers for current and previous period of billing for all tariffs
LCD display and External display function specification Details on functions are reported in following chapters.
3.1.3 Functionality 3: Readings must be provided in an easily understandable way, also by
untrained end-user. End-user can use to better control their energy consumption
The display on the meter (and the optional external display) must give clear indications, using plain language or with clear icons / symbols understandable by all Customers. For example, the end-user should be aware of approaching maximum contractual power or the limiting power before the automatic disconnection of the loads. The minimum functions that should be implemented in order to assure the Functionality 3 are listed following.
LCD display and External display function specification
Local and Remote disconnection switch function specification
Bidirectional communication specification Details on functions are reported in following chapters.
3.2 Functionalities for Metering System Operators
3.2.1 Functionality 4: Metering System operators and entitled third parties must be able to
obtain a remote reading of meter registers
Demand side
Demand side
Demand side Supply side

FINAL REPORT B3000838
Annex II – Minimum Functional Requirements Page 175
The capability to remotely obtain information from the Smart meter is mandatory for the Metering System Operators, who can have updated and punctual information of the consumptions and on status of meters. The information must be used for billing purposes. The minimum functions that should be implemented in order to assure the Functionality 4 are listed following.
Management of multiple tariff and computation of consumption according to the tariff in use, with appropriate registers for current and previous period of billing for all tariffs
Bidirectional communication specification Details on functions are reported in following chapters.
3.2.2 Functionality 5: Allows readings to be taken frequently enough to allow the
information to be used for network planning
The remote reading must be obtained on a regular basis and at a proper frequency in order to use the collected data for an aggregated profile of consumptions, guiding the Distribution, Transmission and Production companies towards optimized targets. This functionality is strictly related to the previous one. The minimum functions that should be implemented in order to assure the Functionality 5 are listed following.
Management of multiple tariffs and computation of the consumption according to the tariff in use, with appropriate registers for current and previous period of billing for all tariffs
Management of load profiles
Bidirectional communication specification Details on functions are reported in following chapters.
3.2.3 Functionality 6: Bidirectional communication between the meter and external
networks for maintenance and control of the meter
Bidirectional communication is mandatory for sending information, commands and upgrade to the meters. Furthermore the bidirectional communication allows the polling of meters from the Data concentrator or from the Centre, thus enabling full regulated master-slave data traffic, minimising the risk of data collision and optimising the use of the data channel. The minimum functions that should be implemented in order to assure the Functionality 6 are listed following.
Removal of the need for manual intervention under any normal operating conditions;
Ability to remotely upgrade the firmware in any meter or attached device;
Monitoring of the status of the meter and of attached devices with the ability to provide warnings of actual or impending problems (especially high temperature alarm and/or max daily ambient temperature);
Supply side Demand side
Supply side Demand side

FINAL REPORT B3000838
Annex II – Minimum Functional Requirements Page 176
Time synchronisation;
Upload of new tariff details, including changes in cost and/or switching times. Details on functions are reported in following chapters.
3.2.4 Functionality 7: Provides for the monitoring of Power Quality
Smart meters must continuously acquire data from the network, thus collecting precious information on Power quality with the purpose of:
Provisioning a warning to the end-user, should voltage quality fall to such a level that equipment could be damaged. Factors affecting voltage quality include sags & swell, high harmonic content, etc…;
Provisioning warnings to the supplier and the grid in the event of any problems, including excessive harmonic currents;
Logging of power quality issues (such as outages in excess of a defined time). The minimum functions that should be implemented in order to assure the Functionality 7 are listed following.
Monitoring of network conditions and storage of significant events with values and time stamp;
Real-time clock with time synchronization specification
Bidirectional communication specification Details on functions are reported in following chapters.
3.3 Supplier Commercial / Business Processes
3.3.1 Functionality 8: Supports advanced tariff system
The implementation of an advanced tariff system is mandatory to lead the end-users towards the use of energy when the production is higher than the Consumption. In order to support an advanced tariff system, the Smart meters must:
support time-of-use, block and demand based tariffs
support remote control and change of tariffs, contract related parameters, unit costs, etc…
provide active tariff information to the end-users
offer Data storage capacity of consumption profiles, associated with tariffs and other related information (Peak demand in the corresponding tariff)
The minimum functions that should be implemented in order to assure the Functionality 8 are listed following.
Management of multiple tariff and computation of consumption according to the tariff in use, with appropriate registers for current and previous period of billing for all tariffs
Bidirectional communication specification
Real-time clock with time synchronization specification
Supply side Demand side
Supply side Demand side

FINAL REPORT B3000838
Annex II – Minimum Functional Requirements Page 177
Details on functions are reported in following chapters. 3.3.2 Functionality 9: Supports energy supply by pre-payment and on credit
The distribution of population in the Kingdom of Saudi Arabia comprises villages and areas with low density of inhabitants. These areas are often not served by Mobile telephone providers and/or fixed telephone lines. Other communication media, such as dedicated Radio Frequency links can be economically not acceptable. In these cases the communication between Smart meters and Centre could be potentially not feasible. Currently the reading can be estimated on yearly basis with seldom visits to end-users. A simple alternative is the pre-payment functionality. At the expiration of the pre-paid credit, the meter must allow a predefined limited consumption, without disconnecting completely the end-user. The minimum functions that should be implemented in order to assure the Functionality 9 are listed following.
Management of multiple tariffs and computation of consumption according to the tariff in use, with appropriate registers for current and previous period of billing for all tariffs
Real-time clock with time synchronization specification
Dedicated registers for pre-paid credit management
Device for input of pre-paid credit and display of residual credit. Details on functions are reported in following chapters.
3.3.3 Functionality 10: Allows remote ON/OFF control of the supply and/or flow or power
limitation
This functionality can be used for many different purposes:
Disconnection of bad payers
Contract management. Remote switch on/off speeds up processes such as when moving home — the old supply can be disconnected and the new one remotely activated.
Lower tariffs to end-users who accept to have power limitation or interruption in case of network needs
The minimum functions that should be implemented in order to assure the Functionality 10 are listed following.
Bidirectional communication
Local and Remote disconnection switch function specification
Remote Management of contract parameters Details on functions are reported in following chapters
Supply side Demand side
Supply side Demand side

FINAL REPORT B3000838
Annex II – Minimum Functional Requirements Page 178
3.4 Security and privacy
3.4.1 Functionality 11: Provide Secure Data Communications
Privacy and Security are separate and different. Privacy is the restriction of information to the end-user and those authorised by him to have access to it; Security is the prevention of access to information by unauthorised 3rd parties. The minimum functions that should be implemented in order to assure the Functionality 11 are listed following.
Security mechanisms of the Communication protocols
Data ports
Information storage security policies Details on functions are reported in following chapters.
3.4.2 Functionality 12: Fraud prevention and detection
The Smart meter must have functionalities properly identify, log and notify to the Centre any attempt of tampering. The log of tampering attempt must be locally stored in permanent memory. The minimum functions that should be implemented in order to assure the Functionality 12 are listed following.
Opening protections
Strong magnetic field protection
Cable misconnection (reversal of phase(s) and neutral) Details on functions are reported in following chapters.
3.5 Functionalities to allow distributed generation
3.5.1 Functionality 13: Provide Import / Export & Reactive Metering
The Smart meter must be able to bi-directionally measure the flow of the current, useful information also in distributed generation plants. The flow will be considered positive when energy is absorbed by the end-user and negative when generated by the end-user. The meter will calculate the net balance between absorbed and generated energy. In case of different prices for the consumed and locally generated energy, two meters are necessary. The following main functions are mandatory:
Provision of 4 quadrant measurement of active energy (kWh) — import & export
Supply side Demand side
Supply side
Supply side Demand side

FINAL REPORT B3000838
Annex II – Minimum Functional Requirements Page 179
Differentiation between net energy and generated energy in a 4 quadrant kWh meter
Provision of 4 quadrant measurement of reactive energy (kvarh) — import/export and inductive/reactive
Details on functions are reported in following chapters.

FINAL REPORT B3000838
Annex II – Minimum Functional Requirements Page 180
4 SMART METER REQUIREMENT - PHYSICAL
4.1 Environmental
4.1.1 Climate conditions
General external weather conditions that are most common in the Kingdom of Saudi Arabia are described in the table below:
PARAMETER VALUE
Temperate range -20 to 70°C (for shade and outdoor areas)
Relative humidity 50 to 80%
Atmosphere Full of salt near the coast
Isokeraunic level average 26, peak 97
Varying from non-corrosive to corrosive Soil conditions
4.1.2 Operative Range
PARAMETER VALUE
Temperate range -10 to 70°C
Relative humidity 100%
4.1.3 Storage Range
PARAMETER VALUE
Temperate range -10 to 85°C
Relative humidity 100%
4.2 Lifecycle
Expected lifecycle, without maintenance: 15 years.
4.3 Mechanical
4.3.1 Housing
4.3.1.1 Meter housing
The meter will have standard fixing points, according to the following drawing and table:

FINAL REPORT B3000838
Annex II – Minimum Functional Requirements Page 181
Figure 2 - Size and fixing points
b1 b2 C h1 h2 h3 h4
130-195 ≤ 195 ≤ 130 180-230 ≤ 270
Note: all Dimensions are in millimetres with appropriate tolerance Reference: DIN 43857 4.3.1.2 Communication module housing
The meter should have an integrated or “add-on” housing for the installation of the communication module. The communication module can be a GPRS modem, a PLC modem or an adaptor for local bus connection. The size of the housing and its position must be compatible with all different types of communication modules.
4.3.2 Fixing Points
The meter shall have three fixing points: one on the top and two aside, at the bottom. The position is shown in Figure 2.
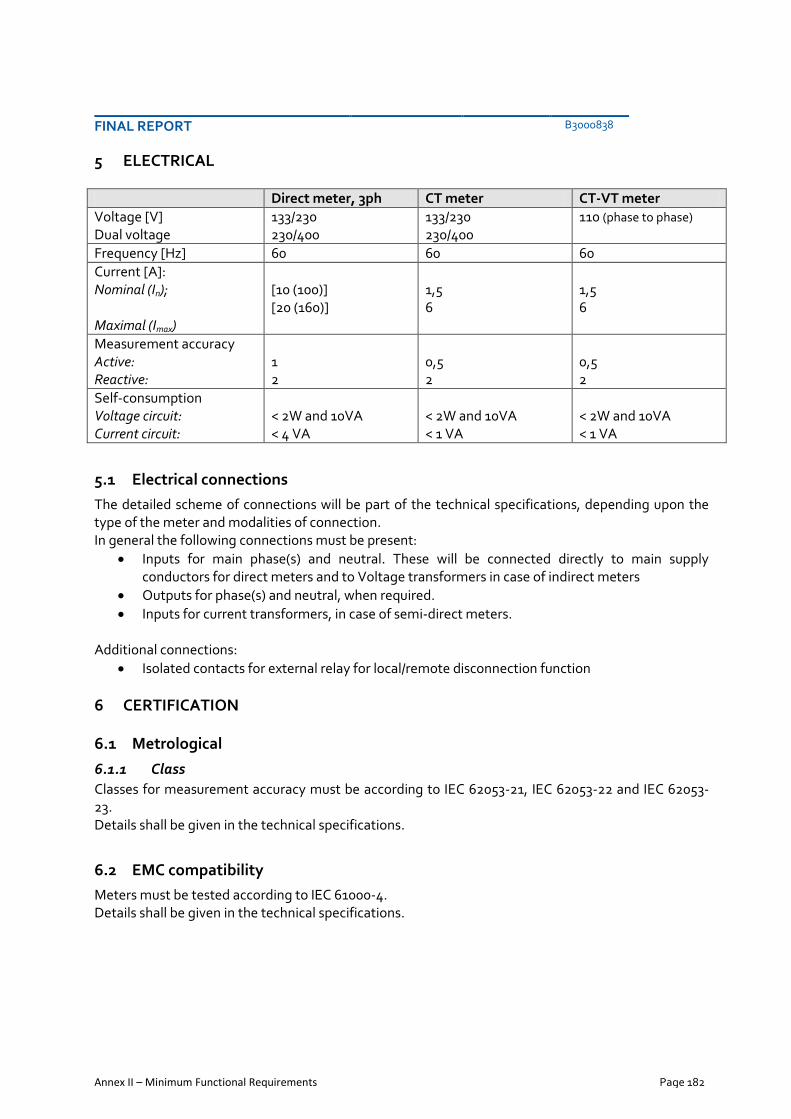
FINAL REPORT B3000838
Annex II – Minimum Functional Requirements Page 182
5 ELECTRICAL
Direct meter, 3ph CT meter CT-VT meter
Voltage [V] Dual voltage
133/230 230/400
133/230 230/400
110 (phase to phase)
Frequency [Hz] 60 60 60
Current [A]: Nominal (In); Maximal (Imax)
[10 (100)] [20 (160)]
1,5 6
1,5 6
Measurement accuracy Active: Reactive:
1 2
0,5 2
0,5 2
Self-consumption Voltage circuit: Current circuit:
< 2W and 10VA < 4 VA
< 2W and 10VA < 1 VA
< 2W and 10VA < 1 VA
5.1 Electrical connections
The detailed scheme of connections will be part of the technical specifications, depending upon the type of the meter and modalities of connection. In general the following connections must be present:
Inputs for main phase(s) and neutral. These will be connected directly to main supply conductors for direct meters and to Voltage transformers in case of indirect meters
Outputs for phase(s) and neutral, when required.
Inputs for current transformers, in case of semi-direct meters. Additional connections:
Isolated contacts for external relay for local/remote disconnection function
6 CERTIFICATION
6.1 Metrological
6.1.1 Class
Classes for measurement accuracy must be according to IEC 62053-21, IEC 62053-22 and IEC 62053-23. Details shall be given in the technical specifications.
6.2 EMC compatibility
Meters must be tested according to IEC 61000-4. Details shall be given in the technical specifications.

FINAL REPORT B3000838
Annex II – Minimum Functional Requirements Page 183
7 DESCRIPTION OF SMART METER FUNCTIONS
7.1 Basic measurements
The meter must perform energy and power measurements based upon the direct measurements of voltage and current. All meters must allow bidirectional measurements, thus enabling the measurement of energy flow from distributed generators. The following basic measurements are required, for each phase and total:
1. Cumulative imported and exported active energy 2. Cumulative imported and exported reactive energy in the four quadrants
7.2 Real time clock function and Time synchronization
The smart meter must have an embedded real time clock which is mandatory when implementing the following functionalities:
Management of multiple tariffs.
Log of events with time stamp
Load profile characterization The real time clock must have the following features:
24 hours’ time, international calendar
Hi precision / low drift (details to be given in technical specification)
Remote synchronization of date/time from the Centre with the log in the variation of setting
Battery back-up for continuous work of 10 years without supply
Clock anomalies must be logged in a status log
7.3 Management of multiple tariffs
The meter must support multiple tariffs (minimum 4) and registers to store all relevant data of consumption for each of the tariffs. The four basic tariffs can be used to create a complete yearly based tariff system according to the following structure:
Daily structure: a combination of each of the four tariffs can be assigned daily with minimum 5 segments.
Type of days: minimum 8. Each type of day can be assigned to each day in the week
Type of week: minimum 6 types of weeks, to be assigned according to the different seasons. Further details will be given in the technical specifications.
7.4 Load profiles
The meter must record and registers the load profile, which is the periodical acquisition of power values correlated with the corresponding time stamp. Active and reactive values will be collected with a defined acquisition period. The acquisition period must be settable by configuration. The default period is 15 minutes. The total capacity for load profile storage shall enable memorising load for at least forty days with an acquisition period of 15 minutes. However, the utility may specify additional storage of up to 12 months. Further details will be defined in the technical specification.

FINAL REPORT B3000838
Annex II – Minimum Functional Requirements Page 184
7.5 Integrated Display
The meter must have an integrated display with the following characteristics:
Well readable in all different environmental conditions
Area with digit for registered value
Indication of the Unit of the data value
Alphanumerical characters for indication of particular conditions, such as approaching of maximum contractual power, causes of disconnection of remote switch, OBIS codes, etc…
Indication of energy flow quadrant
Indication of presence of phases
Alphanumerical characters for indication of particular conditions, such as approaching of maximum contractual power, causes of disconnection of remote switch, data identifiers, etc…
The indication of values and correspondent Unit will be displayed according to a predefined order by means of a momentary push button or cyclically.
In case of meters with pre-paid credit management, information about residual credit and expected date of expiration, based upon average daily consumption, must be provided.
7.5.1 Support / Information for Customer / End User
The end user must have access only to that information which is useful for knowing his consumptions and gain awareness of how to reduce them. The following information is suggested to be shown:
General information:
Identification of unique Point of delivery
Instantaneous power
Current time and date
Cumulated energy consumption since meter installation
All symbols display, for display testing
Information for current billing period and for the previous one:
Tariff In Use
Instantaneous power
Cumulated energy consumption in the billing period
Energy consumption for each Tariff in Use
Peak power consumption
7.5.2 Information for testing or Operator
The Distribution Company operator can read detailed information from registries, using the push button and appropriate sequence. The information can be accessed also by means of the optical interface and dedicated Hand Held Unit.
7.6 External display. In-home monitor
The meter for Residential Customer must have the capability to drive an external display which will be installed in the end-user’s premises. The device is often called in-home Monitor. The in-home monitor can also replicate the messages generated by the meter connected. The information collected by the external display can be locally elaborated in order to supply to the end-user statistics on his habits, thus promoting the reduction of consumptions and the use of energy when tariffs are lower. The information can be also used to activate a future home gateway, programmed according to the end-user’s needs, which can selectively disconnect end-user’s loads according to predefined priorities.
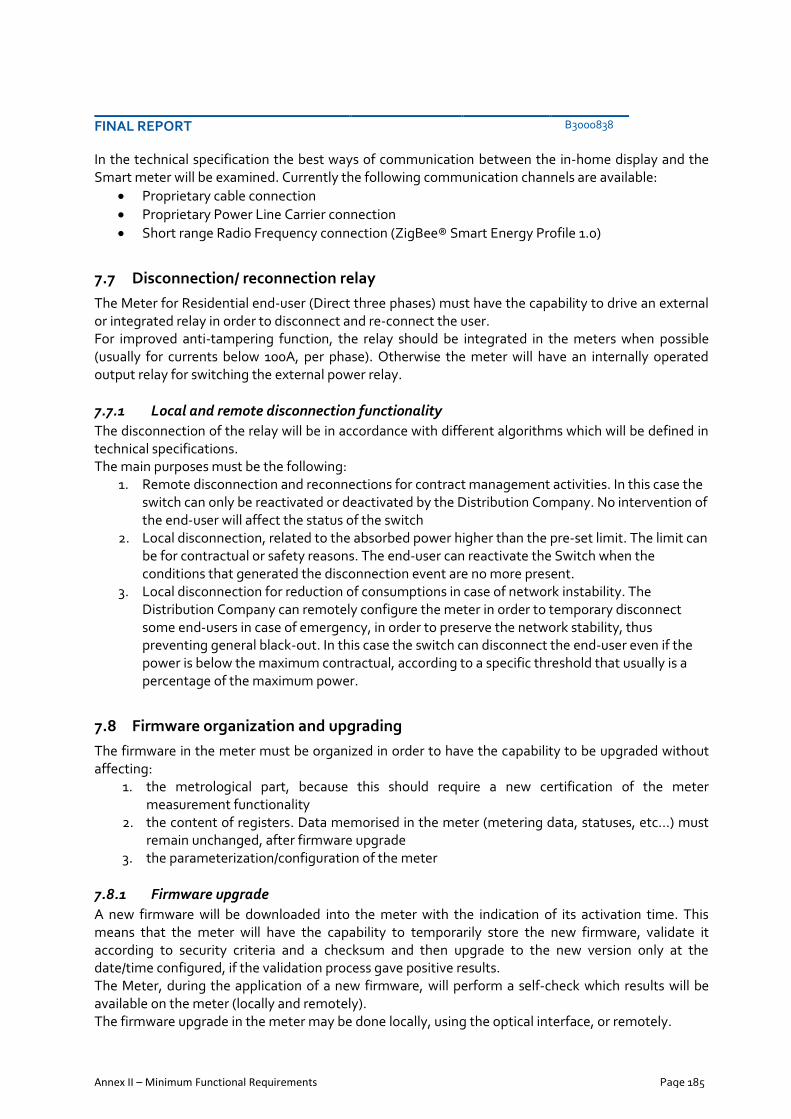
FINAL REPORT B3000838
Annex II – Minimum Functional Requirements Page 185
In the technical specification the best ways of communication between the in-home display and the Smart meter will be examined. Currently the following communication channels are available:
Proprietary cable connection
Proprietary Power Line Carrier connection
Short range Radio Frequency connection (ZigBee® Smart Energy Profile 1.0)
7.7 Disconnection/ reconnection relay
The Meter for Residential end-user (Direct three phases) must have the capability to drive an external or integrated relay in order to disconnect and re-connect the user. For improved anti-tampering function, the relay should be integrated in the meters when possible (usually for currents below 100A, per phase). Otherwise the meter will have an internally operated output relay for switching the external power relay.
7.7.1 Local and remote disconnection functionality
The disconnection of the relay will be in accordance with different algorithms which will be defined in technical specifications. The main purposes must be the following:
1. Remote disconnection and reconnections for contract management activities. In this case the switch can only be reactivated or deactivated by the Distribution Company. No intervention of the end-user will affect the status of the switch
2. Local disconnection, related to the absorbed power higher than the pre-set limit. The limit can be for contractual or safety reasons. The end-user can reactivate the Switch when the conditions that generated the disconnection event are no more present.
3. Local disconnection for reduction of consumptions in case of network instability. The Distribution Company can remotely configure the meter in order to temporary disconnect some end-users in case of emergency, in order to preserve the network stability, thus preventing general black-out. In this case the switch can disconnect the end-user even if the power is below the maximum contractual, according to a specific threshold that usually is a percentage of the maximum power.
7.8 Firmware organization and upgrading
The firmware in the meter must be organized in order to have the capability to be upgraded without affecting:
1. the metrological part, because this should require a new certification of the meter measurement functionality
2. the content of registers. Data memorised in the meter (metering data, statuses, etc…) must remain unchanged, after firmware upgrade
3. the parameterization/configuration of the meter
7.8.1 Firmware upgrade
A new firmware will be downloaded into the meter with the indication of its activation time. This means that the meter will have the capability to temporarily store the new firmware, validate it according to security criteria and a checksum and then upgrade to the new version only at the date/time configured, if the validation process gave positive results. The Meter, during the application of a new firmware, will perform a self-check which results will be available on the meter (locally and remotely). The firmware upgrade in the meter may be done locally, using the optical interface, or remotely.
FINAL REPORT B3000838
Annex II – Minimum Functional Requirements Page 186
7.8.1.1 Local firmware upgrade
The meter firmware must be upgradable also by remote via its local communication module. The AMM Centre or the Concentrator, if any, will deploy the new firmware on the meter. The process is executed in the manner not affecting at any time the data in the meter. Should the firmware upgrade process be interrupted or the new firmware corrupted, the meter will restore automatically the original (previous version) firmware. A firmware upgrade will be recorded in the meter Event Log.
7.8.1.2 Remote firmware upgrade
The meter firmware must be upgradable also by remote via its local communication module. AMM Centre or the Concentrator, when present, will deploy the new firmware on the meter. The process is executed in the manner not affecting at any time the data in the meter. Should the firmware upgrade process be interrupted or the new firmware corrupted, the meter will restore automatically the original (previous version) firmware. A firmware upgrade will be recorded in the meter Event Log.
7.9 Anti-tampering protection
The meter must have adequate protections against illegal attempts of access to internal parts and abusive connections which could invalidate the meter readings. The following protections are required:
Place for installing the distribution company seals on terminal covers. Any attempt to open the meter cover and the terminal cover of the meter should be revealed by the violation of the distribution company seal
Internal sensor (micro switch or any other suitable device) for monitoring the following attempts of tampering:
o Removal of the cable terminal cover, o Meter housing opening, o Meter dismantle, o Removal of meter from installation site
Magnetic sensor, in order to reveal any attempt of applying a strong magnetic field in order to distort the reading of the current flowing into the meter.
Thermal sensor for monitoring environmental conditions which could affect the readings Furthermore the meter should give reliable measurements even in case of phase inversion. The variation of the status of the sensors (at least for the ones related to violation of cover, meter removal and housing opening) must be recorded even when the meter is not supplied with main power (i.e. during temporary black-out).
7.10 Log and status of the meter
The meter must have status registries in order to store, with the timestamp, the occurred relevant events. The status registers contain the information for the diagnosis of the meter, such as:
Tampering attempts and Watchdog events
Permanent memory error
Battery fault
Real-time clock fault
hig ambient temperature and meter over-temperature

FINAL REPORT B3000838
Annex II – Minimum Functional Requirements Page 187
7.11 Security and privacy
Meter functionalities must prevent unauthorized access to the data and any modification of meters registries. The cumulative consumption registries cannot be modified, even by the Distribution Company. Access to registers must be protected using passwords and different authentication level. Bi-directional data transfer, including commands, must be protected with adequate encryption. All events related to the modification of the meter parameters and configuration and firmware update must be recorded in the meter internal log, with time stamp.
7.12 Stand-alone working modality of meter
The meters must guarantee, once installed and initialized, all the functionalities (monitoring, recording and display functions, including the time and date functions), even if the communications should be interrupted for whatever reason. The internally handled Data will be locally accessible via the optical interface, in case of missed communication functionality. Minimum data retention without power supply: 10 years.

FINAL REPORT B3000838
Annex II – Minimum Functional Requirements Page 188
8 QUALITY ASSURANCE
The production of smart meters must be in accordance with quality assurance best practices. The Supplier must provide a production plan with procedures for verification tests on production tests and determination.
8.1 Warranty
Supplied devices must be guaranteed against all defects for two years after installation or three years after delivery, whichever comes first.
8.2 Product life cycle
The Production of the devices initially supplied must be guaranteed for at least fifteen years. Alternatively, the compatibility with next generation products must be assured by the Supplier.
8.3 Spare parts
The supply of spare part must be available for the whole expected life of the devices.
8.4 Procedure for calibration
The Supplier must provide procedures for the periodical check of meter accuracy and the proposed schedule (re-calibration of digital meters is not usually required).

FINAL REPORT B3000838
Annex II – Minimum Functional Requirements Page 189
9 CLASSIFICATION OF CUSTOMERS AND TYPES OF INSTALLATION IN KSA
A classification of the typology of Customers and installation, can guide the definition of the requirements for data communication between the meters and the Centre The particular topology of the distribution in Kingdom of Saudi Arabia suggests the following classification of Customers and installation, according to the typology and the use of electric energy.
1. Residential Customers, on LV, in a collective building, urban area or medium density area 2. Residential Customers in individual building, urban or medium density area 3. Residential Customers in rural area or low density area 4. Commercial and small industrial Customers, on LV 5. Customers on MV (Industrial)
The basic assumption for the following considerations is that there is no direct internet connection, or can’t be used, for the communication between the meter and the Centre. In case of availability of any type of internet connection, it will be used for the connection between the Concentrator and the Centre, thus reducing the amount of data.
9.1 “Case 1”, Residential Customers, on LV, in a collective building, urban area
“Case 1” is related to meters often grouped by same substation(s) or under the same building. From the communication perspective, the meters can be connected to a concentrator, which, in turn, is then connected to the main Centre using a different media. Connections between meter and Concentrator can be implemented using the following media:
a local bus, cheaper solution, requires that meters are all located in the same room or at short distances. Connection line must be protected against tampering and sniffing attaches
PLC communication using the LV network from LV transformer to Customers’ meters. The PLC requires modems to be installed both at modem and at concentrator sides. PLC modem can be affected by noise on the network, but are generally cheaper both in investment and operational costs than the GPRS modem
Short range radio frequency. This is more subjected to obstacles and topology than other media
When possible the adoption of PLC technology will assure reduced costs of infrastructure and operation.
9.2 “Case 2”, Residential Customers in individual building, urban or medium density
area
“Case 2” is related to meters which are under the same LV transformer even if installed in different houses. From the communication perspective, the meters can be connected to a concentrator via the following media:
PLC communication using the LV network from LV transformer to Customers’ meters. The PLC requires modems to be installed both at modem and at concentrator sides. PLC modem can be affected by noise on the network, but are generally cheaper both in investment and operational costs than the GPRS modem.
Short range radio frequency. This is more subjected to obstacles and topology than other media.
When possible the adoption of PLC technology will assure reduced costs of infrastructure and operation.

FINAL REPORT B3000838
Annex II – Minimum Functional Requirements Page 190
9.3 “Case 3”, Residential Customers in rural area or low density area
“Case 3” is related to meters installed in area with low density of the habitants. Often there are few or even one single meter connected to the LV transformer. From the communication perspective, the meter can be connected with the Centre via the following media:
GSM/GPRS modem
Long distance PLC on medium voltage
Dedicated Radio frequency link
GSM internet using satellite connection If the area is covered by the GSM / GPRS signal, this is the preferable media, because there are practically no costs for infrastructure. The long distance PLC on medium voltage technology must be evaluated both from technical and economical point of view. The dedicated Radio frequency link is a quite expensive technology, requiring infrastructure. It could be considered in case of bringing to Customer also other services, like telephone services. The GSM internet connection can be a valid option with affordable costs, especially if the connection can be used for reading of some meters. In some cases classified as “Case 3” the communication with the Centre could be feasible economical or technical. In such cases, the implementation of pre-paid meters can be considered. In many Countries the pre-paid meter has been welcome, since it offers many advantages both to Customers and for Distribution Company, first of all the Customer’s awareness of his real consumptions and expenses and no more invoices based on estimated consumptions. A back-up satellite connection could also be considered.
9.4 “Case 4”, Commercial and small industrial Customers, on LV
“Case 4” is related to meters installed as stand-alone, mostly with a dedicated transformer. The connection to the Centre doesn’t require a Concentrator, and can be realized, according to the coverage via the following media:
GSM/GPRS modem
Long distance PLC on medium voltage
GSM internet using satellite connection
Direct internet connection The GSM/GPRS connection can be considered as the standard connection, when available. The satellite connection can be used in isolated cases. The long distance PLC and direct internet connection require that the meter has a LAN port.
9.5 “Case 5”, Customers on MV (Industrial)
“Case 5”, from the meter connection perspective, is similar to Case 4 related to meters installed as stand-alone, with a dedicated feeder. The functional requirements in next chapter consider the above possible communication alternatives, prescribing data communication ports which can be connected to different types of modems and

FINAL REPORT B3000838
Annex II – Minimum Functional Requirements Page 191
adapters. Furthermore the possibility to collect readings from different types of meters for the same Customer (i.e. water meter, etc…) is considered.
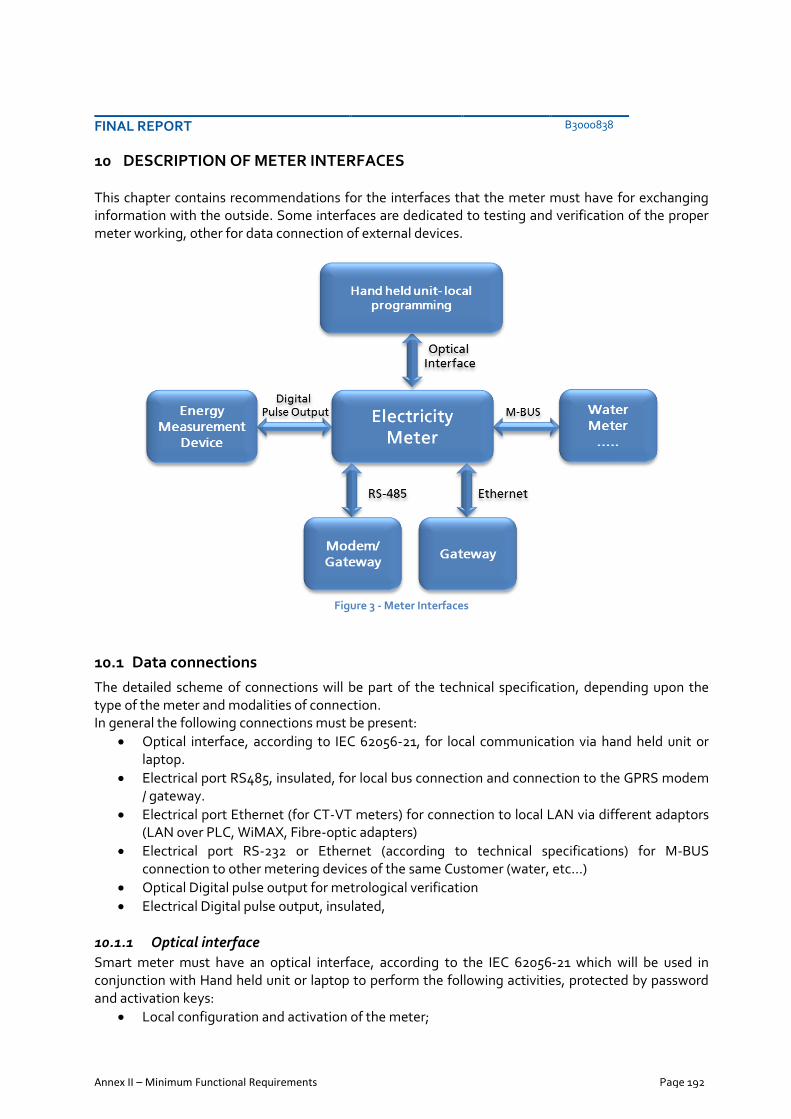
FINAL REPORT B3000838
Annex II – Minimum Functional Requirements Page 192
10 DESCRIPTION OF METER INTERFACES
This chapter contains recommendations for the interfaces that the meter must have for exchanging information with the outside. Some interfaces are dedicated to testing and verification of the proper meter working, other for data connection of external devices.
Figure 3 - Meter Interfaces
10.1 Data connections
The detailed scheme of connections will be part of the technical specification, depending upon the type of the meter and modalities of connection. In general the following connections must be present:
Optical interface, according to IEC 62056-21, for local communication via hand held unit or laptop.
Electrical port RS485, insulated, for local bus connection and connection to the GPRS modem / gateway.
Electrical port Ethernet (for CT-VT meters) for connection to local LAN via different adaptors (LAN over PLC, WiMAX, Fibre-optic adapters)
Electrical port RS-232 or Ethernet (according to technical specifications) for M-BUS connection to other metering devices of the same Customer (water, etc…)
Optical Digital pulse output for metrological verification
Electrical Digital pulse output, insulated,
10.1.1 Optical interface
Smart meter must have an optical interface, according to the IEC 62056-21 which will be used in conjunction with Hand held unit or laptop to perform the following activities, protected by password and activation keys:
Local configuration and activation of the meter;

FINAL REPORT B3000838
Annex II – Minimum Functional Requirements Page 193
Local retrieve of meter readings and configuration;
10.1.2 RS-485 - Local bus
The meter must be equipped with two RS-485 insulated ports for local connection to another meter and to the Data concentrator (gateway) for communication with the centre. The local bus will be used for connections among the meters located in the same room (for example the meter room in case of collective building) and the connection with the gateway, which, acting as the master of the local bus, will query information and send commands on meter (one at a time) and propagate the information to the centre. The Data concentrator can use GPRS technology, LAN or PLC. In case of stand-alone meters, the RS-485 will be used for direct connection to the modem, which can be PLC or GPRS. The communication part of the meter must be designed in order to allow simultaneous communication of the meter through all meter interfaces, without any effect on the metrological part of the meter. The RS-485 communication port will have priority over the other communication ports.
10.1.3 M-bus
The M-bus port (Electrical interface) will be used for connection of the electrical meter with other metering devices (water meter, gas meter, air conditioning meter, etc…). This port allows the Electricity meter to be the local gateway which collects measures of the other types of meter and transfer them to the Centre, that will manage the information according to the different service providers (Water, Electricity, etc…). This will allow integration of different metering devices pertaining to the same customer.
10.1.4 Digital Output for impulse test, consumption monitoring and future external device for
load management
The meter must have a digital impulse output for testing the measurements. Usually the impulse output is connected to the test bench for metrological verification. The same output could in future be connected to an external device for management of Customer’s loads, bases on the overall consumption measured by the meter itself.
10.1.4.1 Impulse (Test) Terminals
The meter must have optical impulse outputs, via a red LED. Reference standard: IEC 62053 – 31. There will be one optical pulse output for active energy and one for reactive energy. The meter can also have an optional electrical output, with galvanic insulation. Reference standard: IEC62052 – 11
10.1.4.2 Meter Constant
Meter constant is expressed by the number of impulses per energy unit (imp/kWh or imp/kVArh). The meter constant will be defined in technical specifications and reported on the meter permanent label.

FINAL REPORT B3000838
Annex II – Minimum Functional Requirements Page 194
11 COMMUNICATION FUNCTION AND PROTOCOLS
All the data collected from the meter must be transferred to the Centre in order to be properly used. Furthermore, the Centre must be able to send commands to the meters in order to perform changes in meter parameterization, clock alignment and remote disconnections. Thus, the meter must provide both local and remote communication functions. Communication between the meter and different devices, both local and remote (handheld terminals, communication modules, data concentrators, etc.), is performed via the interfaces described in the previous chapters. A very important topic is related to the choice of the proper suite of protocols. The choice of a specific suite of protocols greatly influences the way of representation of data, the messages format and associated payload, the physical mediums to be used for the exchange of data, etc...
11.1 Proprietary versus standardized suite of protocols
There are two main classes of suite of protocols, the proprietary ones and the standardized. Some protocols, especially the proprietary ones, can be more oriented to reduce payload and thus increasing the efficiency of data transmission, but being not (or partially) standardized can obstacle the adoption from different Manufacturers. In these years the standardization of protocols, often pushed by regulatory agencies and international mandates, is growing. It happens that an initially proprietary protocol is “opened” to the market by the developer, by creating associations and consortiums, trying to increase the number of Manufacturers that will adopt it instead of developing a new one. This can be a good starting point for the development of a field-proof technology, which can then be proposed to the standardization bodies. The standardization process is quite long because it has to generalize and include different technologies and principles. Furthermore different standardization bodies are oriented to different protocols. The adoption of an open standard and of a standardized suite of protocols, pave the way to the interoperability and even to interchangeability of meters coming from different manufacturers. In order to have future-proof functional requirement for meters, the proposed architecture for communication is open, especially for integration of new communication devices. Given the wide acceptance on meter market of the standards with a data modelling according to COSEM and previous experience of the pilot project in KSA, the IEC 62056 is considered as the reference guide in the definition of the requirement for communication of smart metering in KSA. The IEC 62056 also offers security functions for Access, Authentication and Encryption.
12 CONSIDERATIONS ON STATUS OF IEC 62056
Many meter associations adopted the IEC 62056 suite of standards with OBIS (Object Identification System) for the higher levels of the communication stacks and data modelling/handling. The meter Manufacturers often differentiate in the implementation of the lower level of protocols, especially for the PLC transmission of data on the LV network. The IEC 62056 suite of standard includes some mature standards and some others which are under the evaluation/approval process after having been proposed by different associations and Manufacturers.

FINAL REPORT B3000838
Annex II – Minimum Functional Requirements Page 195
Figure 4 - IEC 62056 suite of protocols. Source: IEC.
In particular, the PLC physical layer in the IEC 62056 has different potential suitable implementations, some of which supported by many Manufacturers. Currently the IEC 62056 suite of standards is on the path to harmonize the differences in one Omni comprehensive suite. The principle is to have mainly the communality at Data Modelling level and adopting different technologies from levels L1 to L7 of the stack, supporting the COSEM.
Figure 5 - Current situation for the communication profiles. Source: IEC.
The list and the conformance tests are periodically updated. Any Manufacturer has the possibility to create new OBIS codes for addressing new objects; the use of those OBIS is incompatible with the one of different Manufacturers.

FINAL REPORT B3000838
Annex II – Minimum Functional Requirements Page 196
The higher levels of IEC 62056 are transversal to the different physical mediums. The COSEM objects are almost the same (apart from the objects dedicated to the physical layers that hopefully will be unified), with differentiation of intermediate levels which are necessary to adapt the lower levels (medium dependent) from the higher levels. The use of use IPv4, UDP/TCP with GPRS, LAN and Wi-Fi (which are fully standardized) can be considered as stable, allowing meters of different Manufacturers using these media to be interoperable, if they adopt the same COSEM data modem and same OBIS codes. The M-Bus is defined and can be used, relying on the objects in the data model, for accessing different type of metering devices, like water meters. The PLC implementation is only partially defined, even if many different proposals are officially under examination. Currently the following PLC techniques are considered, even if not all of them are integrated in the suite:
PLC S-FSK, defined
PLC OFDM, type 1 (also known as PRIME)
PLC OFDM, type 2 (also known as G3)
PLC PSK, SMITP (also known as Meters and More). Some others are under proposal, like the KEPCO hi-speed DMT PLC. At the moment, the IEC 62056 suite is in evolution. With reference to the same kind of data modelling, different technologies with profiles covering all protocol stacks could be presented.
12.1 Open standards and associations
Several open standard and associations have been established around the world. Here follows describes some example of associations (and standard) among others: OPENmeter (European Project. www.openmeter.com): “The result of the project is a set of draft standards, based on already existing and accepted standards wherever possible. These standards include the IEC 61334 series PLC standards, the IEC 62056 DLMS/COSEM standards for electricity metering, the EN 13757 series of standards for utility metering other than electricity using M-Bus and other media.” Prime Alliance www.prime-alliance.org “The end objective of PRIME (Power line Related Intelligent Metering Evolution) is to establish a complete set of standards on an international level that will permit interoperability among equipment and systems from different manufacturers.” IDIS (www.idis-association.com) “The IDIS association develops, maintains and promotes publicly available technical interoperability specifications, known as ‘IDIS specifications’, based on open standards and supports their implementation in interoperable products.” G3 (www.g3-plc.com) “G3-PLC enables the high-speed, highly reliable communications on existing power lines needed to make the "energy Internet" a reality”

FINAL REPORT B3000838
Annex II – Minimum Functional Requirements Page 197
Meters and more (www.metersandmore.com) “The main goal of the Association is to provide the industry with a proven open protocol for smart metering, thus being a tangible answer to the European Commission’s Mandate 441 to achieve standard AMM solutions across the continent.”
12.2 Interoperability and interchangeability
The wider definition of interoperability considers the possibility to substitute (remove and replace) meters in whatever site of installation with the guarantee the previous performances of the system. This definition is also referred to as “interchangeability”. The perfect interchangeability of meters coming from different Manufacturers requires a fully defined and agreed set of functionalities and specifications, from the higher levels of the stack defined in the suite of protocols to the lower levels of communication (and implemented data model). The adoption of an open standard (including the suite of protocols and the data modelling) can greatly help the interoperability and even to interchangeability of meters coming from different manufacturers. On the opposite, even adopting the same suite of protocols the interoperability can’t be assured. Problems of interoperability can arise even on same physical medium or even the same type of modulation. Many different types of PLC are using different frequencies and modulation and they are not compatible and hence not interoperable. The interoperability can be achieved at different levels of the AMI architecture.
12.2.1 Interoperability at “meter level”
The complete interoperability can be achieved at meter levels. This means that meters of different manufacturers, even operating under the same concentrator, if used, can work without reciprocal affecting the functionalities, including communication. An even stronger constrain defines the interoperability as interchangeability, thus requiring that the replacement of a meter from one manufacturer with another of a second manufacturer will allow the complete interactions among the new meters, thus including the services at lower levels, such as the repeater mechanism. This is particularly hard to be obtained in residential meters with concentrators.
12.2.2 Interoperability at “concentrator level”
The interoperability releases some of the constraints of the one at meter level, since the communication between meters and concentrator can be freely defined and adopted, while the concentrators of different Manufacturers must adopt a common way of communication with the AMM centre.
12.2.3 Interoperability at “AMM level”
This level is the one with less constraints, since the AMM software will be in charge of requesting information and sending commands according to different standards, thus practically integrating system which otherwise are completely incompatible.
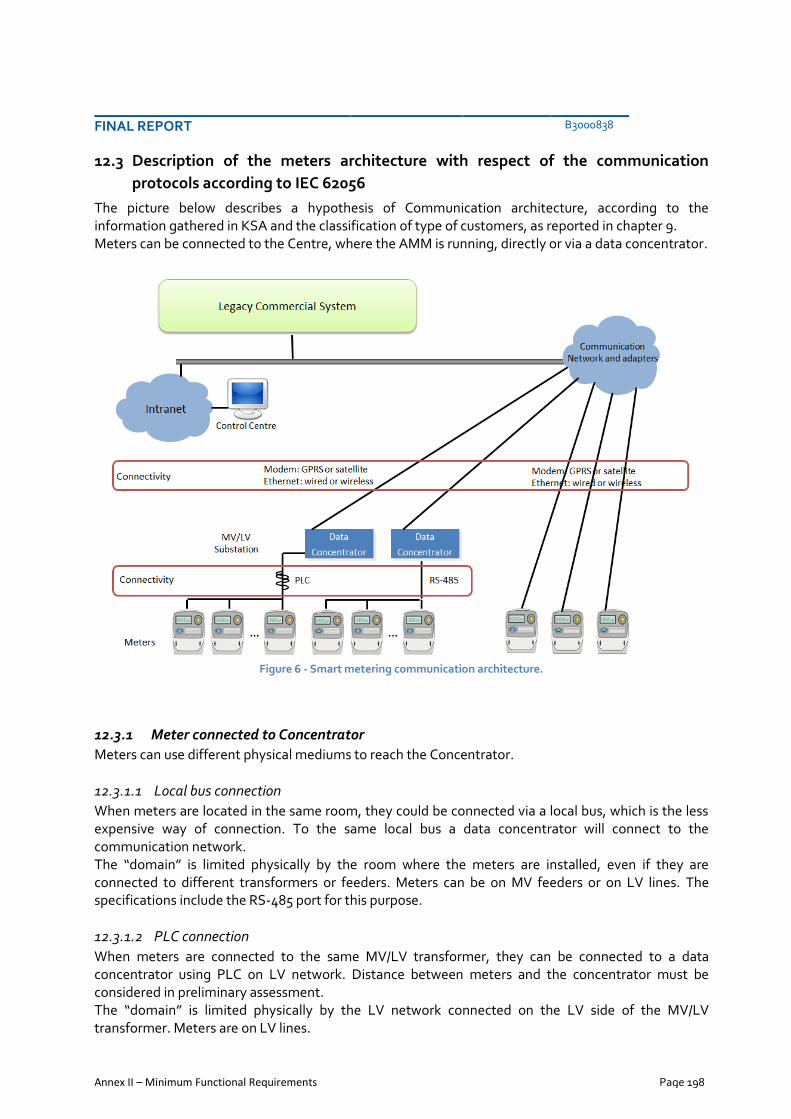
FINAL REPORT B3000838
Annex II – Minimum Functional Requirements Page 198
12.3 Description of the meters architecture with respect of the communication
protocols according to IEC 62056
The picture below describes a hypothesis of Communication architecture, according to the information gathered in KSA and the classification of type of customers, as reported in chapter 9. Meters can be connected to the Centre, where the AMM is running, directly or via a data concentrator.
Figure 6 - Smart metering communication architecture.
12.3.1 Meter connected to Concentrator
Meters can use different physical mediums to reach the Concentrator.
12.3.1.1 Local bus connection
When meters are located in the same room, they could be connected via a local bus, which is the less expensive way of connection. To the same local bus a data concentrator will connect to the communication network. The “domain” is limited physically by the room where the meters are installed, even if they are connected to different transformers or feeders. Meters can be on MV feeders or on LV lines. The specifications include the RS-485 port for this purpose.
12.3.1.2 PLC connection
When meters are connected to the same MV/LV transformer, they can be connected to a data concentrator using PLC on LV network. Distance between meters and the concentrator must be considered in preliminary assessment. The “domain” is limited physically by the LV network connected on the LV side of the MV/LV transformer. Meters are on LV lines.

FINAL REPORT B3000838
Annex II – Minimum Functional Requirements Page 199
Since the PLC communication is not completely defined in the IEC 62056 suite, the functional requirements prescribe that the meter should have a dedicated space in the housing dedicated to the installation of a PLC modem, which will communicate with the meter via the above mentioned RS-485.
12.3.2 Meters directly connected to the communication network
Some meters will be connected directly to the communication network using existing infrastructure or dedicated ones. These meters are usually installed in remote areas or for Commercial and industrial Customers, where there is no possibility to aggregate the meter data towards a concentrator. The following modalities are foreseen:
GSM/GPRS or satellite modem
Wired or wireless Ethernet. The specifications include the RS-485 port for connection of modems and Ethernet port for connection to Ethernet devices and interfaces.
12.3.3 Data Concentrators connected to the communication network
The data concentrator which gathers information from the meters, and sends commands to them, must be connected to the communication network. The communication path between the concentrator and the meters can be implemented using PLC communication or a local bus, depending on the installation. The Concentrator will be then connected directly to the Main Communication network according to the following modalities:
GSM/GPRS or satellite modem
Wired or wireless Ethernet. The specifications include the RS-485 port for connection of PLC modem and local bus and Ethernet port for connection to Ethernet devices and interfaces.
12.3.4 The main requirements of meters, Concentrator and AMM related to IEC 62056
As indicated in chapter 12, the higher levels of IEC62056 are transversal to the different physical mediums. Apart from those objects related to the physical layers, that hopefully will be unified, the COSEM objects are common to the different physical mediums. Some differentiations in the intermediate levels of the stack are necessary to adapt the lower levels (medium dependent) from the higher levels. (Figure 5).
12.3.4.1 COSEM data objects and OBIS codes
The meter should use the OBIS codes and the data classes in order to facilitate the interoperability and exchange of information between meters and AMM. A reference to the release of OBIS code will be detailed in technical specifications. Furthermore, the meter manufacturers could optionally implement custom OBIS codes for additional functions, but this should not affect the behaviour of the system, excluding the integration of meters from different Manufacturers which use the predefined OBIS codes. The following minimum reading and writing functions must be assured:
Reading of single registers using the OBIS identification system
Read and write time & date
Reading of billing load profile data
Reading of power quality profile data

FINAL REPORT B3000838
Annex II – Minimum Functional Requirements Page 200
Reading of log file data
Connect and reconnect of the relay
12.3.4.2 IP v4 physical medium
The above requirements allow the definition of technical specification of interoperable meters with communication via IP, UDP/TCP with GPRS, LAN and Wi-Fi (Ethernet wired or wireless).
12.3.4.3 PLC modulation
Part of the COSEM data model will depend on the chosen PLC modulation. The PLC communication is suggested only for LV network with meters grouped under the same transformer. The choice of a particular modulation and set of frequencies must be done after assessment activities on the field, keeping in consideration the current level of standardization and the performances on field of different types of PLC modems. The performance tests in the selected area will allow a direct comparison of the performances. The performance tests can be done choosing the candidates among the PLC techniques described in chapter 12. The Functional requirements in chapter 10.1define the electrical interfaces of the meters in owither to be able to interface on different types of PLC modems.
12.3.4.4 Interoperability among products from different Manufacturers
Interoperability must be performed at least at the “concentrator level” (as defined in chapter 12.2). This means that, waiting for full standardization, the meters under the same concentrator will be of the same Manufacturer. From the concentrator, the communication medium is IP based (GPRS, Wi-Fi or fibre optic, when it will be available). Data concentrator will use the same data model thus being accessed in the same way from the AMM. Meters directly connected to the AMM, via GPRS, LAN, adopting the same data model, objects and OBIS codes as prescribed in 12.3.4.1, will be interoperable. Interoperability issues which should arise among different Manufacturers will be solved in the “front end” of the AMM software, which can talk with different type of meters and concentrators using different objects and methods according to COSEM OBIS.
12.3.4.5 General considerations
The communication infrastructure can include different communication mediums, but interoperability issues can arise in the domain of some of them, since they are not fully standardized. The recommendations preserve the investment of the meters and concentrators, if used, with the following measures:
Adoption of a widespread suite of protocols, with stable definition of some communication profiles, even if with parts that are still under revision.
Upgradable firmware, in order to update the meters to further developments and bugs correction
PLC modem not integrated, in order to be replaced with different types.
Standard electrical data connections which can be used for interfacing current and future types of communication devices;
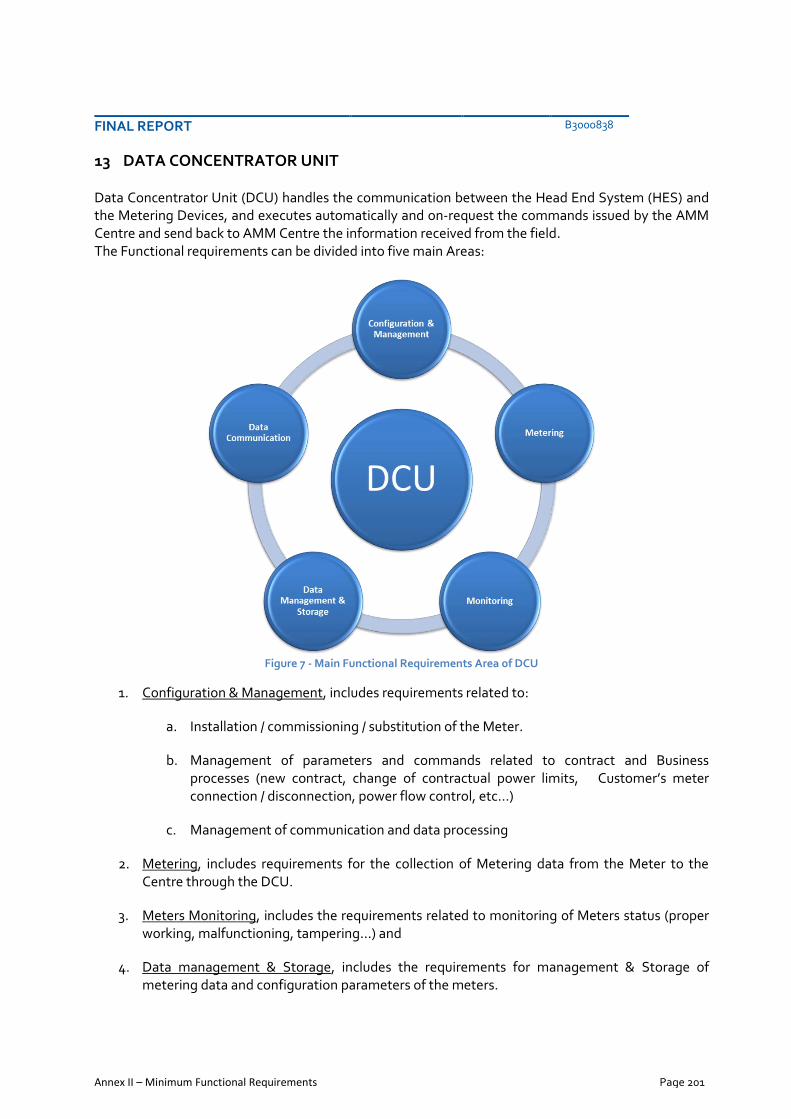
FINAL REPORT B3000838
Annex II – Minimum Functional Requirements Page 201
13 DATA CONCENTRATOR UNIT
Data Concentrator Unit (DCU) handles the communication between the Head End System (HES) and the Metering Devices, and executes automatically and on-request the commands issued by the AMM Centre and send back to AMM Centre the information received from the field. The Functional requirements can be divided into five main Areas:
Figure 7 - Main Functional Requirements Area of DCU
1. Configuration & Management, includes requirements related to:
a. Installation / commissioning / substitution of the Meter.
b. Management of parameters and commands related to contract and Business processes (new contract, change of contractual power limits, Customer’s meter connection / disconnection, power flow control, etc…)
c. Management of communication and data processing
2. Metering, includes requirements for the collection of Metering data from the Meter to the Centre through the DCU.
3. Meters Monitoring, includes the requirements related to monitoring of Meters status (proper working, malfunctioning, tampering…) and
4. Data management & Storage, includes the requirements for management & Storage of metering data and configuration parameters of the meters.

FINAL REPORT B3000838
Annex II – Minimum Functional Requirements Page 202
5. Data Communication includes the functional requirements for communication between the AMM and DCU and between DCU and Meters.
13.1 Functional Requirements – Data Concentrator Unit
Requirement Functionality Functionalities for Configuration & Management
1 Execution of commissioning, research/query, status check, decommissioning process of the meters.
2 Receive commands, setting, software updates from AMM Centre and forwarding them to meters (to a single one, all or a subset)
3 Administration and management of the DCU.
4 Operation Indicators
Functionalities for Metering
5 A collection of readings from Meter (periodically or on-demand), elaboration and sending to the AMM Centre of clustered data
Functionalities for Meters Monitoring
6 DCU must be able to monitor and record events and alarms detected by a meter (e.g. temperature alarm).
Functionalities for Data Management & Storage
7 The DCU shall have sufficient memory to store resident software and data for all the meters commissioned under it (up to 1 year data).
Functionalities for Data Communication & Interfaces
8 Communication with Meters
9 Communication with AMM Centre
10 Secure Communication AMM-DCU-Meters
Functionalities for Configuration & Management
13.1.1 Functionality 1: Execute commissioning, research/query, status check,
decommissioning of the meters
DCU, after meter installation, must recruit them in its domain or sub-network. This task is often called “commissioning” and requires several actions to be executed by DCU:
1. Commissioning: The initial step in which the DCU detects the new Meter and enables communication with it and notifies this event to the AMM.
2. Research/query: DCU must include the functionality to initiate the process of meter recruitment in its sub network and forward messages and responses from meters to AMM and vice-versa.
3. Status Check: The concentrator must verify the status of the meters
4. Decommissioning: This command allows the exclusion of selected meter(s) from the ones in its network. The DCU must then notify the result to the AMM Centre.
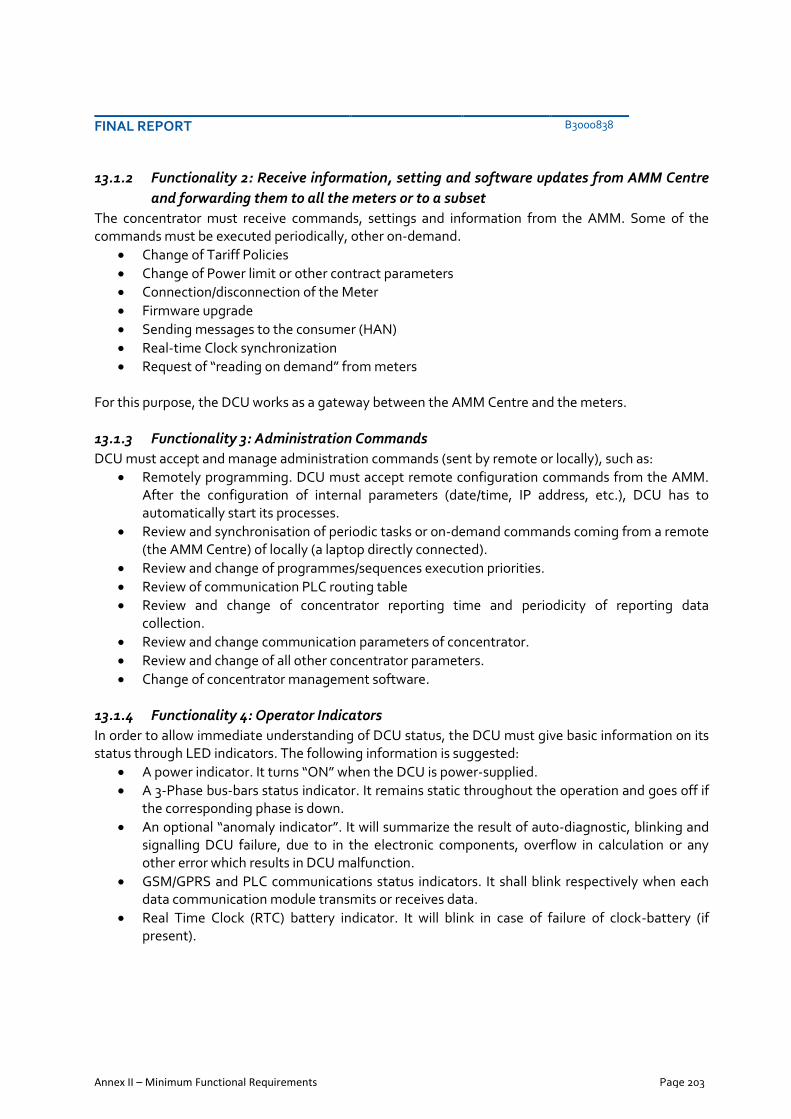
FINAL REPORT B3000838
Annex II – Minimum Functional Requirements Page 203
13.1.2 Functionality 2: Receive information, setting and software updates from AMM Centre
and forwarding them to all the meters or to a subset
The concentrator must receive commands, settings and information from the AMM. Some of the commands must be executed periodically, other on-demand.
Change of Tariff Policies
Change of Power limit or other contract parameters
Connection/disconnection of the Meter
Firmware upgrade
Sending messages to the consumer (HAN)
Real-time Clock synchronization
Request of “reading on demand” from meters For this purpose, the DCU works as a gateway between the AMM Centre and the meters.
13.1.3 Functionality 3: Administration Commands
DCU must accept and manage administration commands (sent by remote or locally), such as:
Remotely programming. DCU must accept remote configuration commands from the AMM. After the configuration of internal parameters (date/time, IP address, etc.), DCU has to automatically start its processes.
Review and synchronisation of periodic tasks or on-demand commands coming from a remote (the AMM Centre) of locally (a laptop directly connected).
Review and change of programmes/sequences execution priorities.
Review of communication PLC routing table
Review and change of concentrator reporting time and periodicity of reporting data collection.
Review and change communication parameters of concentrator.
Review and change of all other concentrator parameters.
Change of concentrator management software.
13.1.4 Functionality 4: Operator Indicators
In order to allow immediate understanding of DCU status, the DCU must give basic information on its status through LED indicators. The following information is suggested:
A power indicator. It turns “ON” when the DCU is power-supplied.
A 3-Phase bus-bars status indicator. It remains static throughout the operation and goes off if the corresponding phase is down.
An optional “anomaly indicator”. It will summarize the result of auto-diagnostic, blinking and signalling DCU failure, due to in the electronic components, overflow in calculation or any other error which results in DCU malfunction.
GSM/GPRS and PLC communications status indicators. It shall blink respectively when each data communication module transmits or receives data.
Real Time Clock (RTC) battery indicator. It will blink in case of failure of clock-battery (if present).

FINAL REPORT B3000838
Annex II – Minimum Functional Requirements Page 204
Functionalities for Metering
13.1.5 Functionality 5: Collect reading from Meter, elaboration and sending to the AMM
Centre of clustered data
The Concentrator is in charge of reading the meters recruited under its domain. Since DCU is a gateway between the AMM and the Meters, it must be configurable according to perform periodic and on-demand tasks:
Number of Meter to be read: DCU must be able to read all meters, a subset of their or a single meter
Periodicity of readings: DCU must read the meters periodically (automatically) or on-request
Reading Information to collect from Meters: DCU must collect all the information which the meter can collect. Among others:
o Daily states of registers o Meters status o Electricity supplies quality register o Event logs o Load profile (minimum 3 months, up to 1 year) o Hourly states of registers o States of monthly accounting registers o Time and date o Effective current values per phases at the moment of reading o Effective voltage values per phases at the moment of reading o Instantaneous power
DCU must be able to read and set the meter parameters: o Tariff programme o The integration period of 15-minute maximum power o Consumption management parameters o Parameters for voltage thresholds within electricity quality log (read only) o Parameters for time intervals of profiles o Parameters for registers within profiles o Parameters related to data presentation of meter display o Archive states of accounting registers (read only) o Meter software version (read only) o Factory number and type of meter (read only)

FINAL REPORT B3000838
Annex II – Minimum Functional Requirements Page 205
Functionalities for Meters Monitoring
13.1.6 Functionality 6: DCU must be able to monitor and record, detected events, alarms of a
meter
The software of DCU, in addition to receive and interpret commands from the Centre and to read data and send information back to the AMM Centre as primary functions, must immediately send a warning signal to the AMR/AMM server for any anomaly pertaining both to the DCU or to the Meters in its domain (spontaneous messages towards the Centre). The minimum set of the “processing activities” are:
Compression of data collected from the meter before sending to AMM
Event detection, logging and communication with the Centre
Sending Alarm messages (including high ambient temperature and meter over-temperature)
Communication/ connection control
Status of Meters Compression of data collected before sending to AMM In order to reduce WAN bandwidth usage, when the DCU collects massive data from Meters must compress data coming from the field with a compression algorithm, before sending to AMM Centre. Event detection, logging and communication with the Centre DCU must collect and log all events detected by the Meters and then send them to the AMM Centre. These events could be divided in two categories:
Commands-related Events: o feedback on the execution of settings update, o change of settings related to contract parameters o etc…
External Events: o poor communication, o no response from meter, o detection of tampering activities o etc...
Sending Alarm messages Alarm messages related to preselected events must be collected and time stamped by DCU and finally sent to the AMM Centre. Example of alarm messages is: DCU cover opening, high temperature, high ambient temperature, voltage error level, disruption of meters data integrity attempts, meter tampering attempts, meter reprogramming attempts, battery fault, real-time clock fault. Status of Meters DCU must verify, periodically or “on AMM Centre request”, the status of meters. In case of any issue, the DCU must send to the Centre an alarm event with indication of the status of meter(s) together with time stamp.

FINAL REPORT B3000838
Annex II – Minimum Functional Requirements Page 206
Functionalities for Data Management & Storage
13.1.7 Functionality 7: The DCU shall have sufficient memory to store resident software and
data
Memory for storage of resident software: the Concentrator must be equipped with memory for software storage with enough free space to store future upgrades of the software. As a general recommendation at least one third of its capacity must be free for future upgrading. Concentrator must have sufficient storage space therefore data storage (archiving) function reliably should store all read data for at least 12 months, for at least 250 meters. The memory shall be scalable / upgradeable.
Functionalities for Data Communication
Data Concentrator Unit is a gateway between the domain of meters and the AMM. Thus it must be equipped with bidirectional communication devices in order to transfer messages and commands between meters (one side) and AMM (second side).
On one side there are electricity meters, located in the substation region where the concentrator is also installed. Communication with meters uses PLC (Power Line Carrier).
On the second side, DCU communicates with AMM Centre. Communication with AMM Centre employs GRPS communication or LAN via Ethernet.
13.1.8 Functionality 8: Communication with Meters
Bidirectional communication among DCU and Meters allow:
The DCU to send setting/commands to the Meters
The Meters to send Consumptions/Status information to DCU
Figure 8 - DCU-Meters Communication
The concentrator must be equipped with PLC modem compatible with the one installed in the Meters, enabling communication between the concentrator and the meter.

FINAL REPORT B3000838
Annex II – Minimum Functional Requirements Page 207
Communication function with meters must support a fully automated “repeater mechanism” with optimal communication path discovery function. The Concentrator must memorize the communication route (topology) towards every meter in its network and submits this information locally or remotely. It goes without saying that PLC technology has to support operations with repeaters. Every communication module on meters also has to operate as a repeater, without any additional device. Communication function has to offer information online quality such as signal/noise ratio, attenuation and data loss statistics.
13.1.9 Functionality 9: Communication with AMM Centre
13.1.9.1 Communication technology scenarios
Communication between the concentrator and the AMM centre must be designed in order to consider the future evolution of communication technologies and the expansion of the communication network. The following scenarios for the communication between Concentrator and AMM can be considered.
1. Availability of private local data network (according to different technologies)
2. Availability of public data network
3. Availability of UMTS /GPRS network. The availability of a private data network allows the complete independence from other providers and assures the control and the availability of the network. The private data network requires many efforts both for investments and maintenance. Usually is implemented in case that future uses are foreseen. Future plans of Distribution Company could include the installation of fibre-optic connections between the substation and some centralized points, thus creating a private data network. Another option could be the adoption of PLC broadband communication on MV lines, for the data connection of the LV substation. If a meshed network based on Wi-Fi communication will be set-up, with good coverage and level of security in the areas where the Concentrators will be installed, it could be used. In this case the AMI system will employ the public data network, on a dedicated VPN. At the current status of the technology and diffusion of communication media, the use of GPRS communication is envisaged as the most usable and stable. Broadband wireless technologies, based upon 3G (WCDMA), 4G (LTE) could also be employed. Also in this case a dedicated VPN will simplify the protection of the dedicated network.

FINAL REPORT B3000838
Annex II – Minimum Functional Requirements Page 208
Figure 9 - DCU-AMM Communication
13.1.10 Functionality 10: Secure Communication AMM-DCU-Meters
The Concentrator must support communication encryption with meters and AMM Centre. Two fundamental security items to be implemented are:
1. Secure authentication of Meters on DCU through a private key for each one. (i.e. Advanced Encryption Standard algorithm)
2. Secure communication between AMM Centre and DCU through utilization of encryption data algorithm. (i.e. SSH algorithm)
3. Secure communication between DCU and Meters through utilization of encryption data algorithm (i.e. Advanced Encryption Standard algorithm)
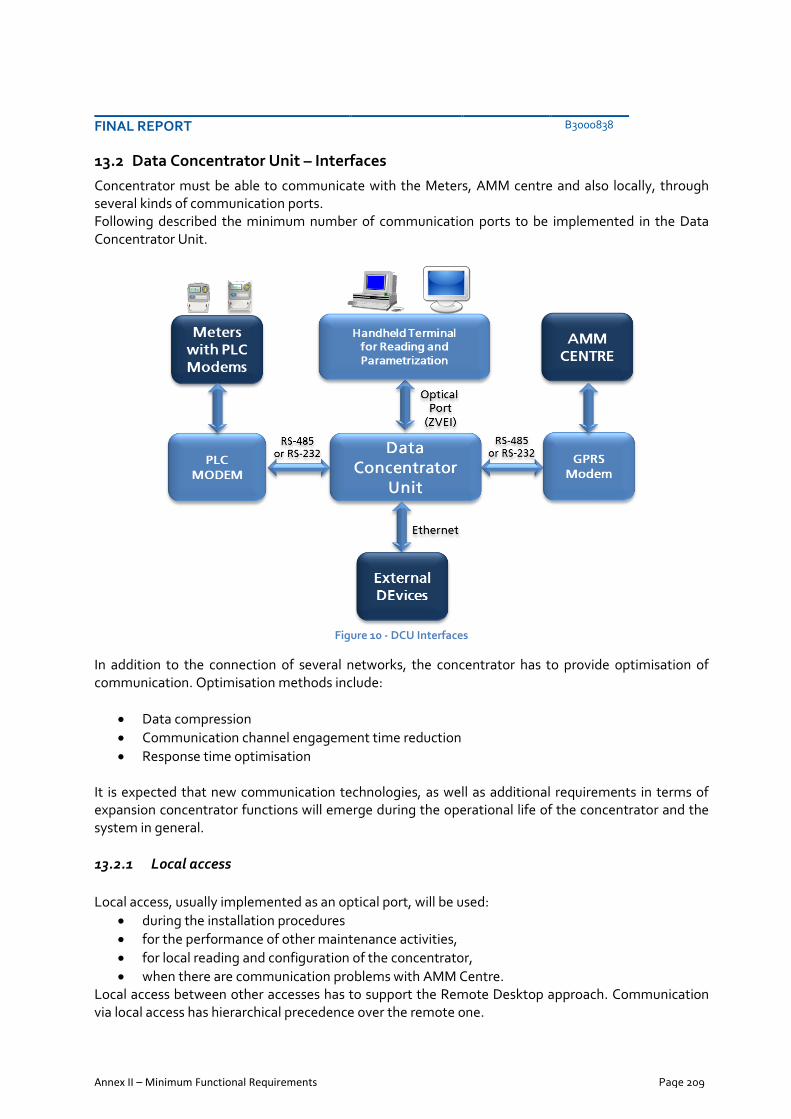
FINAL REPORT B3000838
Annex II – Minimum Functional Requirements Page 209
13.2 Data Concentrator Unit – Interfaces
Concentrator must be able to communicate with the Meters, AMM centre and also locally, through several kinds of communication ports. Following described the minimum number of communication ports to be implemented in the Data Concentrator Unit.
Figure 10 - DCU Interfaces
In addition to the connection of several networks, the concentrator has to provide optimisation of communication. Optimisation methods include:
Data compression
Communication channel engagement time reduction
Response time optimisation It is expected that new communication technologies, as well as additional requirements in terms of expansion concentrator functions will emerge during the operational life of the concentrator and the system in general.
13.2.1 Local access
Local access, usually implemented as an optical port, will be used:
during the installation procedures
for the performance of other maintenance activities,
for local reading and configuration of the concentrator,
when there are communication problems with AMM Centre. Local access between other accesses has to support the Remote Desktop approach. Communication via local access has hierarchical precedence over the remote one.

FINAL REPORT B3000838
Annex II – Minimum Functional Requirements Page 210
13.2.2 External devices
This port, optionally connected to the concentrator may be used for future smart network functionalities, e.g. control and supervision of substations, where concentrators are usually located.
13.2.3 Remote Communication Interfaces
13.2.3.1 Concentrator communication ports
The scenarios described in chapter 13.1.9.1 suggest the requirements, in terms of communication ports, to comply with current and future technologies, without the need of changing the Concentrator and devices under it. Concentrator must have different communication ports, which will be used in accordance with the chosen communication scenario. In order to use local networks, on fibre, MV PLC, meshed Wi-Fi, an Ethernet port is necessary. For Broadband wireless and GPRS communication a dedicated modem must be used. The modem must be connected to the data concentrator by means of a RS-232 or RS-485. Communication between Concentrator and AMM Centre is established according with TCP/IP communication protocol. The DCU has to allow remote bi-directional communication (with protection circuit against surges) through the following ports:
Ethernet port: 1 port
RS-232 or RS485: 2 ports Communication with AMM Centre is initiated in several ways:
Upon the request from AMM Centre.
According to automatic concentrator response sequence.
According to emergency request of the concentrator.
13.3 Data Concentrator Unit - Characteristics
13.3.1 Physical –Environmental
13.3.1.1 Climate conditions
General external weather conditions that are most common in the Kingdom of Saudi Arabia are described in the table below:
PARAMETER VALUE
Temperate range -20 to 60°C
Relative humidity up to 80%
Atmosphere Full of salt near the coast
Isokeraunic level average 26, peak 97
Varying from non-corrosive to corrosive Soil conditions

FINAL REPORT B3000838
Annex II – Minimum Functional Requirements Page 211
13.3.1.2 Operative Range
PARAMETER VALUE
Temperate range -10 to 70°C
Relative humidity 100%
13.3.1.3 Storage Range
PARAMETER VALUE
Temperate range -10 to 85°C
Relative humidity 100%
13.3.2 Lifecycle
Expected lifecycle, without maintenance: greater than 10 years.

CESI
FINAL REPORT B3000838
Annex II – Minimum Functional Requirements Page 212
14 FUNCTIONAL AND TECHNICAL REQUIREMENTS COMPARISON BY COUNTRIES
This section introduces a comparison of Meters Functionalities and Requirements among representative foreign Countries (Italy, UK and Spain) against SEC specifications. The following cases have been considered:
The Italian case of smart metering deployment, as the pioneer case in the world for massive deployment of smart meters. Its costs and benefits and the experience of many years of operation.
The United Kingdom case, as an example of governance, transparency and well conducted process for a next massive deployment. UK also introduced innovations in the data communication privacy and security.
The Spain case, as an example of the interoperability and interchangeability development. In fact, Spain has achieved: Optimization of Energy utilization, Reduction of losses, growth of Customers awareness, improvement of effectiveness and reliability of the service
The “Functionalities comparison table” compares the minimal functionalities for the foreign cases against the SEC Specification, thus highlighting coverage and differences among several foreign experiences and specifications of local Utilities. The “Technical comparison table” compares the suggested specification functionalities for the foreign cases and SEC Specification.
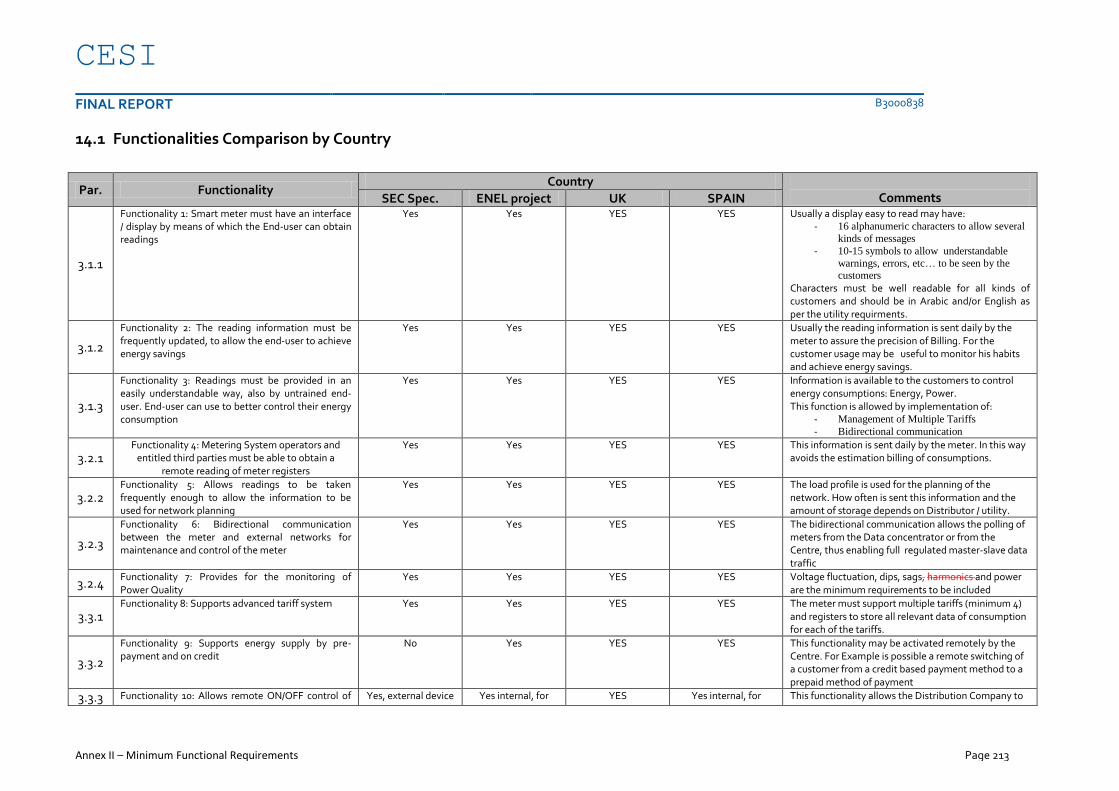
CESI
FINAL REPORT B3000838
Annex II – Minimum Functional Requirements Page 213
14.1 Functionalities Comparison by Country
Par. Functionality Country
Comments SEC Spec. ENEL project UK SPAIN
3.1.1
Functionality 1: Smart meter must have an interface / display by means of which the End-user can obtain readings
Yes Yes YES YES Usually a display easy to read may have: - 16 alphanumeric characters to allow several
kinds of messages
- 10-15 symbols to allow understandable
warnings, errors, etc… to be seen by the customers
Characters must be well readable for all kinds of customers and should be in Arabic and/or English as per the utility requirments.
3.1.2
Functionality 2: The reading information must be frequently updated, to allow the end-user to achieve energy savings
Yes Yes YES YES Usually the reading information is sent daily by the meter to assure the precision of Billing. For the customer usage may be useful to monitor his habits and achieve energy savings.
3.1.3
Functionality 3: Readings must be provided in an easily understandable way, also by untrained end-user. End-user can use to better control their energy consumption
Yes Yes YES YES Information is available to the customers to control energy consumptions: Energy, Power. This function is allowed by implementation of:
- Management of Multiple Tariffs
- Bidirectional communication
3.2.1 Functionality 4: Metering System operators and
entitled third parties must be able to obtain a remote reading of meter registers
Yes Yes YES YES This information is sent daily by the meter. In this way avoids the estimation billing of consumptions.
3.2.2 Functionality 5: Allows readings to be taken frequently enough to allow the information to be used for network planning
Yes Yes YES YES The load profile is used for the planning of the network. How often is sent this information and the amount of storage depends on Distributor / utility.
3.2.3
Functionality 6: Bidirectional communication between the meter and external networks for maintenance and control of the meter
Yes Yes YES YES The bidirectional communication allows the polling of meters from the Data concentrator or from the Centre, thus enabling full regulated master-slave data traffic
3.2.4 Functionality 7: Provides for the monitoring of Power Quality
Yes Yes YES YES Voltage fluctuation, dips, sags, harmonics and power are the minimum requirements to be included
3.3.1 Functionality 8: Supports advanced tariff system Yes Yes YES YES The meter must support multiple tariffs (minimum 4)
and registers to store all relevant data of consumption for each of the tariffs.
3.3.2
Functionality 9: Supports energy supply by pre-payment and on credit
No Yes YES YES This functionality may be activated remotely by the Centre. For Example is possible a remote switching of a customer from a credit based payment method to a prepaid method of payment
3.3.3 Functionality 10: Allows remote ON/OFF control of Yes, external device Yes internal, for YES Yes internal, for This functionality allows the Distribution Company to

CESI
FINAL REPORT B3000838
Annex II – Minimum Functional Requirements Page 214
Par. Functionality Country
Comments SEC Spec. ENEL project UK SPAIN the supply and/or flow or power limitation residential single
and three phases residential single and
3 phases limit the power used by the Customers.
3.4.1 Functionality 11: Provide Secure Data Communications
Yes Yes YES YES This functionality protects and guarantees the customers’ privacy against violation.
3.4.2
Functionality 12: Fraud prevention and detection Yes Yes YES YES The minimum functions to be implemented are:
Opening protections
Strong magnetic field protection
Cable misconnection (reversal of phase(s) and neutral)
All tampering events are stored in permanent memory and sent to the Centre
3.5.1
Functionality 13: Provide Import / Export & Reactive Metering
Yes Yes YES YES Meters must be able to measure bidirectional flow of current, in order to be used also in distributed generation plants. Flow will be considered positive when energy is absorbed by the Customer and negative when generated by the Customer. The meter will calculate the net balance between absorbed and generated energy
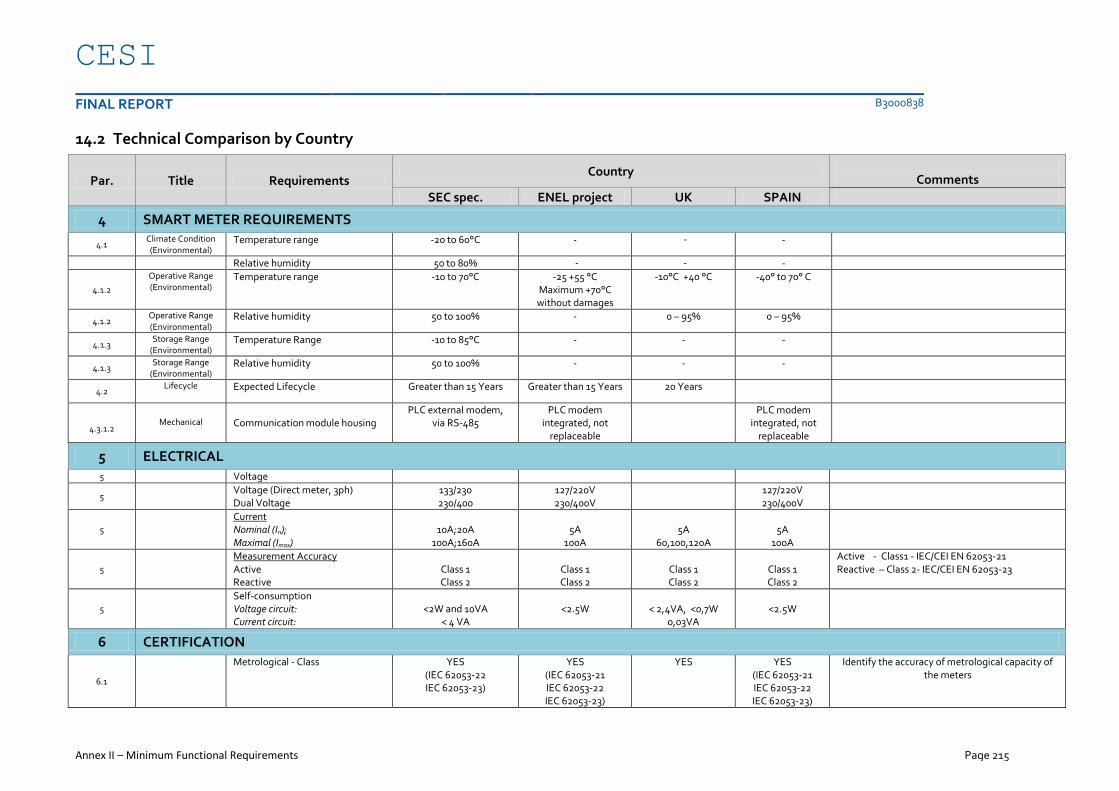
CESI
FINAL REPORT B3000838
Annex II – Minimum Functional Requirements Page 215
14.2 Technical Comparison by Country
Par. Title Requirements Country
Comments
SEC spec. ENEL project UK SPAIN
4 SMART METER REQUIREMENTS
4.1 Climate Condition (Environmental)
Temperature range -20 to 60°C - - -
Relative humidity 50 to 80% - - -
4.1.2
Operative Range (Environmental)
Temperature range -10 to 70°C -25 +55 °C Maximum +70°C without damages
-10°C +40 °C -40° to 70° C
4.1.2 Operative Range (Environmental)
Relative humidity 50 to 100% - 0 – 95% 0 – 95%
4.1.3 Storage Range
(Environmental) Temperature Range -10 to 85°C - - -
4.1.3 Storage Range
(Environmental) Relative humidity 50 to 100% - - -
4.2 Lifecycle
Expected Lifecycle Greater than 15 Years Greater than 15 Years 20 Years
4.3.1.2
Mechanical
Communication module housing
PLC external modem, via RS-485
PLC modem integrated, not
replaceable
PLC modem integrated, not
replaceable
5 ELECTRICAL
5 Voltage
5 Voltage (Direct meter, 3ph)
Dual Voltage 133/230 230/400
127/220V 230/400V
127/220V 230/400V
5
Current Nominal (In); Maximal (Imax)
10A;20A
100A;160A
5A
100A
5A
60,100,120A
5A
100A
5
Measurement Accuracy Active Reactive
Class 1 Class 2
Class 1 Class 2
Class 1 Class 2
Class 1 Class 2
Active - Class1 - IEC/CEI EN 62053-21 Reactive – Class 2- IEC/CEI EN 62053-23
5
Self-consumption Voltage circuit: Current circuit:
<2W and 10VA
< 4 VA
<2.5W
< 2,4VA, <0,7W
0,03VA
<2.5W
6 CERTIFICATION
6.1
Metrological - Class YES (IEC 62053-22 IEC 62053-23)
YES (IEC 62053-21 IEC 62053-22 IEC 62053-23)
YES YES (IEC 62053-21 IEC 62053-22 IEC 62053-23)
Identify the accuracy of metrological capacity of the meters
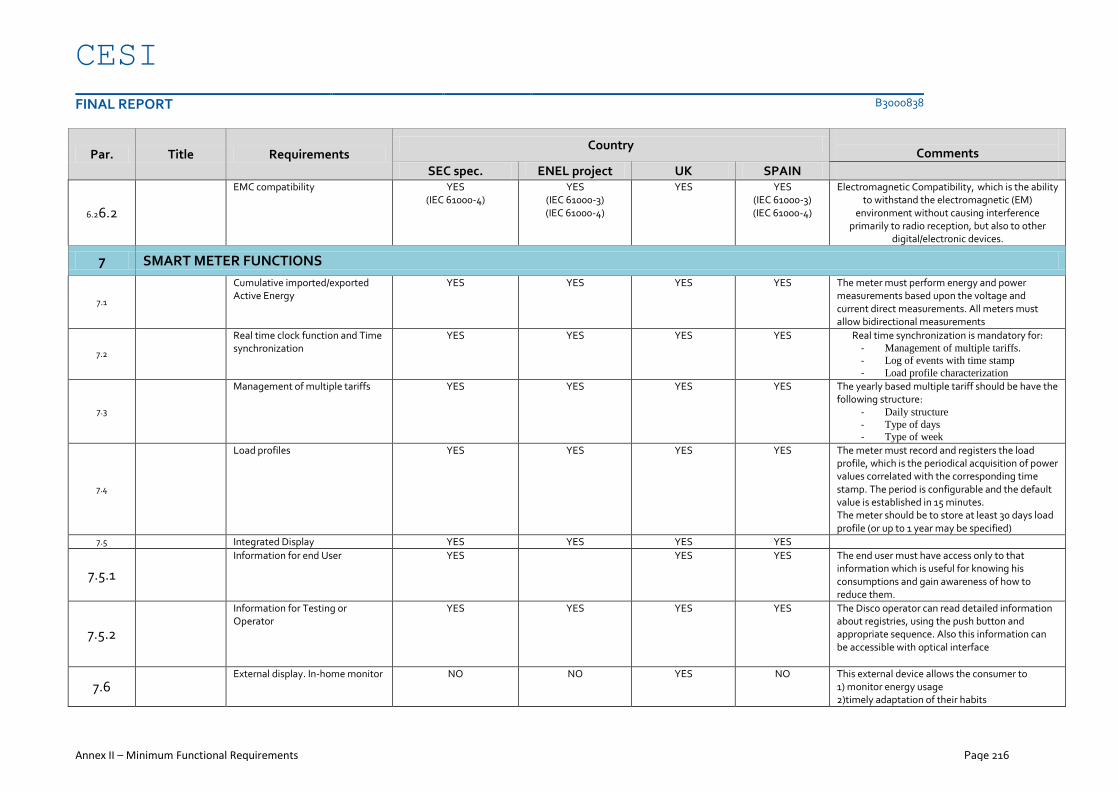
CESI
FINAL REPORT B3000838
Annex II – Minimum Functional Requirements Page 216
Par. Title Requirements Country
Comments
SEC spec. ENEL project UK SPAIN
6.26.2
EMC compatibility YES (IEC 61000-4)
YES (IEC 61000-3) (IEC 61000-4)
YES YES (IEC 61000-3) (IEC 61000-4)
Electromagnetic Compatibility, which is the ability to withstand the electromagnetic (EM)
environment without causing interference primarily to radio reception, but also to other
digital/electronic devices.
7 SMART METER FUNCTIONS
7.1
Cumulative imported/exported Active Energy
YES YES YES YES The meter must perform energy and power measurements based upon the voltage and current direct measurements. All meters must allow bidirectional measurements
7.2
Real time clock function and Time synchronization
YES YES YES YES Real time synchronization is mandatory for: - Management of multiple tariffs.
- Log of events with time stamp
- Load profile characterization
7.3
Management of multiple tariffs YES YES YES YES The yearly based multiple tariff should be have the following structure:
- Daily structure
- Type of days
- Type of week
7.4
Load profiles YES YES YES YES The meter must record and registers the load profile, which is the periodical acquisition of power values correlated with the corresponding time stamp. The period is configurable and the default value is established in 15 minutes. The meter should be to store at least 30 days load profile (or up to 1 year may be specified)
7.5 Integrated Display YES YES YES YES
7.5.1
Information for end User YES YES YES The end user must have access only to that information which is useful for knowing his consumptions and gain awareness of how to reduce them.
7.5.2
Information for Testing or Operator
YES YES YES YES The Disco operator can read detailed information about registries, using the push button and appropriate sequence. Also this information can be accessible with optical interface
7.6
External display. In-home monitor NO NO YES NO This external device allows the consumer to 1) monitor energy usage 2)timely adaptation of their habits

CESI
FINAL REPORT B3000838
Annex II – Minimum Functional Requirements Page 217
Par. Title Requirements Country
Comments
SEC spec. ENEL project UK SPAIN
7.7
Disconnection/ reconnection relay YES, external YES YES YES Meter for Residential customer (Direct three phases) must have the capability to drive an external or integrated relay in order to disconnect and re-connect the user. An internal relay improves the anti-tamper function.
7.7.1
Local and remote disconnection functionality
YES YES YES YES The system should enable disconnection reconnection without the need of on-field activities.
7.8.1 Firmware upgrade YES YES YES YES It allows updating the software on the meter,
adding functionalities and/or fixing software bugs 7.8.2 Local firmware upgrade YES YES YES YES As above, performed locally, on-field
7.8.3
Remote firmware upgrade NO YES YES YES Remote upgrading avoids on-field activities related to firmware changing. The smart metering system shall support firmware upgrades, without affecting the metrology functionalities.
7.9
Anti-tampering protection YES YES YES YES The meter must have adequate protections against illegal attempts of access to internal parts and abusive connections, which could invalidate the meter readings.
7.10
Log and status of the meter YES YES YES YES Logs contain the information for the diagnosis of the meter, such as:
- Tampering attempts
- Watchdog events
- Permanent memory error
- Battery fault
- Real-time clock fault
- ambient and over-temperature
7.11
Security and privacy YES YES YES YES Meter functionalities must prevent unauthorized access to data and any modification of meters registries
7.12 Stand-alone working modality of
meter YES YES YES YES Minimum data retention without power supply: 10
years
8 QUALITY ASSURANCE
8.1
Warranty YES
YES YES YES Meters must be guaranteed against all defects for 2 years after installation or 3 years after delivery, whichever comes first. The Production of the devices initially supplied must be guaranteed for at least fifteen years.

CESI
FINAL REPORT B3000838
Annex II – Minimum Functional Requirements Page 218
Par. Title Requirements Country
Comments
SEC spec. ENEL project UK SPAIN
8.3 Spare Parts YES YES YES YES The supply of spare part must be available for the
whole expected life of the devices
8.4
Procedure of Calibration YES Periodically
YES periodically
YES, periodically YES periodically
The Supplier must provide procedures for the periodical check of meter accuracy and the proposed schedule
10 METER INTERFACES
10.1.1 Data connections Optical interface YES YES YES YES
10.1.2 Data connections RS-485 - Local bus YES YES YES
10.1.3 Data connections M-bus YES NO NO
10.1.4
Digital Output for impulse test, consumption monitoring and future external device for load management
YES, optical YES, optical YES, optical

CESI
FINAL REPORT B3000838
Annex II – Minimum Functional Requirements Page 219
15 FUNTIONAL AND TECHNICAL REQUIREMENTS COMPARISON BY MANUFACTURERS
In this section are compared four international and one local Smart Meters Manufacturers. The local manufacturer developed the product according to the SEC specification. Local Manufacturer:
AEC International Manufacturers:
Landis+ Gyr
Elster
Iskraemeco
Itron

CESI
FINAL REPORT B3000838
Annex II – Minimum Functional Requirements Page 220
15.1 Functionalities Comparison by Manufacturer
Par. Functionality
Landis+Gyr Elster Itron Iskraemeco AEC
3.1.1 Functionality 1: Smart meter must have an interface / display by means of which the End-user can obtain readings
YES YES YES YES YES
3.1.2 Functionality 2: The reading information must be frequently updated, to allow the end-user to achieve energy savings
YES YES YES YES YES
3.1.3
Functionality 3: Readings must be provided in an easily understandable way, also by untrained end-user. End-user can use to better control their energy consumption
YES YES YES YES YES
3.2.1 Functionality 4: Metering System operators and entitled third parties must be able to obtain a remote reading of meter registers
YES YES YES YES
YES
3.2.2 Functionality 5: Allows readings to be taken frequently enough to allow the information to be used for network planning
YES YES N.C YES YES
3.2.3 Functionality 6: Bidirectional communication between the meter and external networks for maintenance and control of the meter
YES YES YES YES YES
3.2.4 Functionality 7: Provides for the monitoring of Power Quality YES YES YES YES N.C
3.3.1 Functionality 8: Supports advanced tariff system YES YES YES YES YES
3.3.2 Functionality 9: Supports energy supply by pre-payment and on credit
N.C YES N.C N.C N.C
3.3.3
Functionality 10: Allows remote ON/OFF control of the supply and/or flow or power limitation
YES YES YES N.C YES, through auxiliary contact
3.4.1 Functionality 11: Provide Secure Data Communications YES YES YES YES YES
3.4.2 Functionality 12: Fraud prevention and detection YES YES YES YES YES
3.5.1 Functionality 13: Provide Import / Export & Reactive Metering YES YES (export is
optional) N.C YES YES
N.C = Not Classified

CESI
FINAL REPORT B3000838
Annex II – Minimum Functional Requirements Page 221
15.2 Technical Requirements Comparison by Manufacturer
Par. Title Requirements Manufacturer
Landis+ Gyr
Elster Itron Iskraemeco AEC
4 SMART METER REQUIREMENTS
4.1.2 Operative Range Temperature range -40° to 70° C -40° to 70° C -40° to +60°C -25° to +60°C -20 to +70 °C
4.1.2 Operative Range
Relative humidity N.C 0 – 95% 0 – 95% 100% Noncondensing
4.1.3 Storage Range Temperature Range -40° to 70° C -40° to 80° C -40° to 80° C -40° to 80° C -30 to +85 °C
4.1.3 Storage Range Relative humidity N.C 0 – 95% N.C N.C 100% Noncondensing
4.2 Lifecycle
Expected Lifecycle Over 15 years 16 years 12-20 Years 106 cycles 15 Years
4.3.1.2
Mechanical
Communication module housing
N.C N.C YES N.C N.C
5 ELECTRICAL
5
Voltage (Direct meter, 3ph) Dual Voltage
3 x 230/400 3 x 230/400 3 x 220/415 3 x 230/400 "3x127/220 and 3x133/230 and
3x220/380 and3x 230/400,
5 Current
Nominal (In); Maximal (Imax)
5A, 10A, 20A or 40,60,
80, 100A
5A
60,80,100,120A
100A
5, 10A
85, 120A
3x 277/480
5 Measurement Accuracy
Active Reactive
Class B Class 2
Class 1 Class 2
Class B Class 2
Class 1 Class 2
"
5 Self-consumption
Voltage circuit: Current circuit:
<2,5VA, 0.5W
< 0,03 VA
< 2,4VA, <0,7W 0,03VA
N.C
<10VA, <2W <0,5VA
"10 (100) A, 20(160)A, Class 1
6 CERTIFICATION
6.1 Metrological - Class Class 1 and 2
(IEC 62053-21) Class 1 and 2 Class 0.2 or 0.5 Class 1 and 2
(IEC 62052-11,62053-21)
"Class 1 as per IEC62052-11, IEC62053-
21 and IEC62053-23
6.2
EMC compatibility YES (IEC 61000-4-2)
YES (IEC 61000-4-4)
YES (IEC 61000-4-4)
YES
Class 0.5 as per IEC62052-11, IEC62053-
22 and IEC62053-23"
7 SMART METER FUNCTIONS
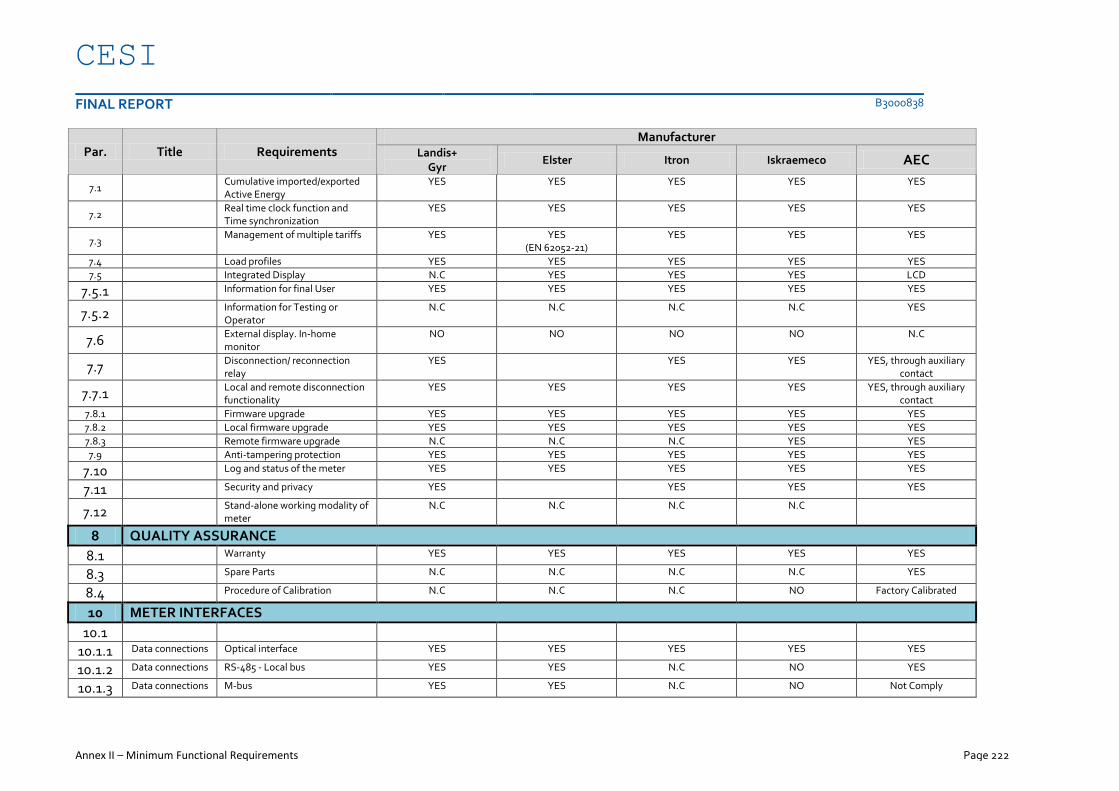
CESI
FINAL REPORT B3000838
Annex II – Minimum Functional Requirements Page 222
Par. Title Requirements Manufacturer
Landis+ Gyr
Elster Itron Iskraemeco AEC
7.1 Cumulative imported/exported
Active Energy YES YES YES YES YES
7.2 Real time clock function and
Time synchronization YES YES YES YES YES
7.3 Management of multiple tariffs YES YES
(EN 62052-21) YES YES YES
7.4 Load profiles YES YES YES YES YES
7.5 Integrated Display N.C YES YES YES LCD
7.5.1 Information for final User YES YES YES YES YES
7.5.2 Information for Testing or
Operator N.C N.C N.C N.C YES
7.6 External display. In-home
monitor NO NO NO NO N.C
7.7 Disconnection/ reconnection
relay YES YES YES YES, through auxiliary
contact
7.7.1 Local and remote disconnection
functionality YES YES YES YES YES, through auxiliary
contact
7.8.1 Firmware upgrade YES YES YES YES YES
7.8.2 Local firmware upgrade YES YES YES YES YES
7.8.3 Remote firmware upgrade N.C N.C N.C YES YES
7.9 Anti-tampering protection YES YES YES YES YES
7.10 Log and status of the meter YES YES YES YES YES
7.11 Security and privacy YES YES YES YES
7.12 Stand-alone working modality of
meter N.C N.C N.C N.C
8 QUALITY ASSURANCE
8.1 Warranty YES YES YES YES YES
8.3 Spare Parts N.C N.C N.C N.C YES
8.4 Procedure of Calibration N.C N.C N.C NO Factory Calibrated
10 METER INTERFACES
10.1
10.1.1 Data connections Optical interface YES YES YES YES YES
10.1.2 Data connections RS-485 - Local bus YES YES N.C NO YES
10.1.3 Data connections M-bus YES YES N.C NO Not Comply

CESI
FINAL REPORT B3000838
Annex II – Minimum Functional Requirements Page 223
Par. Title Requirements Manufacturer
Landis+ Gyr
Elster Itron Iskraemeco AEC
10.1.4
Digital Output for impulse test, consumption monitoring and future external device for load management
YES YES YES YES YES

FINAL REPORT B3000838
Annex II – Minimum Functional Requirements Page 224
15.3 Information from international Manufacturers
The collected information about the manufacturers above, are shown in following figures which have been extracted from Smart Meters brochures
Figure 11 - Elster Smart Meter
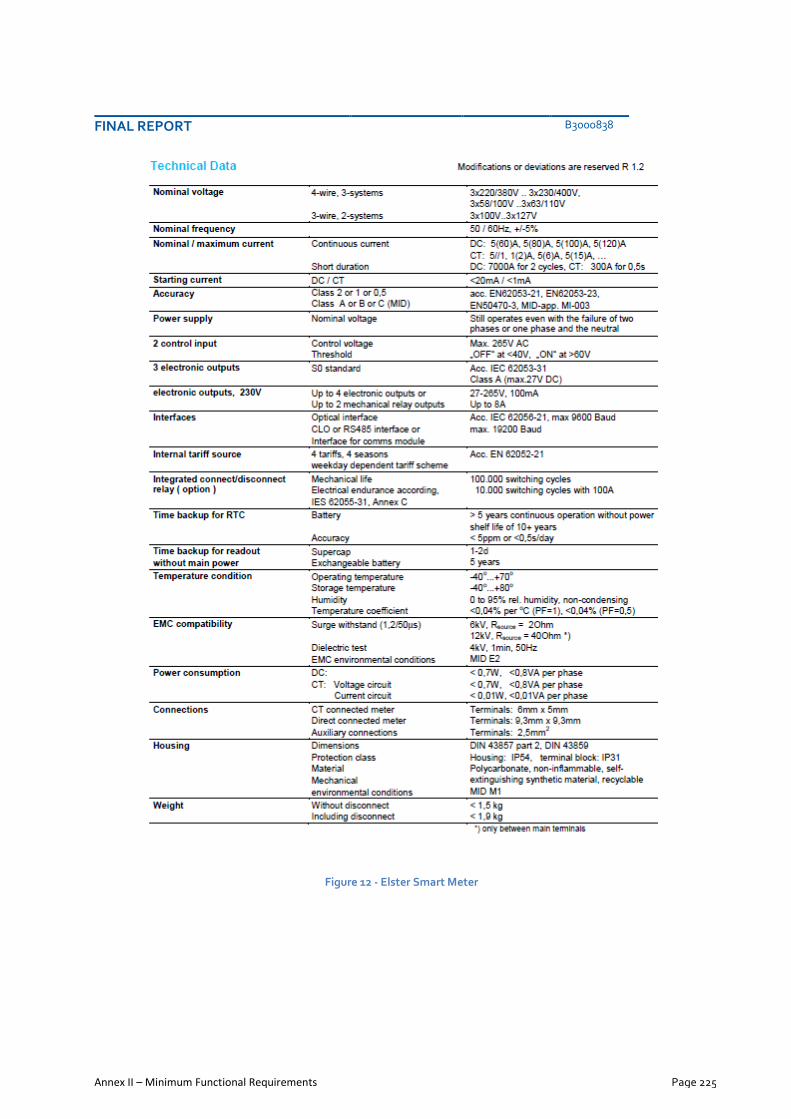
FINAL REPORT B3000838
Annex II – Minimum Functional Requirements Page 225
Figure 12 - Elster Smart Meter

FINAL REPORT B3000838
Annex II – Minimum Functional Requirements Page 226
Figure 13 - Iskraemeco Smart Meter

FINAL REPORT B3000838
Annex II – Minimum Functional Requirements Page 227
Figure 14 - Iskraemeco Smart Meter

FINAL REPORT B3000838
Annex II – Minimum Functional Requirements Page 228
Figure 15 - Itron Smart Meter

FINAL REPORT B3000838
Annex II – Minimum Functional Requirements Page 229
Figure 16 - Itron Smart Meter

FINAL REPORT B3000838
Annex II – Minimum Functional Requirements Page 230
Figure 17 - Landis+Gyr Smart Meter

FINAL REPORT B3000838
Annex II – Minimum Functional Requirements Page 231
Figure 18 - Landis+Gyr Smart Meter

FINAL REPORT B3000838
Annex II – Minimum Functional Requirements Page 232
15.4 Information from Local Manufacturer AEC
The local Manufacturer AEC is collaborating with SEC, producing meters according to SEC Technical specifications. Here follows the Smart Meters brochure.

FINAL REPORT B3000838
Annex II – Minimum Functional Requirements Page 233
KEMA type test report for AEC meter – ADDAD4

FINAL REPORT B3000838
Annex II – Minimum Functional Requirements Page 234

FINAL REPORT B3000838
Annex II – Minimum Functional Requirements Page 235
16 REFERENCES FOR SMART METERS MANUFACTURERS
Technical Specifications - Landis+Gyr – 3 Phases Meter
- www.landisgyr.eu
- http://nepa-ru.com/Landys+Gyr_files/zxd100/08_web_zxd100ap_tech_data_en.pdf
- http://www.landisgyr.eu/apps/products/data/pdf1/D000028193_E350_en1.pdf
- http://style.landisgyr.com/apps/products/data/pdf2/D000028191_E450_f_en.pdf
Technical Specifications - Elster – 3 Phases Meter
- www.elstermetering.com
- http://www.elstermetering.com/en/1143.html
- http://www.elstermetering.com/en/963.html
- http://www.elstermetering.com/en/921.html Technical Specifications - Itron – 3 Phases Meter
- www.itron.com
- https://www.itron.com/mxca/en/PublishedContent/ACE4000%20PLC_0312.pdf
- https://www.itron.com/na/PublishedContent/CENTRON%20GPRS%20SmartMeter.pdf
- https://www.itron.com/na/productsAndServices/Pages/electricity-meters-and-
modules.aspx Technical Specifications - Iskraemeco – 3 Phases Meter
- www.iskraemeco.si
- http://www.iskraemeco.si/emecoweb/eng/products/households_electronic_meters.html
- http://www.iskraemeco.si/emecoweb/rus/products/bdf/MT371_ang.pdf Technical Specifications - AEC – 3 Phases Meter
- http://www.aecl.com/

FINAL REPORT B3000838
Annex II – Minimum Functional Requirements Page 236
17 GENERAL REFERENCES
IEC 62053 Electricity Meter Specification
- http://webstore.iec.ch/preview/info_iec62053-21%7Bed1.0%7Den_d.pdf Smart Metering Specifications
- https://www.gov.uk/government/uploads/system/uploads/attachment_data/file/4
8149/2393-smart-metering-industrys-draft-tech.pdf
- https://www.gov.uk/government/uploads/system/uploads/attachment_data/file/6
5684/7338-smart-meters-equip-tech-spec.pdf
- https://www.gov.uk/search?q=smart+meter+specification&tab=government-
results
- https://www.gov.uk/government/uploads/system/uploads/attachment_data/file/6
8898/smart_meters_equipment_technical_spec_version_2.pdf
- https://www.gov.uk/government/uploads/system/uploads/attachment_data/file/6
8902/smart_meters_equipment_technical_spec_2_consultation_response_part_1.
- http://www.swanforum.com/uploads/5/7/4/3/5743901/smart_metering_uk_emer
ging_specification.pdf
- http://www.ecn.nl/docs/library/report/2011/o11004.pdf
- http://www.se.com.sa/NR/rdonlyres/85FDEB07-9766-4200-80C5-
C5754F60CCF4/0/40SDMS02BRev06.pdf
DLMS Protocols
- http://www.dlms.com/information/whatisdlmscosem/index.html
- http://www.dlms.com/news/09-3-dlms-cosem-for-smart-metering.html
Meters and More Protocol
- http://www.metersandmore.com/ General Links:
- http://www.endesasmartgrids.com/index.php/en/smart-homes/smart-metering
- http://www.cne.es/cne/doc/publicaciones/smart_metering/1115_1_ENDESA.pdf
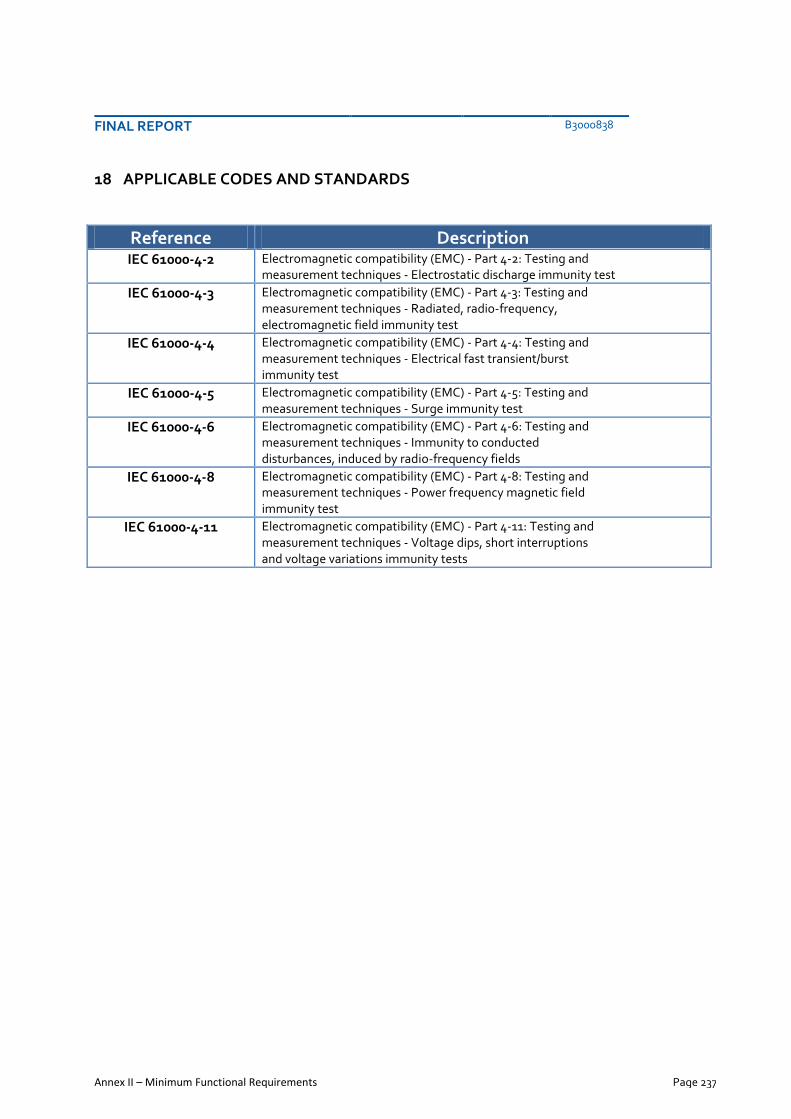
FINAL REPORT B3000838
Annex II – Minimum Functional Requirements Page 237
18 APPLICABLE CODES AND STANDARDS
Reference Description IEC 61000-4-2 Electromagnetic compatibility (EMC) - Part 4-2: Testing and
measurement techniques - Electrostatic discharge immunity test
IEC 61000-4-3 Electromagnetic compatibility (EMC) - Part 4-3: Testing and measurement techniques - Radiated, radio-frequency, electromagnetic field immunity test
IEC 61000-4-4 Electromagnetic compatibility (EMC) - Part 4-4: Testing and measurement techniques - Electrical fast transient/burst immunity test
IEC 61000-4-5 Electromagnetic compatibility (EMC) - Part 4-5: Testing and measurement techniques - Surge immunity test
IEC 61000-4-6 Electromagnetic compatibility (EMC) - Part 4-6: Testing and measurement techniques - Immunity to conducted disturbances, induced by radio-frequency fields
IEC 61000-4-8 Electromagnetic compatibility (EMC) - Part 4-8: Testing and measurement techniques - Power frequency magnetic field immunity test
IEC 61000-4-11 Electromagnetic compatibility (EMC) - Part 4-11: Testing and measurement techniques - Voltage dips, short interruptions and voltage variations immunity tests


FINAL REPORT
Annex III – Minimum Functional Requirements Page 239
ANNEX III - SMART GRIDS TECHNOLOGIES

FINAL REPORT
Annex III – Minimum Functional Requirements Page 240
1 TRANSMISSION NETWORK SMART GRIDS ................................................................ 241
1.1 Phase Monitoring Units (PMUs) ......................................................................................... 241
1.1.1 State of art .......................................................................................................... 241
1.1.2 Aimed objectives, performances to be reached, requirements ............................ 241
1.1.3 PMUs location and configuration ........................................................................ 241
1.1.4 Event-oriented PMU positioning ......................................................................... 242
1.1.5 Phenomenon-oriented PMU positioning ............................................................. 242
1.1.6 Event Detection Algorithm ................................................................................. 243
1.1.7 Oscillation Monitoring ......................................................................................... 243
1.1.8 Transient stability ............................................................................................... 243
1.1.9 Frequency Monitoring ......................................................................................... 243
1.2 FACTS (Flexible AC Transmission Systems) ....................................................................... 244
1.2.2 Mechanically Switched Capacitors / Reactors (MSC/MSR) ................................... 244
1.2.3 Static Var Compensator (SVC) ............................................................................ 245
1.2.4 Static synchronous compensator (STATCOM) .................................................... 245
1.2.5 Series Compensation .......................................................................................... 246
1.2.6 Fixed Series Capacitor (FSC) ................................................................................ 246
1.2.7 Thyristor-controlled Series Compensation (TCSC) .............................................. 246
1.2.8 Short-circuit Current Limitations (SCCL) ............................................................. 247
2 DISTRIBUTION NETWORK SMART GRIDS .................................................................. 249
2.1 Automation for fault selection of the smaller number of branches along MV lines ............. 249
2.2 Volt-VAR control ................................................................................................................ 250
2.2.1 Volt-VAR control to maintain acceptable voltages along feeders ........................ 251
2.2.2 Volt-VAR control for distribution system operation at the lowest voltage ........... 253
2.3 Advanced control systems using DMS................................................................................ 254
2.4 Communication and IT infrastructures ............................................................................... 256
3 LIST OF REFERENCES: .............................................................................................. 257

FINAL REPORT
Annex III – Minimum Functional Requirements Page 241
1 TRANSMISSION NETWORK SMART GRIDS
1.1 Phase Monitoring Units (PMUs)
1.1.1 State of art
A number of transmission system operators had just started to explore this new technology and getting familiar with its use based on small installations. For these reasons some applications for post-event analysis, monitoring and on-line analysis were available, besides control and protection application were generally not available. However accurate and synchronous PMU data suggested that more and more benefits could be drawn from a thorough WAMS exploitation. New algorithms tailored to the specific field of application and territory were needed.
1.1.2 Aimed objectives, performances to be reached, requirements
A Wide Area Monitoring System generally aims to develop:
• a strategy for PMU positioning that maximise monitoring efficiency and minimize installation cost;
• an algorithm for detection, identification and localisation of events like short circuits, step variations of active and/or reactive injection, line switching;
• an implementation of techniques for oscillation monitoring;
• a tool for online transient stability assessment to be placed in the control room;
• an algorithm for islanding identification;
• an algorithm for voltage stability monitoring;
• a software package for digital signal of WAMS measurements.
1.1.3 PMUs location and configuration
In the elaboration of PMU position strategy the main difficulty is to find the right way to cover a wide are with a small number of devices obtaining useful information for both the needs: detect events and detect phenomena.
For the algorithm development and validation the main difficulty is the small numbers of PMUs and available measures. Moreover for some algorithms the tuning phases, i.e. to find the most efficient parameterisation for the monitoring aims, were revealed more complicated than the development of the algorithm itself.
Therefore a key aspect of a WAMS project is the choice of PMUs’ locations. The positioning problem can be translated into mathematical terms as the maximization of monitoring efficiency with minimum number of devices, that is according to minimum installation cost. It should also consider that apart the economic optimization, a large number of PMU requires to manage the synchronized data stream which could be a useless demanding task. Then, PMU locations must be accurately chosen in order to maximize the added value of measurements.
Early studies were carried out in order to develop procedures and algorithms to locate the minimum number of PMUs with the aim of complete observability (i.e. linear state estimation), under various hypotheses of grid connectivity and measurement availability.
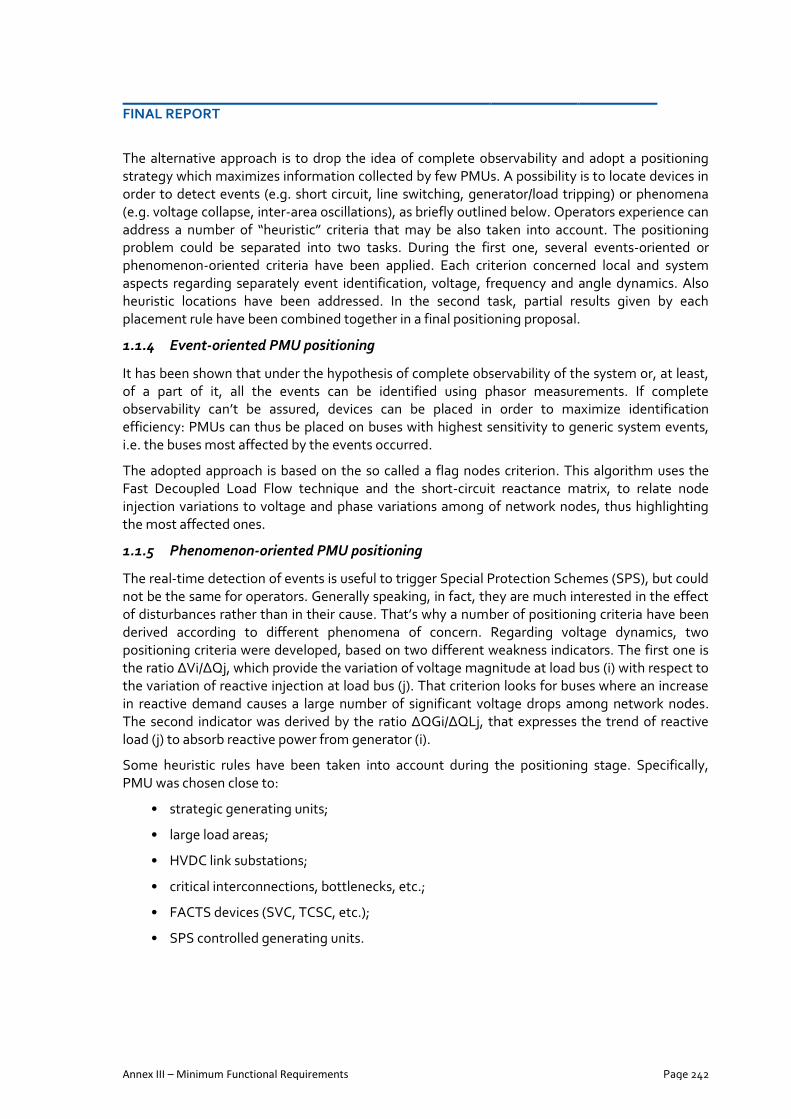
FINAL REPORT
Annex III – Minimum Functional Requirements Page 242
The alternative approach is to drop the idea of complete observability and adopt a positioning strategy which maximizes information collected by few PMUs. A possibility is to locate devices in order to detect events (e.g. short circuit, line switching, generator/load tripping) or phenomena (e.g. voltage collapse, inter-area oscillations), as briefly outlined below. Operators experience can address a number of “heuristic” criteria that may be also taken into account. The positioning problem could be separated into two tasks. During the first one, several events-oriented or phenomenon-oriented criteria have been applied. Each criterion concerned local and system aspects regarding separately event identification, voltage, frequency and angle dynamics. Also heuristic locations have been addressed. In the second task, partial results given by each placement rule have been combined together in a final positioning proposal.
1.1.4 Event-oriented PMU positioning
It has been shown that under the hypothesis of complete observability of the system or, at least, of a part of it, all the events can be identified using phasor measurements. If complete observability can’t be assured, devices can be placed in order to maximize identification efficiency: PMUs can thus be placed on buses with highest sensitivity to generic system events, i.e. the buses most affected by the events occurred.
The adopted approach is based on the so called a flag nodes criterion. This algorithm uses the Fast Decoupled Load Flow technique and the short-circuit reactance matrix, to relate node injection variations to voltage and phase variations among of network nodes, thus highlighting the most affected ones.
1.1.5 Phenomenon-oriented PMU positioning
The real-time detection of events is useful to trigger Special Protection Schemes (SPS), but could not be the same for operators. Generally speaking, in fact, they are much interested in the effect of disturbances rather than in their cause. That’s why a number of positioning criteria have been derived according to different phenomena of concern. Regarding voltage dynamics, two positioning criteria were developed, based on two different weakness indicators. The first one is the ratio ΔVi/ΔQj, which provide the variation of voltage magnitude at load bus (i) with respect to the variation of reactive injection at load bus (j). That criterion looks for buses where an increase in reactive demand causes a large number of significant voltage drops among network nodes. The second indicator was derived by the ratio ΔQGi/ΔQLj, that expresses the trend of reactive load (j) to absorb reactive power from generator (i).
Some heuristic rules have been taken into account during the positioning stage. Specifically, PMU was chosen close to:
• strategic generating units;
• large load areas;
• HVDC link substations;
• critical interconnections, bottlenecks, etc.;
• FACTS devices (SVC, TCSC, etc.);
• SPS controlled generating units.

FINAL REPORT
Annex III – Minimum Functional Requirements Page 243
1.1.6 Event Detection Algorithm
Detection, identification and localisation of events (i.e. short circuits, step variations of active and/or reactive injection, line switching) have been shown to be possible under the hypothesis of complete system observability. The underlying analytical concepts rely on Fast Decoupled Load Flow, DC Load Flow and Network Sensitivity techniques. Starting from accurate synchronised measures sampled at high sampling rate (e.g. one phasor per cycle), both nature and location of the events can be determined by comparing analysis of bus voltage magnitude and phase variations between successive sampling steps: the sign of the variations, along with their concordance within all buses and with the support of thresholds, allows to discriminate among the possible events.
1.1.7 Oscillation Monitoring
Concerning phenomenon identification, efforts have been devoted to angle (following small – oscillation analysis – and large perturbations – transient stability), frequency and voltage monitoring. Angle dynamics is associated to both small-signal and large disturbances. Oscillation analysis is one of the most common applications of synchronised phasor data, performed both off line and on line.
Concerning standard algorithms for oscillation analysis, black box model identification techniques do not require to know the dynamic properties of the system. Further, they are also effective in case the input signal is altered by noise. The identification approaches, however, preliminary need the choice of the model family and order.
1.1.8 Transient stability
Phenomena evolve within time frames not compatible with operator response. In order to provide fast and straightforward online transient stability assessment for the control room, a simplified analysis tool has to be used. The approach is to identify two well determined coherent areas may lose synchronism reciprocally. This is the case of meshed subsystems with high power transfer, connected by weak corridors, subject to events such as short circuit and loss of lines. In most cases, instability occurs on the first angle swing; this in turn can often be evaluated with acceptable approximation of the classical second order model for generators. The operating condition depends on the current power transfer level, and it can be evaluated online by PMU measurements at corridor ends.
1.1.9 Frequency Monitoring
Frequency is a good phenomenological indicator of system integrity. In a connected electrical island, steady state frequency is identical in all buses. In case of severe disturbances, the power system may split into islands, because of cascade line tripping. The new configuration is characterised by (at least slightly) different values of the steady state frequency in the resulting islands. A faster identification of system separation, however, might help the operator to follow promptly the evolution of events by means of an algorithm based on the analysis of the phase angle trend.

FINAL REPORT
Annex III – Minimum Functional Requirements Page 244
1.2 FACTS (Flexible AC Transmission Systems)
A flexible alternating current transmission system (FACTS) is a system composed of static equipment (generally a power electronics-based system) used for the AC transmission of electrical energy. FACTS have been evolving into a mature technology with high power rating. This technology has widespread application. The main purpose of these systems is to supply the network as quickly as possible with inductive or capacitive reactive power that is adapted to its particular requirements, while also enhancing controllability and increasing power transfer capability of the network. FACTS are available in:
Parallel connection
Serial connection
1.2.1.1 Parallel Compensation
Parallel compensation means any type of reactive power compensation employing either switched or controlled units that are connected in parallel to the transmission network as a power system node. There are 2 main devices (Figure 1):
Mechanically Switched Capacitors / Reactors (MSC/MSR)
Static Var Compensator (SVC)
Static Synchronous Compensator (STACOM)
Figure 1: a) Mechanically switched capacitors (MSC) and mechanically switched reactors (MSR) connected to the
transmission system; b) Static Var compensator (SVC) with three branches (TCR, TSC, filter) and coupling transformer
1.2.2 Mechanically Switched Capacitors / Reactors (MSC/MSR)
Most economical reactive power compensation devices are mechanical switched devices. Mechanically switched capacitors are a simple but the low speed solution for voltage control and network stabilization under heavy load condition. Their utilization has almost no effect on the short circuit power but it increases the voltage at the point of connection. Mechanically switched reactors have exactly the opposite effect and are therefore preferable for achieving stabilization
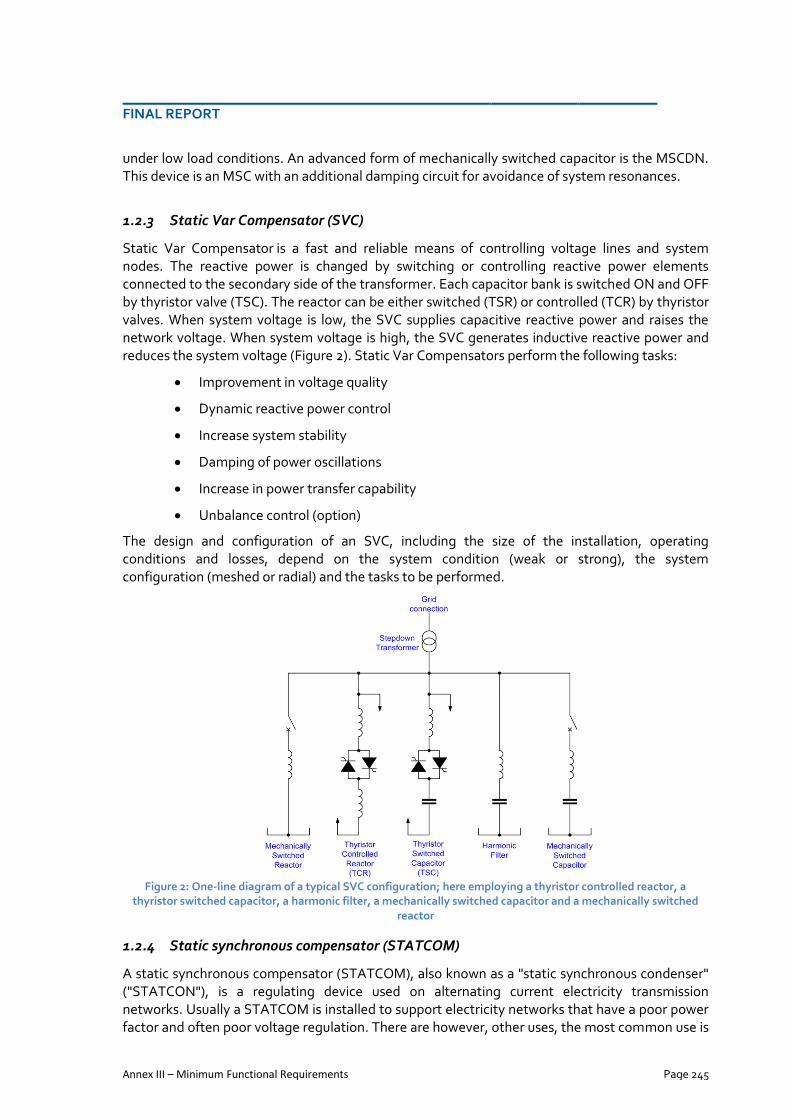
FINAL REPORT
Annex III – Minimum Functional Requirements Page 245
under low load conditions. An advanced form of mechanically switched capacitor is the MSCDN. This device is an MSC with an additional damping circuit for avoidance of system resonances.
1.2.3 Static Var Compensator (SVC)
Static Var Compensator is a fast and reliable means of controlling voltage lines and system nodes. The reactive power is changed by switching or controlling reactive power elements connected to the secondary side of the transformer. Each capacitor bank is switched ON and OFF by thyristor valve (TSC). The reactor can be either switched (TSR) or controlled (TCR) by thyristor valves. When system voltage is low, the SVC supplies capacitive reactive power and raises the network voltage. When system voltage is high, the SVC generates inductive reactive power and reduces the system voltage (Figure 2). Static Var Compensators perform the following tasks:
Improvement in voltage quality
Dynamic reactive power control
Increase system stability
Damping of power oscillations
Increase in power transfer capability
Unbalance control (option)
The design and configuration of an SVC, including the size of the installation, operating conditions and losses, depend on the system condition (weak or strong), the system configuration (meshed or radial) and the tasks to be performed.
Figure 2: One-line diagram of a typical SVC configuration; here employing a thyristor controlled reactor, a
thyristor switched capacitor, a harmonic filter, a mechanically switched capacitor and a mechanically switched reactor
1.2.4 Static synchronous compensator (STATCOM)
A static synchronous compensator (STATCOM), also known as a "static synchronous condenser" ("STATCON"), is a regulating device used on alternating current electricity transmission networks. Usually a STATCOM is installed to support electricity networks that have a poor power factor and often poor voltage regulation. There are however, other uses, the most common use is
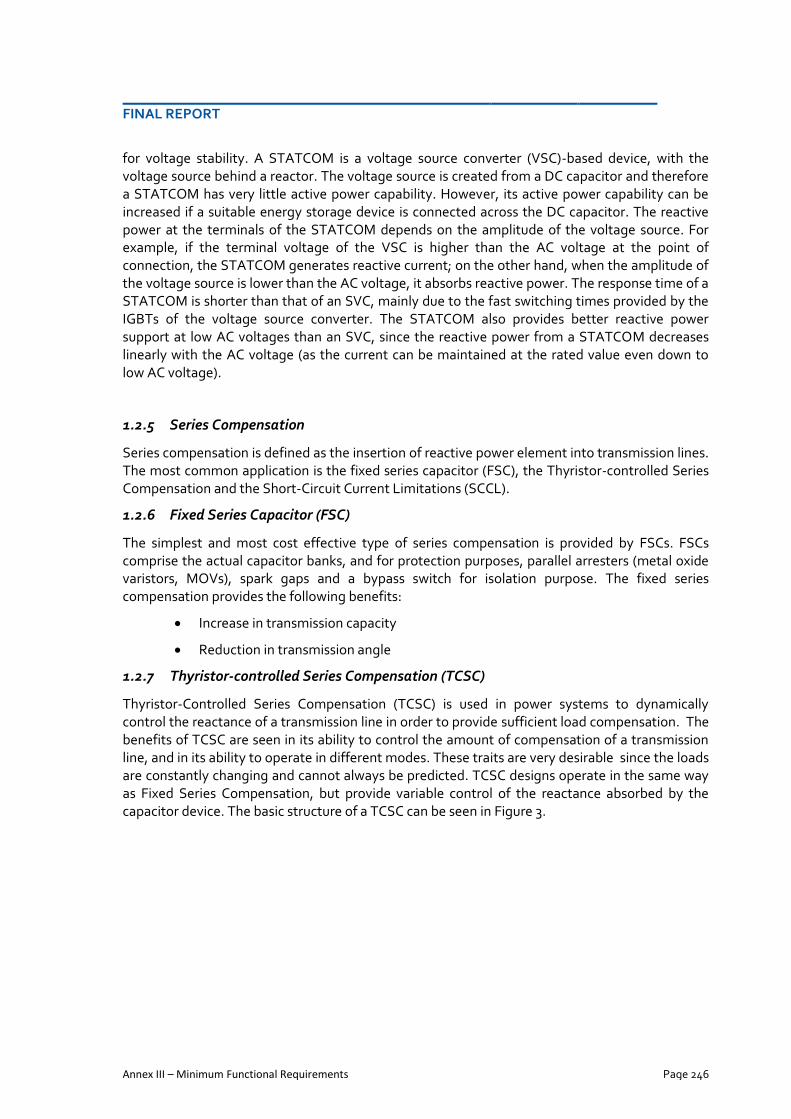
FINAL REPORT
Annex III – Minimum Functional Requirements Page 246
for voltage stability. A STATCOM is a voltage source converter (VSC)-based device, with the voltage source behind a reactor. The voltage source is created from a DC capacitor and therefore a STATCOM has very little active power capability. However, its active power capability can be increased if a suitable energy storage device is connected across the DC capacitor. The reactive power at the terminals of the STATCOM depends on the amplitude of the voltage source. For example, if the terminal voltage of the VSC is higher than the AC voltage at the point of connection, the STATCOM generates reactive current; on the other hand, when the amplitude of the voltage source is lower than the AC voltage, it absorbs reactive power. The response time of a STATCOM is shorter than that of an SVC, mainly due to the fast switching times provided by the IGBTs of the voltage source converter. The STATCOM also provides better reactive power support at low AC voltages than an SVC, since the reactive power from a STATCOM decreases linearly with the AC voltage (as the current can be maintained at the rated value even down to low AC voltage).
1.2.5 Series Compensation
Series compensation is defined as the insertion of reactive power element into transmission lines. The most common application is the fixed series capacitor (FSC), the Thyristor-controlled Series Compensation and the Short-Circuit Current Limitations (SCCL).
1.2.6 Fixed Series Capacitor (FSC)
The simplest and most cost effective type of series compensation is provided by FSCs. FSCs comprise the actual capacitor banks, and for protection purposes, parallel arresters (metal oxide varistors, MOVs), spark gaps and a bypass switch for isolation purpose. The fixed series compensation provides the following benefits:
Increase in transmission capacity
Reduction in transmission angle
1.2.7 Thyristor-controlled Series Compensation (TCSC)
Thyristor-Controlled Series Compensation (TCSC) is used in power systems to dynamically control the reactance of a transmission line in order to provide sufficient load compensation. The benefits of TCSC are seen in its ability to control the amount of compensation of a transmission line, and in its ability to operate in different modes. These traits are very desirable since the loads are constantly changing and cannot always be predicted. TCSC designs operate in the same way as Fixed Series Compensation, but provide variable control of the reactance absorbed by the capacitor device. The basic structure of a TCSC can be seen in Figure 3.

FINAL REPORT
Annex III – Minimum Functional Requirements Page 247
Figure 3: Basic structure of a Thyristor-controlled Series Compensation (TCSC)
A thyristor-controlled series compensator is composed of a series capacitance which has a parallel branch including a thyristor-controlled reactor. TCSC operates in different modes depending on when the thyristors for the inductive branch are triggered. The modes of operation are as listed:
Blocking mode: Thyristor valve is always off, opening inductive branch, and effectively causing the TCSC to operate as FSC
Bypass mode: Thyristor valve is always on, causing TCSC to operate as a capacitor and inductor in parallel, reducing current through TCSC
Capacitive boost mode: Forward voltage thyristor valve is triggered slightly before capacitor voltage crosses zero to allow current to flow through inductive branch, adding to capacitive current. This effectively increases the observed capacitance of the TCSC without requiring a larger capacitor within the TCSC.
Because of TCSC allowing different operating modes depending on system requirements, TCSC is desired for several reasons. In addition to all of the benefits of FSC, TCSC allows for increased compensation simply by using a different mode of operation, as well as limitation of line current in the event of a fault.
1.2.8 Short-circuit Current Limitations (SCCL)
Extension of HV AC networks, coupling of independent grids and adding of new generation increases the existing short-circuit power in many cases. If the designed short-circuit level of the existing equipment is exceeded, and extension of the network, without extremely costly replacement of the existing equipment, is not possible. This no-go criteria can be avoided by using a short-circuit current limiter. By combining the TPSC with an external reactor, this combination can now be used as a short-circuit current limiter (SCCL). In case of a system fault, the thyristor valve will be fired, bypassing the series capacitor. The corresponding short-circuit current will be limited by the reactor to the design values (Figure 4).
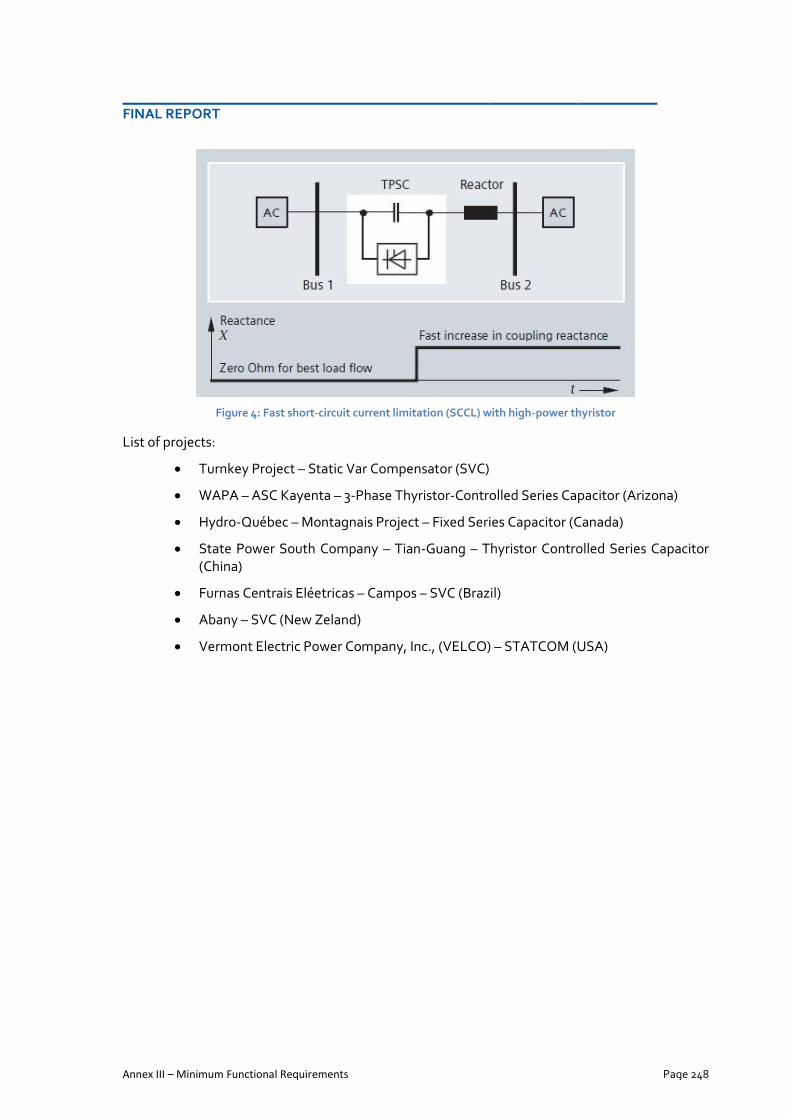
FINAL REPORT
Annex III – Minimum Functional Requirements Page 248
Figure 4: Fast short-circuit current limitation (SCCL) with high-power thyristor
List of projects:
Turnkey Project – Static Var Compensator (SVC)
WAPA – ASC Kayenta – 3-Phase Thyristor-Controlled Series Capacitor (Arizona)
Hydro-Québec – Montagnais Project – Fixed Series Capacitor (Canada)
State Power South Company – Tian-Guang – Thyristor Controlled Series Capacitor (China)
Furnas Centrais Eléetricas – Campos – SVC (Brazil)
Abany – SVC (New Zeland)
Vermont Electric Power Company, Inc., (VELCO) – STATCOM (USA)

FINAL REPORT
Annex III – Minimum Functional Requirements Page 249
2 DISTRIBUTION NETWORK SMART GRIDS
2.1 Automation for fault selection of the smaller number of branches along MV
lines
MV feeders are generally radially operated with the possibility to be supplied by different HV/MV substation (or different MV busbar).
The “border” switch disconnector (Head End switch) at the end of the feeder, is usually opened.
In order to improve the quality of service on the MT distribution network and in particular the continuity of service, the main problem is the fast identification and isolation of branches where failures occur. Reducing this time means:
To decrease the duration of interruptions due to a fault,
To decrease the number of un-supplied MV and LV users.
Automation may solve the problem by means of different solutions. One of them may, for instance, uses the following devices installed in the MV / LV substations:
motorized switches (MS) along MV feeders;
fault detectors along MV feeders (FD) having the same behaviour and settings of the protection relays at the beginning of the MV feeders (in the HV/MV substation) so that they are completely coordinated together;
voltage sensors (VS) able to detect the voltage by means of capacitive dividers installed on the motorized switch without the VT installation;
peripheral devices able to open/close switches and to communicate with the Control Centre (PU) means on the basis of internal automatons using signals coming from FD and VS
automatic reclosing cycles performed by circuit breakers installed at the beginning of MV feeders (in the HV/MV station).
The automation is integrated in the SCADA system, in such a way that it is possible to localize the fault, to insulate the faulty branch and to restore supply to healthy branches, both upstream the fault and downstream (by means of “border” switch generally closed remotely by the operator). The automation solution above illustrated operates in the following way.
1. When a fault occurs the circuit breaker opens and suddenly automatically re-closes (fast reclosing). If the fault persists the circuit breaker opens again while FDs upstream detect the fault.
2. The feeder is unsupplied during a pre-determined time (around 30”). During this time PUs open motorized switches on the basis of FDs&VS information.

FINAL REPORT
Annex III – Minimum Functional Requirements Page 250
3. After 30 s, the circuit breaker recloses (1st reclosing). All switches upstream the fault will be subsequently closed by PUs on the basis of voltage presence/absence
4. When the switch closest to fault closes, the circuit breaker opens
5. The feeder is unsupplied during a pre-determined time (around 70”). During this time PUs open motorized switches on the basis of FDs&VS information and block the closest to fault switch in the open position.
6. After 70 s, the circuit breaker recloses (2st reclosing). All switches upstream the fault will be subsequently closed by PUs on the basis of voltage presence/absence. Information on the faulted branch are sent to the remote control centre to
2.2 Volt-VAR control
Volt-VAR control in the distribution networks are generally aimed
to maintain acceptable voltages at all points along the feeder under all loading conditions,

FINAL REPORT
Annex III – Minimum Functional Requirements Page 251
to operate the distribution system to operate the distribution system at the lowest possible voltage without violating any load and voltage constraints,
to reduce losses along the lines.
2.2.1 Volt-VAR control to maintain acceptable voltages along feeders
Voltage profiles along MV lines are generally controlled by imposing a defined value at the MV bus-bar by means of the HV/MV tap-changer. The choice of this value is taken into consideration passive loads (no generators so that the resulting voltage profile is always decreasing) and defining a reference voltage appropriately high in CP so to compensate the voltage drop along the lines. So doing it is generally possible to maintain the voltage limit within defined ranges for the electrically more distant node (see Error! Reference source not found.).
Table 1: Voltage change in presence of Distributed Generators (DGs)
The voltage profile may be enhanced in long and loaded lines by using Switched Capacitor Banks or Line Voltage Regulators because they can compensate the reactive power (VAR) requested from loads. Of course, the results strongly depend on the type of lines and on the load flowing and it will be more effective in lines with more reactance, that is to say aerial ones, whereas negligible in the cable lines (see Table 2).
Table 2: Voltage change in presence of Capacitor Banks or Line Voltage Regulators

FINAL REPORT
Annex III – Minimum Functional Requirements Page 252
Another element to be taken into account is the presence of distributed generators (DGs) on the distribution networks. In fact, they may change the voltage determining a radical change in the voltage profile of MV lines: the connection of a generator along a MV line may in fact reverse power flows. This results in an increase of the voltage at that node and, more generally, in a variation of the voltage profile along the entire line that can reach critical (too high) values according to the size of the generator itself. In fact distribution feeders are characterized by resistance and reactance of quite same values, therefore an active power injection will result in a voltage increase.
On the other hand, the presence of Distributed Generators (DGs) may be a chance for the voltage control as they may exchange reactive power with the network as Capacitor Banks or Line Voltage Regulators if they would have suitable characteristics. At this aim, European Standards are required for photovoltaic and wind generators the capability to exchange reactive power with the network so acting as capacitors (but also inductors if needed) as shown in Table 3, from CENELEC Technical Standard
CLC/FprTS 50549-1 “Requirements for generating plants larger than 16 A per phase to be connected in parallel with a low-voltage distribution network”
and
CLC/FprTS 50549-2 “Requirements for generating plants to be connected in parallel with a medium-voltage distribution network”
Table 3: Reactive power capability of DGs
Finally, the voltage control may be enhanced if centrally coordinated, for instance by DMS (see Table 4), also performing losses reduction.
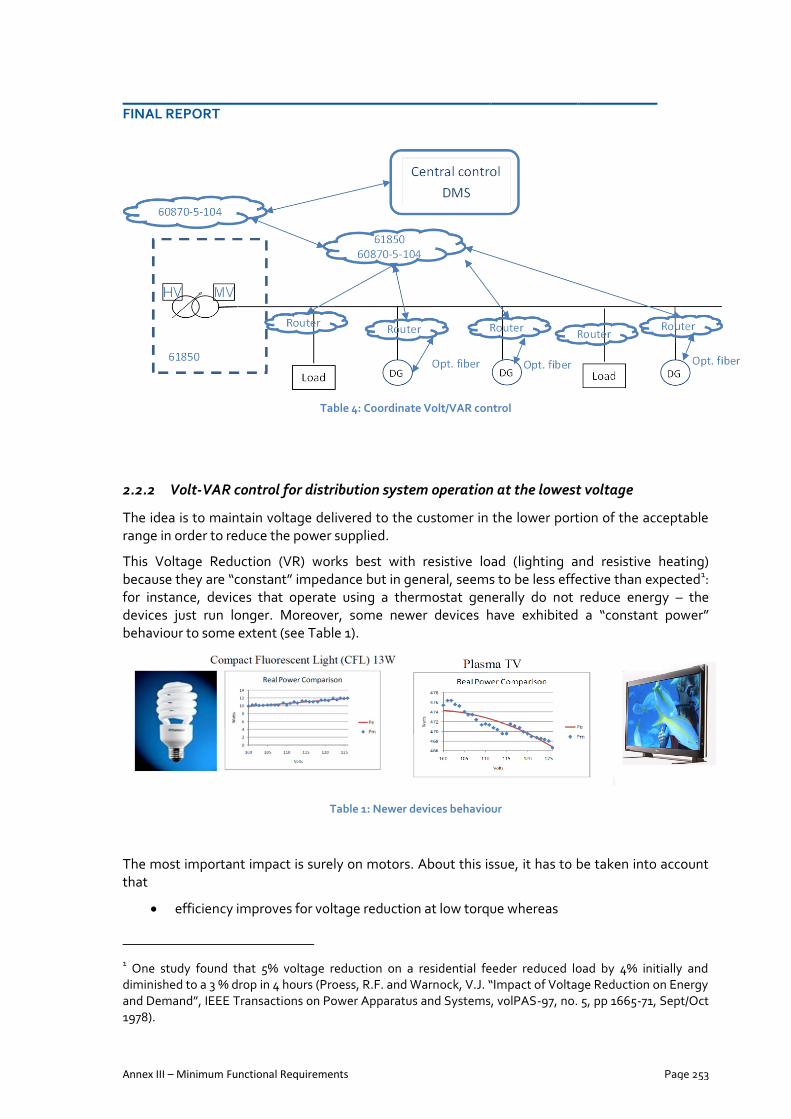
FINAL REPORT
Annex III – Minimum Functional Requirements Page 253
Table 4: Coordinate Volt/VAR control
2.2.2 Volt-VAR control for distribution system operation at the lowest voltage
The idea is to maintain voltage delivered to the customer in the lower portion of the acceptable range in order to reduce the power supplied.
This Voltage Reduction (VR) works best with resistive load (lighting and resistive heating) because they are “constant” impedance but in general, seems to be less effective than expected1: for instance, devices that operate using a thermostat generally do not reduce energy – the devices just run longer. Moreover, some newer devices have exhibited a “constant power” behaviour to some extent (see Table 1).
Table 1: Newer devices behaviour
The most important impact is surely on motors. About this issue, it has to be taken into account that
efficiency improves for voltage reduction at low torque whereas
1 One study found that 5% voltage reduction on a residential feeder reduced load by 4% initially and
diminished to a 3 % drop in 4 hours (Proess, R.F. and Warnock, V.J. “Impact of Voltage Reduction on Energy and Demand”, IEEE Transactions on Power Apparatus and Systems, volPAS-97, no. 5, pp 1665-71, Sept/Oct 1978).

FINAL REPORT
Annex III – Minimum Functional Requirements Page 254
negative effect occurs for heavily loaded motors (see Table 5), increasing current and reducing torque.
Table 5: Motor behaviour as a function of voltage
However, the Voltage Reduction (VR) may work, as illustrated in a recent report by EPRI, but it has to be centrally coordinated to reach best benefits in load reduction.
List of references:
EPRI - Conservation Voltage Reduction (CVR) and Volt/VAR Optimization (VVO)
Quanta Technology - Integrated Volt - VAR Control
2.3 Advanced control systems using DMS
Distribution (MV) networks are typically operated radially but they may change because as a consequence of faults or operation needs mainly due to active/reactive power flows. Changes are today generally realized on the basis of off-line calculation or operator “experience”. It’s therefore clear that a tool able to “give” suggestions on the best operation “options” would allow the operator to manage the network dynamically and, above all, efficiently.
To do that, it’s necessary to have data/measures coming from the field, a tool able to coordinate them and, of course, an efficient communication system.
The tool necessary for the dynamic network management is generally called DMS (Distribution Management System) and it gives to the power system engineer and dispatcher information/suggestion to effectively and efficiently engineer, plan and operate the distribution network.
In fact, it analyses dynamically changing distribution networks in real-time, while providing a study capability for both backward and forward review to identify options to improve network reliability while lowering electricity costs. Basically, DMS needs:

FINAL REPORT
Annex III – Minimum Functional Requirements Page 255
the network model with all aspects of the distribution network, including conductor types, transformers, switches (both manual and motorized), fuses, and other permanent and temporary devices used distribution system operations in order to have the connectivity based on the position of switches;
the dynamic data to enable the load flow and short circuit algorithms; it requires data telemetry from the distribution network (generally made available through supervisory control and data acquisition – SCADA systems) in order to have a variety of information (e.g. voltage, current) and device status (e.g. open/closed) so enabling the load flow/short circuit algorithm;
a state estimator, that is to say the ability to monitor certain nodes in the network for things such as voltage and current and solve by these information those parameters at another, not-measured, nodes.
By means of this ability to have a real-time picture of the network, DMS may solve the critical distribution network conditions (for instance overload in some branches) or can give suggestion on the best network configuration for a chosen goal (for instance, technical losses reduction, voltage profile optimization).
DMS may be effectively used to integrate a large number of renewable energy resources into the distribution network because it may help to maintain the balance needed to reliably operate different energy sources facing dynamic changes in demand and in the topology of the distribution network.
As an example, an optimal voltage control on the MV network of Table 6 showed that an increased Hosting Capacity (HC – capacity of a network to connect new generators without exceeding network constraints) can be achieved, according to the size and position of the new generators (see Table 7):
less far from the MV bus-bar the generator less influence on the HC,
more far from the MV bus-bar the generator more influence on the HC.
Table 6: Schematic representation of the network

FINAL REPORT
Annex III – Minimum Functional Requirements Page 256
Table 7: Hosting Capacity
A further and important application is related to the service restoration because of advanced DMS’s ability to locate faults and to provide ranked switching options to a dispatcher (e.g. prioritization based on connected load, connected customers, etc.) based on the dynamic state of the network.
2.4 Communication and IT infrastructures
For the purposes of optimal management of MV distribution networks an essential role is played by communication systems that allow the exchange of information between the different elements present on the networks themselves (circuit breakers, switches, PUs, loads, distributed generators) to make network operation reliable, safe and effective and to exploit possible synergies with the infrastructure and functionality already present.
Starting from the principle that all analysis and design adopted of a telecommunications system shall be originated from performance requirements (time of signal propagation and the volume of information exchanged), the information data exchange should interest.
the Control Centre,
the HV/MV station,
some MV/LV substations (critical or sensitive nodes for Voltage/Current monitoring or network configuration),
customers (for load profile),
distributed generators (for generation profile and network services as reactive power exchange),
some other nodes (critical or sensitive nodes for Volt/VAR applications)
The infrastructure that may be chosen include technologies (wired, ADSL, optical fibre or wireless, such as UMTS, WiMAX, LTE or an appropriate mix according to their availability), services (e.g. implementation of VLANs, firewalling, encryption, authentication, security in communications in general in terms of geography) and performances (latency, transmission time, etc.)
The implementation of local networks to the sites involved (Distributor and customers/producers) and their interfacing with the MV network may include structures typical of LAN networks (copper and / or fibre optics, where the electromagnetic pollution is relevant) with equipment (switches, routers, bridges, protocol adapters, firewalls and security against remote access) that are able to guarantee a suitable communication with the electrical world.
% DG % DG % DG DHC
1st
bus middle last cos j=1 cos j= ± 0,9 %
# 1 70 20 10 8,08 8,04 0%
# 2 50 30 20 5,49 8,02 46%
# 3 40 30 30 4,43 7,98 80%
# 4 30 30 40 3,8 7,92 108%
# 5 20 30 50 3,17 7,82 147%
# 6 10 20 70 2,53 7,57 199%
DG working at
Scenarios
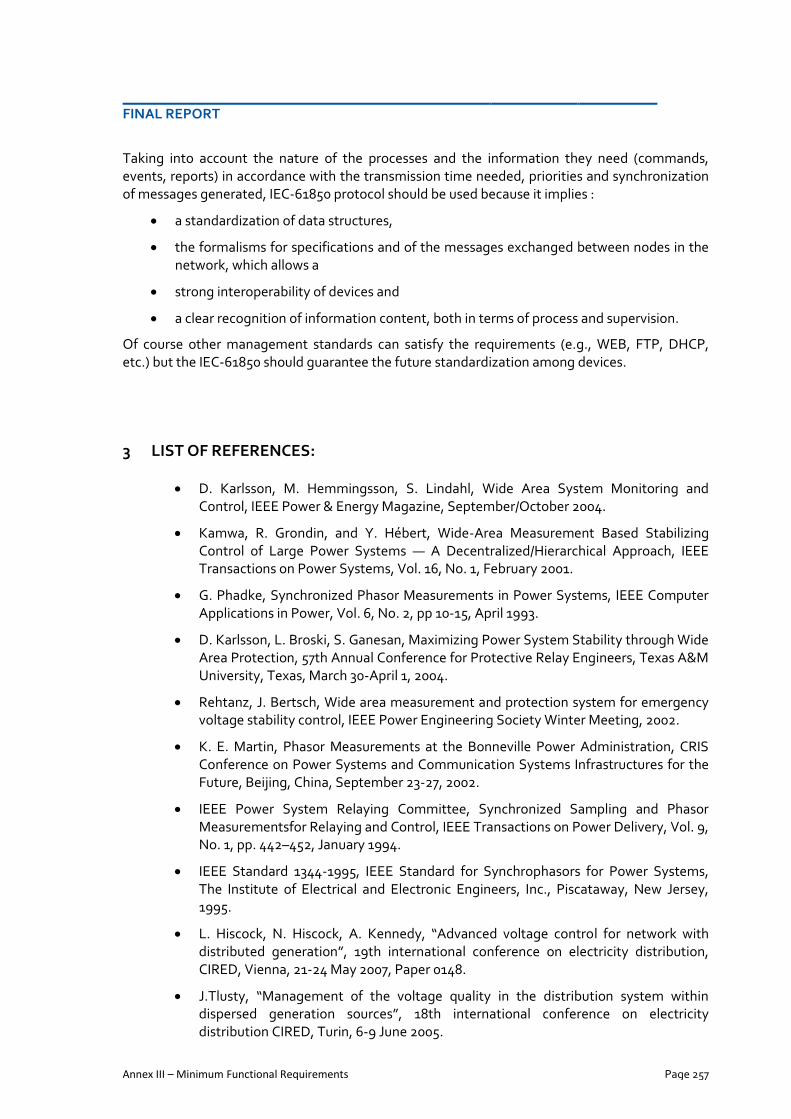
FINAL REPORT
Annex III – Minimum Functional Requirements Page 257
Taking into account the nature of the processes and the information they need (commands, events, reports) in accordance with the transmission time needed, priorities and synchronization of messages generated, IEC-61850 protocol should be used because it implies :
a standardization of data structures,
the formalisms for specifications and of the messages exchanged between nodes in the network, which allows a
strong interoperability of devices and
a clear recognition of information content, both in terms of process and supervision.
Of course other management standards can satisfy the requirements (e.g., WEB, FTP, DHCP, etc.) but the IEC-61850 should guarantee the future standardization among devices.
3 LIST OF REFERENCES:
D. Karlsson, M. Hemmingsson, S. Lindahl, Wide Area System Monitoring and Control, IEEE Power & Energy Magazine, September/October 2004.
Kamwa, R. Grondin, and Y. Hébert, Wide-Area Measurement Based Stabilizing Control of Large Power Systems — A Decentralized/Hierarchical Approach, IEEE Transactions on Power Systems, Vol. 16, No. 1, February 2001.
G. Phadke, Synchronized Phasor Measurements in Power Systems, IEEE Computer Applications in Power, Vol. 6, No. 2, pp 10-15, April 1993.
D. Karlsson, L. Broski, S. Ganesan, Maximizing Power System Stability through Wide Area Protection, 57th Annual Conference for Protective Relay Engineers, Texas A&M University, Texas, March 30-April 1, 2004.
Rehtanz, J. Bertsch, Wide area measurement and protection system for emergency voltage stability control, IEEE Power Engineering Society Winter Meeting, 2002.
K. E. Martin, Phasor Measurements at the Bonneville Power Administration, CRIS Conference on Power Systems and Communication Systems Infrastructures for the Future, Beijing, China, September 23-27, 2002.
IEEE Power System Relaying Committee, Synchronized Sampling and Phasor Measurementsfor Relaying and Control, IEEE Transactions on Power Delivery, Vol. 9, No. 1, pp. 442–452, January 1994.
IEEE Standard 1344-1995, IEEE Standard for Synchrophasors for Power Systems, The Institute of Electrical and Electronic Engineers, Inc., Piscataway, New Jersey, 1995.
L. Hiscock, N. Hiscock, A. Kennedy, “Advanced voltage control for network with distributed generation”, 19th international conference on electricity distribution, CIRED, Vienna, 21-24 May 2007, Paper 0148.
J.Tlusty, “Management of the voltage quality in the distribution system within dispersed generation sources”, 18th international conference on electricity distribution CIRED, Turin, 6-9 June 2005.

FINAL REPORT
Annex III – Minimum Functional Requirements Page 258
P.N. Vovos, A.E. Kiprakis et al., “Centralized and distributed voltage control: impact in distributed generation penetration”, IEEE Transactions on power systems, Vol. 22, No. 1, 2007, pp. 437-483.
A.Bonhomme, D. Cortinas, F. Boulanger, J.-L- Fraisse, “A new voltage control system to facilitate the connection of dispersed generation to distribution networks”, CIRED 2001, 18-21 June 2001, conference publication no. 482 IEE 2001.
M .Delfanti, M. Merlo, G. Monfredini, V. Olivieri, M. Pozzi, A. Silvestri, “Hosting dispersed generation on Italian MV networks: towards smart grids”, paper 1404, ICHQP 2010 14th international conference on HARMONICS AND QUALITY OF POWER, Bergamo Italy, 26-29 September 2010.
CIRED - TELECONTROL AND AUTOMATION ON ENEL DISTRIBUZIONE'S NETWORK : STRATEGY AND RESULTS - 17th International Conference on Electricity Distribution Barcelona, 12-15 May 2003
CIRED - IMPROVEMENT IN THE CONTINUITY OF SUPPLY DUE TO A LARGE INTRODUCTION OF PETERSEN COILS IN HV/MV SUBSTATIONS - 18th International Conference on Electricity Distribution Turin, 6-9 June 2005