
Slum Analysis: Community Led Sangli Sanitation … Alliance Project Output Slum Analysis: Community...
40
Cities Alliance Project Output Slum Analysis: Community Led Sangli Sanitation Project Phase III Community-Led Sangli Toilet Construction Activity P090339 This project output was created with Cities Alliance grant funding.
Transcript of Slum Analysis: Community Led Sangli Sanitation … Alliance Project Output Slum Analysis: Community...
Cities Alliance Project Output
Slum Analysis: Community Led Sangli Sanitation Project Phase III
Community-Led Sangli Toilet Construction Activity
P090339
This project output was created with Cities Alliance grant funding.
COMMUNITY-LED SANGLI TOILET PROJECT: PHASE III
DRAFT FINAL REPORT
SUBMITTED BY
SHELTER ASSOCIATES, PUNE
April 2006
THE FINANCIAL INSTITUTIONS REFORM AND EXPANSION PROJECT,
DEBT MARKET/INFRASTRUCTURE COMPONENT
wb348801
Cross-Out
wb348801
Rectangle
wb348801
Rectangle
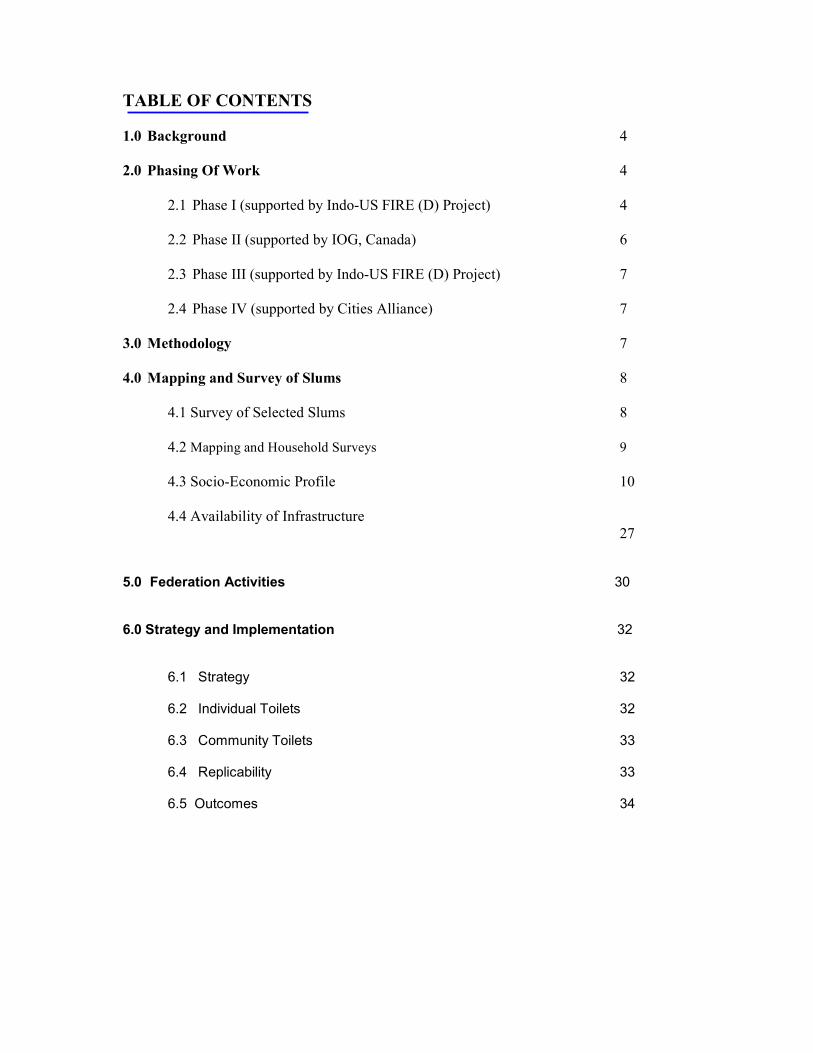
TABLE OF CONTENTS
1.0 Background 4
2.0 Phasing Of Work 4
2.1 Phase I (supported by Indo-US FIRE (D) Project) 4
2.2 Phase II (supported by IOG, Canada) 6
2.3 Phase III (supported by Indo-US FIRE (D) Project) 7
2.4 Phase IV (supported by Cities Alliance) 7
3.0 Methodology 7
4.0 Mapping and Survey of Slums 8
4.1 Survey of Selected Slums 8
4.2 Mapping and Household Surveys 9
4.3 Socio-Economic Profile 10
4.4 Availability of Infrastructure
27 5.0 Federation Activities 30
6.0 Strategy and Implementation 32
6.1 Strategy 32
6.2 Individual Toilets 32
6.3 Community Toilets 33
6.4 Replicability 33
6.5 Outcomes 34
2
Annex I- Map of SMKMC showing location of the twelve slums Annex II- Individual maps of twelve settlements
1. Kolhapur Chawl 2. Jalit Vasahat 3. Bouddha Vasahat 4. Jatkar Samaj 5. Khaja Slum 6. Sanjay Nagar 7. Chintamani Nagar 8. IndiraNagar Gharkul 9. Kaman Ves 10. IndiraNagar Open Space 11. Indira Nagar 12. Sanjay Nagar Patra Chawl
Annex III- Demonstration of mapping analysis using GIS Annex IV- Fact sheet of each slum
1. Kolhapur Chawl 2. Jalit Vasahat 3. Bouddha Vasahat 4. Jatkar Samaj 5. Khaja Slum 6. Sanjay Nagar 7. Chintamani Nagar 8. IndiraNagar Gharkul 9. Kaman Ves 10. IndiraNagar Open Space 11. Indira Nagar 12. Sanjay Nagar Patra Chawl
3
Abbreviations SMKMC: Sangli-Miraj-Kupwad Municipal Corporation Indo-US FIRE (D) Project: Indo US Financial Institutions Reform and Expansion (D) Project SA: Shelter Associates CA: Cities Alliance USAID: United States Agency for International Development IOG: Institute On Governance MHADA: Maharashtra Housing and Development Authority NBA: Nirmal Bharat Abhiyan CBO: Community based organization NGO: Non-Governmental Organization VAMBAY: Valmiki Ambedkar Awas Yojana

4
1.0 BACKGROUND The Sangli Miraj Kupwad Corporation (SMKMC) is a rapidly growing city in the state of Maharashtra, with a population that has almost reached half a million citizens. Almost 15% of its citizens live in slum settlements and lack access to basic infrastructure and civic amenities. The city is currently experiencing rapid growth that will have a major impact on all the 99 slums within the municipality. Many slums covering over 2000 households are being relocated as a result of road widening under the VAMBAY scheme. SMKMC is undertaking a Community-Led Toilet Project in the city in 12 slum settlements that have been short-listed for sanitation inputs and upgradation. They cover approximately 3500 households.
2.0 PHASING OF THE PROJECT
The Indo-US FIRE (D) project is working with SMKMC since 2001. This support has continued to the present day even with changes in administrative heads. The overall involvement in SMKMC can be divided into the following four phases.
2.1 Phase I (supported by Indo-US FIRE (D) Project) Shelter Associates (SA), a Pune based NGO, began work in Sangli with the Indo-US FIRE project in April of 2001. Phase I of the project looked at improving the access of basic services to the poor in Sangli. The role of SA was to identify all slums in the SMKMC and carry out preliminary surveys of settlements to identify the kind of services that existed within the settlements. The project was brought to a successful conclusion in November of 2001. Some of the key findings of the report has been tabulated below.

5
General Information about Slums Table 2.1 : Slums at a Glance- SMK-MC
Slums Households Area within the SMK-MC Sangli 49 4909 Miraj 39 4088 Kupwad 11 1879 Total Number 99 10876 Legal status Declared/ partly declared 29 5889 undeclared 70 4987 10876 Slums existing prior to 1995 97 Land ownership Slums on Public Land 68 7860 Slums on partly public/partly private land 2 253 Slums on private land 29 2763 Ownership status of slum dwellers Number of slums where people "own" their houses 93 7860 Number of slums where people are tenants 6 3016 Condition of houses Slums with mainly kutcha houses 64 4854 Slums with mainly semi-pucca houses 12 1463 Slums with kutcha and pucca houses together 11 2830 Slums with pucca houses 12 1727 Services and infrastructure Paving Paved lanes covering full or part of slum 29 5376 Slums with only kutcha lanes 70 5500 Garbage no clearance, no bins 38 3645 only clearance 46 5085 bins but no clearance 4 335 bins and clearance 7 981 community initiative 4 830 Drainage Slums with gutters 38 4697 Slums with no gutters 58 5593 slums with covered or underground 3 586 Sanitation Slums with no toilet facilities 77 6776 Slums with common toilets 22 4100 Street and electric lighting Slums with no electricity or street lighting 25 1714 Slums with electricity 74 9162 Water supply Slums with access to some form of community water
supply 79 9162
Slums with no access to water supply 20 1714 Source: Primary Slum Settlement survey, SA/ Baandhani, Sangli, 2001.
6
2.2 Phase II (supported by IOG, Canada)
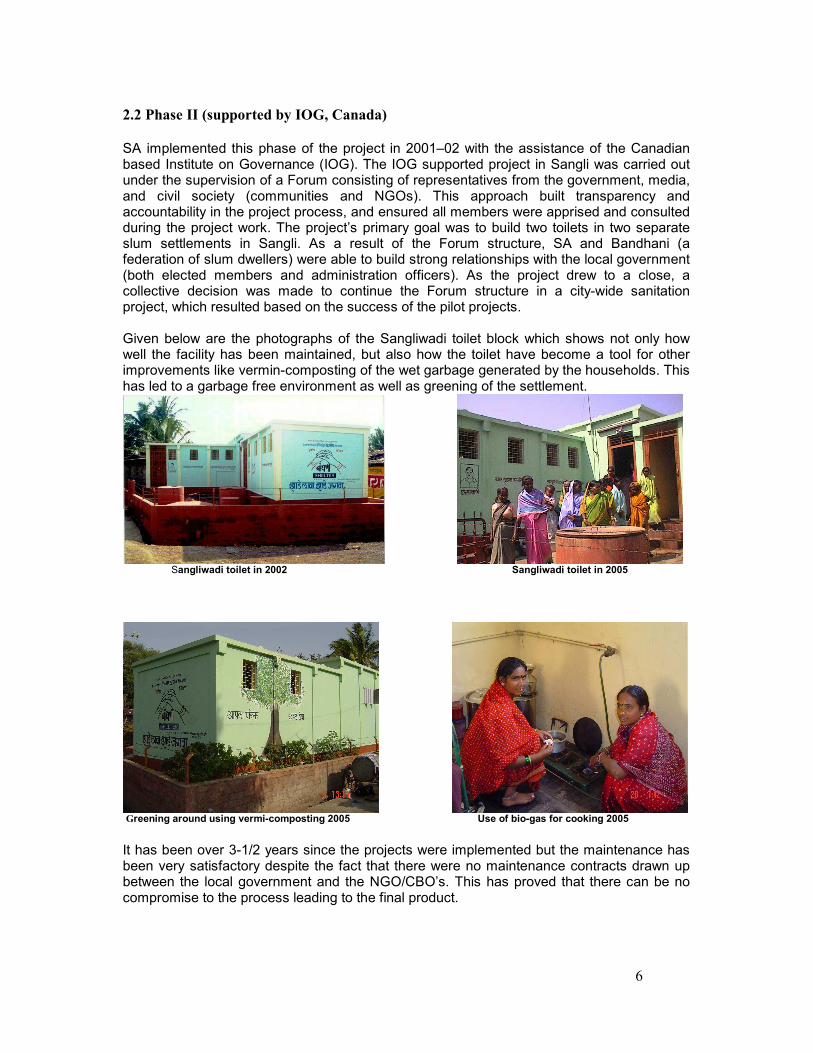
SA implemented this phase of the project in 2001–02 with the assistance of the Canadian based Institute on Governance (IOG). The IOG supported project in Sangli was carried out under the supervision of a Forum consisting of representatives from the government, media, and civil society (communities and NGOs). This approach built transparency and accountability in the project process, and ensured all members were apprised and consulted during the project work. The project’s primary goal was to build two toilets in two separate slum settlements in Sangli. As a result of the Forum structure, SA and Bandhani (a federation of slum dwellers) were able to build strong relationships with the local government (both elected members and administration officers). As the project drew to a close, a collective decision was made to continue the Forum structure in a city-wide sanitation project, which resulted based on the success of the pilot projects. Given below are the photographs of the Sangliwadi toilet block which shows not only how well the facility has been maintained, but also how the toilet have become a tool for other improvements like vermin-composting of the wet garbage generated by the households. This has led to a garbage free environment as well as greening of the settlement.
Sangliwadi toilet in 2002 Sangliwadi toilet in 2005
Greening around using vermi-composting 2005 Use of bio-gas for cooking 2005
It has been over 3-1/2 years since the projects were implemented but the maintenance has been very satisfactory despite the fact that there were no maintenance contracts drawn up between the local government and the NGO/CBO’s. This has proved that there can be no compromise to the process leading to the final product.
7
2.3 Phase III (supported by Indo-US FIRE (D) Project)
Based on the success of the community managed toilet projects that were taken up on a pilot basis, SMKMC and SA decided to replicate this model citywide. To ensure that services are equitably distributed and reach out to the most vulnerable amongst the poor, mapping and surveys were carried out for slums that have been jointly short-listed by SA and SMKMC. It built upon the information collected as part of Phase I. This would provide an information base and become a useful tool in planning and designing sanitation projects.
2.4 Phase IV (supported by Cities Alliance)
The Cities Alliance (CA) and USAID’s Community Water and Sanitation Facility (CWSF) is supporting "Sangli Community-Led Toilet Project" that involves creating the conditions for city-wide, community-driven slum upgradation through community mobilization, public-private cooperation, and expanded micro-credit savings plan. It is assisting about 3600 households distributed over various slums in Sangli to gain access to community toilets. This will cover about 35% of total slum households of the city. Total amount of support from CA is US$ 182,000 and out of this US$107,000 is for actual construction and the remaining amount for technical assistance. CA will bear about 20% of construction cost of the toilets and Government of India, State Government and SMKMC will bear the remaining amount. The technical assistance rendered by SA includes building federations in slums through saving groups and enumerations, designing the facilities, co-ordination with the local administration for effective implementation of the projects as well as assisting the local government to access funds for construction of toilets from the Central and State Governments.
3.0 METHODOLOGY Two kinds of data was collected. One was physical data i.e. the detailed map of the settlement using plane table methods. Houses, electric poles, common water points, other amenities, toilets, manholes, street lights, telephone poles, surface gutters, garbage containers, trees, etc. have been marked. The second level of data is based on each individual household and includes a breakdown of members, employment records, poverty indicators, educational status and other relevant social data. Records are made of each member’s ration card, and whether or not it exists on the electoral roll and other government documents. This gives a two-layered profile of the slum, enabling it to be examined on a regional to an individual household basis. Trained staff from SA then processed this data. The socio-economic data were entered and recorded on Microsoft Access/Excel, then integrated with the AutoCAD maps from plane table surveys using the GIS software. The detailed analysis of each and every settlement was compiled in the form of individual reports. The process of data collection at the settlement and household level was completed by the field staff under the supervision of SA social workers. The field staff consisted of trained community people from Baandhani and SA social workers. All houses were numbered and a master list was compiled. Then door-to-door surveys were conducted and three sets of forms were filled out. All the slums were surveyed and mapped in detail and the data and maps were integrated on GIS software. Fact sheets giving information about slums at a glance were compiled. An individual detailed report was compiled for every settlement giving an in-depth analysis and all this information was put together for the Interim Report, which was submitted in August 2005 to the FIRE Project.

8
Subsequently the information for these twelve slums of Sangli and Miraj was collated to understand and compare the situation that exists in each settlement with the rest. The comparison and analysis was made under various sections like population, family size, caste, occupations/employment, incomes, families below poverty level, existing infrastructure, etc. The slums have been marked on the map of SMKMC to show how they are located within the city (Annex 1). Role of Partners: The project is being implemented through a partnership among a number of organizations. Table below gives roles of different partners in the project.
Partners Major Roles SMK Municipal Corporation
Approval of the partnership approach, providing available information, assistance with survey, identification of slums, availing grant from MHADA, provide land, electricity and water supply, jointly responsible for design, tendering and supervision of construction, support to NGO/CBOs at local level, overall monitoring of works, etc.
Shelter Associates (NGO)
Citywide survey of slums, identification of problems, physical surveys of selected slums, jointly responsible for design, tendering and construction supervision, exchange visits, training of community women groups, and overall supervision of the project, co-ordination, etc. Built opportunities for a dialogue between authorities and the poor. Also liaison with public organizations and financing agencies. Thus the NGO’s role is pivotal.
Bandhani (CBO) Formation of micro-credit groups, enumeration of communities, formation of toilet committees, orientation and support to community groups/toilet committee leaders in design, construction supervision and maintenance of toilets, etc.
Community Women Groups/Toilet Committees
Participation in micro-credit activities, design, construction supervision, maintenance, collection of monthly charge, etc.
Cities Alliance/USAID/FIRE
Support for technical assistance and partial grant for construction of the toilet blocks.
MAHADA/Government of India
Grant for construction of community toilets under NBA and monitoring progress of works.
4.0 MAPPING AND SURVEY OF SLUMS
4.1 Survey of Selected Slums
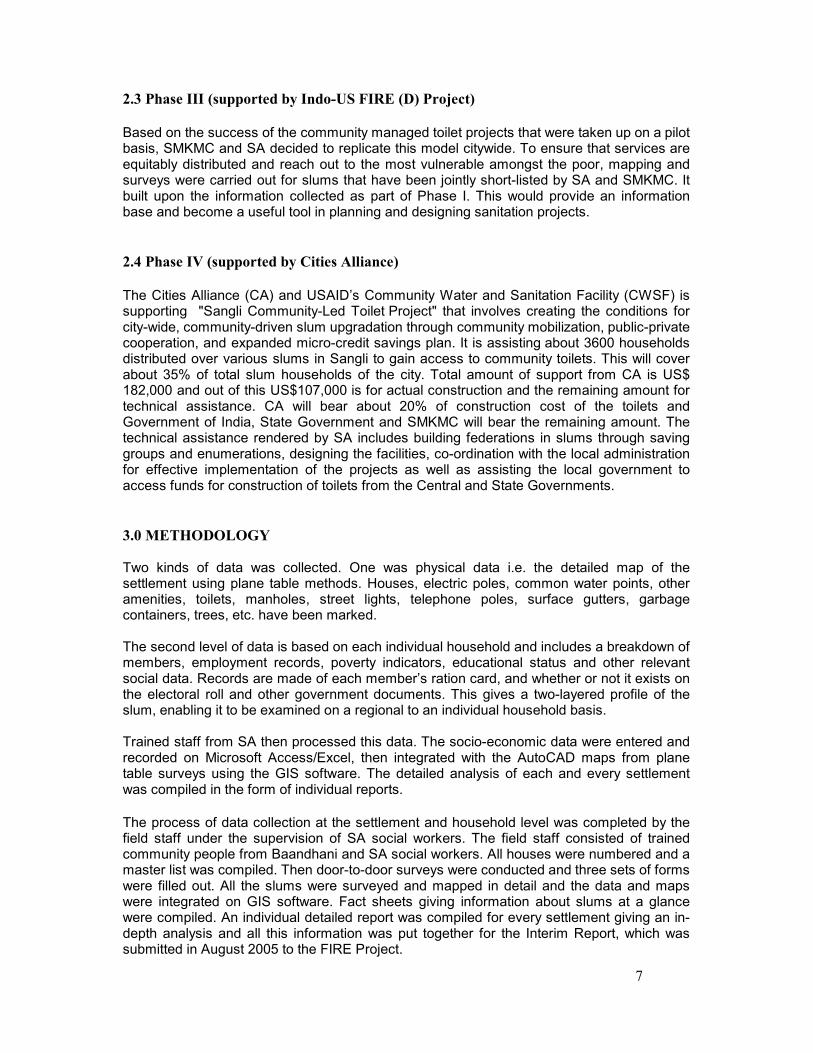
SA and SMKMC jointly identified twelve slums in Sangli and Miraj to be covered by the project. These slums have very minimal or no access to toilet facilities. These pockets comprised approximately 3500 structures in all. The Slum Department and SA also jointly approved the questionnaire for the surveys that were to be carried out. List of twelve settlements identified for the project is presented in Table 4.1.
9
Table 4.1: List of Settlements covered by the Project, SMKMC
Sr.
No.
Name of Slum No.of
Households
(approx.)
Location
1 Khaja Vasti 120 Miraj
2 Sanjay Nagar Patra
Chawl
250 Sangli
3 Indira Nagar Gharkul 325 Miraj
4 Jatkar Samaj 175 Miraj
5 Jalit Vasahat 525 Sangli
6 Indira Nagar 825 Sangli
7 Kaman Ves 290 Miraj
8 Boudha Vasahat 340 Miraj
9 Kolhapur Chawl 160 Miraj
10 Chintamani Nagar 150 Sangli
11 Indira Nagar Open
Space
100 Sangli
12 Sanjay Gandhi Nagar 350 Miraj
4.2 Mapping and Household Surveys
All the short-listed slums have been mapped and household surveys completed. These data were collated and detailed reports compiled for each and every slum. The analysed data were extremely crucial in planning out strategies for the individual slums. Individual maps of slums are presented in Annex A.2. Demonstration of use of mapping and GIS in developing strategies is presented in Annex A.3. The fact sheets of all slums are presented in Annex. A.4 The socio-economic data especially pertaining to caste, family size and occupations and income of families revealed the varying capacities of families within a slum to pay for services. It is important to know caste breakdown of a slum in order to see if the community qualifies for benefits that are available to those belonging to backward castes. In order to qualify for the Nirmal Bharat Abhiyan (NBA) funds available for building community toilets, 50% of the residents in the slum must belong to the Schedule Castes/Scheduled Tribes and other backward classes. This percentage is also crucial in getting communities other forms of aid from the Government like small loans for setting up businesses, grants for building community centres, etc. Family size, which includes numbers of males, females, and children (under 5 years of age), is important to help determine how many seats need to be incorporated in community toilet facilities. The ratio prescribed by the Government is 1 seat per 40 persons. This project will provide a separate facility for children less than 5 years of age. So this break up is vital for designing adequate facilities.
Income is related to the issue of ability to pay for services. As all the community toilets are on a pay and use basis, it is important to determine what are the employment and income patterns. For example, in one of the slums- Khwaja Vasti, in which almost 93% live below poverty level, the families have flatly refused to pay for the maintenance of the toilets. Information about income is used in conjunction with information about employment and family size to determine poverty levels. Since saving groups are a part of Baandhani Federation activity, an idea of average incomes also helps to determine amounts that can be reasonably saved by families over a period of time.
10
4.3 Socio-economic Profile
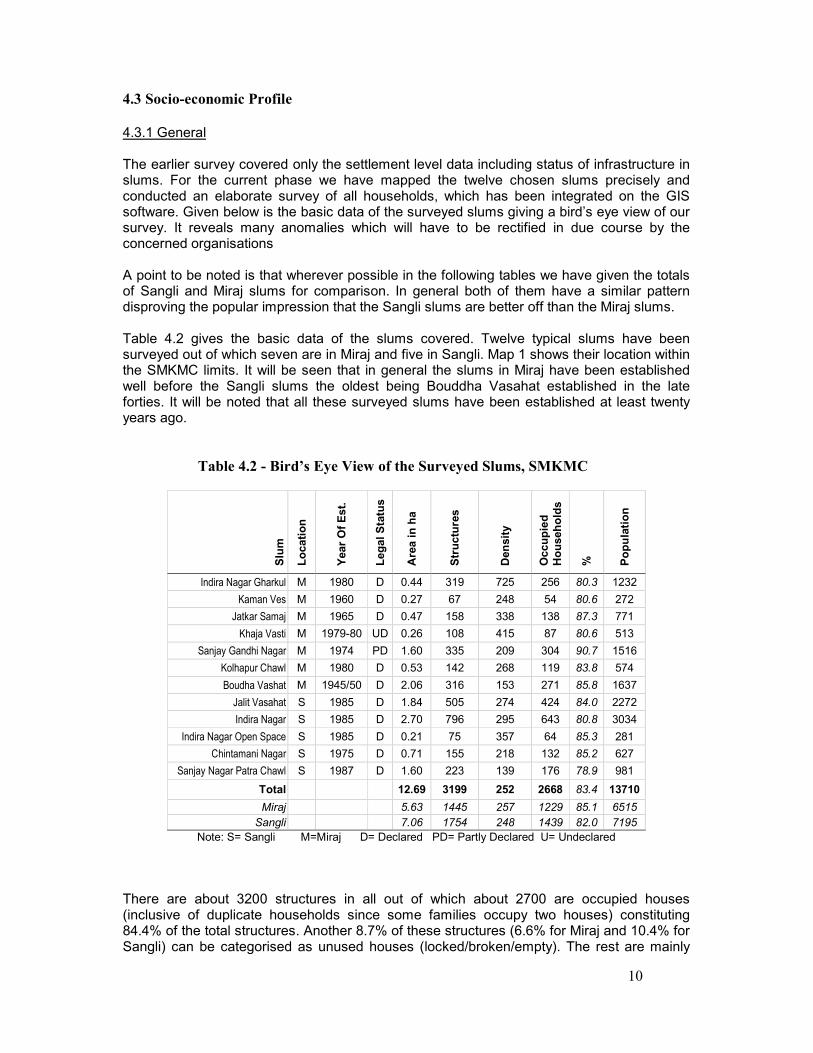
4.3.1 General The earlier survey covered only the settlement level data including status of infrastructure in slums. For the current phase we have mapped the twelve chosen slums precisely and conducted an elaborate survey of all households, which has been integrated on the GIS software. Given below is the basic data of the surveyed slums giving a bird’s eye view of our survey. It reveals many anomalies which will have to be rectified in due course by the concerned organisations A point to be noted is that wherever possible in the following tables we have given the totals of Sangli and Miraj slums for comparison. In general both of them have a similar pattern disproving the popular impression that the Sangli slums are better off than the Miraj slums. Table 4.2 gives the basic data of the slums covered. Twelve typical slums have been surveyed out of which seven are in Miraj and five in Sangli. Map 1 shows their location within the SMKMC limits. It will be seen that in general the slums in Miraj have been established well before the Sangli slums the oldest being Bouddha Vasahat established in the late forties. It will be noted that all these surveyed slums have been established at least twenty years ago.
Table 4.2 - Bird’s Eye View of the Surveyed Slums, SMKMC
Slum
Location
Year Of Est.
Legal Status
Area in ha
Structures
Density
Occupied
Households
%
Population
Indira Nagar Gharkul M 1980 D 0.44 319 725 256 80.3 1232
Kaman Ves M 1960 D 0.27 67 248 54 80.6 272
Jatkar Samaj M 1965 D 0.47 158 338 138 87.3 771
Khaja Vasti M 1979-80 UD 0.26 108 415 87 80.6 513
Sanjay Gandhi Nagar M 1974 PD 1.60 335 209 304 90.7 1516
Kolhapur Chawl M 1980 D 0.53 142 268 119 83.8 574
Boudha Vashat M 1945/50 D 2.06 316 153 271 85.8 1637
Jalit Vasahat S 1985 D 1.84 505 274 424 84.0 2272
Indira Nagar S 1985 D 2.70 796 295 643 80.8 3034
Indira Nagar Open Space S 1985 D 0.21 75 357 64 85.3 281
Chintamani Nagar S 1975 D 0.71 155 218 132 85.2 627
Sanjay Nagar Patra Chawl S 1987 D 1.60 223 139 176 78.9 981
Total 12.69 3199 252 2668 83.4 13710
Miraj 5.63 1445 257 1229 85.1 6515
Sangli 7.06 1754 248 1439 82.0 7195
Note: S= Sangli M=Miraj D= Declared PD= Partly Declared U= Undeclared
There are about 3200 structures in all out of which about 2700 are occupied houses (inclusive of duplicate households since some families occupy two houses) constituting 84.4% of the total structures. Another 8.7% of these structures (6.6% for Miraj and 10.4% for Sangli) can be categorised as unused houses (locked/broken/empty). The rest are mainly
11
public amenities, petty shops and places of worship. A point to note is that no NGO functions in any of the slums. The surveyed slums all fall within the density norms as prescribed by the SRA, i.e. 360 houses per hectare. Only two Miraj slums, Indira Nagar Gharkul and Khwaja Vasti, exceed this norm. But even then the density is much lower than that found in Metros. All the Sangli slums are declared but two of the older Miraj slums which house about 31% of the Miraj slum population are undeclared and partly declared. The total slum area is 12.69 hectare and average tenements per hectare is 252, the density being slightly more in Miraj as compared to Sangli. Having taken an overall look at the surveyed slums, we shall next go into greater details in the tables and charts that follow about the people living in these slums, their environment and living conditions. 4.3.2 Structures
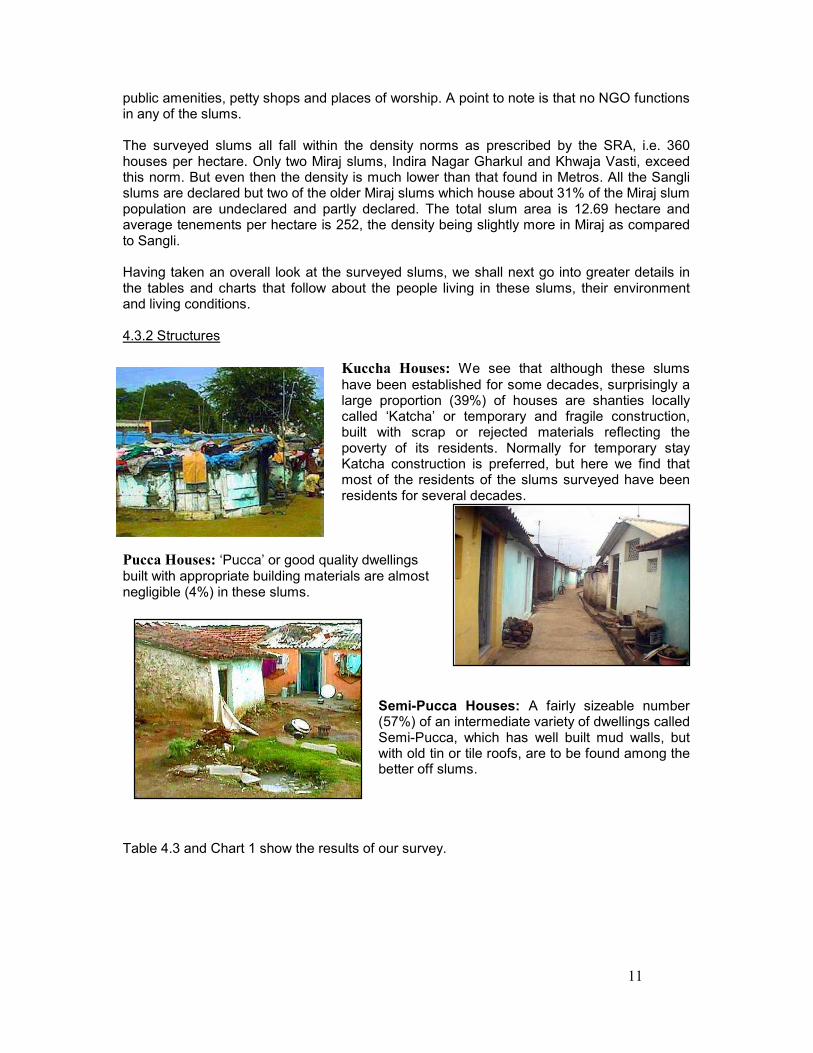
Kuccha Houses: We see that although these slums have been established for some decades, surprisingly a large proportion (39%) of houses are shanties locally called ‘Katcha’ or temporary and fragile construction, built with scrap or rejected materials reflecting the poverty of its residents. Normally for temporary stay Katcha construction is preferred, but here we find that most of the residents of the slums surveyed have been residents for several decades.
Pucca Houses: ‘Pucca’ or good quality dwellings built with appropriate building materials are almost negligible (4%) in these slums.
Semi-Pucca Houses: A fairly sizeable number (57%) of an intermediate variety of dwellings called Semi-Pucca, which has well built mud walls, but with old tin or tile roofs, are to be found among the better off slums.
Table 4.3 and Chart 1 show the results of our survey.
12
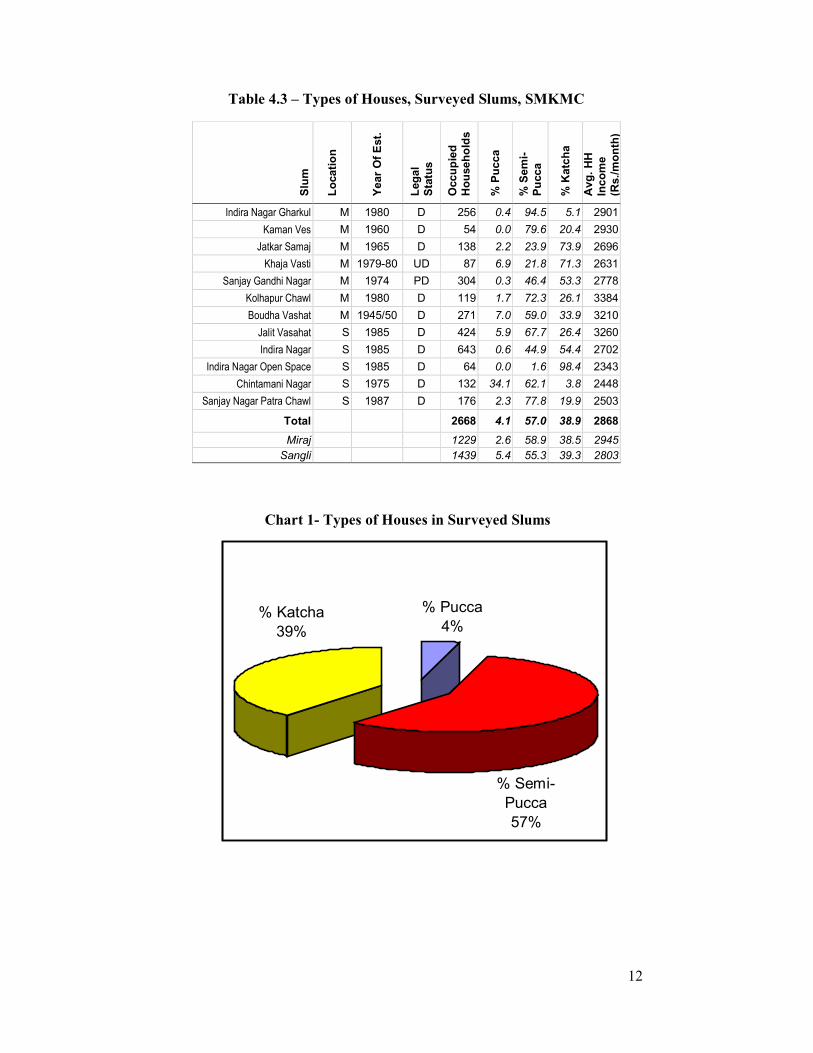
Table 4.3 – Types of Houses, Surveyed Slums, SMKMC
Slum
Location
Year Of Est.
Legal
Status
Occupied
Households
% Pucca
% Semi-
Pucca
% Katcha
Avg. HH
Income
(Rs./month)
Indira Nagar Gharkul M 1980 D 256 0.4 94.5 5.1 2901
Kaman Ves M 1960 D 54 0.0 79.6 20.4 2930
Jatkar Samaj M 1965 D 138 2.2 23.9 73.9 2696
Khaja Vasti M 1979-80 UD 87 6.9 21.8 71.3 2631
Sanjay Gandhi Nagar M 1974 PD 304 0.3 46.4 53.3 2778
Kolhapur Chawl M 1980 D 119 1.7 72.3 26.1 3384
Boudha Vashat M 1945/50 D 271 7.0 59.0 33.9 3210
Jalit Vasahat S 1985 D 424 5.9 67.7 26.4 3260
Indira Nagar S 1985 D 643 0.6 44.9 54.4 2702
Indira Nagar Open Space S 1985 D 64 0.0 1.6 98.4 2343
Chintamani Nagar S 1975 D 132 34.1 62.1 3.8 2448
Sanjay Nagar Patra Chawl S 1987 D 176 2.3 77.8 19.9 2503
Total 2668 4.1 57.0 38.9 2868
Miraj 1229 2.6 58.9 38.5 2945
Sangli 1439 5.4 55.3 39.3 2803
Chart 1- Types of Houses in Surveyed Slums
% Pucca
4%% Katcha
39%
% Semi-
Pucca
57%
13
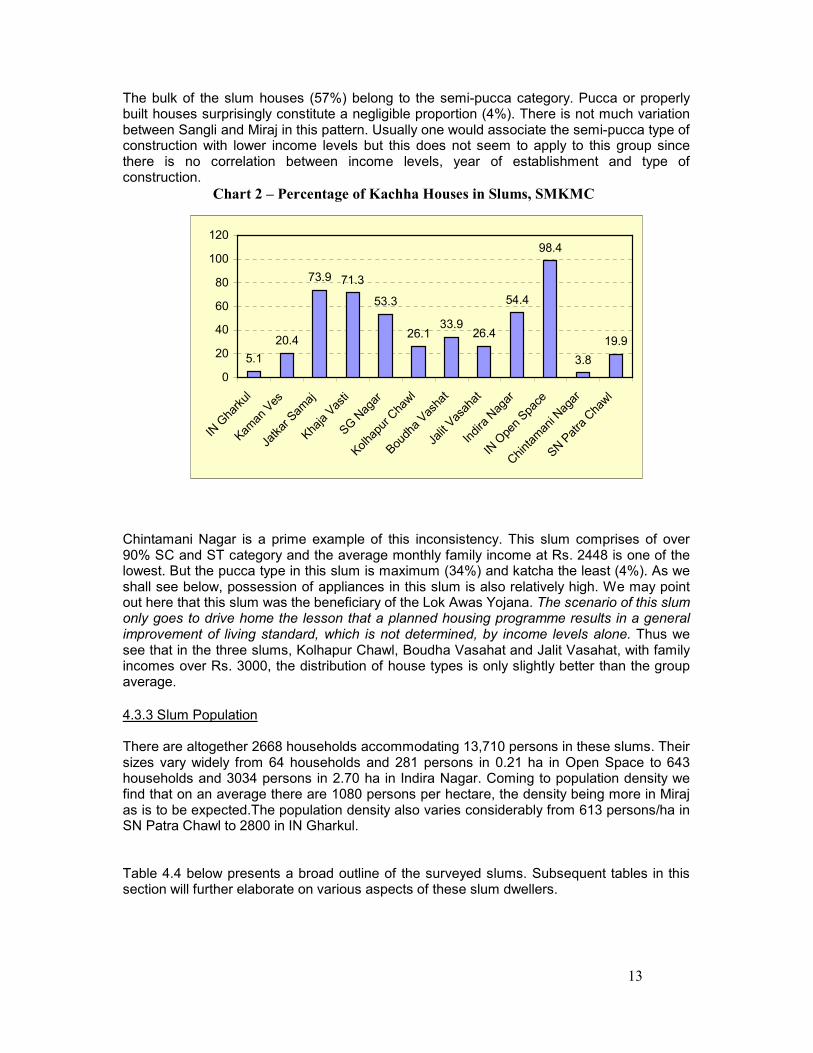
The bulk of the slum houses (57%) belong to the semi-pucca category. Pucca or properly built houses surprisingly constitute a negligible proportion (4%). There is not much variation between Sangli and Miraj in this pattern. Usually one would associate the semi-pucca type of construction with lower income levels but this does not seem to apply to this group since there is no correlation between income levels, year of establishment and type of construction. Chart 2 – Percentage of Kachha Houses in Slums, SMKMC
Chintamani Nagar is a prime example of this inconsistency. This slum comprises of over 90% SC and ST category and the average monthly family income at Rs. 2448 is one of the lowest. But the pucca type in this slum is maximum (34%) and katcha the least (4%). As we shall see below, possession of appliances in this slum is also relatively high. We may point out here that this slum was the beneficiary of the Lok Awas Yojana. The scenario of this slum only goes to drive home the lesson that a planned housing programme results in a general improvement of living standard, which is not determined, by income levels alone. Thus we see that in the three slums, Kolhapur Chawl, Boudha Vasahat and Jalit Vasahat, with family incomes over Rs. 3000, the distribution of house types is only slightly better than the group average. 4.3.3 Slum Population There are altogether 2668 households accommodating 13,710 persons in these slums. Their sizes vary widely from 64 households and 281 persons in 0.21 ha in Open Space to 643 households and 3034 persons in 2.70 ha in Indira Nagar. Coming to population density we find that on an average there are 1080 persons per hectare, the density being more in Miraj as is to be expected.The population density also varies considerably from 613 persons/ha in SN Patra Chawl to 2800 in IN Gharkul. Table 4.4 below presents a broad outline of the surveyed slums. Subsequent tables in this section will further elaborate on various aspects of these slum dwellers.
5.1
20.4
73.9 71.3
53.3
26.133.9
26.4
54.4
98.4
3.8
19.9
0
20
40
60
80
100
120
IN Gharkul
Kaman Ves
Jatkar Samaj
Khaja Vasti
SG Nagar
Kolhapur Chawl
Boudha Vashat
Jalit Vasahat
Indira Nagar
IN Open Space
Chintamani Nagar
SN Patra Chawl
14
Table 4.4 – Population Of Surveyed Slums, SMKMC
Slum
Indira Nagar
Gharkul
Kam
an Ves
Jatkar Sam
aj
Khaja Vasti
Sanjay Gandhi
Nagar
Kolhapur Chawl
Boudha Vashat
Jalit Vasahat
Indira Nagar
Indira Nagar
Open Space
Chintam
ani
Nagar
Sanjay Nagar
Patra Chawl
To
tal
Mir
aj
San
gli
Location M M M M M M M S S S S S
Households 256 54 138 87 304 119 271 424 643 64 132 176 2668 1229 1439
% Hindu 82.4 100 63.0 8.0 85.2 88.2 100 98.8 90.5 89.1 100 93.2 88.0 80.9 94.1
% Muslim 17.2 0.0 37.0 92.0 14.5 5.9 0.0 1.2 8.9 10.9 0.0 6.8 11.5 18.4 5.6
% Christian 0.4 0.3 5.9 0.6 0.5 0.7 0.3
WHH 23 9 34 11 32 66 175 109 66
Persons 1232 272 771 513 1516 574 1637 2272 3034 281 627 981 13710 6515 7195
% Total 9.0 2.0 5.6 3.7 11.1 4.2 11.9 16.6 22.1 2.0 4.6 7.2 47.5 52.5
Male 633 133 376 258 767 270 804 1125 1510 127 291 509 6803 3241 3562
Female 599 139 395 255 749 304 833 1147 1524 154 336 472 6907 3274 3633
Persons/ha 2800 1007 1640 1973 948 1083 795 1234 1124 1338 883 613 1080 1157 1019
Sex Ratio 946 1045 1051 988 977 1126 1036 1020 1009 1213 1155 927 1015 1010 1020
Religion
% Hindu 83.6 100 56.4 6.2 84.8 85.0 100 99.3 89.5 86.1 100 92.5 87.0 79.5 93.8
% Muslim 16.3 0.0 43.6 93.8 14.9 7.5 0.0 0.7 10.1 13.9 0.0 7.5 12.6 19.8 6.1
% Christian 0.1 0.3 7.5 0.4 0.4 0.7 0.2
Family Size
Total 4.81 5.04 5.59 5.90 4.99 4.82 6.04 5.36 4.72 4.39 4.75 5.57 5.14 5.30 5.00
Hindu 4.88 5.04 5.00 4.57 4.97 4.65 6.04 5.38 4.66 4.25 4.75 5.53 5.08 5.21 4.98
Muslim 4.57 6.59 6.01 5.14 6.14 3.40 5.37 5.57 6.17 5.61 5.69 5.38
Christian 1.00 4.00 6.14 3.25 4.69 5.33 3.25
Note: WHH: Women Headed Household
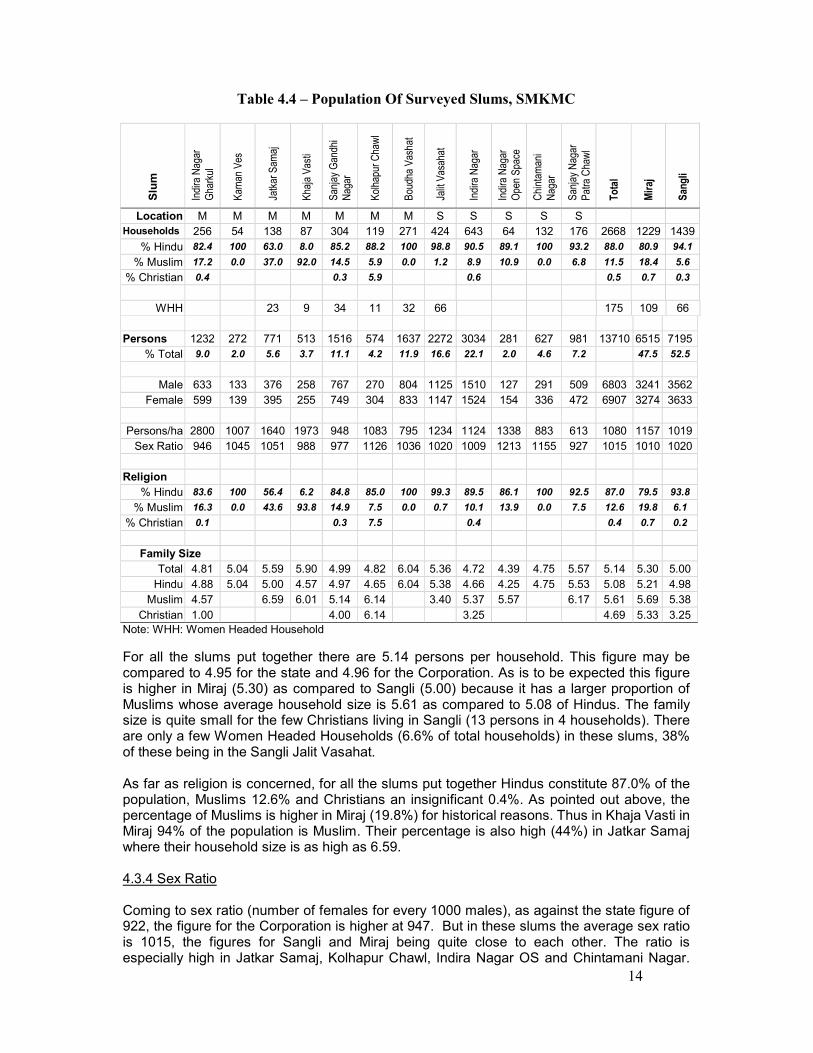
For all the slums put together there are 5.14 persons per household. This figure may be compared to 4.95 for the state and 4.96 for the Corporation. As is to be expected this figure is higher in Miraj (5.30) as compared to Sangli (5.00) because it has a larger proportion of Muslims whose average household size is 5.61 as compared to 5.08 of Hindus. The family size is quite small for the few Christians living in Sangli (13 persons in 4 households). There are only a few Women Headed Households (6.6% of total households) in these slums, 38% of these being in the Sangli Jalit Vasahat. As far as religion is concerned, for all the slums put together Hindus constitute 87.0% of the population, Muslims 12.6% and Christians an insignificant 0.4%. As pointed out above, the percentage of Muslims is higher in Miraj (19.8%) for historical reasons. Thus in Khaja Vasti in Miraj 94% of the population is Muslim. Their percentage is also high (44%) in Jatkar Samaj where their household size is as high as 6.59. 4.3.4 Sex Ratio Coming to sex ratio (number of females for every 1000 males), as against the state figure of 922, the figure for the Corporation is higher at 947. But in these slums the average sex ratio is 1015, the figures for Sangli and Miraj being quite close to each other. The ratio is especially high in Jatkar Samaj, Kolhapur Chawl, Indira Nagar OS and Chintamani Nagar.
15
Only Indira Nagar Gharkul and Sanjay Nagar Patra Chawl have figures similar to Corporation figures.
Table 4 .5– Age Distribution, Surveyed Slums, SMKMC
Indira Nagar
Gharkul
Kam
an Ves
Jatkar Sam
aj
Khaja Vasti
Sanjay Gandhi
Nagar
Kolhapur Chawl
Boudha Vashat
Jalit Vasahat
Indira Nagar
Indira Nagar
Open Space
Chintam
ani
Nagar
Sanjay Nagar
Patra Chawl
To
tal
Mir
aj
San
gli
Total
Persons 1232 272 771 513 1516 574 1637 2272 3034 281 627 981 13710 6515 7195
Sex Ratio 946 1045 1051 988 977 1126 1036 1020 1009 1213 1155 927 1015 1010 1020
% Minority 16.4 0.0 43.6 93.8 15.2 15.0 0.0 0.7 10.5 13.9 0.0 7.5 13.0 20.5 6.2
Age Group 0-5 Persons 131 25 108 66 168 68 163 226 393 36 90 120 1594 729 865
% Total 10.6 9.2 14.0 12.9 11.1 11.8 10.0 9.9 13.0 12.8 14.4 12.2 11.6 11.2 12.0
% Minority 19.1 0.0 53.7 98.5 14.9 13.2 0.0 0.4 13.2 5.6 0.0 10.0 15.6 25.0 7.7
Sex Ratio 724 563 831 886 806 1061 734 1036 917 1400 1250 765 886 796 970
Age Group 5-16
288 46 208 139 326 96 321 557 735 89 153 250 3208 1424 1784
% Total 23.4 16.9 27.0 27.1 21.5 16.7 19.6 24.5 24.2 31.7 24.4 25.5 23.4 21.9 24.8
% Minority 16.0 0.0 50.0 87.1 18.7 18.8 0.0 0.7 9.1 16.9 0.0 8.0 14.2 24.6 5.9
Sex Ratio 933 840 1019 759 1038 1182 1154 961 934 1070 1186 908 984 1008 965
Age Group 16-60
734 192 422 293 968 370 1076 1408 1831 151 366 584 8395 4055 4340
% Total 59.6 70.6 54.7 57.1 63.9 64.5 65.7 62.0 60.3 53.7 58.4 59.5 61.2 62.2 60.3
% Minority 16.1 0.0 38.4 93.5 14.4 13.2 0.0 0.8 9.8 14.6 0.0 6.2 11.8 18.3 5.7
Sex Ratio 968 1157 1089 1123 976 1056 1011 1047 1055 1188 1103 966 1035 1020 1048
Age Group >60
79 9 32 15 54 40 77 81 75 5 18 27 512 306 206
% Total 6.4 3.3 4.2 2.9 3.6 7.0 4.7 3.6 2.5 1.8 2.9 2.8 3.7 4.7 2.9
% Minority 15.2 0.0 34.4 86.7 9.3 15.0 0.0 1.2 10.7 0.0 0.0 18.5 11.9 15.4 6.8
Sex Ratio 1257 2000 2200 1500 1250 2077 1962 884 1206 2000 1077 1404 1615 1146
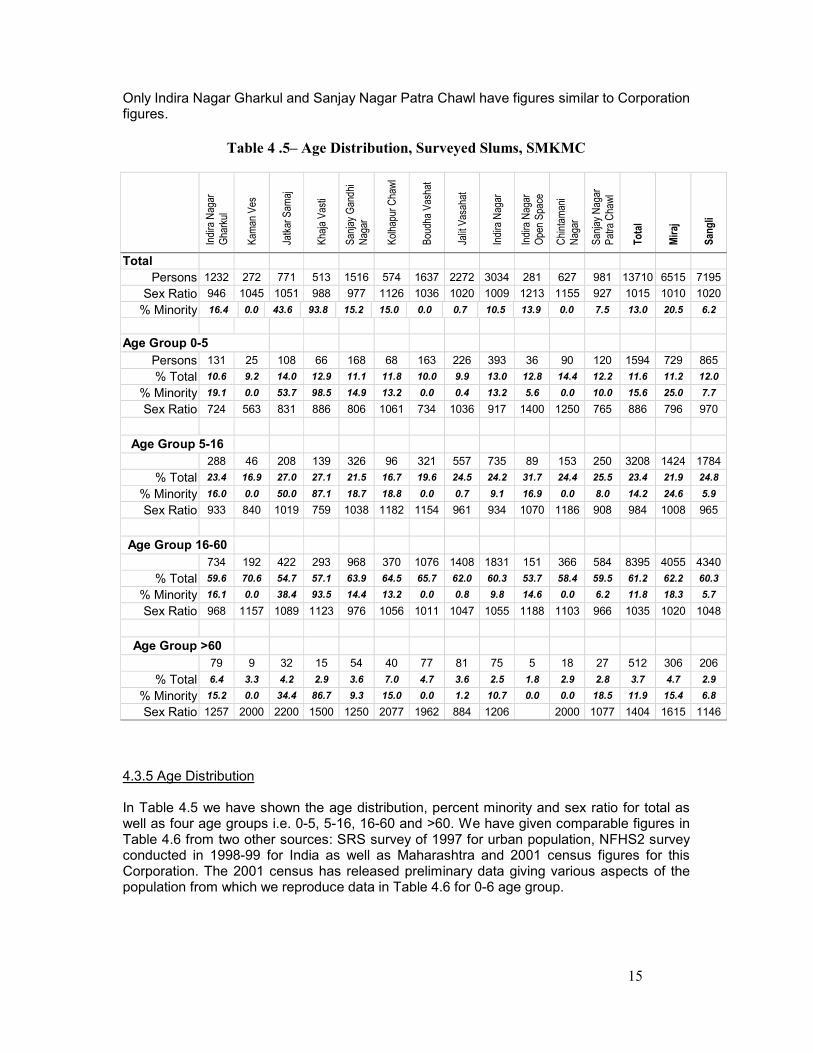
4.3.5 Age Distribution In Table 4.5 we have shown the age distribution, percent minority and sex ratio for total as well as four age groups i.e. 0-5, 5-16, 16-60 and >60. We have given comparable figures in Table 4.6 from two other sources: SRS survey of 1997 for urban population, NFHS2 survey conducted in 1998-99 for India as well as Maharashtra and 2001 census figures for this Corporation. The 2001 census has released preliminary data giving various aspects of the population from which we reproduce data in Table 4.6 for 0-6 age group.
16
Table 4.6 - Age Distribution Summary for Total Population,
Surveyed Slums, SMKMC
India (Urban)
SRS (1997) NFHS2 (1998-99)
Age Male Female Male Female Sex Ratio
0-4 9.9 9.8 9.4 9.5 931
5-14 21.9 21.8 22.1 21.7 ~ 911
15-59 62.6 62.1 61.1 61.3
>60 5.7 6.3 7.1 7.5 ~ 977
>65 3.4 3.8 4.5 4.9 ~ 991
Total 928
Maharashtra
<5 11.3 11 10 10 925
5-14 22.9 22.4 22.9 22.8 927
5-64 61.5 61.8 61.6 61.9
>65 4.2 4.8 5.3 5.4 950
Total 932
Sangli Slums
Age Goup Percent Sex Ratio
0-5 11.6 886
5-16 23.4 984
16-60 61.2 1035
> 60 3.7 1404
Total 1015
Chart 3- Age Distribution Of Slum Population
Age Group 0-5
12%
Age Group 5-
16
23%
Age Group >60
4%
Age Group 16-
60
61%
17
The age distribution pattern as well as the sex ratios of the surveyed slums do not reconcile with equivalent national and state statistics, which are shown in Tables 4.6 and 4.7.
Table 4.7 – Census 2001 data for 0-6 Age Group
Sex Ratio
% Of Total Population Total
0-6 Age Group
India 15.93 933 927 Maharashtra 14.11 922 913 Sangli District 13.22 957 851
SMKMC 12.12 947 858
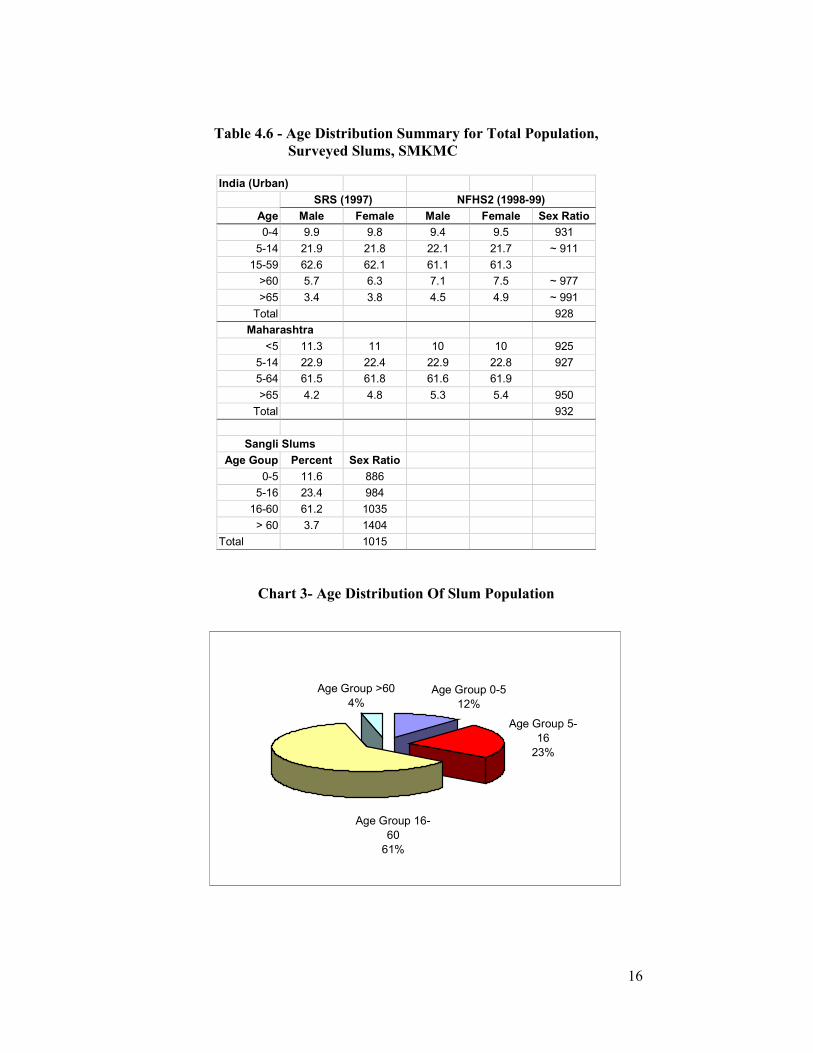
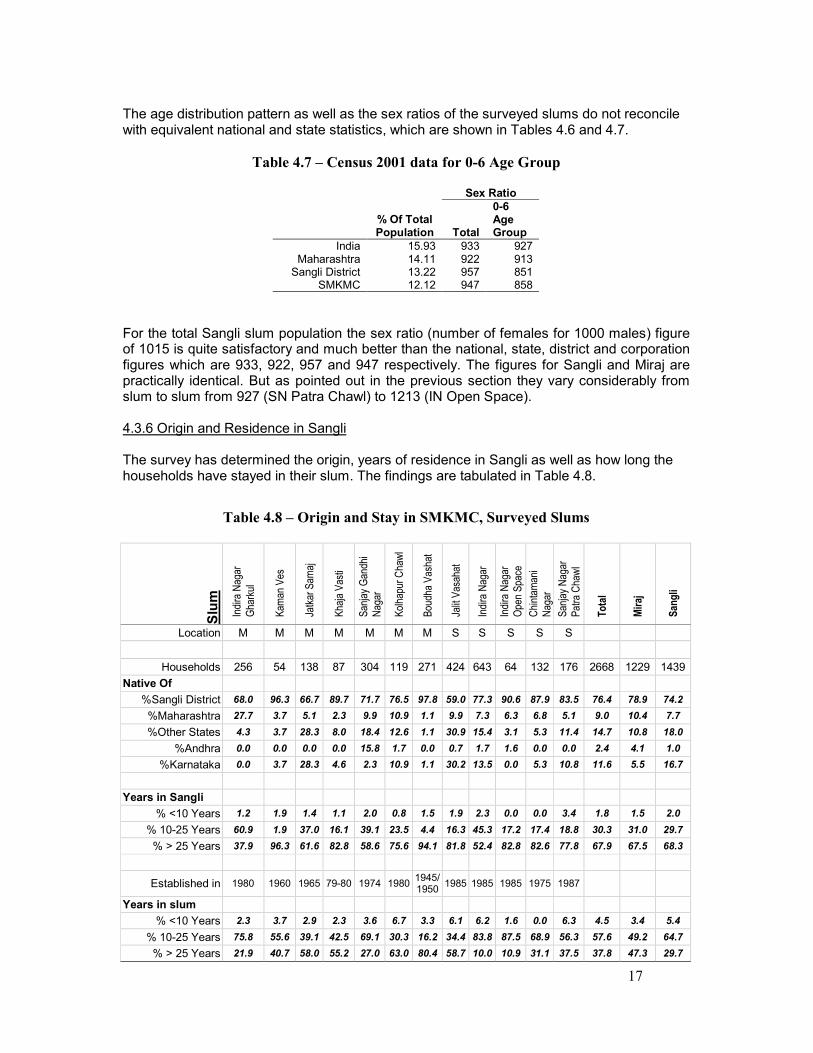
For the total Sangli slum population the sex ratio (number of females for 1000 males) figure of 1015 is quite satisfactory and much better than the national, state, district and corporation figures which are 933, 922, 957 and 947 respectively. The figures for Sangli and Miraj are practically identical. But as pointed out in the previous section they vary considerably from slum to slum from 927 (SN Patra Chawl) to 1213 (IN Open Space). 4.3.6 Origin and Residence in Sangli The survey has determined the origin, years of residence in Sangli as well as how long the households have stayed in their slum. The findings are tabulated in Table 4.8.
Table 4.8 – Origin and Stay in SMKMC, Surveyed Slums
Slum
Indira Nagar
Gharkul
Kam
an Ves
Jatkar Sam
aj
Khaja Vasti
Sanjay Gandhi
Nagar
Kolhapur Chawl
Boudha Vashat
Jalit Vasahat
Indira Nagar
Indira Nagar
Open Space
Chintam
ani
Nagar
Sanjay Nagar
Patra Chawl
To
tal
Mir
aj
San
gli
Location M M M M M M M S S S S S
Households 256 54 138 87 304 119 271 424 643 64 132 176 2668 1229 1439
Native Of
%Sangli District 68.0 96.3 66.7 89.7 71.7 76.5 97.8 59.0 77.3 90.6 87.9 83.5 76.4 78.9 74.2
%Maharashtra 27.7 3.7 5.1 2.3 9.9 10.9 1.1 9.9 7.3 6.3 6.8 5.1 9.0 10.4 7.7
%Other States 4.3 3.7 28.3 8.0 18.4 12.6 1.1 30.9 15.4 3.1 5.3 11.4 14.7 10.8 18.0
%Andhra 0.0 0.0 0.0 0.0 15.8 1.7 0.0 0.7 1.7 1.6 0.0 0.0 2.4 4.1 1.0
%Karnataka 0.0 3.7 28.3 4.6 2.3 10.9 1.1 30.2 13.5 0.0 5.3 10.8 11.6 5.5 16.7
Years in Sangli
% <10 Years 1.2 1.9 1.4 1.1 2.0 0.8 1.5 1.9 2.3 0.0 0.0 3.4 1.8 1.5 2.0
% 10-25 Years 60.9 1.9 37.0 16.1 39.1 23.5 4.4 16.3 45.3 17.2 17.4 18.8 30.3 31.0 29.7
% > 25 Years 37.9 96.3 61.6 82.8 58.6 75.6 94.1 81.8 52.4 82.8 82.6 77.8 67.9 67.5 68.3
Established in 1980 1960 1965 79-80 1974 1980 1945/1950
1985 1985 1985 1975 1987
Years in slum
% <10 Years 2.3 3.7 2.9 2.3 3.6 6.7 3.3 6.1 6.2 1.6 0.0 6.3 4.5 3.4 5.4
% 10-25 Years 75.8 55.6 39.1 42.5 69.1 30.3 16.2 34.4 83.8 87.5 68.9 56.3 57.6 49.2 64.7
% > 25 Years 21.9 40.7 58.0 55.2 27.0 63.0 80.4 58.7 10.0 10.9 31.1 37.5 37.8 47.3 29.7
18
Chart 4 – Place of Origin
Chart 5 – Number Of Years In Sangli, Surveyed Slums
Chart 6 – Number Of Years In Surveyed Slum, Sangli
10-25
Years
57%
> 25 Years
38%
<10 Years
5%
Maharashtra
9%Sangli District
76%
Other States
15%
<10 Years
2%
> 25 Years
68%
10-25 Years
30%
19
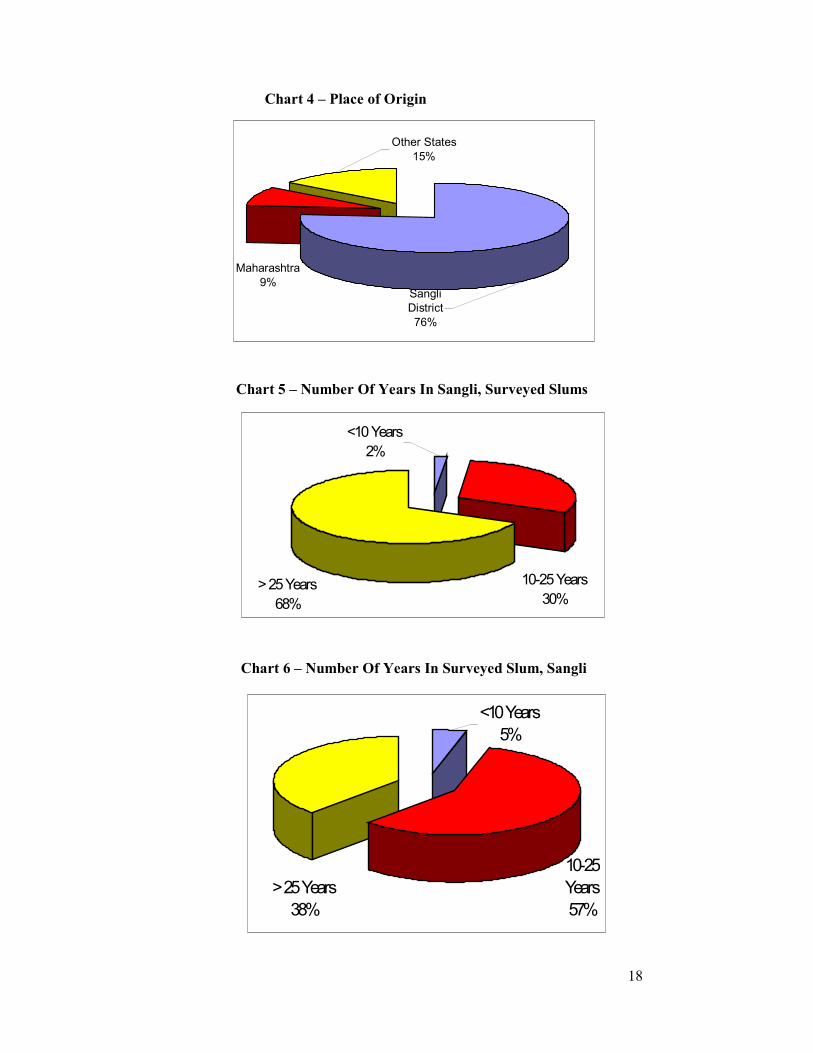
As is to be expected in a non-industrial town, three- fourths of the families (76%) hail from the present Sangli district. Another 9% hail from other Maharashtra districts. About 15% have migrated from other states--11.6% from neighbouring Karnataka and 2.4% from Andhra. This distribution is fairly similar for Miraj and Sangli slums. Some slums however show significant departure from this pattern. Thus in Jatkar Samaj 28% of the households hail from Karnataka and the same is true with Jalit Vasahat (30%). On the other hand in Boudha Vasahat almost all the households are from Maharashtra, mostly from Sangli district.
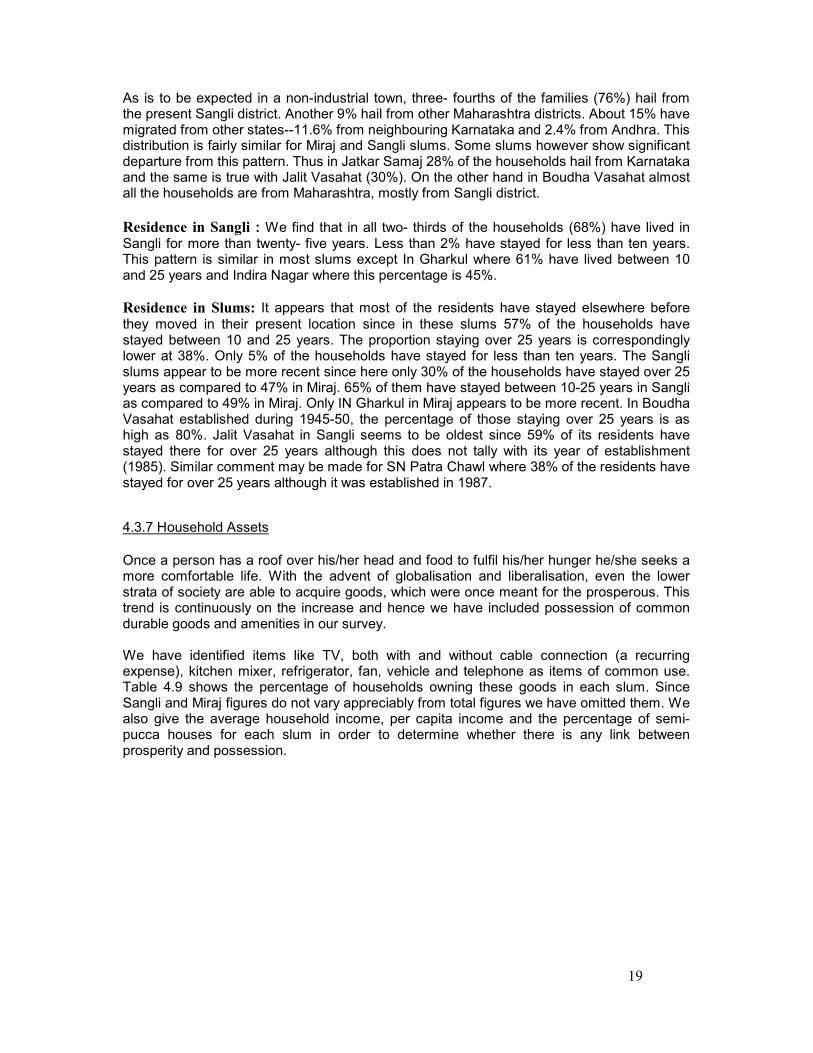
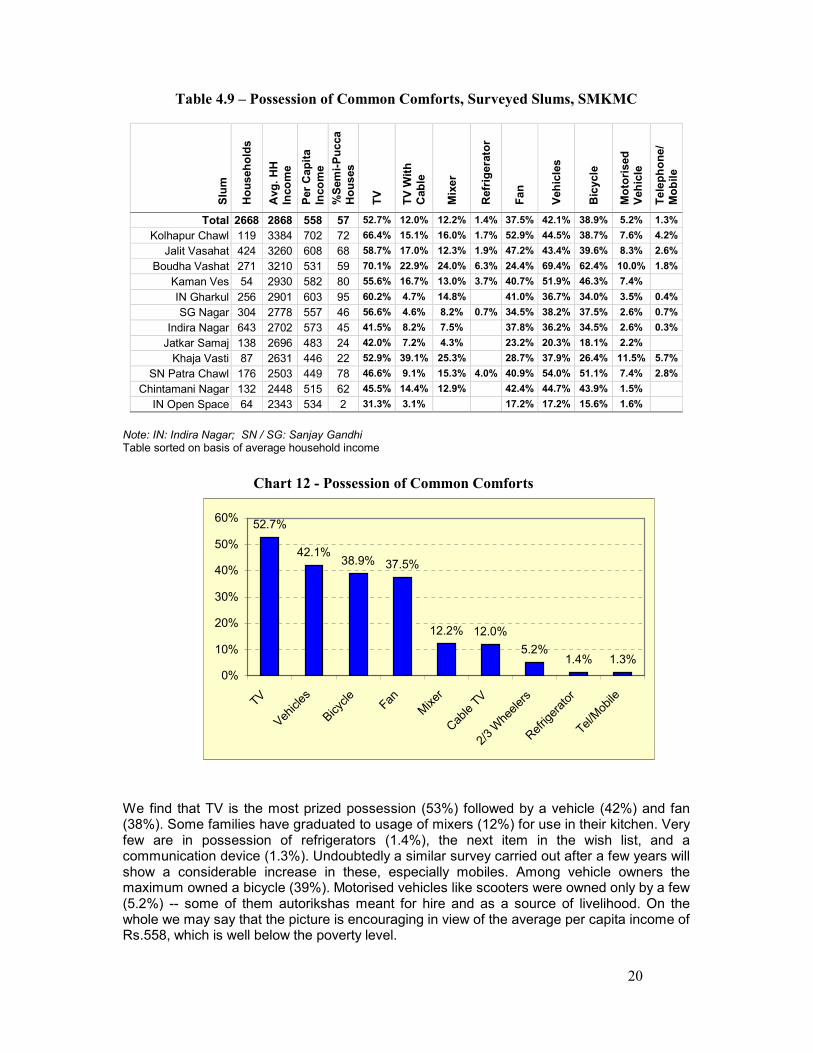
Residence in Sangli : We find that in all two- thirds of the households (68%) have lived in Sangli for more than twenty- five years. Less than 2% have stayed for less than ten years. This pattern is similar in most slums except In Gharkul where 61% have lived between 10 and 25 years and Indira Nagar where this percentage is 45%. Residence in Slums: It appears that most of the residents have stayed elsewhere before they moved in their present location since in these slums 57% of the households have stayed between 10 and 25 years. The proportion staying over 25 years is correspondingly lower at 38%. Only 5% of the households have stayed for less than ten years. The Sangli slums appear to be more recent since here only 30% of the households have stayed over 25 years as compared to 47% in Miraj. 65% of them have stayed between 10-25 years in Sangli as compared to 49% in Miraj. Only IN Gharkul in Miraj appears to be more recent. In Boudha Vasahat established during 1945-50, the percentage of those staying over 25 years is as high as 80%. Jalit Vasahat in Sangli seems to be oldest since 59% of its residents have stayed there for over 25 years although this does not tally with its year of establishment (1985). Similar comment may be made for SN Patra Chawl where 38% of the residents have stayed for over 25 years although it was established in 1987.
4.3.7 Household Assets Once a person has a roof over his/her head and food to fulfil his/her hunger he/she seeks a more comfortable life. With the advent of globalisation and liberalisation, even the lower strata of society are able to acquire goods, which were once meant for the prosperous. This trend is continuously on the increase and hence we have included possession of common durable goods and amenities in our survey. We have identified items like TV, both with and without cable connection (a recurring expense), kitchen mixer, refrigerator, fan, vehicle and telephone as items of common use. Table 4.9 shows the percentage of households owning these goods in each slum. Since Sangli and Miraj figures do not vary appreciably from total figures we have omitted them. We also give the average household income, per capita income and the percentage of semi-pucca houses for each slum in order to determine whether there is any link between prosperity and possession.
20
Table 4.9 – Possession of Common Comforts, Surveyed Slums, SMKMC
Slum
Households
Avg. HH
Income
Per Capita
Income
%Semi-Pucca
Houses
TV
TV With
Cable
Mixer
Refrigerator
Fan
Vehicles
Bicycle
Motorised
Vehicle
Telephone/
Mobile
Total 2668 2868 558 57 52.7% 12.0% 12.2% 1.4% 37.5% 42.1% 38.9% 5.2% 1.3%
Kolhapur Chawl 119 3384 702 72 66.4% 15.1% 16.0% 1.7% 52.9% 44.5% 38.7% 7.6% 4.2%
Jalit Vasahat 424 3260 608 68 58.7% 17.0% 12.3% 1.9% 47.2% 43.4% 39.6% 8.3% 2.6%
Boudha Vashat 271 3210 531 59 70.1% 22.9% 24.0% 6.3% 24.4% 69.4% 62.4% 10.0% 1.8%
Kaman Ves 54 2930 582 80 55.6% 16.7% 13.0% 3.7% 40.7% 51.9% 46.3% 7.4%
IN Gharkul 256 2901 603 95 60.2% 4.7% 14.8% 41.0% 36.7% 34.0% 3.5% 0.4%
SG Nagar 304 2778 557 46 56.6% 4.6% 8.2% 0.7% 34.5% 38.2% 37.5% 2.6% 0.7%
Indira Nagar 643 2702 573 45 41.5% 8.2% 7.5% 37.8% 36.2% 34.5% 2.6% 0.3%
Jatkar Samaj 138 2696 483 24 42.0% 7.2% 4.3% 23.2% 20.3% 18.1% 2.2%
Khaja Vasti 87 2631 446 22 52.9% 39.1% 25.3% 28.7% 37.9% 26.4% 11.5% 5.7%
SN Patra Chawl 176 2503 449 78 46.6% 9.1% 15.3% 4.0% 40.9% 54.0% 51.1% 7.4% 2.8%
Chintamani Nagar 132 2448 515 62 45.5% 14.4% 12.9% 42.4% 44.7% 43.9% 1.5%
IN Open Space 64 2343 534 2 31.3% 3.1% 17.2% 17.2% 15.6% 1.6%
Note: IN: Indira Nagar; SN / SG: Sanjay Gandhi Table sorted on basis of average household income Chart 12 - Possession of Common Comforts
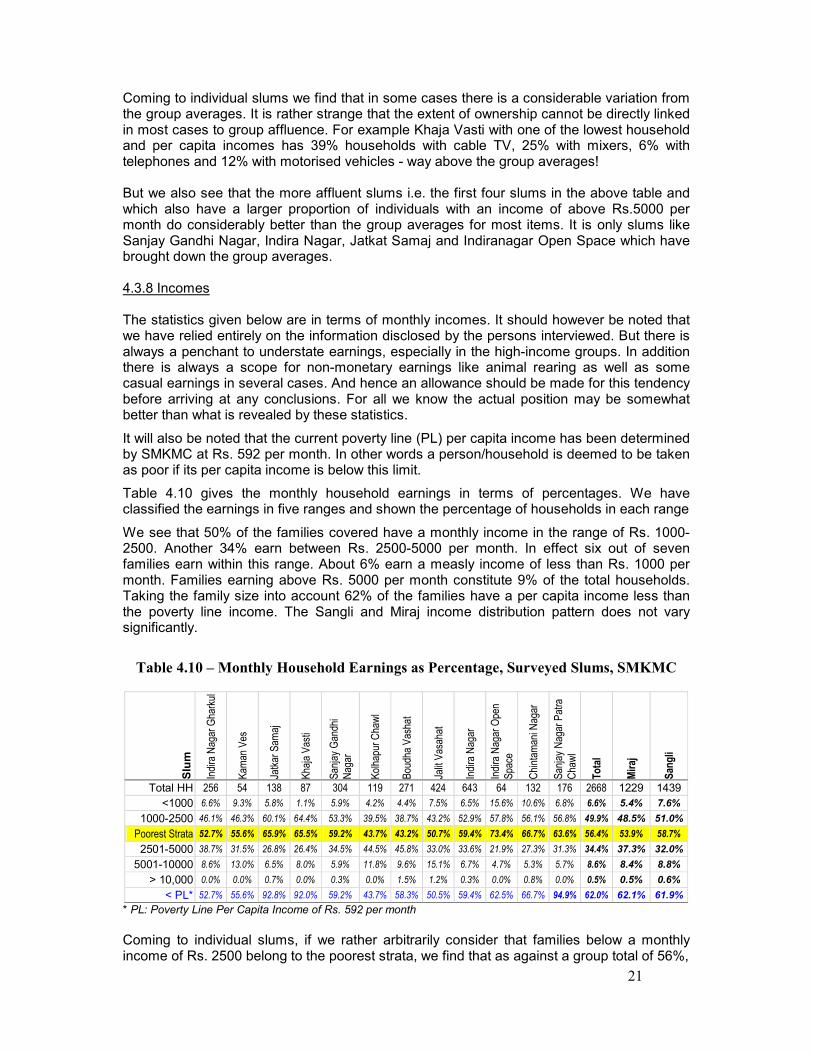
We find that TV is the most prized possession (53%) followed by a vehicle (42%) and fan (38%). Some families have graduated to usage of mixers (12%) for use in their kitchen. Very few are in possession of refrigerators (1.4%), the next item in the wish list, and a communication device (1.3%). Undoubtedly a similar survey carried out after a few years will show a considerable increase in these, especially mobiles. Among vehicle owners the maximum owned a bicycle (39%). Motorised vehicles like scooters were owned only by a few (5.2%) -- some of them autorikshas meant for hire and as a source of livelihood. On the whole we may say that the picture is encouraging in view of the average per capita income of Rs.558, which is well below the poverty level.
52.7%
42.1%38.9% 37.5%
12.2% 12.0%
5.2%1.4% 1.3%
0%
10%
20%
30%
40%
50%
60%
TV
Vehicles
Bicycle
Fan
Mixer
Cable TV
2/3 Wheelers
Refrigerator
Tel/Mobile
21
Coming to individual slums we find that in some cases there is a considerable variation from the group averages. It is rather strange that the extent of ownership cannot be directly linked in most cases to group affluence. For example Khaja Vasti with one of the lowest household and per capita incomes has 39% households with cable TV, 25% with mixers, 6% with telephones and 12% with motorised vehicles - way above the group averages! But we also see that the more affluent slums i.e. the first four slums in the above table and which also have a larger proportion of individuals with an income of above Rs.5000 per month do considerably better than the group averages for most items. It is only slums like Sanjay Gandhi Nagar, Indira Nagar, Jatkat Samaj and Indiranagar Open Space which have brought down the group averages. 4.3.8 Incomes
The statistics given below are in terms of monthly incomes. It should however be noted that we have relied entirely on the information disclosed by the persons interviewed. But there is always a penchant to understate earnings, especially in the high-income groups. In addition there is always a scope for non-monetary earnings like animal rearing as well as some casual earnings in several cases. And hence an allowance should be made for this tendency before arriving at any conclusions. For all we know the actual position may be somewhat better than what is revealed by these statistics.
It will also be noted that the current poverty line (PL) per capita income has been determined by SMKMC at Rs. 592 per month. In other words a person/household is deemed to be taken as poor if its per capita income is below this limit.
Table 4.10 gives the monthly household earnings in terms of percentages. We have classified the earnings in five ranges and shown the percentage of households in each range
We see that 50% of the families covered have a monthly income in the range of Rs. 1000-2500. Another 34% earn between Rs. 2500-5000 per month. In effect six out of seven families earn within this range. About 6% earn a measly income of less than Rs. 1000 per month. Families earning above Rs. 5000 per month constitute 9% of the total households. Taking the family size into account 62% of the families have a per capita income less than the poverty line income. The Sangli and Miraj income distribution pattern does not vary significantly.
Table 4.10 – Monthly Household Earnings as Percentage, Surveyed Slums, SMKMC
Slum
Indira Nagar Gharkul
Kam
an Ves
Jatkar Sam
aj
Khaja Vasti
Sanjay Gandhi
Nagar
Kolhapur Chawl
Boudha Vashat
Jalit Vasahat
Indira Nagar
Indira Nagar Open
Space
Chintam
ani Nagar
Sanjay Nagar Patra
Chawl
To
tal
Mir
aj
San
gli
Total HH 256 54 138 87 304 119 271 424 643 64 132 176 2668 1229 1439
<1000 6.6% 9.3% 5.8% 1.1% 5.9% 4.2% 4.4% 7.5% 6.5% 15.6% 10.6% 6.8% 6.6% 5.4% 7.6%
1000-2500 46.1% 46.3% 60.1% 64.4% 53.3% 39.5% 38.7% 43.2% 52.9% 57.8% 56.1% 56.8% 49.9% 48.5% 51.0%
Poorest Strata 52.7% 55.6% 65.9% 65.5% 59.2% 43.7% 43.2% 50.7% 59.4% 73.4% 66.7% 63.6% 56.4% 53.9% 58.7%
2501-5000 38.7% 31.5% 26.8% 26.4% 34.5% 44.5% 45.8% 33.0% 33.6% 21.9% 27.3% 31.3% 34.4% 37.3% 32.0%
5001-10000 8.6% 13.0% 6.5% 8.0% 5.9% 11.8% 9.6% 15.1% 6.7% 4.7% 5.3% 5.7% 8.6% 8.4% 8.8%
> 10,000 0.0% 0.0% 0.7% 0.0% 0.3% 0.0% 1.5% 1.2% 0.3% 0.0% 0.8% 0.0% 0.5% 0.5% 0.6%
< PL* 52.7% 55.6% 92.8% 92.0% 59.2% 43.7% 58.3% 50.5% 59.4% 62.5% 66.7% 94.9% 62.0% 62.1% 61.9%
* PL: Poverty Line Per Capita Income of Rs. 592 per month
Coming to individual slums, if we rather arbitrarily consider that families below a monthly income of Rs. 2500 belong to the poorest strata, we find that as against a group total of 56%,
22
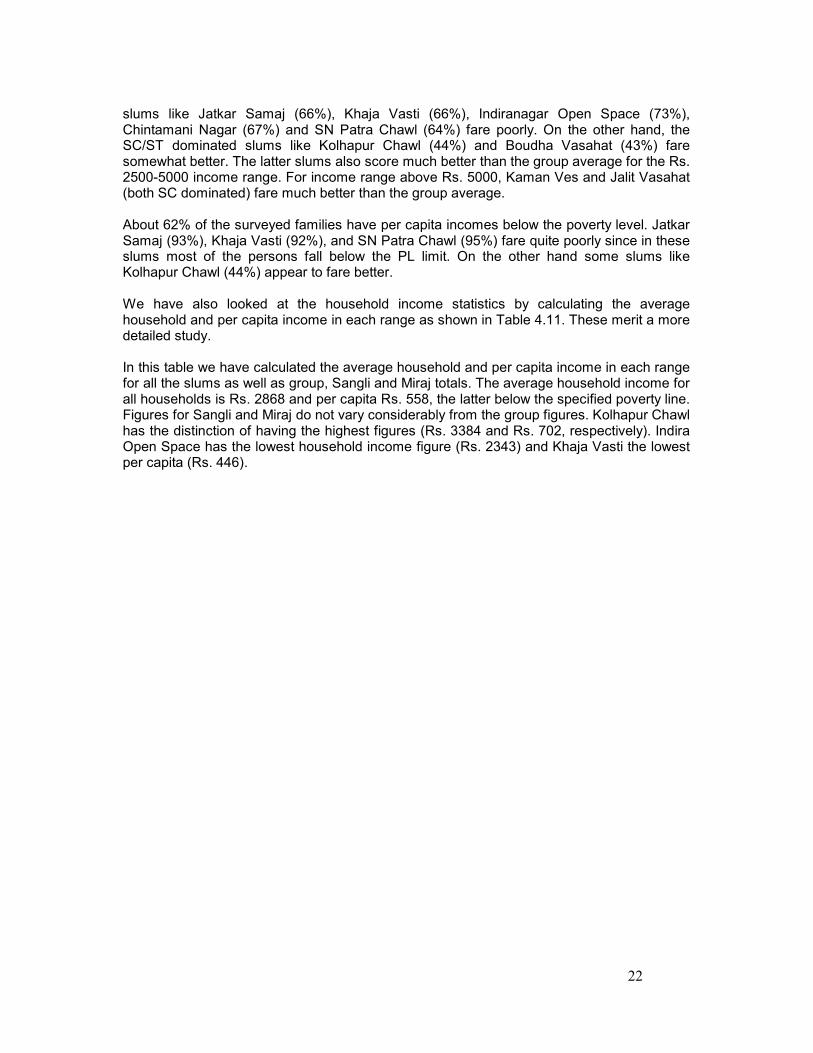
slums like Jatkar Samaj (66%), Khaja Vasti (66%), Indiranagar Open Space (73%), Chintamani Nagar (67%) and SN Patra Chawl (64%) fare poorly. On the other hand, the SC/ST dominated slums like Kolhapur Chawl (44%) and Boudha Vasahat (43%) fare somewhat better. The latter slums also score much better than the group average for the Rs. 2500-5000 income range. For income range above Rs. 5000, Kaman Ves and Jalit Vasahat (both SC dominated) fare much better than the group average. About 62% of the surveyed families have per capita incomes below the poverty level. Jatkar Samaj (93%), Khaja Vasti (92%), and SN Patra Chawl (95%) fare quite poorly since in these slums most of the persons fall below the PL limit. On the other hand some slums like Kolhapur Chawl (44%) appear to fare better. We have also looked at the household income statistics by calculating the average household and per capita income in each range as shown in Table 4.11. These merit a more detailed study. In this table we have calculated the average household and per capita income in each range for all the slums as well as group, Sangli and Miraj totals. The average household income for all households is Rs. 2868 and per capita Rs. 558, the latter below the specified poverty line. Figures for Sangli and Miraj do not vary considerably from the group figures. Kolhapur Chawl has the distinction of having the highest figures (Rs. 3384 and Rs. 702, respectively). Indira Open Space has the lowest household income figure (Rs. 2343) and Khaja Vasti the lowest per capita (Rs. 446).
23
Table 4.11 – Household and Per Capita Income Range (Rs.), Surveyed Slums, SMKMC
Slum
Indira Nagar
Gharkul
Kam
an Ves
Jatkar Sam
aj
Khaja Vasti
Sanjay Gandhi
Nagar
Kolhapur Chawl
Boudha Vashat
Jalit Vasahat
Indira Nagar
Indira Nagar
Open Space
Chintam
ani
Nagar
Sanjay Nagar
Patra Chawl
To
tal
Mir
aj
San
gli
All Households
Total HH 256 54 138 87 304 119 271 424 643 64 132 176 2668 1229 1439
Avg.HH Income 2901 2930 2696 2631 2778 3384 3210 3260 2702 2343 2448 2503 2868 2945 2803
Percapita Income 603 582 483 446 557 702 531 608 573 534 515 449 558 555 561
Monthly Income < 1000
No. of HH 17 5 8 1 18 5 12 32 42 10 14 12 176 66 110
Avg. Income 206 300 581 300 494 200 724 519 321 705 238 363 417 432 408
Percapita Income 121 150 258 75 223 167 215 230 151 504 79 174 191 198 185
Monthly Income 1000-2500
No. of HH 118 25 83 56 162 47 105 183 340 37 74 100 1330 596 734
Avg. Income 1925 1672 1908 1821 1945 1960 1879 2016 1873 1943 1862 1756 1836 1763 1895
Percapita Income 457 360 400 332 454 517 360 468 443 420 391 371 426 419 432
Monthly Income 2501-5000
No. of HH 99 17 37 23 105 53 124 140 216 14 36 55 919 458 461
Avg. Income 3659 3965 3727 3587 3666 3984 3560 3584 3582 3636 3550 3451 3625 3685 3566
Percapita Income 655 630 554 589 636 718 547 620 679 636 676 487 621 613 630
Monthly Income 5001 – 10,000
No of HH 22 7 9 7 18 14 26 64 43 3 7 10 230 103 127
Avg. Income 6791 6786 6678 6300 6956 7043 7242 6680 660 6700 6289 7080 6780 6924 6663
Percapita Income 976 1250 595 711 773 1027 795 793 814 1256 1100 761 827 840 816
Monthly Income > 10,000
No of HH 1 1 4 5 2 0 1 0 14 6 8
Avg. Income 0 0 11000 0 10500 0 14075 13560 13500 0 10300 0 13064 12967 13138
Percapita Income 0 0 1571 0 700 0 1408 1076 1350 0 2575 0 1228 1255 1208
Below Poverty Line of Rs. 592/month
No of HH 135 30 128 80 180 52 158 214 382 40 88 167 1654 763 891
Avg. Income 1708 1443 2352 2310 1800 1788 2527 1800 1702 1924 1603 2214 1934 2065 1822
Percapita Income 438 344 545 410 441 505 361 448 427 383 358 416 426 432 420
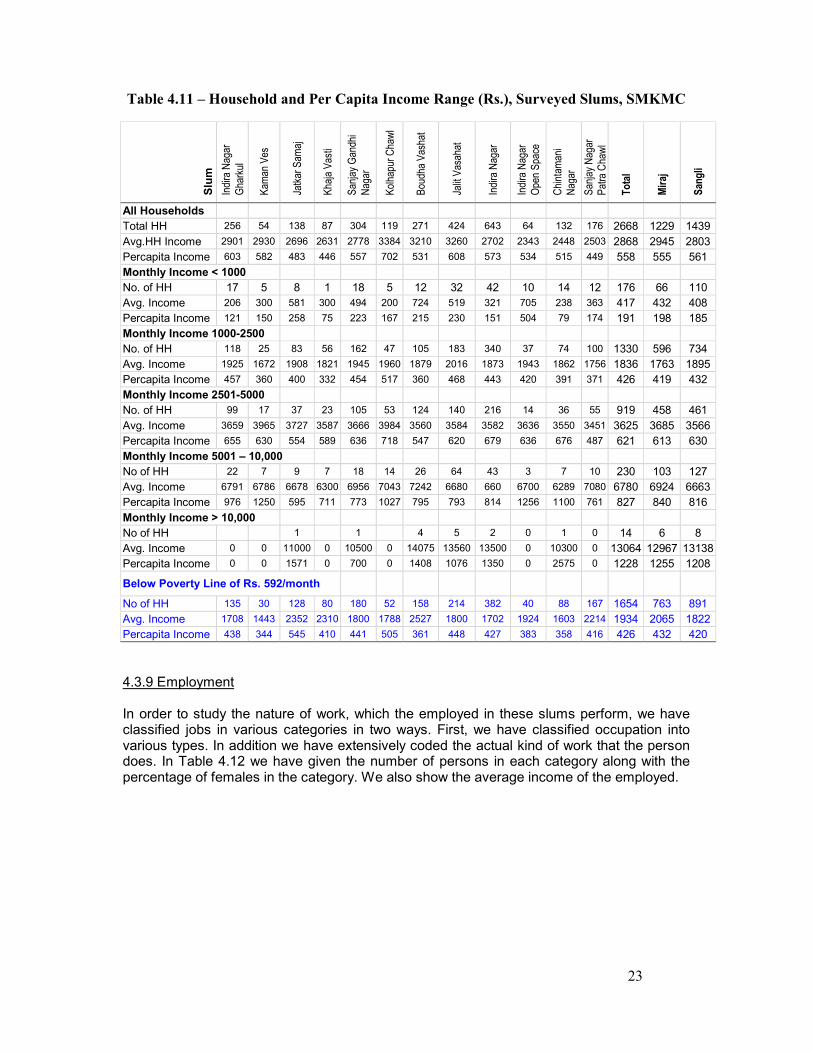
4.3.9 Employment In order to study the nature of work, which the employed in these slums perform, we have classified jobs in various categories in two ways. First, we have classified occupation into various types. In addition we have extensively coded the actual kind of work that the person does. In Table 4.12 we have given the number of persons in each category along with the percentage of females in the category. We also show the average income of the employed.
24
Table 4.12 – Categories of Earners, Surveyed Slums, SMKMC
Slum
Indira Nagar
Gharkul
Kam
an Ves
Jatkar Sam
aj
Khaja Vasti
Sanjay
Gandhi Nagar
Kolhapur
Chawl
Boudha
Vashat
Jalit Vasahat
Indira Nagar
Indira Nagar
Open Space
Chintam
ani
Nagar
Sanjay Nagar
Patra Chawl
To
tal
Mir
aj
San
gli
Public Sector Total 12 11 4 0 21 43 114 44 33 1 8 7 298 205 93
% Female 16.7% 9.1% 0.0% 23.8% 7.0% 19.3% 22.7% 39.4% 100.% 37.5% 14.3% 20.5% 16.1% 30.1%
Av. Income 3033 3409 4250 0 2698 3803 3069 3264 2435 250 2588 2250 3093 3224 2803
Private Sector Total 12 5 6 0 48 13 32 64 30 1 10 6 227 116 111
% Female 25.0% 40.0% 16.7% 6.3% 0.0% 0.0% 46.9% 3.3% 0.0% 0.0% 16.7% 18.1% 7.8% 28.8%
Av. Income 1825 1680 3250 0 2071 2515 2428 1778 2043 1000 2700 2200 2096 2238 1948
Self Employed
Total 74 5 42 109 96 17 33 39 175 25 15 23 653 376 277
% Female 10.8% 20.0% 0.0% 6.4% 22.9% 17.6% 12.1% 20.5% 29.7% 52.0% 40.0% 4.3% 19.1% 12.0% 28.9%
Av. Income 1873 1580 1883 1595 1525 1712 1794 2326 1778 1452 1733 1839 1747 1687 1828
Skilled Construction Worker Total 75 7 20 1 60 31 41 208 167 18 29 13 670 235 435
% Female 0.0% 0.0% 5.0% 0.0% 1.7% 0.0% 0.0% 1.9% 0.6% 0.0% 0.0% 0.0% 1.0% 0.9% 1.1%
Av. Income 2308 2129 2075 1500 2113 2145 1800 2324 2244 2067 2193 2038 2214 2119 2265
Professional Total 1 2 0 0 1 3 3 11 3 0 0 2 26 10 16
% Female 0.0% 50.0% 0.0% 33.3% 33.3% 36.4% 33.3% 50.0% 34.6% 30.0% 37.5%
Av. Income 6000 3400 0 0 4000 4500 2400 4009 3500 0 0 2000 3696 3750 3662
Skilled Labour Total 39 11 14 18 51 7 30 28 62 6 5 15 286 170 116
% Female 12.8% 0.0% 28.6% 0.0% 0.0% 28.6% 13.3% 3.6% 6.5% 16.7% 20.0% 0.0% 7.7% 8.8% 6.0%
Av. Income 2323 3045 1857 2250 2008 1643 1620 2443 2174 1833 1940 1833 2114 2077 2167
Unskilled Construction labour Total 64 19 8 0 62 19 70 130 273 19 73 101 838 242 596
% Female 21.9% 0.0% 0.0% 4.8% 0.0% 0.0% 7.7% 11.7% 15.8% 9.6% 9.9% 9.4% 7.0% 10.4%
Av. Income 1809 1526 1950 0 1706 1779 1554 1927 1805 1837 1722 1520 1750 1689 1774
Unskilled labour Total 103 9 108 6 93 31 96 75 169 10 27 100 827 446 381
% Female 42.7% 0.0% 18.5% 16.7% 22.6% 25.8% 17.7% 17.3% 13.6% 0.0% 37.0% 10.0% 20.2% 24.9% 14.7%
Av. Income 1470 1822 1525 750 1798 1597 1434 1853 1495 1600 1507 1549 1565 1550 1583
Semi-Skilled Labour Total 7 10 15 7 47 4 9 57 69 11 22 10 268 99 169
% Female 85.7% 100.0% 86.7% 100% 100% 100% 88.9% 96.5% 89.9% 100% 95.5% 90.0% 94.4% 96.0% 93.5%
Av. Income 371 380 573 843 552 650 489 684 501 536 1225 440 614 544 656
Miscellaneous Total 13 1 2 3 11 3 6 12 0 0 8 5 64 39 25
% Female 30.8% 0.0% 50.0% 33.3% 9.1% 100.% 50.0% 41.7% 0.09 0.09 50.0% 80.0% 40.6% 33.3% 52.0%
Av. Income 473 0 0 867 909 0 0 800 0 0 0 0 443 481 384
These categories are summarised in Table 4.13 for better understanding. This table also shows the average level of earnings of those employed. It will be noted that we have also considered the incomes of ‘earners’ like retired persons, dependants and beggars and included them in the miscellaneous category. More details on this will be found in the
25
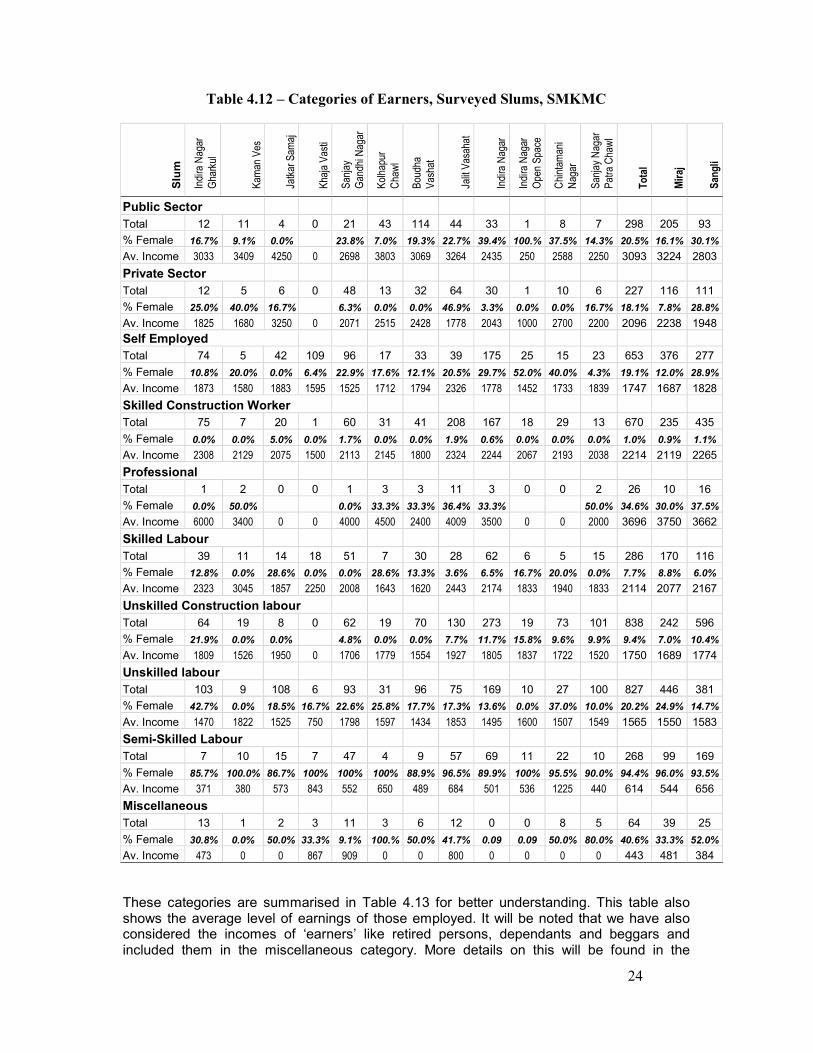
individual slum reports. Here we are only looking at the overall situation and hence not considering minute slum-wise details. In a total population of 13,710 persons there are 4160 persons who have an income. We have divided them into ten categories in all as seen in Table 4.12. In each category we have shown the percentage of females in that workgroup as well as average income of the group. In Table 4.13 we have summarised the above classifications in five categories for easier understanding. The Professional & Skilled category consists of Professional, Skilled Construction Labour and Skilled Labour. Similarly we have grouped the last four categories together. Thus we have only five categories for easier comparison.
Table 4.13 – Classification of Earners, Surveyed Slums, SMKMC
All Slums Miraj Sangli
Slum Total % Av. Income Total % Av. Income Total % Av. Income
Public Sector 298 7.2% 3093 205 10.6% 3224 93 4.2% 2803
Private Sector 227 5.5% 2096 116 6.0% 2238 111 5.0% 1948
Self- Employed 653 15.7% 1747 376 19.4% 1687 277 12.5% 1828
Professional & Skilled
982 23.6% 2216 415 21.4% 2141 567 25.6% 2270
Unskilled, Semiskilled & Misc.
1997 48.0% 1476 826 42.6% 1421 1171 52.8% 1514
Public sector: Employees of Government and Government undertakings; Private Sector: Employees of organized private sector factories, service and business organizations, etc. Self-Employed: Owners of small business like tailors, shopkeepers, etc. Professional and skilled workers: Engineers, nurses, drivers, mechanics, fitters, lawyers, etc.
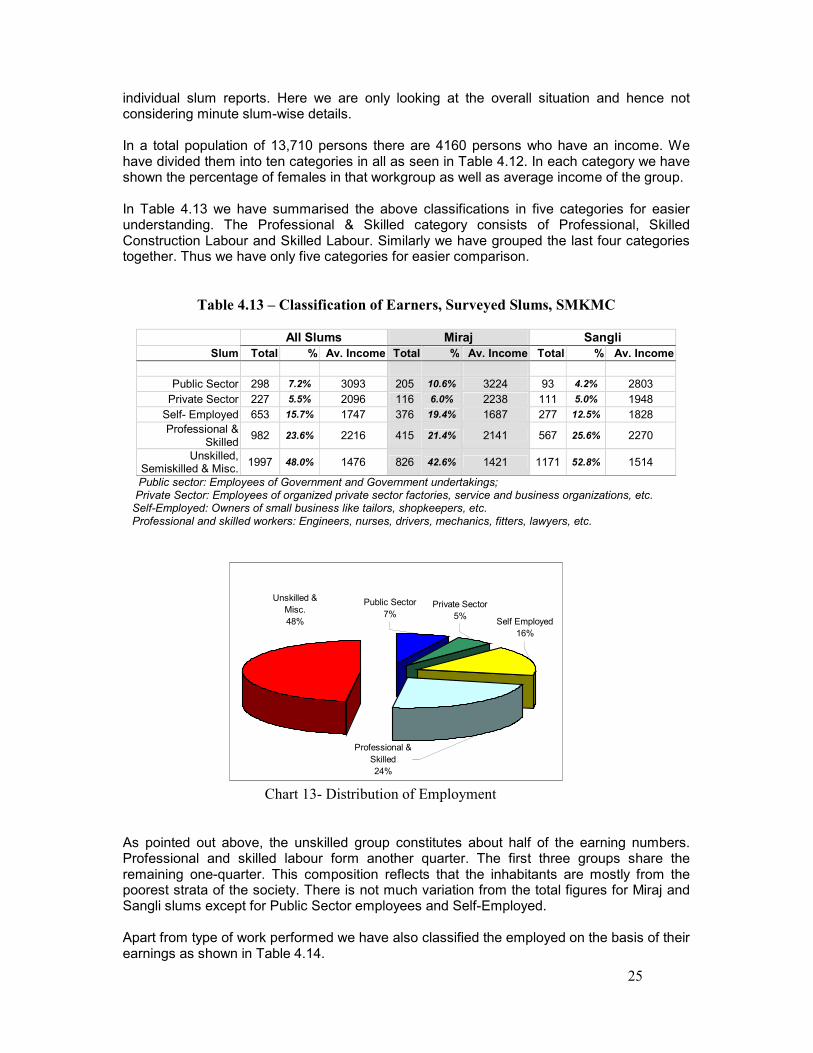
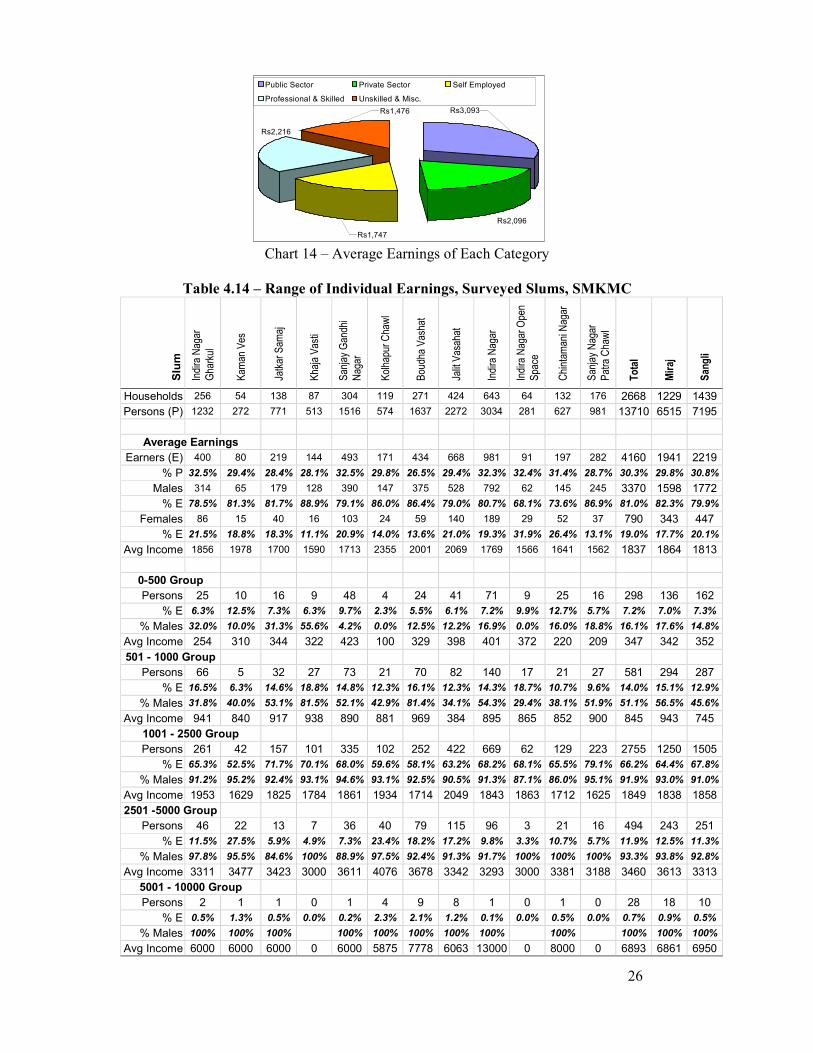
Chart 13- Distribution of Employment As pointed out above, the unskilled group constitutes about half of the earning numbers. Professional and skilled labour form another quarter. The first three groups share the remaining one-quarter. This composition reflects that the inhabitants are mostly from the poorest strata of the society. There is not much variation from the total figures for Miraj and Sangli slums except for Public Sector employees and Self-Employed. Apart from type of work performed we have also classified the employed on the basis of their earnings as shown in Table 4.14.
Unskilled &
Misc.
48%
Professional &
Skilled
24%
Self Employed
16%
Public Sector
7%Private Sector
5%
26
Chart 14 – Average Earnings of Each Category
Table 4.14 – Range of Individual Earnings, Surveyed Slums, SMKMC
Slum
Indira Nagar
Gharkul
Kam
an Ves
Jatkar Sam
aj
Khaja Vasti
Sanjay Gandhi
Nagar
Kolhapur Chawl
Boudha Vashat
Jalit Vasahat
Indira Nagar
Indira Nagar Open
Space
Chintam
ani Nagar
Sanjay Nagar
Patra Chawl
To
tal
Mir
aj
San
gli
Households 256 54 138 87 304 119 271 424 643 64 132 176 2668 1229 1439
Persons (P) 1232 272 771 513 1516 574 1637 2272 3034 281 627 981 13710 6515 7195
Average Earnings
Earners (E) 400 80 219 144 493 171 434 668 981 91 197 282 4160 1941 2219
% P 32.5% 29.4% 28.4% 28.1% 32.5% 29.8% 26.5% 29.4% 32.3% 32.4% 31.4% 28.7% 30.3% 29.8% 30.8%
Males 314 65 179 128 390 147 375 528 792 62 145 245 3370 1598 1772
% E 78.5% 81.3% 81.7% 88.9% 79.1% 86.0% 86.4% 79.0% 80.7% 68.1% 73.6% 86.9% 81.0% 82.3% 79.9%
Females 86 15 40 16 103 24 59 140 189 29 52 37 790 343 447
% E 21.5% 18.8% 18.3% 11.1% 20.9% 14.0% 13.6% 21.0% 19.3% 31.9% 26.4% 13.1% 19.0% 17.7% 20.1%
Avg Income 1856 1978 1700 1590 1713 2355 2001 2069 1769 1566 1641 1562 1837 1864 1813
0-500 Group
Persons 25 10 16 9 48 4 24 41 71 9 25 16 298 136 162
% E 6.3% 12.5% 7.3% 6.3% 9.7% 2.3% 5.5% 6.1% 7.2% 9.9% 12.7% 5.7% 7.2% 7.0% 7.3%
% Males 32.0% 10.0% 31.3% 55.6% 4.2% 0.0% 12.5% 12.2% 16.9% 0.0% 16.0% 18.8% 16.1% 17.6% 14.8%
Avg Income 254 310 344 322 423 100 329 398 401 372 220 209 347 342 352
501 - 1000 Group
Persons 66 5 32 27 73 21 70 82 140 17 21 27 581 294 287
% E 16.5% 6.3% 14.6% 18.8% 14.8% 12.3% 16.1% 12.3% 14.3% 18.7% 10.7% 9.6% 14.0% 15.1% 12.9%
% Males 31.8% 40.0% 53.1% 81.5% 52.1% 42.9% 81.4% 34.1% 54.3% 29.4% 38.1% 51.9% 51.1% 56.5% 45.6%
Avg Income 941 840 917 938 890 881 969 384 895 865 852 900 845 943 745
1001 - 2500 Group
Persons 261 42 157 101 335 102 252 422 669 62 129 223 2755 1250 1505
% E 65.3% 52.5% 71.7% 70.1% 68.0% 59.6% 58.1% 63.2% 68.2% 68.1% 65.5% 79.1% 66.2% 64.4% 67.8%
% Males 91.2% 95.2% 92.4% 93.1% 94.6% 93.1% 92.5% 90.5% 91.3% 87.1% 86.0% 95.1% 91.9% 93.0% 91.0%
Avg Income 1953 1629 1825 1784 1861 1934 1714 2049 1843 1863 1712 1625 1849 1838 1858
2501 -5000 Group
Persons 46 22 13 7 36 40 79 115 96 3 21 16 494 243 251
% E 11.5% 27.5% 5.9% 4.9% 7.3% 23.4% 18.2% 17.2% 9.8% 3.3% 10.7% 5.7% 11.9% 12.5% 11.3%
% Males 97.8% 95.5% 84.6% 100% 88.9% 97.5% 92.4% 91.3% 91.7% 100% 100% 100% 93.3% 93.8% 92.8%
Avg Income 3311 3477 3423 3000 3611 4076 3678 3342 3293 3000 3381 3188 3460 3613 3313
5001 - 10000 Group
Persons 2 1 1 0 1 4 9 8 1 0 1 0 28 18 10
% E 0.5% 1.3% 0.5% 0.0% 0.2% 2.3% 2.1% 1.2% 0.1% 0.0% 0.5% 0.0% 0.7% 0.9% 0.5%
% Males 100% 100% 100% 100% 100% 100% 100% 100% 100% 100% 100% 100%
Avg Income 6000 6000 6000 0 6000 5875 7778 6063 13000 0 8000 0 6893 6861 6950
Rs2,096
Rs3,093Rs1,476
Rs2,216
Rs1,747
Public Sector Private Sector Self Employed
Professional & Skilled Unskilled & Misc.

27
We have given these data in two ways. In the first rows we have shown the total number of earning members (E) in each slum, their proportion to the total persons (P) in the slum and average income of the earners, as well as proportion of males and females. In subsequent rows we have given a break-up of these earning members in five income ranges [both number of persons as well as their percentage of earning members(E)], proportion of males in each range and their average incomes. Coming first to Total Earners, 30% of the total slum population earns some income. Males form 81% of the earning community. There is not much variation in these figures from slum to slum and hence between Sangli and Miraj also. The average earnings are Rs. 1837 per month and again the Sangli and Miraj figures are quite similar. Khaja Vasti, IN Open Space and SN Patra Chawl have a much lower than average income. On the other hand Kolhapur Chawl does much better than average. 4.4 Availability of Infrastructure We have covered in detail the existing infrastructure in the individual slum reports. It will be difficult to generalise this aspect in a group analysis. We may however cover certain common facilities like electric and water supply in the slums, which are provided by the Corporation.
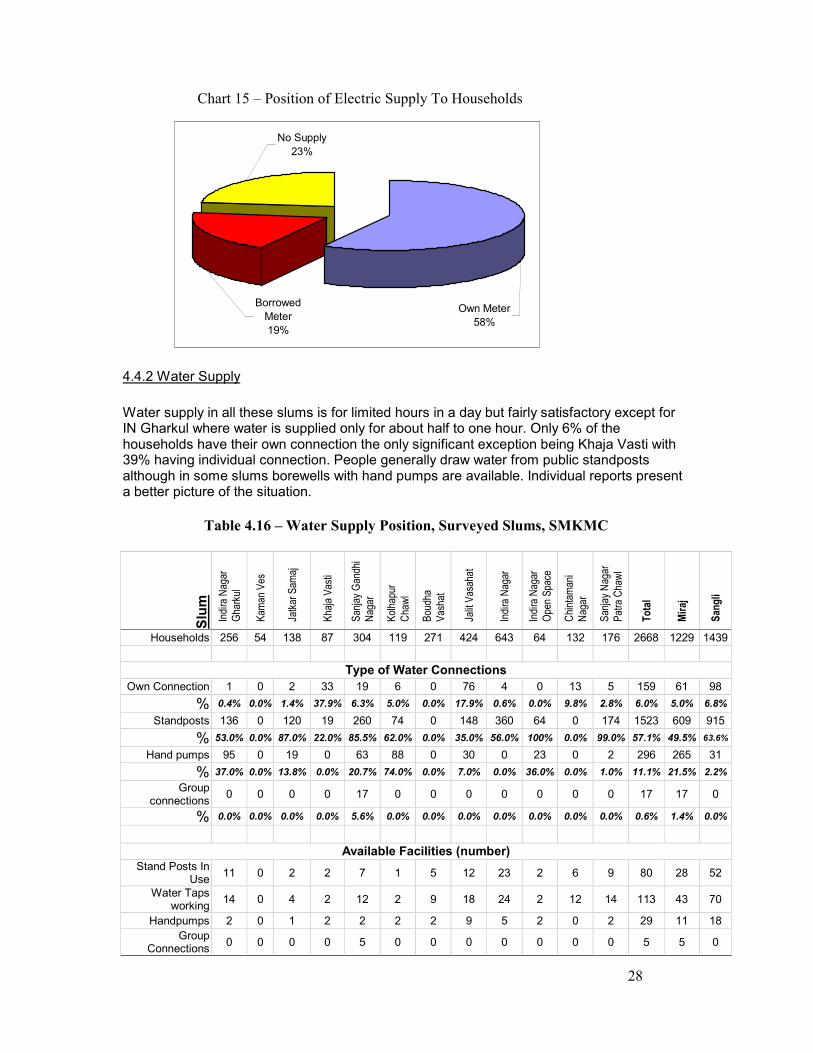
4.4.1 Electricity We find that that the average of households with electricity is 77% out of which 19% are borrowing electricity from their neighbours. There is no significant departure from these averages in the individual slums except for Kaman Ves where only 65% of the houses have electricity although the households borrowing their supply is only 6%. In Khaja Vasti the borrowers are as high as 39% followed by IN Gharkul with 27%. There is no significant correlation between per capita income and electric connection.
Table 4.15 – Electric Supply, Surveyed Slums, SMKMC
Slum
Indira Nagar
Gharkul
Kam
an Ves
Jatkar Sam
aj
Khaja Vasti
Sanjay Gandhi
Nagar
Kolhapur Chawl
Boudha Vashat
Jalit Vasahat
Indira Nagar
Indira Nagar
Open Space
Chintam
ani
Nagar
Sanjay Nagar
Patra Chawl
To
tal
Mir
aj
San
gli
Households 256 54 138 87 304 119 271 424 643 64 132 176 2668 1229 1439
With Supply 75.8% 64.8% 70.3% 85.1% 83.6% 86.6% 83.4% 81.6% 73.3% 57.8% 75.8% 70.5% 77.2% 80.0% 74.9%
PC Income 591 601 484 448 554 712 548 614 583 542 522 459 568 563 572
Own Meter 48.4% 55.6% 47.8% 46.0% 65.8% 64.7% 72.0% 65.6% 49.0% 39.1% 64.4% 65.3% 58.1% 59.6% 56.8%
PC Income 569 633 489 435 564 703 545 615 600 563 538 458 571 563 578
Borrowed Meter
27.3% 9.3% 22.5% 39.1% 17.8% 21.8% 11.4% 16.0% 24.3% 18.8% 11.4% 5.1% 19.2% 20.4% 18.1%
PC Income 631 352 474 468 512 743 571 609 547 490 425 471 557 563 551
No Supply 24.2% 35.2% 29.7% 14.9% 16.4% 13.4% 16.6% 18.4% 26.7% 40.6% 24.2% 29.5% 22.7% 20.0% 25.0%
PC Income 637 531 478 435 581 615 417 575 538 521 491 420 530 539 524
28
Chart 15 – Position of Electric Supply To Households
4.4.2 Water Supply
Water supply in all these slums is for limited hours in a day but fairly satisfactory except for IN Gharkul where water is supplied only for about half to one hour. Only 6% of the households have their own connection the only significant exception being Khaja Vasti with 39% having individual connection. People generally draw water from public standposts although in some slums borewells with hand pumps are available. Individual reports present a better picture of the situation.
Table 4.16 – Water Supply Position, Surveyed Slums, SMKMC
Slum
Indira Nagar
Gharkul
Kam
an Ves
Jatkar Sam
aj
Khaja Vasti
Sanjay Gandhi
Nagar
Kolhapur
Chawl
Boudha
Vashat
Jalit Vasahat
Indira Nagar
Indira Nagar
Open Space
Chintam
ani
Nagar
Sanjay Nagar
Patra Chawl
To
tal
Mir
aj
San
gli
Households 256 54 138 87 304 119 271 424 643 64 132 176 2668 1229 1439
Type of Water Connections
Own Connection 1 0 2 33 19 6 0 76 4 0 13 5 159 61 98
% 0.4% 0.0% 1.4% 37.9% 6.3% 5.0% 0.0% 17.9% 0.6% 0.0% 9.8% 2.8% 6.0% 5.0% 6.8%
Standposts 136 0 120 19 260 74 0 148 360 64 0 174 1523 609 915
% 53.0% 0.0% 87.0% 22.0% 85.5% 62.0% 0.0% 35.0% 56.0% 100% 0.0% 99.0% 57.1% 49.5% 63.6%
Hand pumps 95 0 19 0 63 88 0 30 0 23 0 2 296 265 31
% 37.0% 0.0% 13.8% 0.0% 20.7% 74.0% 0.0% 7.0% 0.0% 36.0% 0.0% 1.0% 11.1% 21.5% 2.2%
Group connections
0 0 0 0 17 0 0 0 0 0 0 0 17 17 0
% 0.0% 0.0% 0.0% 0.0% 5.6% 0.0% 0.0% 0.0% 0.0% 0.0% 0.0% 0.0% 0.6% 1.4% 0.0%
Available Facilities (number)
Stand Posts In Use
11 0 2 2 7 1 5 12 23 2 6 9 80 28 52
Water Taps working
14 0 4 2 12 2 9 18 24 2 12 14 113 43 70
Handpumps 2 0 1 2 2 2 2 9 5 2 0 2 29 11 18
Group Connections
0 0 0 0 5 0 0 0 0 0 0 0 5 5 0
No Supply
23%
Borrowed
Meter
19%
Own Meter
58%
29
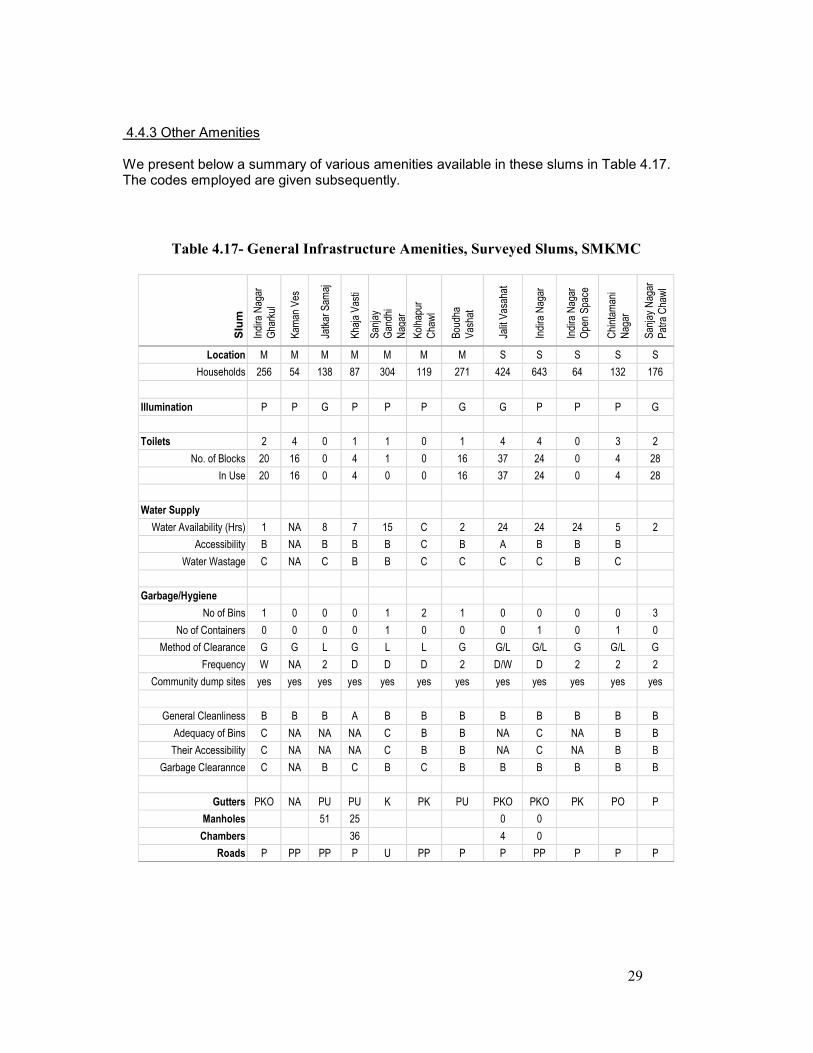
4.4.3 Other Amenities We present below a summary of various amenities available in these slums in Table 4.17. The codes employed are given subsequently.
Table 4.17- General Infrastructure Amenities, Surveyed Slums, SMKMC
Slum
Indira Nagar
Gharkul
Kam
an Ves
Jatkar Sam
aj
Khaja Vasti
Sanjay
Gandhi
Nagar
Kolhapur
Chawl
Boudha
Vashat
Jalit Vasahat
Indira Nagar
Indira Nagar
Open Space
Chintam
ani
Nagar
Sanjay Nagar
Patra Chawl
Location M M M M M M M S S S S S
Households 256 54 138 87 304 119 271 424 643 64 132 176
Illumination P P G P P P G G P P P G
Toilets 2 4 0 1 1 0 1 4 4 0 3 2
No. of Blocks 20 16 0 4 1 0 16 37 24 0 4 28
In Use 20 16 0 4 0 0 16 37 24 0 4 28
Water Supply
Water Availability (Hrs) 1 NA 8 7 15 C 2 24 24 24 5 2
Accessibility B NA B B B C B A B B B
Water Wastage C NA C B B C C C C B C
Garbage/Hygiene
No of Bins 1 0 0 0 1 2 1 0 0 0 0 3
No of Containers 0 0 0 0 1 0 0 0 1 0 1 0
Method of Clearance G G L G L L G G/L G/L G G/L G
Frequency W NA 2 D D D 2 D/W D 2 2 2
Community dump sites yes yes yes yes yes yes yes yes yes yes yes yes
General Cleanliness B B B A B B B B B B B B
Adequacy of Bins C NA NA NA C B B NA C NA B B
Their Accessibility C NA NA NA C B B NA C NA B B
Garbage Clearannce C NA B C B C B B B B B B
Gutters PKO NA PU PU K PK PU PKO PKO PK PO P
Manholes 51 25 0 0
Chambers 36 4 0
Roads P PP PP P U PP P P PP P P P

30
Codes Used in Table 4.17
Code Code
General Ratings Gutters
Good A All Pucca P
Average B All Kaccha K
Poor C Both PK
Not Applicable NA Pucca and Underground PU
Kutcha and Underground KU
Garbage/Hygiene Pucca and Open PO
Method of Clearance Kutcha and Open KO
Lorry L Both Kutcha & Pucca Open PKO
Ghantagadi G Illumination
Other O Good G
Poor P
Frequency of Clearance Roads
Daily D Paved P
Never N Partly Paved PP
Weekly W Unpaved U
5.0 FEDERATION ACTIVITIES SA/Baandhani started federation activities simultaneously with the survey work. Federation activities include: meetings in small groups to create a better rapport and bonding with people, formation of saving groups, and household enumeration. This was a good way of taking people into confidence before starting the surveying process, which normally creates apprehension within communities, as they sometimes perceive it as a possible threat to their existence. SA/Baandhani started federation activities by establishing small savings groups with no more than 20 members each. This was met with stiff resistance in some slums due to previous experiences, which had proven to be disastrous. However, with time, a few women got together and started crisis savings in a few slums. There has been a range of responses from different communities regarding the sanitation projects proposed in their settlement. Kolhapur Chawl: As the decision regarding location of the toilet block had been dragging for quite some time, the local councillor decided to go ahead with the construction of the sanitation block on the proposed site (identified by the councillor) that is some distance from the slum. The path leading to it is also ill lit, which makes it dangerous for women to use during early morning or late evening hours. SA had identified a site within the settlement (approved by the residents), which probably belonged to the Railways (as the entire settlement is on Railway land), but was being claimed by a local resident. It had been brought to the notice of the Municipal Commissioner when he had visited the site on 6th June. He had directed his officers to check the status of the land and dispute. As there was no progress on this issue, the local councillor had a discussion with SA after which it was decided that he would construct it out of his funds. The construction work is likely to begin very soon. Jalit: Federation meetings were organized in this slum. One savings group started with 15 women, but it stopped because there was lack of clarity on its benefits to the families. Benefits of the savings groups were explained to the community again. Despite several meetings here the women are still reluctant to become part of the federation or take any responsibility for supervision or maintenance.
31
Sulabh International (SI) already had commissioned a ‘pay and use’ toilet in one part of the slum two years ago, which is fairly well maintained. SA has advised the SMKMC that it might be a good idea for SI to carry out construction of the second block, as it would be easier managed by one NGO. Jatkar Samaj: Three savings groups are operating in this community with 20 members. They opened a bank account which is progressing well. SMKMC constructed sewerage lines in this slum. Therefore, it is possible to construct individual or group toilets in this slum. The local municipal councillor is very keen that individual toilets are constructed in this area. As a first step, SA assisted three households to build individual toilets. The households contributed 25% of the total cost. This generated a lot of interest about the project in the community. Khaja: This small slum consists mainly of petty vendors. SA/Baandhani tried to get residents interested in starting savings groups but with no success. They feel they are too poor to put money aside. Though there have been continuous efforts by Baandhani members, they are yet to bear fruits. This is a settlement where it is feasible to extend individual toilets to each household. This is being explored with the families with the help of the local councillor, Mr. Idris Naikwadi, who has been very supportive of the community- led programme as three of the selected slums fall under his constituency. Sanjay Nagar, Miraj: A savings group was established early on but was not active. After the exchange to Pune, two new groups were formed. They are progressing very well. They want to create additional resources for themselves. The collective savings is over Rs.2500. There is a lot of enthusiasm here as this is the most vulnerable slum in terms of existing services. A third group is in the process of coming together. Sanjay Nagar Patra Chawl: Three savings groups are operating in this slum. Under the guidance of SA, the residents of this settlement have registered a trust. They are willing to undertake the construction of their sanitation project with SA’s help. They have submitted a letter to the Municipal Commissioner urging him to entrust the task of building their community toilets in accordance with the GR of 2001. Indira Nagar: Three saving group are operating in this settlement. The groups opened bank accounts. People here are also very keen and motivated to build better houses and toilets for themselves. They were motivated by their visit to Pune. Those in the slum that did not participate in the first exchange visit are now very interested in participating in the next visit. Large groups of residents of this settlement have visited Jatkar Samaj. Recently, on learning that within the next six months sewerage networks are being extended along the main 100’ wide DP road, the community has resolved that they would rather wait and work on an integrated housing and sanitation project for their settlement instead of the proposed 100 seat community toilets under the NBA funds. Indira Gharkul: One savings group was started in this slum. Two more groups were started by another local NGO prior to ours along similar lines. Here too SA/Baandhani have decided to rope in these groups for toilet maintenance and supervision. Residents feel that getting toilets is important for them and they are ready to work towards this end. The community identified open spaces for the toilets within the settlement. Chintamani Nagar: Here the local councillor has promised toilets and has also dug pits a few months ago to start construction work. After that there has been no progress in the work. But the community continues to believe that they will get free toilets maintained by the SMKMC and have consistently resisted becoming part of the federation.
32
Bouddha Vasahat: This slum is better off compared to the others in terms of services and the socio-economic profile of the families. 45 families in this settlement have individual toilets and the others are willing to contribute 25% to the total cost of constructing individual toilets. The sewerage infrastructure is fairly well laid out within the settlement. But the women here are not interested in becoming part of the federation as they are fairly well to do and thus not too keen on saving groups. SA/Baandhani have decided not to push federations here since there will be individual toilets provided. 6.0STRATEGIES AND IMPLEMENTATION
6.1 Strategy The mapping information together with the response to federation building efforts, which varied from community to community, indicated clearly that the strategy would have to vary according to the prevalent local condition. There were several approaches, which needed to be considered in implementing these projects. There was a long meeting with the Municipal Commissioner on 27 December 2005 regarding the strategy to be followed in implementing these projects. SA offered to help in 3 ways:
a. Undertake the responsibility of supervising construction of individual toilets in 3 slums and extend technical support to the two communities who have registered themselves into a trust for implementing their own community toilets.
b. Help the local govt. to frame the rules and conditions pertaining to the implementation and maintenance contract that will be signed with the selected NGOs.
c. Liaise between the selected NGOs and the community for a better mutual understanding to aid maintenance in the years to come.
6.2 Individual Toilets Slums with individual or shared toilets: Analysis of extensive data and mapping on the GIS assisted SA to identify three slums, which could go for individual toilets. In these slums, namely Jatkar Samaj, Bouddha Vasahat and Khaja Vasti, SMKMC approved individual toilet facilities. These slums have a fairly extensive network of drainage lines. With a few more subsidiary lines in place, each house can be individually connected. The response of the families to this idea has been varied. In Jatkar Samaj (where 3 demonstration individual toilets have already been built) the families have shown great enthusiasm in coming together to become part of the federation as well as putting aside 20% of the total cost of building their individual toilet unit. This generated a lot of interest about the project in the community. Enthused by this, many families have come forward with their 20% contribution. Various delays dragged the implementation of the project for 9 months. The representatives met the Municipal Commissioner with SA social workers and urged him to start work in their slum. They also submitted a letter signed by 75% of the residents to support this. The issue was resolved with MHADA giving permission in principle and the Municipal Commissioner allowing SA to start construction using CA funds. Construction work started in early January and 70 households have been provided with individual toilets. The community has provided 20% of the total cost as well as supervised the quality of construction and taken responsibility for the material that was provided to them and curing of the structure after it had been completed. Many families also constructed the bath alongside and these units are the only pucca structures in the slum where housing is still largely built from impermanent materials.
33
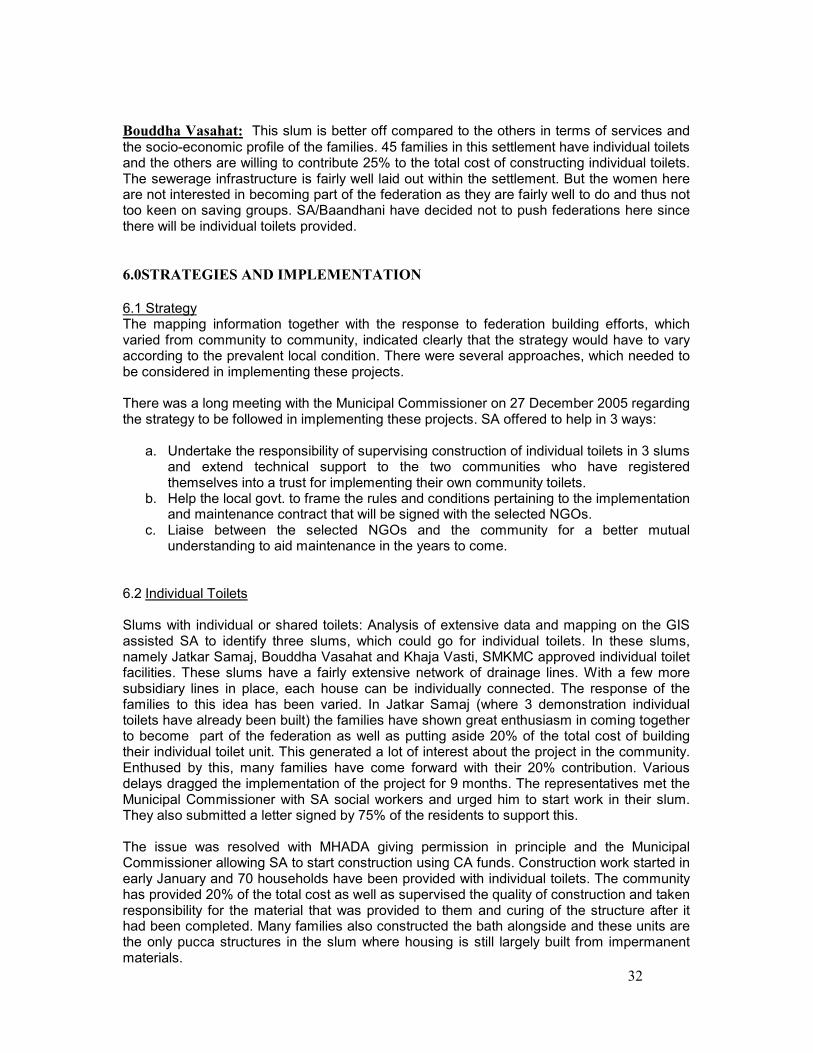
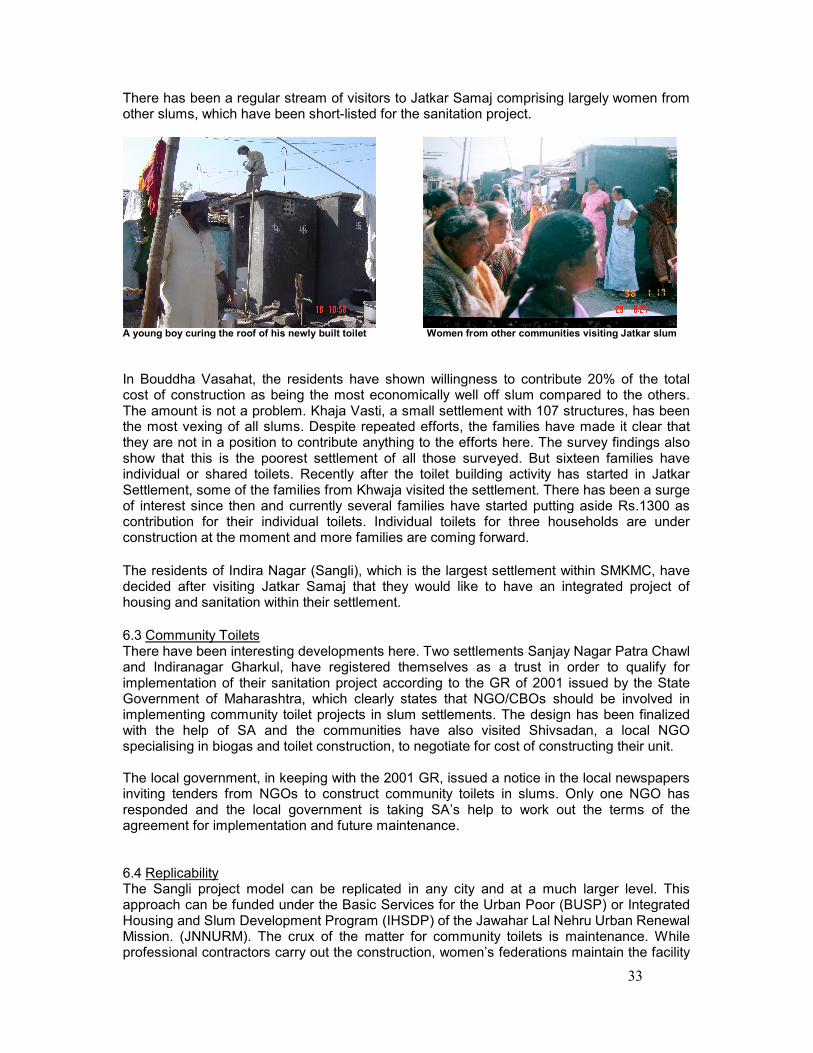
There has been a regular stream of visitors to Jatkar Samaj comprising largely women from other slums, which have been short-listed for the sanitation project.
A young boy curing the roof of his newly built toilet Women from other communities visiting Jatkar slum In Bouddha Vasahat, the residents have shown willingness to contribute 20% of the total cost of construction as being the most economically well off slum compared to the others. The amount is not a problem. Khaja Vasti, a small settlement with 107 structures, has been the most vexing of all slums. Despite repeated efforts, the families have made it clear that they are not in a position to contribute anything to the efforts here. The survey findings also show that this is the poorest settlement of all those surveyed. But sixteen families have individual or shared toilets. Recently after the toilet building activity has started in Jatkar Settlement, some of the families from Khwaja visited the settlement. There has been a surge of interest since then and currently several families have started putting aside Rs.1300 as contribution for their individual toilets. Individual toilets for three households are under construction at the moment and more families are coming forward. The residents of Indira Nagar (Sangli), which is the largest settlement within SMKMC, have decided after visiting Jatkar Samaj that they would like to have an integrated project of housing and sanitation within their settlement.
6.3 Community Toilets There have been interesting developments here. Two settlements Sanjay Nagar Patra Chawl and Indiranagar Gharkul, have registered themselves as a trust in order to qualify for implementation of their sanitation project according to the GR of 2001 issued by the State Government of Maharashtra, which clearly states that NGO/CBOs should be involved in implementing community toilet projects in slum settlements. The design has been finalized with the help of SA and the communities have also visited Shivsadan, a local NGO specialising in biogas and toilet construction, to negotiate for cost of constructing their unit. The local government, in keeping with the 2001 GR, issued a notice in the local newspapers inviting tenders from NGOs to construct community toilets in slums. Only one NGO has responded and the local government is taking SA’s help to work out the terms of the agreement for implementation and future maintenance. 6.4 Replicability The Sangli project model can be replicated in any city and at a much larger level. This approach can be funded under the Basic Services for the Urban Poor (BUSP) or Integrated Housing and Slum Development Program (IHSDP) of the Jawahar Lal Nehru Urban Renewal Mission. (JNNURM). The crux of the matter for community toilets is maintenance. While professional contractors carry out the construction, women’s federations maintain the facility
34
in the coming years. As result, the community-run model is very replicable, wherever there is the willingness by the project implementers to build the capacity of the slum residents by way of extensive community-based federation activity.
6.5 Outcomes The complexion of the project has changed tremendously due to a perceptible change in the attitude and understanding of the key stakeholders. Some of the key areas in which change has occurred:
a. The councilor/NGO/CBO partnership has been very strong in pushing individual toilets.
b. The project has been noticed at all levels of bureaucracy right from the State to the
local government as there were different issues that needed to be addressed as they arose. For example, MHADA Mumbai, would not have had any role in the decision-making if it had continued as just a nodal agency for disbursing funds for community toilets. The Vice President MHADA supported SA/Baandhani to implement a pilot project in Sangli with individual toilets.
c. SA has managed to stress the need for the process to be in place without laying
undue emphasis on the built product. SA consciously decided not to become an NGO contractor in this project as there was a conflict of interest since part of the construction funds were being routed through SA. This actually increased SA’s credibility with SMKMC and now they have agreed to let SA assist them in liaising between the NGO that is selected to implement some projects as well as draw up the maintenance contract between the SMKMC and the NGO.
d. Two communities forming a trust was a milestone in the history of SMKMC. The local
govt. is seriously considering the issue of giving the implementation and maintenance contract to the community directly.
This is one project that has demonstrated that a variety of effective solutions can be worked out in keeping with the ground realities and there can be no standard solution to slum sanitation.
35
APPENDIX I Maps of SMKMC showing
location of the twelve slums
36
APPENDIX II Individual maps of twelve
Settlements
37
APPENDIX III Demonstration of mapping
analysis using GIS
38
APPENDIX IV Fact sheet of each slum


![[XLS] · Web viewC.S NO.13573 AND 13581, NEAR TATA PETROL PUMP,SANGLI-MIRAJ ROAD , VISHRAMBAG , SANGLI,SANGLI-MIRAJ KUPWAD(M CORP),-416415 DELHI - HISSAR BYE PASS ROAD, ,NEAR POWER](https://static.fdocuments.net/doc/165x107/5aa7d2847f8b9ab8228cc369/xls-viewcs-no13573-and-13581-near-tata-petrol-pumpsangli-miraj-road-vishrambag.jpg)

