Lesson 3.4 Constant Rate of Change (linear functions) 1 3.3.2: Proving Average Rate of Change.
Upload
sophie-spencerCategory
view
220download
0
SLOPE

We have already learned about constant rate of change (constant of proportionality) and found the constant rate of change in graphs and tables.
If a line is a proportional relationship---what will it look like on a graph?

We have already learned about constant rate of change (constant of proportionality) and found the constant rate of change in graphs and tables.
If a line is a proportional relationship---what will it look like on a graph?
The line will go through the origin (0, 0).

A proportional relationship can be described by an equation of the form y = kx, where k is a number called the constant of proportionality or direct variation.

Nonproportional relationships can be represented on a graph as well.

Then graph points—connect points.
Fill in the table to find the points on the graph using the formula:
y = 2x + 1x y
0
1
2
3

The graph points—connect points.
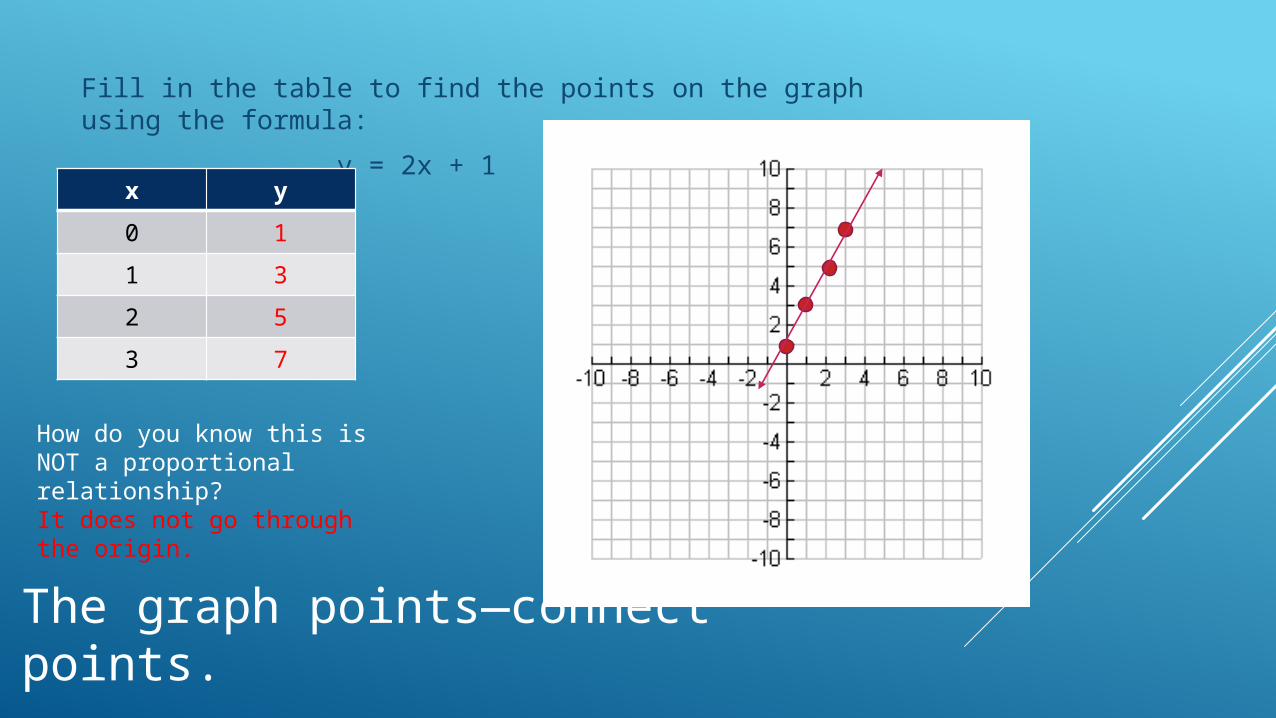
Fill in the table to find the points on the graph using the formula:
y = 2x + 1x y
0 1
1 3
2 5
3 7
How do you know this is NOT a proportional relationship?
The graph points—connect points.
Fill in the table to find the points on the graph using the formula:
y = 2x + 1x y
0 1
1 3
2 5
3 7
How do you know this is NOT a proportional relationship?It does not go through the origin.

Today we will learn about slopes of lines.
Watch this quick video
https://www.youtube.com/watch?v=qE463XcV1Ro

PASS OUT FOLDABLEFOLD IN HALF—WHERE SLOPE IS IN FRONT

Slope is the distance traveled on the y axis (rise- up or down) over the distance traveled on the x axis (run- left to right).
Slope = also written

y intercept is the point at which the graph crosses (intercepts) the y axis. The y intercept is the value of y when x = 0.
The slope intercept form is
y = mx + b
slope y intercept

LABEL THE GRAPHS ON YOUR FOLDABLE
positive negative zero undefined
Going up stairs is positive slope,Down stairs is negative slope.

Then graph—connect points.
Fill in the table to find the points on the graph using the formula:
y = 2x + 1x y
0 1
1 3
2 5
3 7
From the graph earlier--Is this a positive, negative, zero or undefined slope?
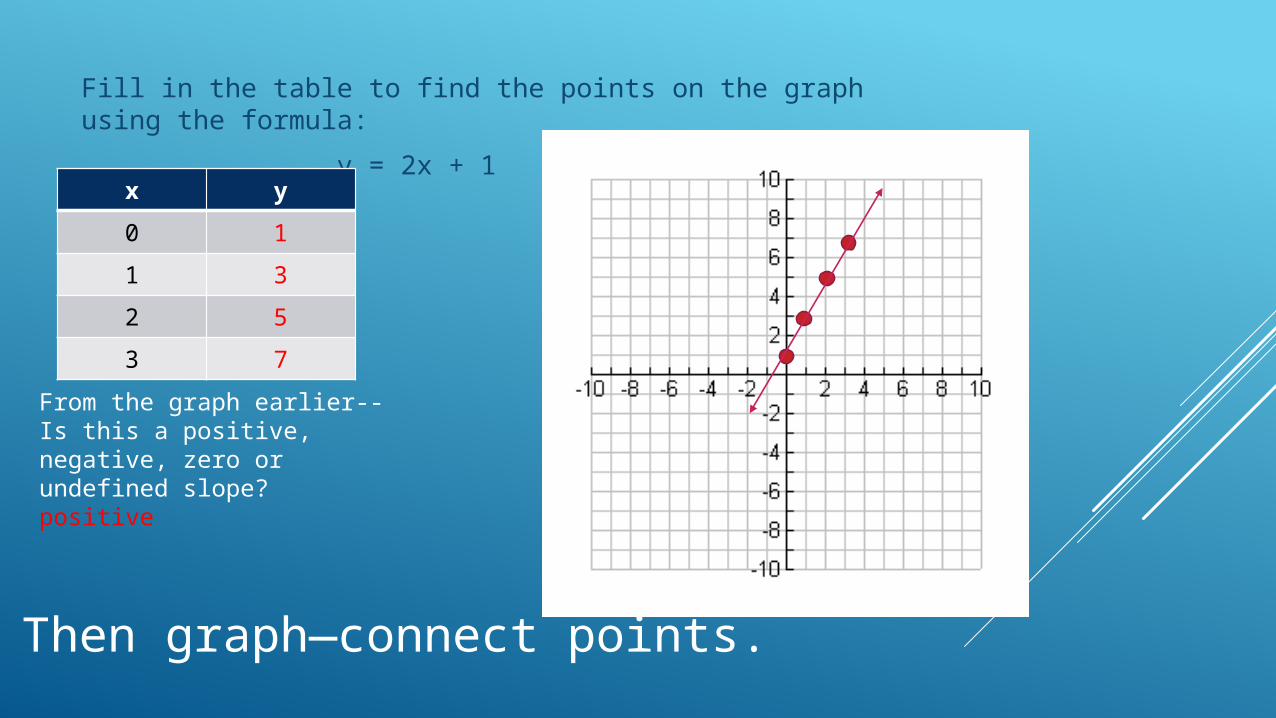
Then graph—connect points.
Fill in the table to find the points on the graph using the formula:
y = 2x + 1x y
0 1
1 3
2 5
3 7
From the graph earlier--Is this a positive, negative, zero or undefined slope?positive

NOW WE WILL WORK SOME TOGETHER

BE CAREFUL ON THE LAST 2 QUESTIONS