Exponential Functions and Models Lesson 5.3. Contrast Linear Functions Change at a constant rate...
27
Exponential Functions and Models Lesson 5.3
-
Upload
bruno-page -
Category
Documents
-
view
216 -
download
2
Transcript of Exponential Functions and Models Lesson 5.3. Contrast Linear Functions Change at a constant rate...
Exponential Functions and Models
Lesson 5.3
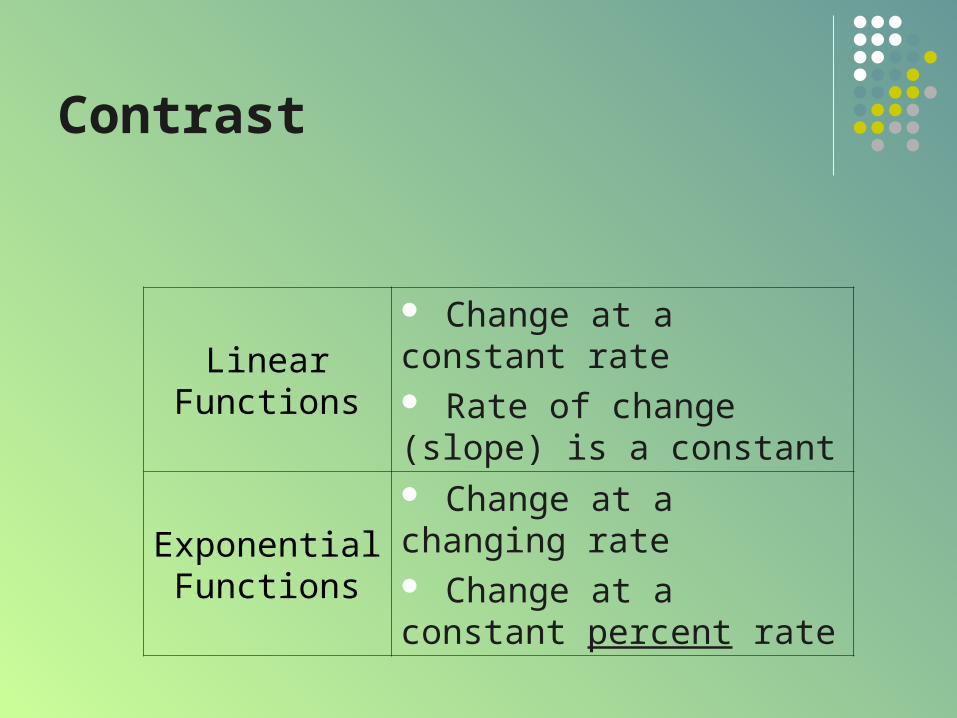
Contrast
LinearFunctions
Change at a constant rate Rate of change (slope) is a constant
ExponentialFunctions
Change at a changing rate Change at a constant percent rate
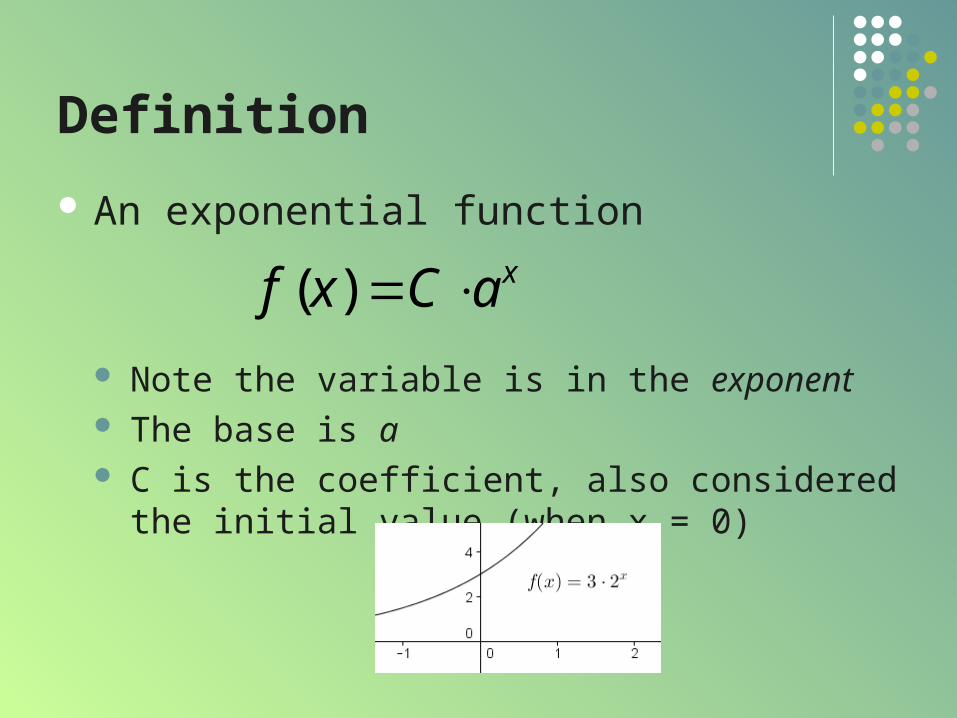
Definition
An exponential function
Note the variable is in the exponent The base is a C is the coefficient, also considered the initial value
(when x = 0)
( ) xf x C a
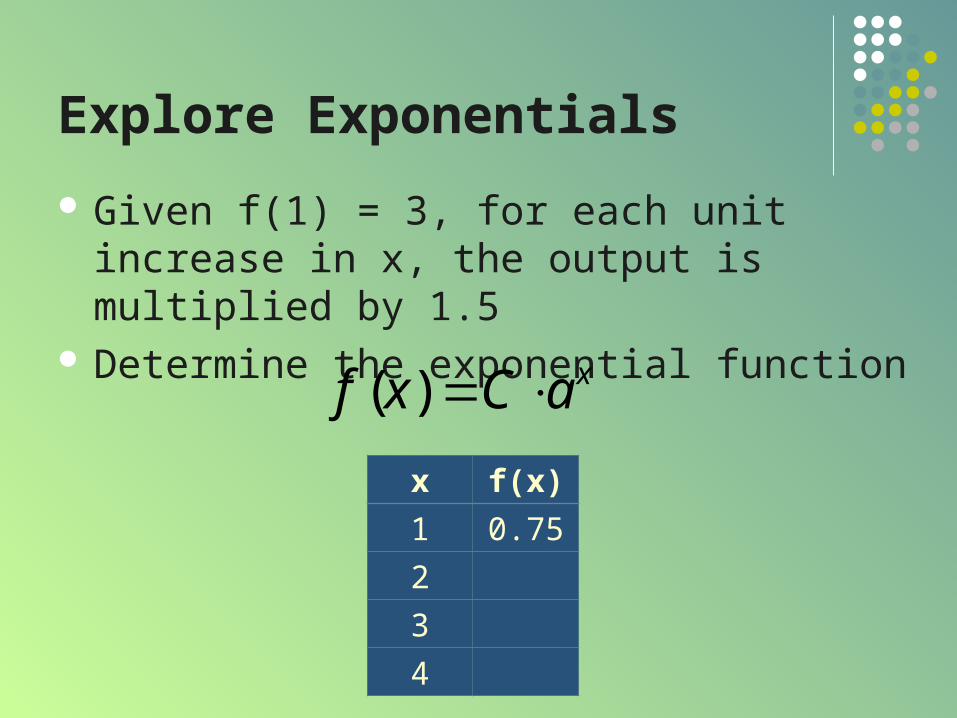
Explore Exponentials
Given f(1) = 3, for each unit increase in x, the output is multiplied by 1.5
Determine the exponential function
( ) xf x C a
x f(x)
1 0.75
2
3
4
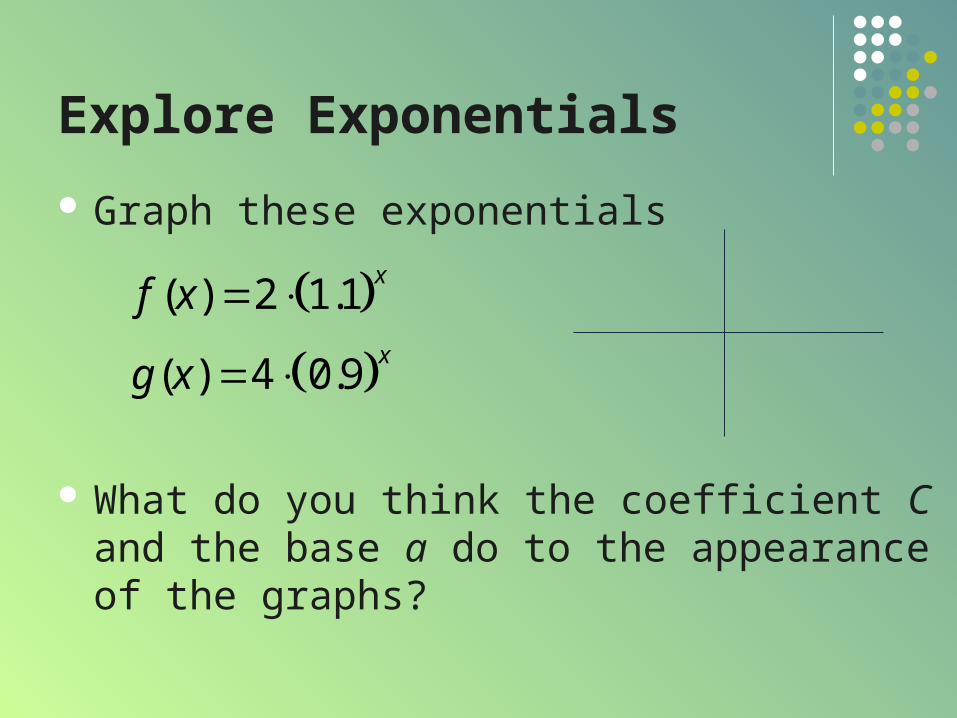
Explore Exponentials
Graph these exponentials
What do you think the coefficient C and the base a do to the appearance of the graphs?
( ) 2 1.1
( ) 4 0.9
x
x
f x
g x
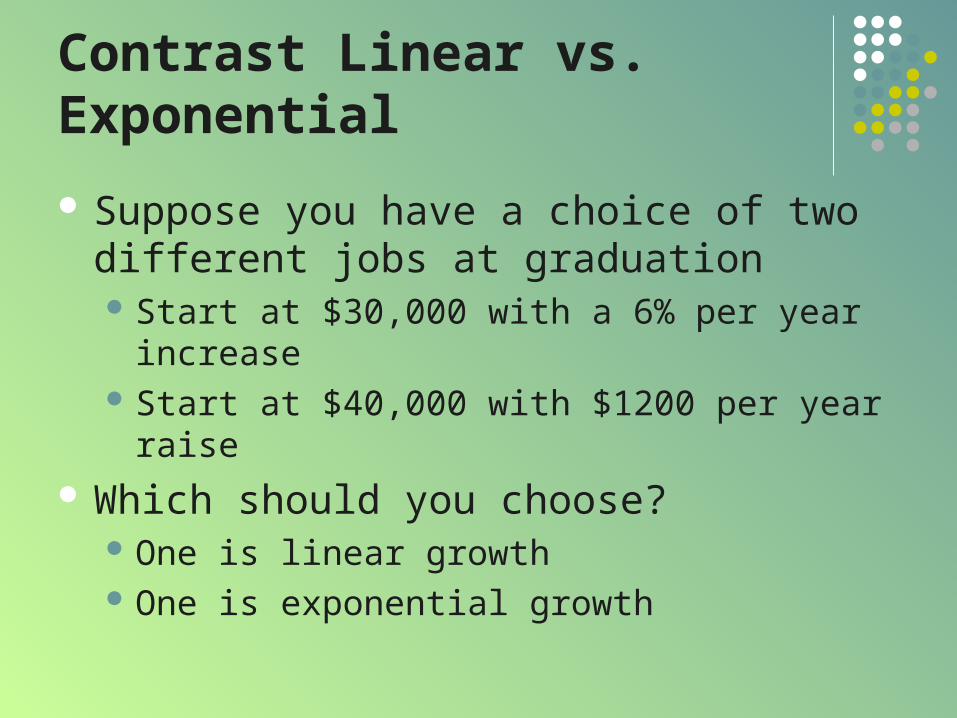
Contrast Linear vs. Exponential
Suppose you have a choice of two different jobs at graduation Start at $30,000 with a 6% per year increase Start at $40,000 with $1200 per year raise
Which should you choose? One is linear growth One is exponential growth
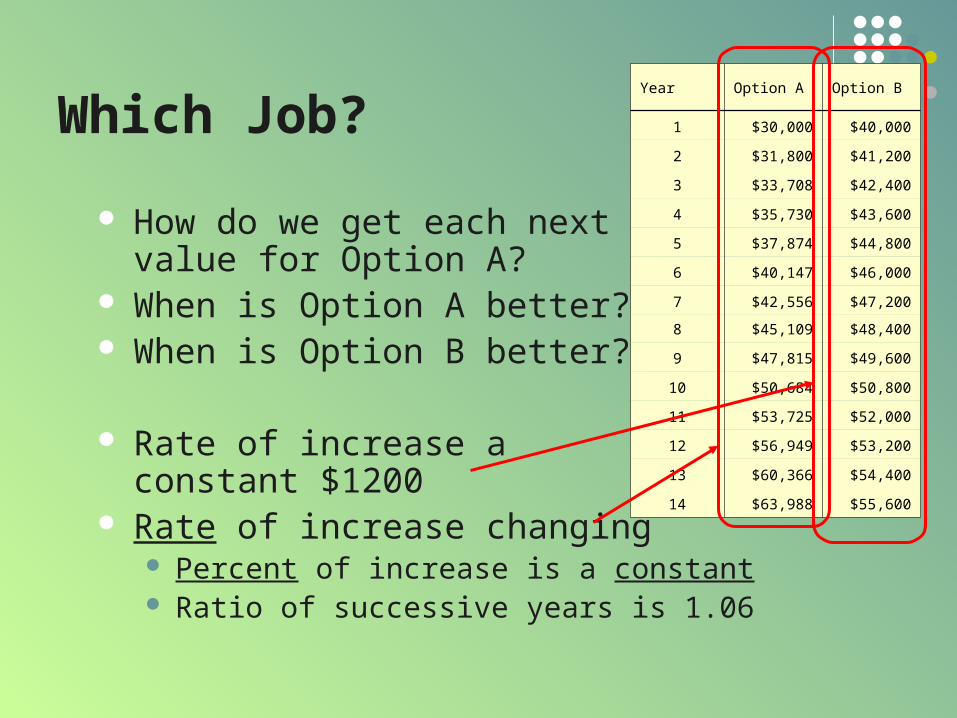
Which Job?
How do we get each nextvalue for Option A?
When is Option A better? When is Option B better?
Rate of increase a constant $1200
Rate of increase changing Percent of increase is a constant Ratio of successive years is 1.06
Year Option A Option B
1 $30,000 $40,000
2 $31,800 $41,200
3 $33,708 $42,400
4 $35,730 $43,600
5 $37,874 $44,800
6 $40,147 $46,000
7 $42,556 $47,200
8 $45,109 $48,400
9 $47,815 $49,600
10 $50,684 $50,800
11 $53,725 $52,000
12 $56,949 $53,200
13 $60,366 $54,400
14 $63,988 $55,600
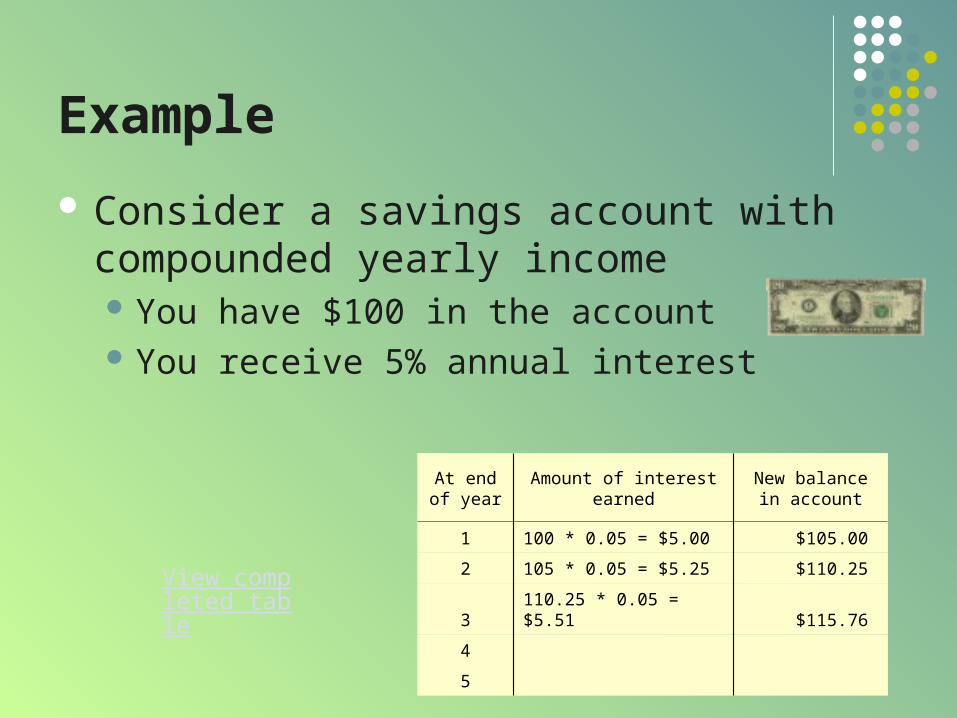
Example
Consider a savings account with compounded yearly income You have $100 in the account You receive 5% annual interest
At end of year
Amount of interest earnedNew balance in
account
1 100 * 0.05 = $5.00 $105.00
2 105 * 0.05 = $5.25 $110.25
3 110.25 * 0.05 = $5.51 $115.76
4
5
View completed table
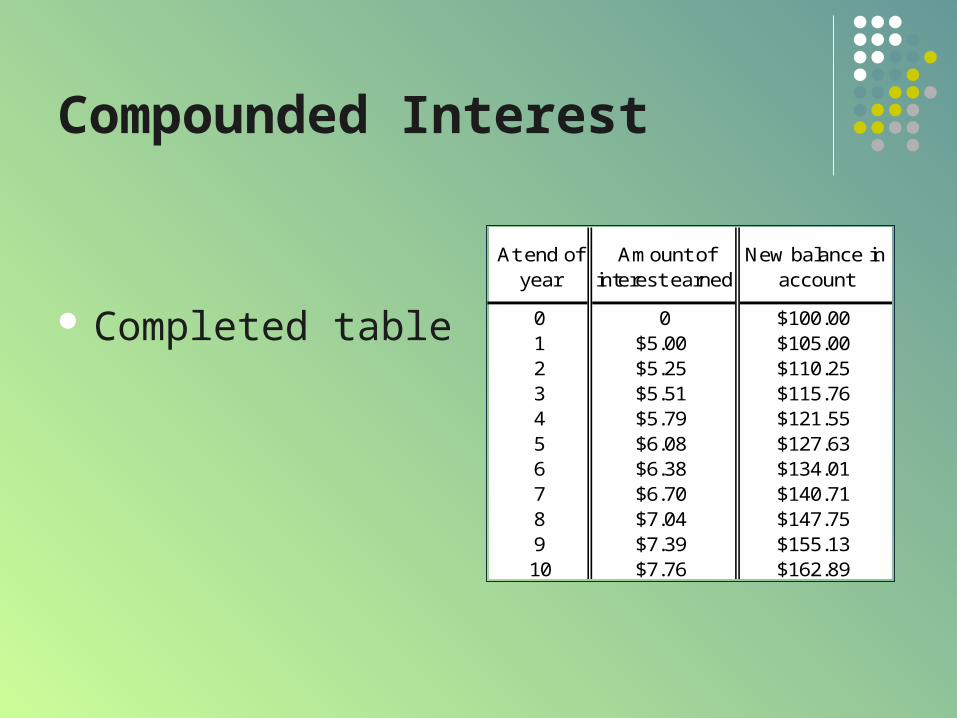
Compounded Interest
Completed table
At end of year
Amount of interest earned
New balance in account
0 0 $100.001 $5.00 $105.002 $5.25 $110.253 $5.51 $115.764 $5.79 $121.555 $6.08 $127.636 $6.38 $134.017 $6.70 $140.718 $7.04 $147.759 $7.39 $155.1310 $7.76 $162.89
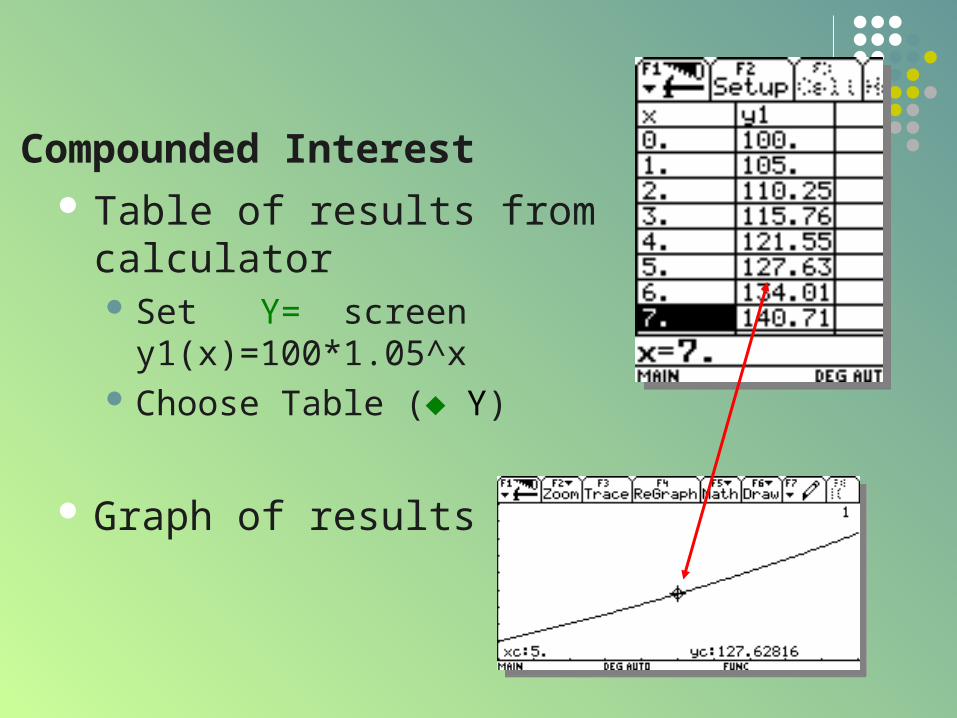
Compounded Interest Table of results from
calculator Set Y= screen
y1(x)=100*1.05^x Choose Table (♦ Y)
Graph of results

Assignment A
Lesson 5.3A Page 415 Exercises 1 – 57 EOO
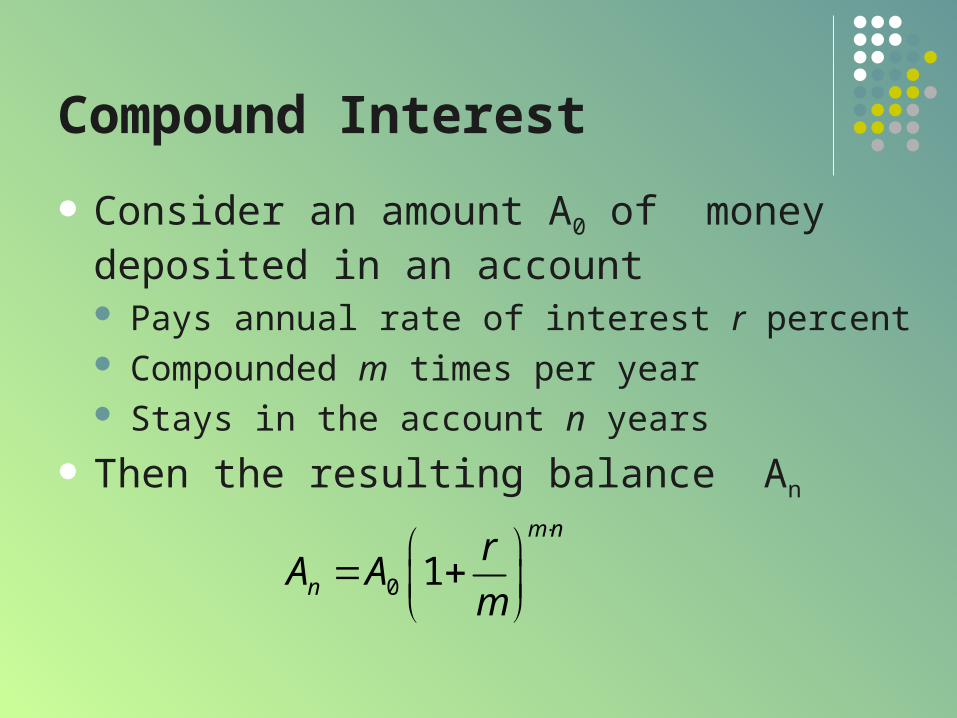
Compound Interest
Consider an amount A0 of money deposited in an account Pays annual rate of interest r percent Compounded m times per year Stays in the account n years
Then the resulting balance An
0 1m n
n
rA A
m
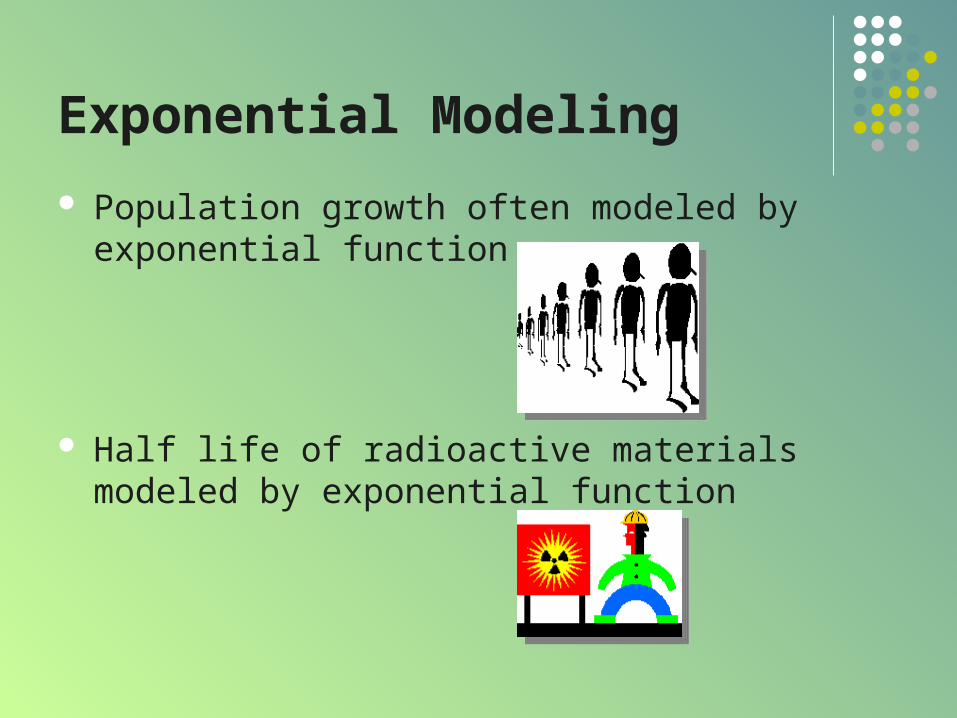
Exponential Modeling
Population growth often modeled by exponential function
Half life of radioactive materials modeled by exponential function
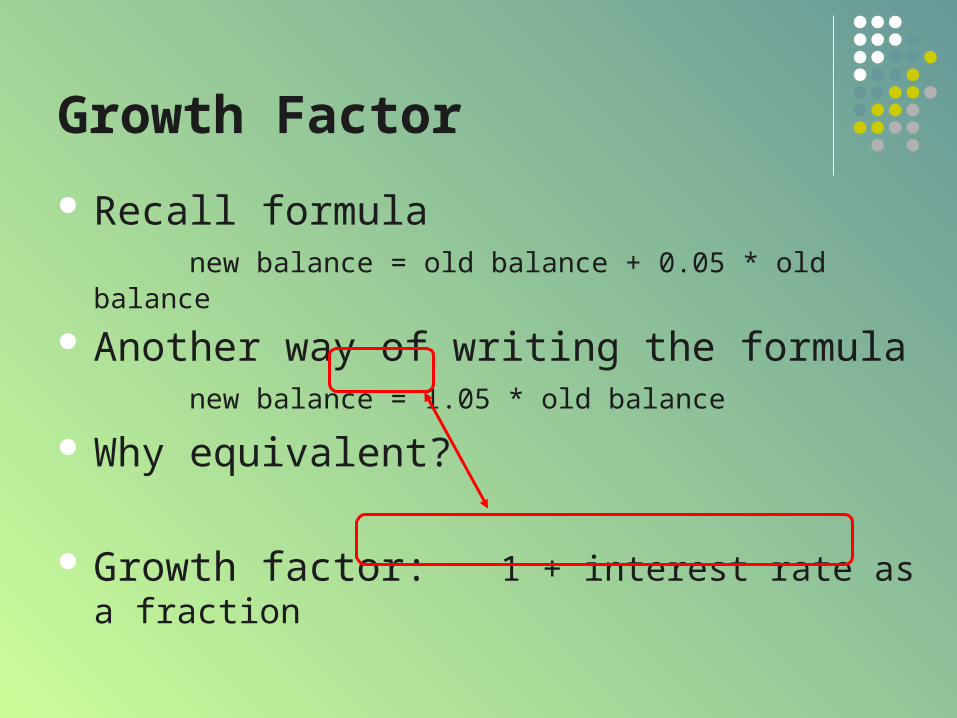
Growth Factor
Recall formulanew balance = old balance + 0.05 * old balance
Another way of writing the formulanew balance = 1.05 * old balance
Why equivalent?
Growth factor: 1 + interest rate as a fraction
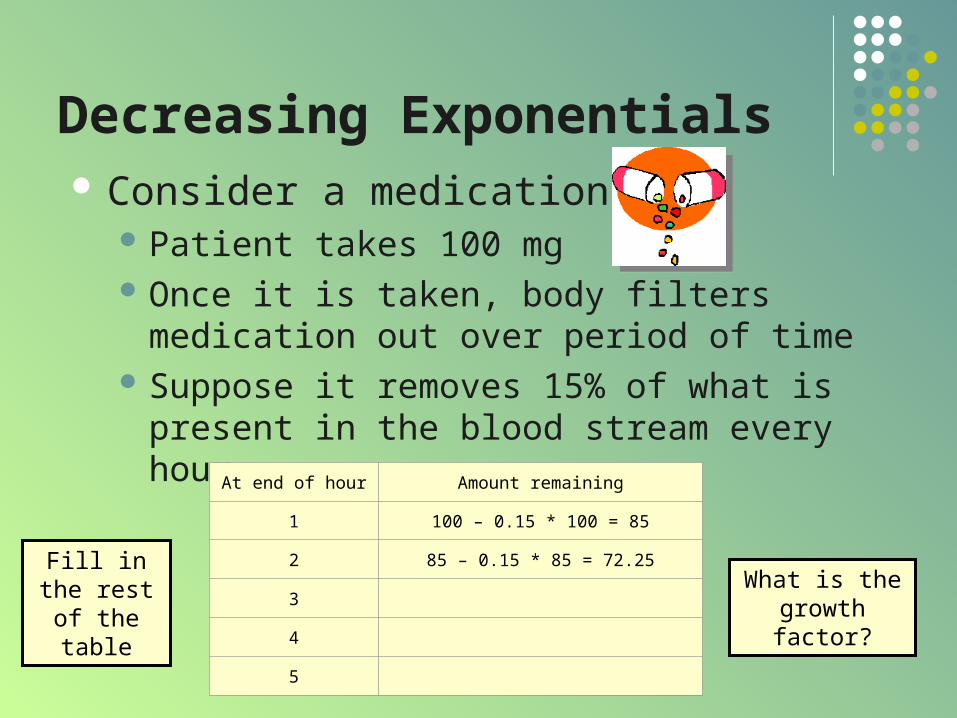
Decreasing Exponentials Consider a medication
Patient takes 100 mg Once it is taken, body filters medication out over
period of time Suppose it removes 15% of what is present in
the blood stream every hour
At end of hour Amount remaining
1 100 – 0.15 * 100 = 85
2 85 – 0.15 * 85 = 72.25
3
4
5
Fill in the rest of the
table
What is the growth factor?
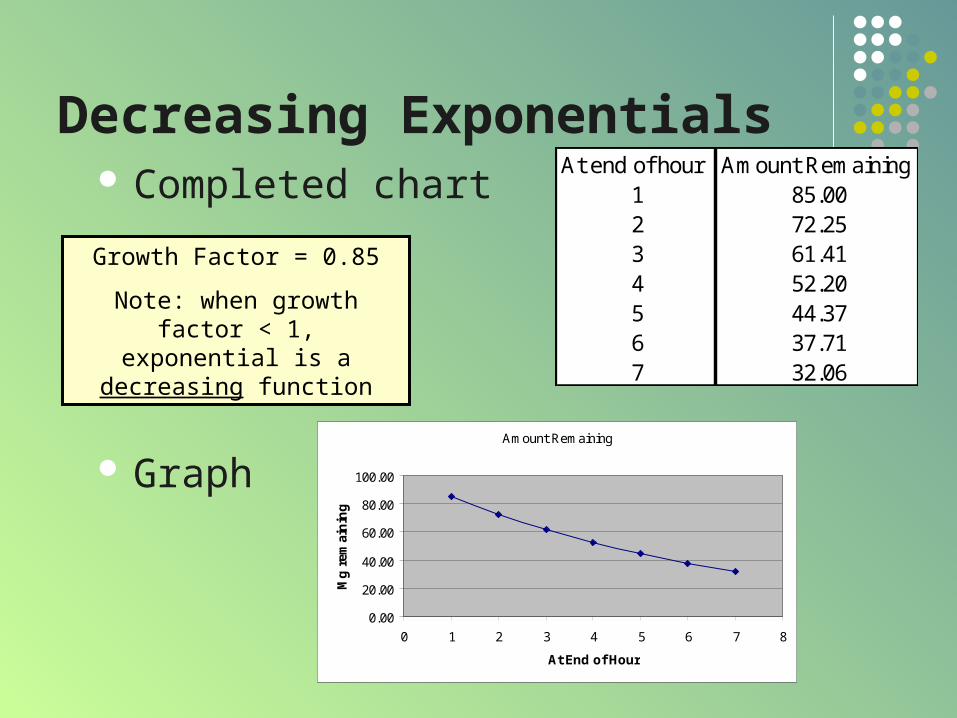
Decreasing Exponentials Completed chart
Graph
At end of hour Amount Remaining1 85.002 72.253 61.414 52.205 44.376 37.717 32.06
Amount Remaining
0.00
20.00
40.00
60.00
80.00
100.00
0 1 2 3 4 5 6 7 8
At End of Hour
Mg
rem
ain
ing
Growth Factor = 0.85
Note: when growth factor < 1, exponential is a decreasing
function
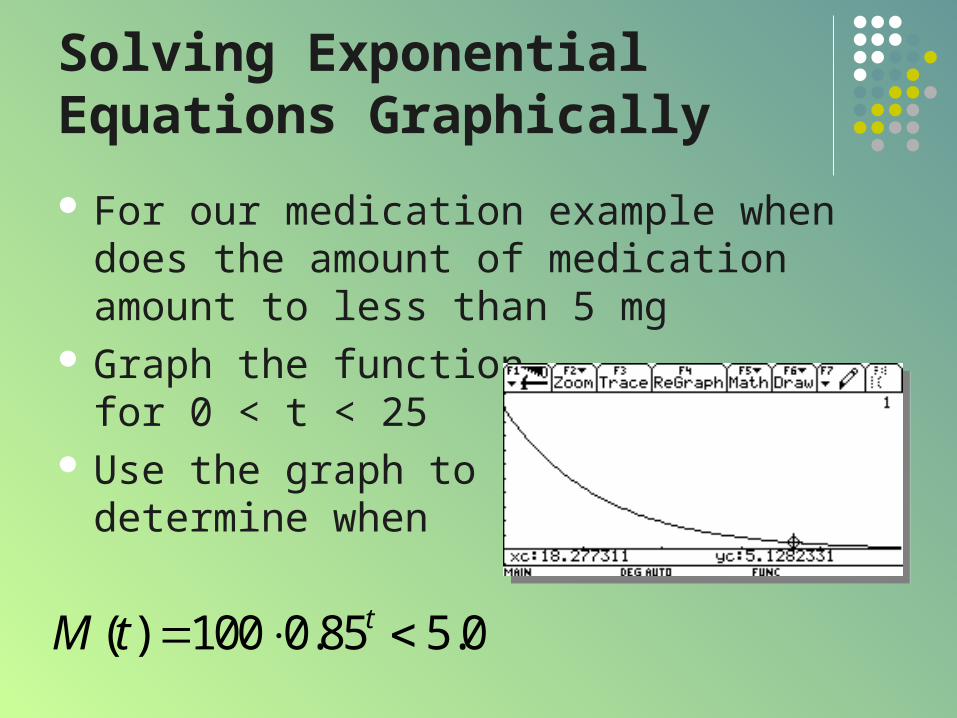
Solving Exponential Equations Graphically
For our medication example when does the amount of medication amount to less than 5 mg
Graph the functionfor 0 < t < 25
Use the graph todetermine when
( ) 100 0.85 5.0tM t
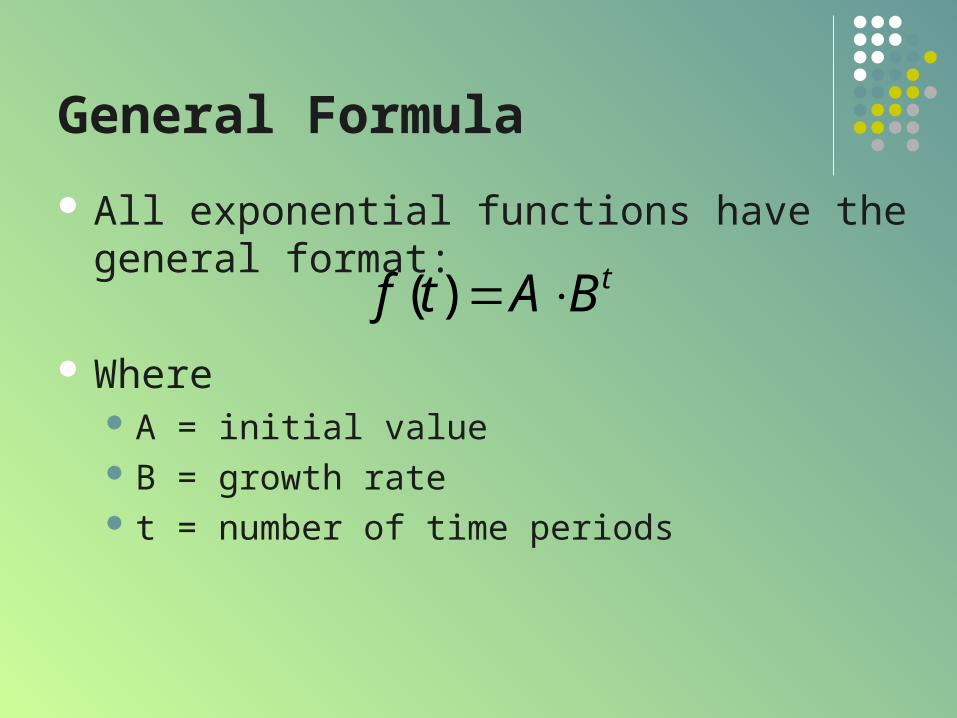
General Formula
All exponential functions have the general format:
Where A = initial value B = growth rate t = number of time periods
( ) tf t A B
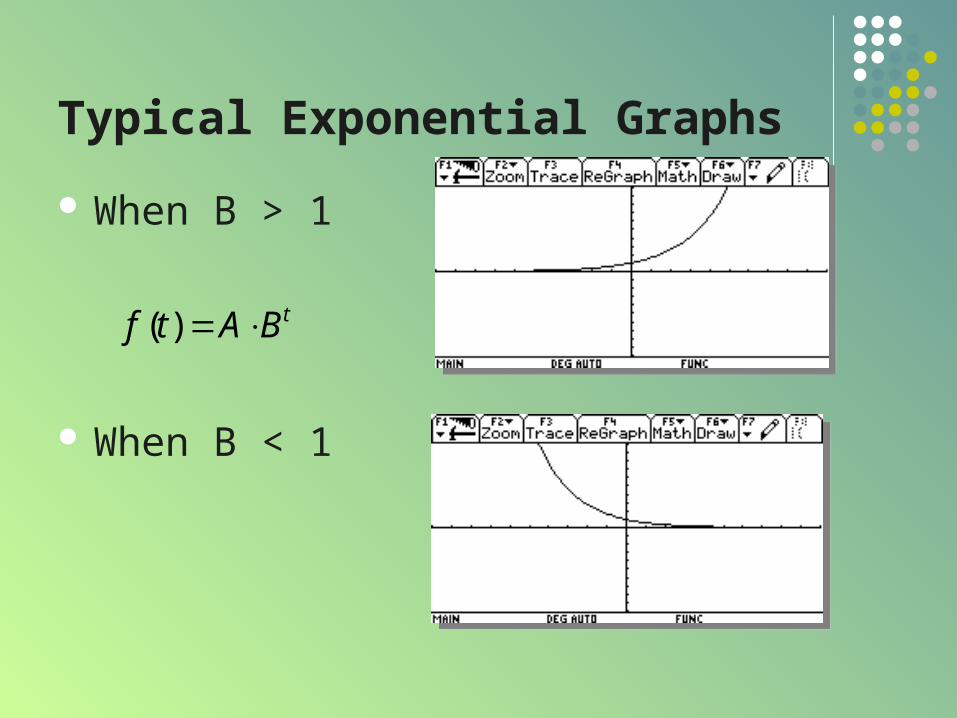
Typical Exponential Graphs
When B > 1
When B < 1
( ) tf t A B
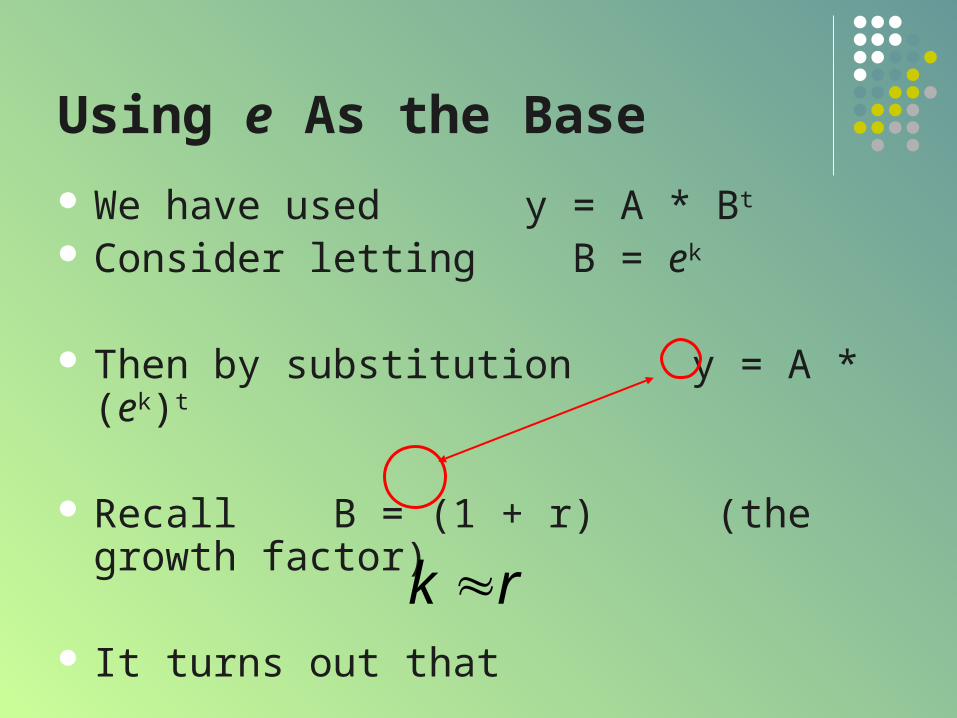
Using e As the Base
We have used y = A * Bt
Consider letting B = ek
Then by substitution y = A * (ek)t
Recall B = (1 + r) (the growth factor)
It turns out that k r
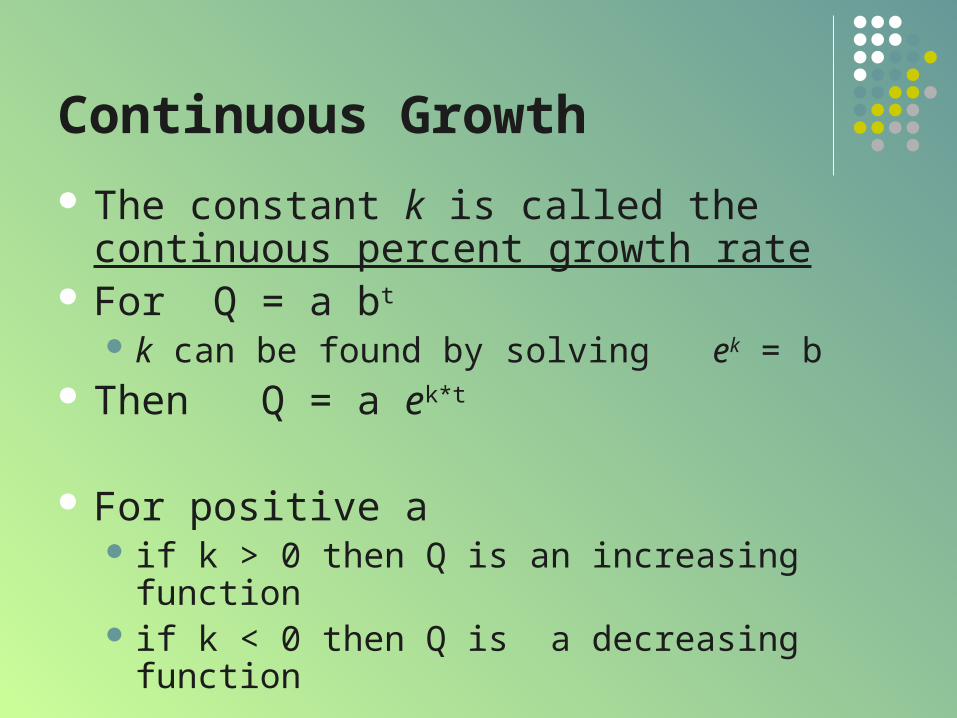
Continuous Growth
The constant k is called the continuous percent growth rate
For Q = a bt k can be found by solving ek = b
Then Q = a ek*t
For positive a if k > 0 then Q is an increasing function if k < 0 then Q is a decreasing function
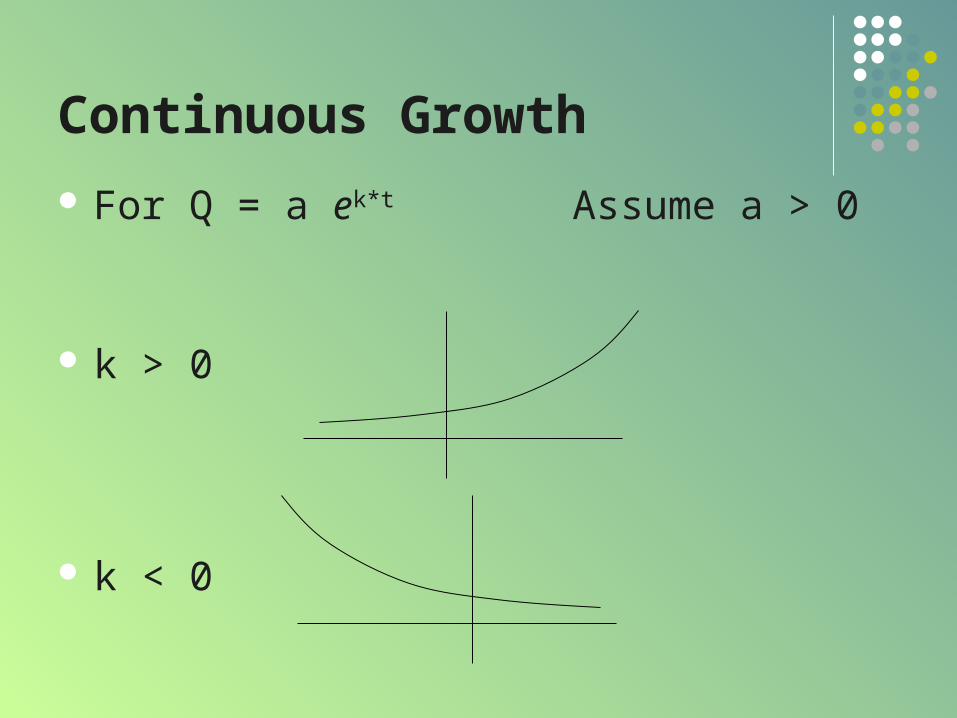
Continuous Growth
For Q = a ek*t Assume a > 0
k > 0
k < 0
Continuous Growth
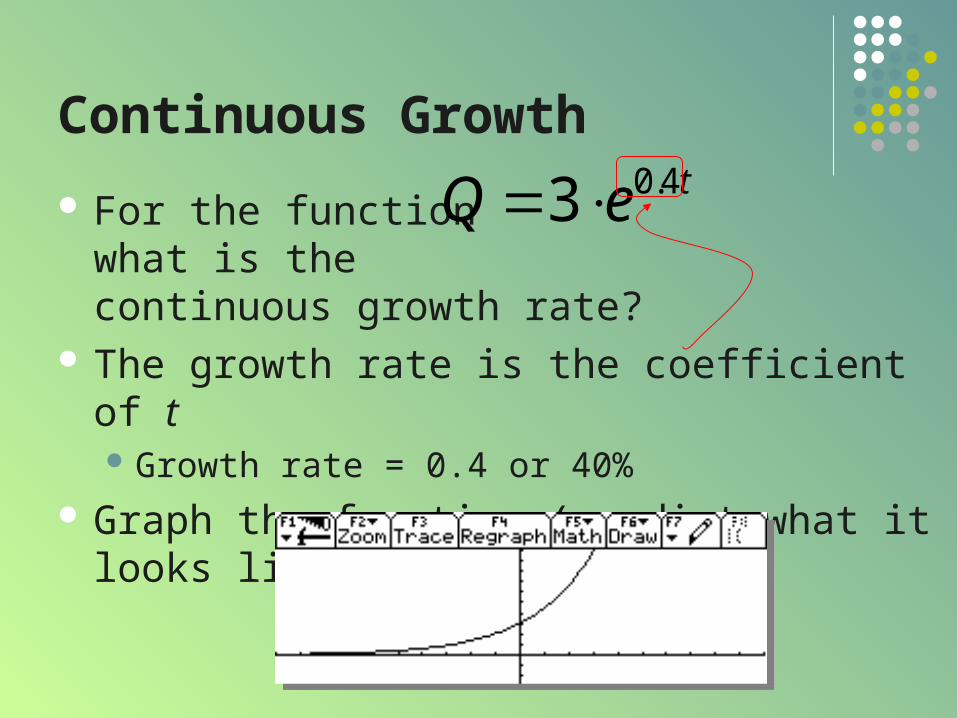
For the functionwhat is thecontinuous growth rate?
The growth rate is the coefficient of t Growth rate = 0.4 or 40%
Graph the function (predict what it looks like)
0.43 tQ e
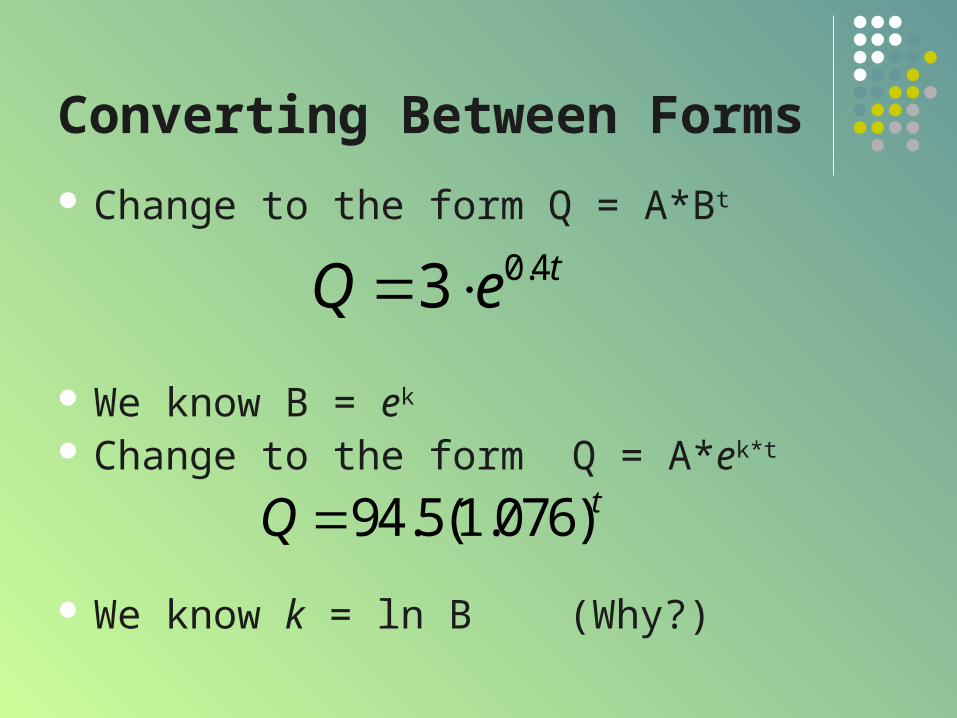
Converting Between Forms
Change to the form Q = A*Bt
We know B = ek
Change to the form Q = A*ek*t
We know k = ln B (Why?)
0.43 tQ e
94.5(1.076)tQ
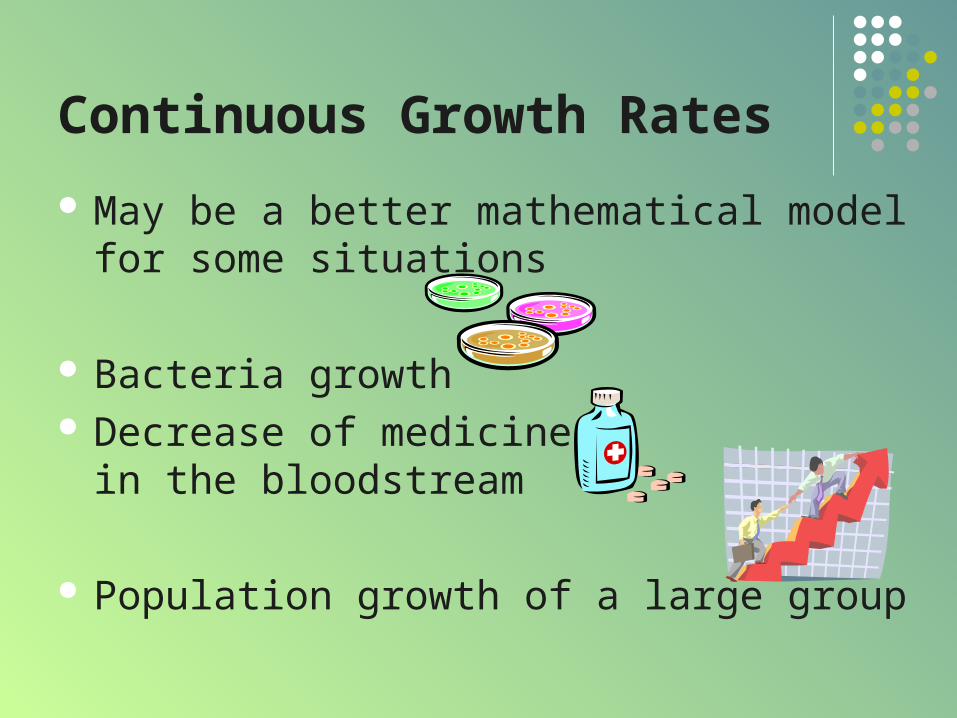
Continuous Growth Rates
May be a better mathematical model for some situations
Bacteria growth Decrease of medicine
in the bloodstream
Population growth of a large group
Example A population grows from its initial level of
22,000 people and grows at a continuous growth rate of 7.1% per year.
What is the formula P(t), the population in year t? P(t) = 22000*e.071t
By what percent does the population increase each year (What is the yearly growth rate)? Use b = ek

Assignment B
Lesson 5.3B Page 417 Exercises 65 – 85 odd