Size Distributions by SMPS and APS - mce2.org
12
Size Distributions by SMPS and APS Charles Stanier and Alicia Kalafut University of Iowa
Transcript of Size Distributions by SMPS and APS - mce2.org

Size Distributions by SMPS and APS
Charles Stanier and Alicia KalafutUniversity of Iowa

System Overview
WaterBasedCPC
Ambient Air APS Inlet A2
APSSample RHProcessing(Sheet C)
RH
Sheath airRH and Flow Control
APS 3321 ExhaustExhaust
Shea
th
From SheathAir RH Control
RH
OutdoorT, RH
Ambient Air
SMPS Inlet A14
SMPSSample RHProcessing(Sheet D)
Long
DM
A
RH
RH

From dry air supply
~10 psig
To vacuum pump
RH
PneumaticControl (see C-2)
To APS
To PC
APS Inlet
Bypass (No Drying)
Diffusion Dryer
Nafion Dryer

Measurement Objectives
• Measure aerosol size distribution from 10 nm – 2.5 microns– Measure at dried RH– Measure at ambient RH

Post Analysis Objectives
• Quantify aerosol nucleation / growth events• Analysis influence of vertical motions on aerosol
size distribution in conjunction with the University of Iowa LIDAR group (Eichinger)
• Quantify aerosol water content (μg m-3 aerosol water)– If hydrated and non-hydrated periods – explain by
meteorology and aerosol chemistry, in collaboration with other groups

Data Online
• Raw data is online at:– http://www.engineering.uiowa.edu/~cs_proj/m
exico_data_toc.htm– Not flagged. Includes many periods of data
that will eventually be flagged as invalid due to operator checks and (unfortunately) particle counter malfunctions

Interesting Features So Far
• Rapid “step function” transitions between polluted / clean conditions– Morning rush hour– Afternoon ventilation
• Examples

March 9, 14:00 Hours -- 50% decrease in PM2.5 in 20 min
Dew PointS
ize
Siz
e
00:00 12:00 24:00
SMPS
APS

APS
SMPS
Par
ticle
Vol
ume
Friday March 10, 6 – 7 AM. Very “sharp” rush hour. IMP Traffic? Local Vehicle Depot?

Sat March 11, 5 PM. 50% decrease in PM0.5 in 20 min. No change in PM0.5-2.5 as new air mass brings fewer particles, but larger in size.
APS
SMPS
Par
ticle
Vol
ume

Fri March 17, 5 PM. 60% decrease in PM0.5 at 12:30 PM followed by new particle formation / growth event
SM
PS SMPS
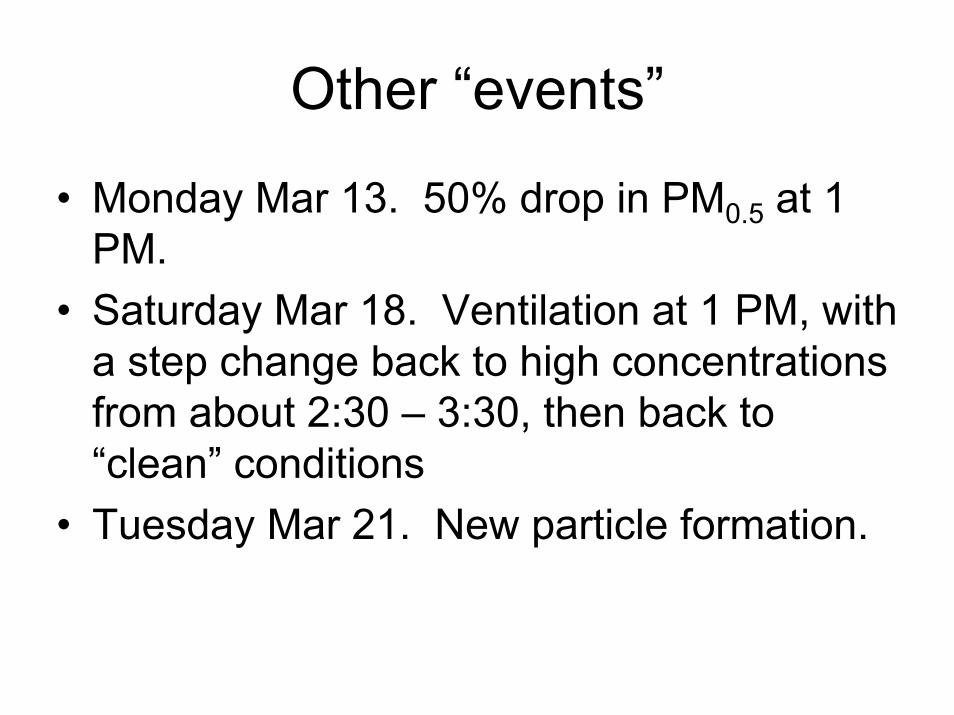
Other “events”
• Monday Mar 13. 50% drop in PM0.5 at 1 PM.
• Saturday Mar 18. Ventilation at 1 PM, with a step change back to high concentrations from about 2:30 – 3:30, then back to “clean” conditions
• Tuesday Mar 21. New particle formation.