Six Sigma helps a company create a culture of...
15
JOURNAL OF ORGANIZATIONAL EXCELLENCE / Summer 2004 © 2004 Wiley Periodicals, Inc. Published online in Wiley InterScience (www.interscience.wiley.com) DOI: 10.1002/npr.20019 SIX SIGMA HELPS A COMPANY CREATE A CULTURE OF ACCOUNTABILITY EXPECTATIONS–REWARDS ALIGNMENT How do you make employees feel more accountable for results? With many opin- ions but no hard facts about how to achieve this, one company turned to Six Sigma to find the answer. Six Sigma methodology, no longer confined to production de- partments, helped this company discover that a culture of accountability, first and foremost, is a function of strategically aligned employee expectations and an ef- fective system of rewards and consequences. © 2004 Wiley Periodicals, Inc. Peter C. Brewer Peter C. Brewer is an associate professor in the Department of Accountancy at Miami University, Oxford, Ohio. He can be reached at [email protected]. * * * 45 S ix Sigma, a process improvement methodol- ogy with its genesis in the manufacturing arena, has gained wide acceptance in U.S. companies; a recent study suggests that at least 25 percent of Fortune 200 companies are using it. Lately the methodology has been proving itself effective in nonmanufacturing applications as a customer- driven, data-based approach that provides an ob- jective framework for improving essentially qual- itative processes. When Amdell Inc. (a fictitious name for an ac- tual company) faced the need to create a “culture of accountability” (COA) within its organization, it encountered divergent opinions about how to achieve this. But rather than relying on anecdotal observations and personal opinions, the company chose the Six Sigma methodology to guide the process of culture change. Six Sigma enabled the project team to select the two processes that could most greatly affect employees’ sense of account- ability, to identify gaps between how these processes should operate and how they currently functioned, and to design and implement specific improvements to close the gaps as quickly as pos- sible. Six Sigma helped the Amdell project team not only focus its efforts in the most meaningful areas but also find the best triggers for making employees more accountable for results. WHO IS ACCOUNTABLE FOR RESULTS? With more than $750 million in annual sales, Amdell Inc., a wholly owned subsidiary of a Fortune 100 company, develops and markets a
Transcript of Six Sigma helps a company create a culture of...
JOURNAL OF ORGANIZATIONAL EXCELLENCE / Summer 2004
© 2004 Wiley Periodicals, Inc. Published online in Wiley InterScience (www.interscience.wiley.com) DOI: 10.1002/npr.20019
SIX SIGMA HELPS A COMPANY CREATE ACULTURE OF ACCOUNTABILITY
EXPECTATIONS–REWARDS ALIGNMENT
How do you make employees feel more accountable for results? With many opin-ions but no hard facts about how to achieve this, one company turned to Six Sigmato find the answer. Six Sigma methodology, no longer confined to production de-partments, helped this company discover that a culture of accountability, first andforemost, is a function of strategically aligned employee expectations and an ef-fective system of rewards and consequences. © 2004 Wiley Periodicals, Inc.
Peter C. Brewer
Peter C. Brewer is an associate professor in the Department of Accountancy at Miami University, Oxford, Ohio. He can be reached [email protected].
* * *
45
Six Sigma, a process improvement methodol-ogy with its genesis in the manufacturing arena,
has gained wide acceptance in U.S. companies; arecent study suggests that at least 25 percent ofFortune 200 companies are using it. Lately themethodology has been proving itself effective innonmanufacturing applications as a customer-driven, data-based approach that provides an ob-jective framework for improving essentially qual-itative processes.
When Amdell Inc. (a fictitious name for an ac-tual company) faced the need to create a “cultureof accountability” (COA) within its organization,it encountered divergent opinions about how toachieve this. But rather than relying on anecdotalobservations and personal opinions, the companychose the Six Sigma methodology to guide the
process of culture change. Six Sigma enabled theproject team to select the two processes that couldmost greatly affect employees’ sense of account-ability, to identify gaps between how theseprocesses should operate and how they currentlyfunctioned, and to design and implement specificimprovements to close the gaps as quickly as pos-sible. Six Sigma helped the Amdell project teamnot only focus its efforts in the most meaningfulareas but also find the best triggers for makingemployees more accountable for results.
WHO IS ACCOUNTABLE FOR RESULTS?
With more than $750 million in annual sales,Amdell Inc., a wholly owned subsidiary of aFortune 100 company, develops and markets a

JOURNAL OF ORGANIZATIONAL EXCELLENCE / Summer 2004
46 Peter C. Brewer
broad portfolio of automotive electronic compo-nents. Looking for better ways to sustain and im-prove on a tradition of strong financial perfor-mance, Amdell hired a high-profile consultingfirm in 2000 to take a fresh look at the company’sbusiness operations. One of the firm’s findingswas that the overwhelming majority of employ-ees were receiving overall performance evalua-tions of “3” or “4” (on a 5-point scale, with 1 �poor and 5 � outstanding) despite the fact thatthe company was regularly missing its revenuetargets and overspending its budget. Who atAmdell, the firm asked, is responsible for unac-ceptable financial performance? The firm recom-mended that one way Amdell could improve itsresults was to increase the sense of accountabil-ity that each employee has for those results, i.e.,to strengthen its culture of accountability (COA).
Amdell’s senior managers accepted the rec-ommendation but quickly discovered there wasno internal consensus on just how to achieve astronger COA. Some managers felt it was a func-tion of organizational processes and structures;others believed senior management effective-ness, human resource policies and practices, fis-cal responsibility, or individual commitment wasthe primary lever. All these opinions reflectedpersonal beliefs rather than any objective, cus-tomer-driven data. More importantly, each wouldlead to dramatically different courses of actionfor culture change. For example, a focus on in-dividual commitment could have a goal to elim-inate employees’ “I deserve it” mentality, whichcontributed to the inefficient use of resources. Ifsenior management effectiveness was the focusof the culture change process, then the goalmight be to eliminate the bureaucratic activitiesand in-house committees that some people be-lieved were an inefficient use of senior man-agers’ time.
In the absence of objective data, many com-panies rely upon political and personal agendas toselect a course of action. Financially astute seniormanagers often struggle with qualitative change
processes, frequently pursuing ill-advised coursesof action that demoralize their employees.
Amdell’s senior managers knew in their “gut”that Amdell needed a culture change that would in-crease everyone’s accountability, but without aclear consensus, they did not know how to facil-itate the process. They turned to Amdell’s ProcessImprovement Department for ideas.
The staff of the Process Improvement De-partment suggested using a Six Sigma frame-work known as DMAIC (Define, Measure, An-alyze, Improve, and Control) to provide astructure for the process of creating a COA (seeExhibit 1). The senior managers were intriguedby the customer focus, objectivity, and data-driven nature of the DMAIC process. They em-braced the Six Sigma approach and establisheda nine-member cross-functional project team,which included representatives from finance,human resources, sales, and research and devel-opment, as well as a Six Sigma Black Belt anda Green Belt (individuals trained and experi-enced in Six Sigma methodology and tools). Thesteps Amdell took to create a COA are discussedbelow according to each of the five DMAICstages employed in the project.
THE DEFINE STAGE
The accountability issues at Amdell related to theorganization’s ability, or inability, to meet the busi-ness plan and financial targets developed by theAmdell board of directors. The project team thusdefined its customer for this initiative as the boardof directors.
In order to make its efforts manageable, theteam also set project boundaries that limited thescope of the COA initiative to one location. SinceCleveland, the headquarters, had been the site ofthe consulting study that surfaced the accounta-bility problem, it was the logical candidate. Fur-thermore, if the accountability problem existedin other parts of Amdell as well, a successfulCleveland prototype would be helpful in devel-oping and implementing solutions elsewhere.
The project team created for the board of di-rectors’approval the Critical-to-Quality (CTQ) treeshown in Exhibit 2. The CTQ tree captured the“voice of the customer” (the board) in the form of26 outputs, or CTQs, that should be realized if
In the absence of objective data, manycompanies rely upon political and personal
agendas to select a course of action.

Six Sigma Helps a Company Create a Culture of Accountability
JOURNAL OF ORGANIZATIONAL EXCELLENCE / Summer 2004
47
Next, the project team sought to “managescope” by focusing its efforts on the two processesout of the six that have the greatest impact on cre-ating a culture of accountability. To establish therelative influence of the six processes, the teamhad its customer, the board of directors, completetwo cause-and-effect matrices. The first of thesematrices, shown in Exhibit 3, lists the 26 CTQrequirements (in rows) and the six processes (incolumns). The board used the following steps tocomplete the matrix:
1. Board members weighted each CTQ re-quirement for its relative “importance to the
Amdell succeeds in creating a culture of account-ability. For example, greater accountability wouldmean that Amdell meets the business plan, linksrewards to performance, and adheres to schedules,to name just three of the 26 outcomes. The teamalso identified six processes—“Drivers” in the CTQtree —that influence the accountability CTQs:
• Financial performance• Performance management• Ownership• Rewards/consequences• Commitment• Quality of leadership
Exhibit 1. The Six Sigma DMAIC Framework
STAGE/OBJECTIVE TOOLS/OUTPUT
DEFINE
Define the project’s purpose and scope. • Project charter: project’s scope, goals, milestones, team members,and customer benefits
• High-level process map, a SIPOC (Suppliers, Inputs, Process,Outputs, and Customers) diagram
• Critical-to-Quality Tree: translates the “voice of the customer”into specific requirements
MEASURE
Gather information regarding existing process • Control Charts • Prioritization Matricesconditions to provide a baseline assessment of • Frequency Plots • FMEA (Failure Mode and current performance levels and narrow the scope • Pareto Charts Effect Analysis) Chartsof inquiry to the most important problems. • SIPOC Diagrams
ANALYZE
Identify the root causes of the problems that • Affinity Diagrams • Regression Analysis were clarified in the Measure Stage. • Cause-and-Effect Diagrams • Design of Experiments
• Control Charts
IMPROVE
Develop, implement, and evaluate solutions • Brainstorming • Hypothesis Testsintended to eliminate the root causes of • FMEA • Consensus Buildingproblems identified in the Analyze Stage. • Flow Diagrams
CONTROL
Ensure that problems remain fixed and that • Pareto Charts • Quality Control Process Chartsthe new methods can be improved over time. • Control Charts • Other data collection methods
• Flow Diagrams

JOURNAL OF ORGANIZATIONAL EXCELLENCE / Summer 2004
48 Peter C. Brewer
customer” by assigning it a rating between1 and 10 (the first column of the matrix).
2. Board members selected one of the fol-lowing four numbers to reflect how im-portant they thought each process is indriving improvement in each CTQ re-quirement: 0 (no importance), 1 (minimalimportance), 3 (medium importance), and9 (high importance). The number wasrecorded in the cell of the matrix that cor-responds to the intersection of the specificprocess and the specific CTQ requirement.
3. The value in each cell was then multipliedby the weighting factor of its respectiveCTQ requirement (from the first column)to yield a weighted score.
4. All the weighted scores in a process’s col-umn were summed and recorded in thelast row of the matrix to produce a totalscore for each process.
Through this exercise, Amdell’s board of di-rectors gave Performance Management the high-est score (1,989) and Quality of Leadership thesecond highest score (1,917), establishing themas the two most important processes for satisfyingthe accountability CTQs. Interestingly, FinancialPerformance was rated the lowest (1,017) of allsix processes by the board. Although some mem-bers of the project team had initially believed thatmanaging financial results was a key driver of ac-countability, the “customer” most likely saw it asmore an outcome than a driver.
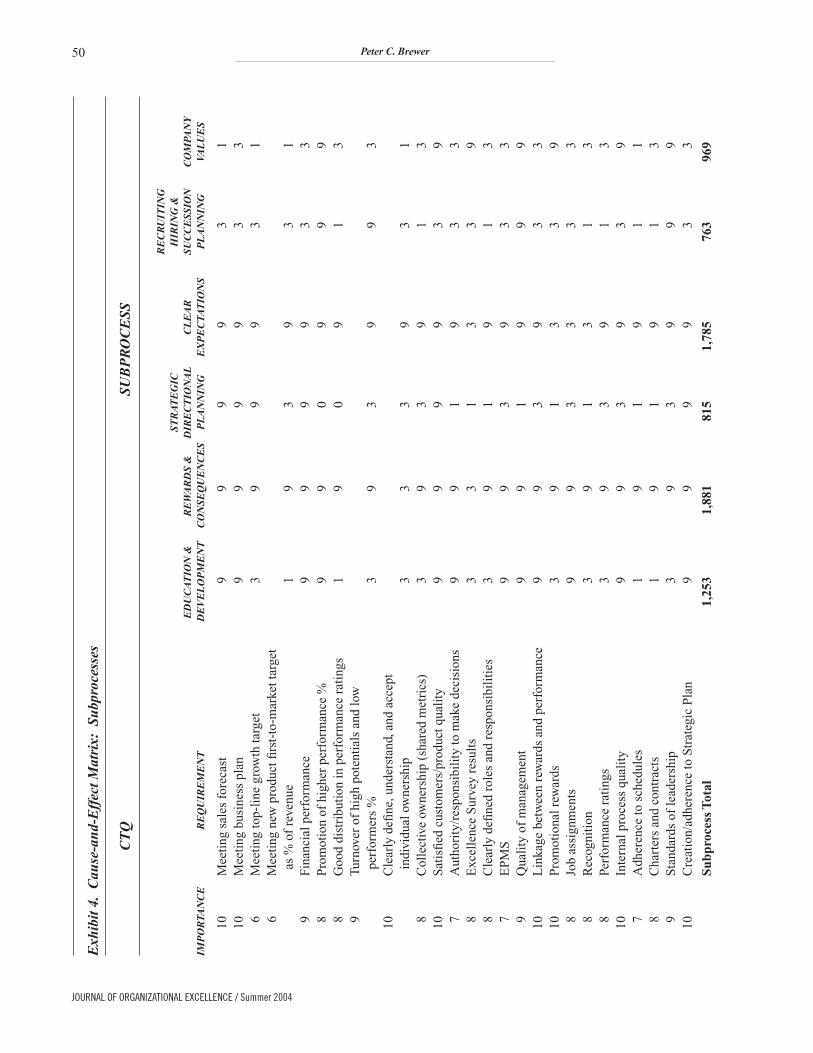
To further refine the meaning of the top-ratedprocesses, the project team broke down Perfor-mance Management and Quality of Leadershipinto six component processes for the board of di-rectors to assess in a second cause-and-effect ma-trix, shown in Exhibit 4. Although Rewards andConsequences was not among the highest scor-ing processes in Exhibit 3, the project team felt
Exhibit 2. Critical-to-Quality Tree

Six Sigma Helps a Company Create a Culture of Accountability
JOURNAL OF ORGANIZATIONAL EXCELLENCE / Summer 2004
49
Exh
ibit
3.
Cau
se-a
nd-
Eff
ect M
atri
x:P
roce
sses
CT
QP
RO
CE
SS
FIN
AN
CIA
LP
ER
FO
RM
AN
CE
RE
WA
RD
S &
QU
AL
ITY
OF
IMP
OR
TAN
CE
RE
QU
IRE
ME
NT
PE
RF
OR
MA
NC
EM
AN
AG
EM
EN
TO
WN
ER
SH
IPC
ON
SE
QU
EN
CE
SC
OM
MIT
ME
NT
LE
AD
ER
SH
IP
10M
eeti
ng s
ales
for
ecas
t9
99
99
910
Mee
ting
bus
ines
s pl
an9
99
99
96
Mee
ting
top-
line
gro
wth
targ
et3
93
93
36
Mee
ting
new
pro
duct
firs
t-to
-mar
ket t
arge
t as
% o
f re
venu
e3
93
93
39
Fina
ncia
l per
form
ance
99
99
99
8P
rom
otio
n of
hig
her
perf
orm
ance
%3
93
91
98
Goo
d di
stri
buti
on in
per
form
ance
rat
ings
09
19
39
9Tu
rnov
er o
f hi
gh p
oten
tial
s an
d lo
w
perf
orm
ers
%3
93
90
910
Cle
arly
defi
ne, u
nder
stan
d, a
nd a
ccep
t in
divi
dual
ow
ners
hip
09
93
99
8C
olle
ctiv
e ow
ners
hip
(sha
red
met
rics
)3
99
99
910
Sat
isfi
ed c
usto
mer
s/pr
oduc
t qua
lity
99
99
99
7A
utho
rity
/res
pons
ibil
ity
to m
ake
deci
sion
s3
99
99
98
Exc
elle
nce
Sur
vey
resu
lts
09
03
99
8C
lear
ly d
efine
d ro
les
and
resp
onsi
bili
ties
09
99
99
7E
PM
S3
99
99
99
Qua
lity
of
man
agem
ent
99
39
99
10L
inka
ge b
etw
een
rew
ards
and
per
form
ance
99
39
99
10P
rom
otio
nal r
ewar
ds3
93
99
98
Job
assi
gnm
ents
39
39
99
8R
ecog
niti
on3
93
99
98
Perf
orm
ance
rat
ings
99
39
99
10In
tern
al p
roce
ss q
uali
ty3
99
39
97
Adh
eren
ce to
sch
edul
es
39
99
99
8C
hart
ers
and
cont
ract
s3
99
99
99
Sta
ndar
ds o
f le
ader
ship
39
99
99
10C
reat
ion/
adhe
renc
e to
Str
ateg
ic P
lan
99
93
99
Pro
cess
Tot
al1,
017
1,98
91,
361
1,76
11,
724
1,91
7
JOURNAL OF ORGANIZATIONAL EXCELLENCE / Summer 2004
50 Peter C. Brewer
Exh
ibit
4.
Cau
se-a
nd-
Eff
ect M
atri
x:S
ubp
roce
sses
CT
QS
UB
PR
OC
ES
S
RE
CR
UIT
ING
ST
RA
TE
GIC
HIR
ING
&E
DU
CA
TIO
N &
RE
WA
RD
S &
DIR
EC
TIO
NA
LC
LE
AR
SU
CC
ES
SIO
NC
OM
PAN
Y
IMP
OR
TAN
CE
RE
QU
IRE
ME
NT
DE
VE
LO
PM
EN
TC
ON
SE
QU
EN
CE
SP
LA
NN
ING
EX
PE
CTA
TIO
NS
PL
AN
NIN
GVA
LU
ES
10M
eeti
ng s
ales
for
ecas
t9
99
93
110
Mee
ting
bus
ines
s pl
an9
99
93
36
Mee
ting
top-
line
gro
wth
targ
et3
99
93
16
Mee
ting
new
pro
duct
firs
t-to
-mar
ket t
arge
t as
% o
f re
venu
e1
93
93
19
Fina
ncia
l per
form
ance
99
99
33
8P
rom
otio
n of
hig
her
perf
orm
ance
%9
90
99
98
Goo
d di
stri
buti
on in
per
form
ance
rat
ings
19
09
13
9Tu
rnov
er o
f hi
gh p
oten
tial
s an
d lo
w
perf
orm
ers
%3
93
99
310
Cle
arly
defi
ne, u
nder
stan
d, a
nd a
ccep
t in
divi
dual
ow
ners
hip
33
39
31
8C
olle
ctiv
e ow
ners
hip
(sha
red
met
rics
)3
93
91
310
Sat
isfi
ed c
usto
mer
s/pr
oduc
t qua
lity
99
99
39
7A
utho
rity
/res
pons
ibil
ity
to m
ake
deci
sion
s9
91
93
38
Exc
elle
nce
Sur
vey
resu
lts
33
13
39
8C
lear
ly d
efine
d ro
les
and
resp
onsi
bili
ties
39
19
13
7E
PM
S9
93
93
39
Qua
lity
of
man
agem
ent
99
19
99
10L
inka
ge b
etw
een
rew
ards
and
per
form
ance
99
39
33
10P
rom
otio
nal r
ewar
ds3
91
33
98
Job
assi
gnm
ents
99
33
33
8R
ecog
niti
on3
91
31
38
Perf
orm
ance
rat
ings
39
39
13
10In
tern
al p
roce
ss q
uali
ty9
93
93
97
Adh
eren
ce to
sch
edul
es
19
19
11
8C
hart
ers
and
cont
ract
s1
91
91
39
Sta
ndar
ds o
f le
ader
ship
39
39
99
10C
reat
ion/
adhe
renc
e to
Str
ateg
ic P
lan
99
99
33
Subp
roce
ss T
otal
1,25
31,
881
815
1,78
576
396
9

Six Sigma Helps a Company Create a Culture of Accountability
JOURNAL OF ORGANIZATIONAL EXCELLENCE / Summer 2004
51
derstanding of the Clear Expectations and the Re-wards and Consequences processes, and (2) itmeasured key aspects of the two processes in orderto establish a baseline assessment of their currenteffectiveness. The baseline assessment often cre-ates a sense of urgency regarding the need to im-prove, and it provides a reference point for quan-tifying the extent of future improvements.
A SIPOC Diagram for Rewards and Conse-quences. The project team created a SIPOC (Sup-pliers, Inputs, Process, Outputs, and Customer)diagram for the two processes under study. Byway of example, the SIPOC diagram for the Re-wards and Consequences process is shown in Ex-hibit 5. Although the SIPOC diagram for the ClearExpectations process has not been included here,it is important to note that this process precedesRewards and Consequences and thus acts uponelements shown in Exhibit 5—e.g., each supplierto Rewards and Consequences should share clearlyaligned expectations.
that it should be considered a component of Per-formance Management and thus included in thesecond matrix. Indeed, in this second assessment,the board of directors identified Rewards and Con-sequences (score � 1,881) and Clear Expecta-tions (score � 1,785) as the two most importantcomponent processes for a COA.
While all the processes assessed in Exhibits 3and 4 could potentially improve Amdell’s COA,the Define Stage of the DMAIC framework es-tablished a customer-driven prioritization. Thisdistilled the somewhat nebulous concept of COAinto an actionable equation: Clear Expectations �Rewards and Consequences � Accountability.This result would set the focus for the culturechange efforts to follow.
THE MEASURE STAGE
The Measure Stage proceeded in two steps: (1)the project team developed a more detailed un-
Exhibit 5. SIPOC Diagram: Rewards and Consequences

JOURNAL OF ORGANIZATIONAL EXCELLENCE / Summer 2004
52 Peter C. Brewer
Suppliers and Inputs. The Suppliers and Inputscolumns of Exhibit 5 depict three key relationships:
• Amdell’s parent company supplies two im-portant inputs: (1) the high-level financialbudget for the forthcoming period, whichprovides a target or benchmark for judg-ing actual performance, and (2) an allo-cation of resources for training, which isnecessary if employees are to be held ac-countable for their performance.
• External customers, other employees, andeach individual achieve (supply) the indi-vidual and collective business results.Comparison of these actual results withthe budget—i.e., to assess performance—is important input to the determination ofrewards and consequences.
• Each individual and his or her immediatesupervisor supply information needed forthree Amdell programs that are importantinputs because they directly link results tohow employees are evaluated, rewarded,and promoted:
• The Employee Performance Manage-ment System (EPMS) documents mu-tually agreed-upon goals for the forth-coming year and actual performancerelative to those goals.
• The Salary Planning Tool establishesstandards that equalize salary rangeswithin job levels across departmentsand provides parameters that enableemployees to understand how their payraises are determined.
• The Succession Planning Tool ensuresthat employees receive appropriate train-ing commensurate with their level ofresponsibility, which justifies holdingthem accountable for their performance.
Process. The Process column in Exhibit 5shows six steps that constitute a detailed process
map for Rewards and Consequences, which be-gins after clear expectations have been establishedthrough the other COA process under study:
1. Information feedback requires gatheringall relevant information regarding thebudget, actual results, and the mutuallyagreed-upon information from the EPMS,the Salary Planning Tool, and the Succes-sion Planning Tool.
2. The immediate supervisor compiles theinformation from Step 1.
3. The supervisor makes a judgment regard-ing the subordinate’s performance.
4. The supervisor seeks approval of this judg-ment from his or her boss.
5. The supervisor communicates the feed-back and associated consequences to thesubordinate.
6. The subordinate can accept the feedback,and then receive the associated conse-quences, or reject the feedback, therebyinitiating another loop through the Re-wards and Consequences process.
Outputs. The project team identified five keyoutputs in the Rewards and ConsequencesSIPOC diagram:
1. Supervisors assign each subordinate a per-formance rating.
2. The positive or negative feedback is sharedwith the subordinate.
3. The consequences manifest themselvesin the form of each subordinate’s com-pensation, future job assignments, andpromotions.
4. The effectiveness of the Rewards and Con-sequences process drives each employee’slevel of job satisfaction.
5. The process’s effectiveness ultimately in-fluences the level of business performance.
Customers. Three customers—beneficiariesof the Rewards and Consequences process—were identified in the SIPOC diagram: Amdell’sboard of directors, all Amdell employees, andAmdell stockholders.
Baseline Assessment. Using the measurableinputs and outputs highlighted in the SIPOC dia-
External customers, other employees,and each individual achieve (supply) the
individual and collective business results.
Six Sigma Helps a Company Create a Culture of Accountability
JOURNAL OF ORGANIZATIONAL EXCELLENCE / Summer 2004
53
• Superiors and subordinates did not clearlyarticulate the relative importance of de-fined performance goals.
• Employees lacked a unified understand-ing of the organization’s most importantstrategic goals.
Written comments also spotlighted problemswith the output side of both processes:
• Performance ratings and pay raises did notadequately discriminate between strongand weak performers.
• Performance was not reviewed oftenenough.
• The annual bonus was not linked to strate-gic objectives.
In addition to the survey, the project teamgleaned one additional piece of baseline datafrom the earlier consultant’s report that had rec-ommended a stronger COA. The report foundthat 35 percent of Amdell’s divisional objectiveswere not aligned with the company’s overallstrategic objectives—a clear problem on the out-put side of the Clear Expectations process.
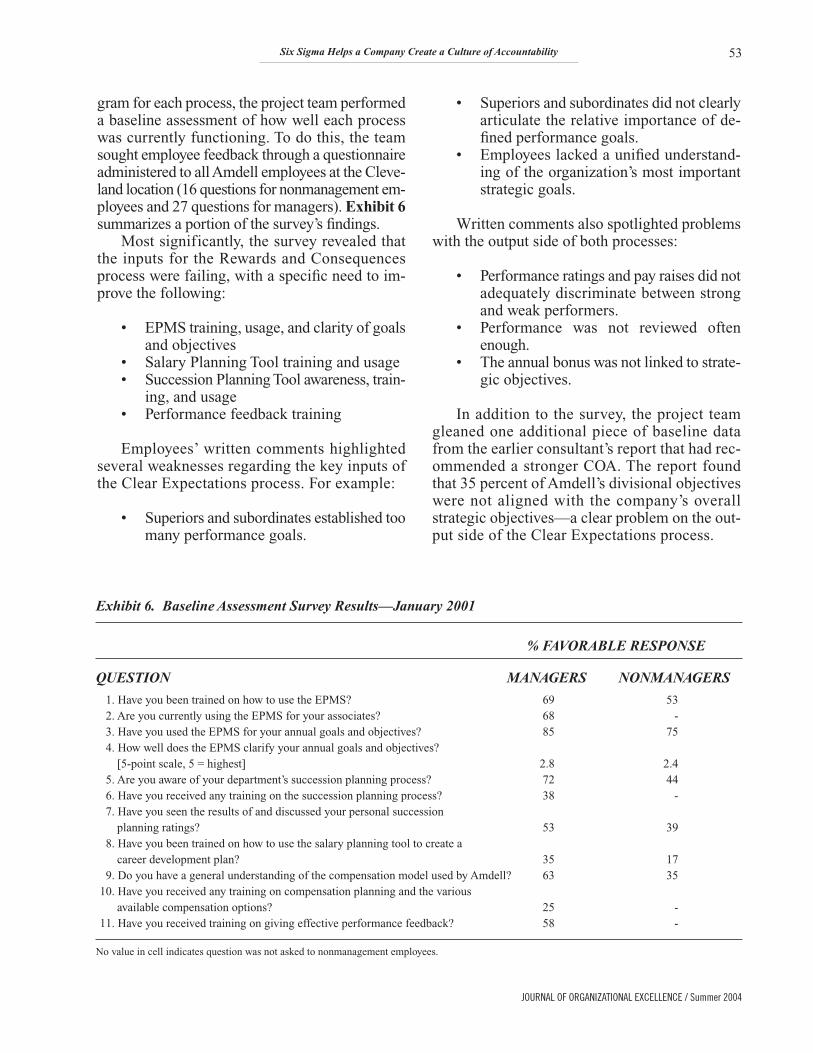
gram for each process, the project team performeda baseline assessment of how well each processwas currently functioning. To do this, the teamsought employee feedback through a questionnaireadministered to all Amdell employees at the Cleve-land location (16 questions for nonmanagement em-ployees and 27 questions for managers). Exhibit 6summarizes a portion of the survey’s findings.
Most significantly, the survey revealed thatthe inputs for the Rewards and Consequencesprocess were failing, with a specific need to im-prove the following:
• EPMS training, usage, and clarity of goalsand objectives
• Salary Planning Tool training and usage• Succession Planning Tool awareness, train-
ing, and usage• Performance feedback training
Employees’ written comments highlightedseveral weaknesses regarding the key inputs ofthe Clear Expectations process. For example:
• Superiors and subordinates established toomany performance goals.
Exhibit 6. Baseline Assessment Survey Results—January 2001
% FAVORABLE RESPONSE
QUESTION MANAGERS NONMANAGERS
1. Have you been trained on how to use the EPMS? 69 532. Are you currently using the EPMS for your associates? 68 -3. Have you used the EPMS for your annual goals and objectives? 85 754. How well does the EPMS clarify your annual goals and objectives?
[5-point scale, 5 = highest] 2.8 2.45. Are you aware of your department’s succession planning process? 72 446. Have you received any training on the succession planning process? 38 -7. Have you seen the results of and discussed your personal succession
planning ratings? 53 398. Have you been trained on how to use the salary planning tool to create a
career development plan? 35 179. Do you have a general understanding of the compensation model used by Amdell? 63 35
10. Have you received any training on compensation planning and the various available compensation options? 25 -
11. Have you received training on giving effective performance feedback? 58 -
No value in cell indicates question was not asked to nonmanagement employees.

JOURNAL OF ORGANIZATIONAL EXCELLENCE / Summer 2004
54 Peter C. Brewer
The baseline data thus pointed to numerousopportunities for improvements in the Clear Ex-pectations and the Rewards and Consequencesprocesses, but in the opinion of the project team,it was unlikely that all the issues could be suc-cessfully addressed simultaneously. Accordingly,the team narrowed its scope to what it saw as thetwo most critical issues:
• The lack of strategic alignment (in theClear Expectations process)
• The weaknesses with the EPMS (in theRewards and Consequences process)
The project team would tackle the other is-sues later.
THE ANALYZE STAGE
To understand the extent of the deficiencies in thetwo areas selected in the Measure Stage, the proj-ect team conducted a gap analysis between thecurrent (“as is”) and the desired state. The gapanalysis done on strategic alignment is presentedhere to illustrate the team’s approach.
Exhibit 7 shows the “as is” process map forAmdell’s existing method of communicating itsstrategic vision and aligning its employees’ ef-forts with that vision. The project team concludedthat this approach suffered from three weaknesses:
• Although all employees learn of the Strate-gic Plan at an annual off-site “state of the
company” meeting, there was no feedbackmechanism to verify that divisional, de-partmental, and individual goals thatemerged from the “as is” process werealigned with the priorities reflected in thecompany’s Strategic Plan. Thus, vice pres-idents and departmental managers couldestablish goals that, while seemingly im-portant from a functional perspective, werenot important or optimal from a compa-nywide strategic perspective.
• With no prioritization mechanism in the“as is” approach, an employee with bothstrategically aligned goals and function-ally aligned goals would be more likely tofocus on the functional goals because theywere consistent with the immediate su-pervisor’s agenda.
• The board of directors’ strategic visionwas not supported by specific measuresthat clarified the most important im-provement targets.
The project team designed a new process—the desired state—shown in Exhibit 8. Thisprocess cascades the strategic goals down fromthe board of directors to the divisions, depart-ments, and individuals in a sequential manner. Inaddition to the development of goals and objec-tives, the new process requires that the divisions,departments, and individuals also define measures,prioritize the goals and objectives, and verify theiralignment with the strategic direction and mea-
Exhibit 7. Strategic Alignment: “As Is” Process Map

Six Sigma Helps a Company Create a Culture of Accountability
JOURNAL OF ORGANIZATIONAL EXCELLENCE / Summer 2004
55
• Create a new performance measurementsystem that aligned everyone’s prioritieswith the strategic goals of the company.
• Redesign the EPMS so that it held em-ployees accountable for supporting thestrategic goals of the company.
sures in the board of directors’ business plan, withdiscrete feedback steps to assure this happens.
The project team realized that to fully imple-ment this revised process would require two newsolutions, which became the focus for the nextstage of the project:
Exhibit 8. Strategic Alignment: Recommended Process Design
JOURNAL OF ORGANIZATIONAL EXCELLENCE / Summer 2004
56 Peter C. Brewer
THE IMPROVE STAGE
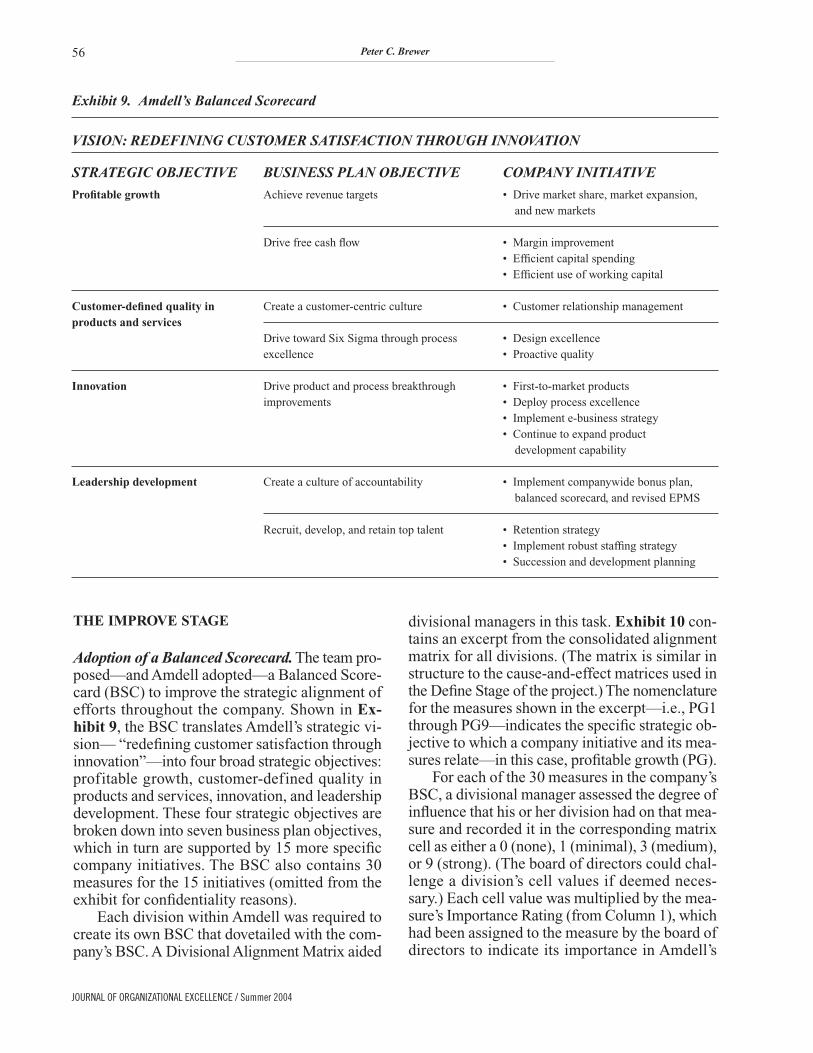
Adoption of a Balanced Scorecard. The team pro-posed—and Amdell adopted—a Balanced Score-card (BSC) to improve the strategic alignment ofefforts throughout the company. Shown in Ex-hibit 9, the BSC translates Amdell’s strategic vi-sion— “redefining customer satisfaction throughinnovation”—into four broad strategic objectives:profitable growth, customer-defined quality inproducts and services, innovation, and leadershipdevelopment. These four strategic objectives arebroken down into seven business plan objectives,which in turn are supported by 15 more specificcompany initiatives. The BSC also contains 30measures for the 15 initiatives (omitted from theexhibit for confidentiality reasons).
Each division within Amdell was required tocreate its own BSC that dovetailed with the com-pany’s BSC. A Divisional Alignment Matrix aided
divisional managers in this task. Exhibit 10 con-tains an excerpt from the consolidated alignmentmatrix for all divisions. (The matrix is similar instructure to the cause-and-effect matrices used inthe Define Stage of the project.) The nomenclaturefor the measures shown in the excerpt—i.e., PG1through PG9—indicates the specific strategic ob-jective to which a company initiative and its mea-sures relate—in this case, profitable growth (PG).
For each of the 30 measures in the company’sBSC, a divisional manager assessed the degree ofinfluence that his or her division had on that mea-sure and recorded it in the corresponding matrixcell as either a 0 (none), 1 (minimal), 3 (medium),or 9 (strong). (The board of directors could chal-lenge a division’s cell values if deemed neces-sary.) Each cell value was multiplied by the mea-sure’s Importance Rating (from Column 1), whichhad been assigned to the measure by the board ofdirectors to indicate its importance in Amdell’s
Exhibit 9. Amdell’s Balanced Scorecard
VISION: REDEFINING CUSTOMER SATISFACTION THROUGH INNOVATION
STRATEGIC OBJECTIVE BUSINESS PLAN OBJECTIVE COMPANY INITIATIVE
Profitable growth Achieve revenue targets • Drive market share, market expansion, and new markets
Drive free cash flow • Margin improvement• Efficient capital spending• Efficient use of working capital
Customer-defined quality in Create a customer-centric culture • Customer relationship managementproducts and services
Drive toward Six Sigma through process • Design excellenceexcellence • Proactive quality
Innovation Drive product and process breakthrough • First-to-market productsimprovements • Deploy process excellence
• Implement e-business strategy• Continue to expand product
development capability
Leadership development Create a culture of accountability • Implement companywide bonus plan, balanced scorecard, and revised EPMS
Recruit, develop, and retain top talent • Retention strategy• Implement robust staffing strategy• Succession and development planning

Six Sigma Helps a Company Create a Culture of Accountability
JOURNAL OF ORGANIZATIONAL EXCELLENCE / Summer 2004
57
that superiors and subordinates were es-tablishing too many goals and that 35 per-cent of those goals were not strategicallyaligned. Fewer goals would sharpen eachemployee’s focus on strategic priorities.)
• Each goal documented on an individual’sEPMS had to support a strategic objec-tive from the Amdell BSC. Individual ordepartmental goals not tied to the BSCwere forbidden.
• The EPMS evaluation time frame wasreduced from one year to quarterly,which required each supervisor and sub-ordinate to sign off on quarterly perfor-mance reviews.
• The EPMS’s 5-point performance ratingscale was expanded to a 9-point scale.(The baseline data indicated that morethan 95 percent of employees were ratedeither a “3” or “4” on a 5-point scale. Anexpanded 9-point scale—coupled withadditional performance feedback train-ing—would enable greater discrimina-tion among employees’ performance.)
BSC. The product of the two values indicated therelative priority of that measure for that division.The highest priority for a division was any mea-sure with a score of 90—i.e., the highest Influ-ence Rating of 9 and the highest Importance Rat-ing of 10; its importance to the company’s strategicobjectives and the strong influence the divisionhad on the measure signaled that it should be acritical component of the division’s own BSC.
Each division’s BSC was cascaded down toits departments and to individuals, in the sensethat each employee’s goals as stated in the EPMShad to be connected to Amdell’s BSC. Further-more, the annual employee bonus plan was con-nected to a subset of six to ten measures from thecompany’s BSC.
Modification of the EPMS. The project teammade five primary changes to the Employee Per-formance Management System (EPMS) to ad-dress the problems identified in the Measure Stage:
• The number of an individual’s EPMSgoals was reduced from 15 to 5. (The base-line data from the Measure Stage revealed
Exhibit 10. Simple Divisional Alignment Matrix

JOURNAL OF ORGANIZATIONAL EXCELLENCE / Summer 2004
58 Peter C. Brewer
• Amdell committed additional resources totraining its managers how to give con-structive performance feedback.
THE CONTROL STAGE
Subsequent to the changes made in the ImproveStage, Amdell developed a three-part strategy toinstitutionalize the BSC and the new version of theEPMS and to implement monitoring plans that pre-vent reverting to old practices. As the first and mostimportant element of this strategy, the Amdell pres-ident now frames her communication to Amdellemployees about the progress of the company interms of the four pillars—strategic objectives—ofthe Balanced Scorecard. Furthermore, she clearlycommunicates the importance of linking each em-ployee’s EPMS goals to the BSC.
The Finance Department now maintains adashboard of BSC metrics that is electronicallyavailable to all employees. The message from thepresident, coupled with the visibility of the dash-
board, ensures that the BSC becomes the languageof the organization.
As the third leg of the Control Stage strat-egy, the Human Resources Department now an-nually administers what Amdell calls its Excel-lence Survey. The questions in the survey aredesigned to gauge employee perceptions aboutthe policies, processes, and practices that shouldsupport a culture of accountability. By monitor-ing survey results and taking action where im-provement is needed, Amdell ensures that it con-tinuously improves upon its COA rather thanreverting to prior patterns and practices.
CONCLUSION
Nine months after its baseline assessment surveyand four months after the changes were made inthe Improve Stage, Amdell again conducted thesurvey first used for the baseline assessment. Theresults of the two surveys are compared in Exhibit11. There were significant improvements in both
Exhibit 11. Follow-Up Survey Results Compared with Baseline Assessment
% FAVORABLE RESPONSE
MANAGERS NONMANAGERS
QUESTION JAN 2001 OCT 2001 JAN 2001 OCT 2001
1. Have you been trained on how to use the EPMS? 69 90 53 832. Are you currently using the EPMS for your associates? 68 86 - -3. Have you used the EPMS for your annual goals
and objectives? 85 97 75 954. How well does the EPMS clarify your annual goals
and objectives? [5-point scale, 5 = highest] 2.8 3.5 2.4 3.25. Are you aware of your department’s succession
planning process? 72 80 44 606. Have you received any training on the succession
planning process? 38 55 - -7. Have you seen the results of and discussed your
personal succession planning ratings? 53 52 39 398. Have you been trained on how to use the salary
planning tool to create a career development plan? 35 44 17 329. Do you have a general understanding of the
compensation model used by Amdell? 63 65 35 4310. Have you received any training on compensation
planning and the various available compensation options? 25 32 - -
11. Have you received training on giving effective performance feedback? 58 73 - -
No value in cell indicates question was not asked to nonmanagement employees.

Six Sigma Helps a Company Create a Culture of Accountability
JOURNAL OF ORGANIZATIONAL EXCELLENCE / Summer 2004
59
Managers are better able to award pay andpromotions that more closely reflect em-ployees’ actual levels of performance andcontributions to the company, which inturn motivates employees to sustain goodperformance where it already exists andimprove performance where it is needed.
• The more frequent quarterly EPMS reviews(rather than annual reviews) with supervi-sor/subordinate sign-offs increase each em-ployee’s understanding of how his or herperformance supports the strategic goalsof the company. More frequent and targetedfeedback reinforces behavioral change. Thisalso provides a richer source of feedbackdata that can be used to more finely dis-criminate between strong and weak per-formance, which enables more targeted andequitable use of rewards and consequences.
With the aid of the Six Sigma DMAIC frame-work and tools, Amdell clarified the nature of itsproblems with accountability, focused its effortsin the most productive directions, and configuredand implemented solutions that will sustain pos-itive change into the future. Six Sigma principlesthus proved very useful to Amdell in making twoqualitative processes more effective in order tocreate a stronger culture of accountability.Amdell’s experience demonstrates that Six Sigmacan be used effectively in nonmanufacturing,highly qualitative contexts. For organizations thathave had to rely upon anecdotal opinions and po-litical influence to drive qualitative strategicchanges, Six Sigma holds promise for lending thecustomer’s voice, as well as structure and objec-tivity, to these types of management challenges. �
the managers’and nonmanagers’perceptions aboutthe EPMS (Questions 1–4 and 11)—a main areaof the COA project focus—including wider use ofthe EPMS for goal setting and greater clarity aboutgoals. Future efforts of the COA project team willaddress issues related to salary planning and ca-reer development (Questions 7–10).
The use of Six Sigma led to the implementa-tion of a Balanced Scorecard and revisions to theEmployee Performance Management System,which were significant improvements to the twoprocesses at Amdell most important for a COA—Clear Expectations and Rewards and Conse-quences. These changes supported a stronger cul-ture of accountability in five ways:
• The BSC clarifies and communicatesAmdell’s performance expectations to allof its employees.
• The revised EPMS requires each employeeto prioritize and be held accountable forfive performance goals that are linked tothe BSC, thereby directing employee ef-forts toward those areas most likely to pro-duce good business performance and long-term success for the company.
• Six to ten measures from the BSC are usedto determine the bonus pool for all Amdellemployees, thereby forging a direct linkbetween a significant reward for employ-ees and the achievement of results impor-tant to the company.
• The revised 9-point EPMS grading scale,coupled with the investment in construc-tive feedback training, improves Amdellmanagers’ ability to discriminate betweenstrong, average, and weak performers.
ADDITIONAL RESOURCESHammer, M. (2002). Process management and the future of Six Sigma. MIT Sloan Management Review, Winter, 26–32.