
A domain-specific risk-attitude scale: measuring risk...
28
Journal of Behavioral Decision Making J. Behav. Dec. Making, 15: 263–290 (2002) Published online in Wiley InterScience 1 August 2002 (www.interscience.wiley.com) DOI: 10.1002/bdm.414 A Domain-specific Risk-attitude Scale: Measuring Risk Perceptions and Risk Behaviors ELKE U. WEBER, 1 * ANN-RENE ´ E BLAIS 2 and NANCY E. BETZ 3 1 Columbia University, USA 2 Center for Interuniversity Research and Analysis on Organizations, Montreal, Quebec, Canada 3 The Ohio State University, USA ABSTRACT We present a psychometric scale that assesses risk taking in five content domains: financial decisions (separately for investing versus gambling), health/safety, recrea- tional, ethical, and social decisions. Respondents rate the likelihood that they would engage in domain-specific risky activities (Part I). An optional Part II assesses respon- dents’ perceptions of the magnitude of the risks and expected benefits of the activities judged in Part I. The scale’s construct validity and consistency is evaluated for a sample of American undergraduate students. As expected, respondents’ degree of risk taking was highly domain-specific, i.e. not consistently risk-averse or consistently risk- seeking across all content domains. Women appeared to be more risk-averse in all domains except social risk. A regression of risk taking (likelihood of engaging in the risky activity) on expected benefits and perceived risks suggests that gender and content domain differences in apparent risk taking are associated with differences in the per- ception of the activities’ benefits and risk, rather than with differences in attitude towards perceived risk. Copyright # 2002 John Wiley & Sons, Ltd. key words risk-taking; risk-perception; risk attitude; gender differences; content specificity There is great need for a scale that assesses individual differences in attitude towards risk. It is obvious that people differ in the way they resolve work-related or personal decisions that involve risk and uncertainty. Such differences are often described or explained by differences in risk attitude. In many situations people are selected based on their purported risk attitudes. Startup companies may look for risk-loving new employ- ees when expanding their payroll. Investment advisors may be assigned to important clients based on a Copyright # 2002 John Wiley & Sons, Ltd. *Correspondence to: Professor Elke U. Weber, Columbia University, USA. E-mail: [email protected] Contract/grant sponsor: John D. and Catherine T. MacArthur Foundation. Contract/grant sponsor: NSF. Contract/grant number: SES-0079664.
-
Upload
hoangduong -
Category
Documents
-
view
218 -
download
0
Transcript of A domain-specific risk-attitude scale: measuring risk...

Journal of Behavioral Decision Making
J. Behav. Dec. Making, 15: 263–290 (2002)
Published online in Wiley InterScience 1 August 2002
(www.interscience.wiley.com) DOI: 10.1002/bdm.414
A Domain-specific Risk-attitude Scale:Measuring Risk Perceptions and RiskBehaviors
ELKE U. WEBER,1* ANN-RENEE BLAIS2 and NANCY E. BETZ3
1ColumbiaUniversity, USA2Center for InteruniversityResearchandAnalysis onOrganizations,Montreal,Quebec, Canada3TheOhio StateUniversity, USA
ABSTRACT
We present a psychometric scale that assesses risk taking in five content domains:financial decisions (separately for investing versus gambling), health/safety, recrea-tional, ethical, and social decisions. Respondents rate the likelihood that they wouldengage in domain-specific risky activities (Part I). An optional Part II assesses respon-dents’ perceptions of the magnitude of the risks and expected benefits of the activitiesjudged in Part I. The scale’s construct validity and consistency is evaluated for a sampleof American undergraduate students. As expected, respondents’ degree of risk takingwas highly domain-specific, i.e. not consistently risk-averse or consistently risk-seeking across all content domains. Women appeared to be more risk-averse in alldomains except social risk. A regression of risk taking (likelihood of engaging in therisky activity) on expected benefits and perceived risks suggests that gender and contentdomain differences in apparent risk taking are associated with differences in the per-ception of the activities’ benefits and risk, rather than with differences in attitudetowards perceived risk. Copyright # 2002 John Wiley & Sons, Ltd.
key words risk-taking; risk-perception; risk attitude; gender differences; content
specificity
There is great need for a scale that assesses individual differences in attitude towards risk. It is obvious that
people differ in the way they resolve work-related or personal decisions that involve risk and uncertainty.
Such differences are often described or explained by differences in risk attitude. In many situations people
are selected based on their purported risk attitudes. Startup companies may look for risk-loving new employ-
ees when expanding their payroll. Investment advisors may be assigned to important clients based on a
Copyright # 2002 John Wiley & Sons, Ltd.
* Correspondence to: Professor Elke U. Weber, Columbia University, USA. E-mail: [email protected]
Contract/grant sponsor: John D. and Catherine T. MacArthur Foundation.Contract/grant sponsor: NSF.Contract/grant number: SES-0079664.

match in risk attitude. Existing measures of individual differences in risk attitude have proven unsatisfactory,
however, for reasons that are reviewed below. The paper presents an assessment scale designed to improve on
the shortcomings of existing approaches in two ways. First, our risk-attitude scale distinguishes between two
psychological variables (risk perception and attitude towards perceived risk) that have been confounded in
previous risk-attitude indices and instruments implicitly or explicitly grounded in expected utility theory
(Weber, 2001a,b). Second, our scale examines risk-taking and its determinants in several distinct content
areas. Our tests of the scale and the theoretical (risk–return) model that underlies it confirm that risk-taking
is indeed content-specific and that domain as well as gender differences in risk-taking are as much (or more)
a function of differences in risk perception than of differences in attitude towards perceived risk.
RISK ATTITUDE WITHIN AN EXPECTED UTILITY FRAMEWORK
In the expected utility (EU) framework and its variants including prospect theory (Kahneman and Tversky,
1979), risk attitude is nothing more than a descriptive label for the shape of the utility function presumed to
underlie a person’s choices. A person’s risk attitude describes the shape of his or her utility function (derived
from a series of risky choices) for the outcomes in question. A commonly used metric of risk attitude is
defined as �u00(x)/u0(x), where u0 and u00 denote the first and second derivatives of the utility function u,
respectively (Arrow, 1971; Pratt, 1964). The terms ‘risk averse’ and ‘risk seeking’ within the EU framework
technically refer only to the curvature of the utility function. Yet, ‘those who coined the term risk aversion
had in mind the psychological interpretation that someone who prefers the EV of a gamble over playing the
gamble does not like to take risks’ (von Winterfeldt and Edwards, 1986, p. 256) which has a wide degree of
currency among researchers and the general public. Risk attitude, a person’s standing on the continuum from
risk aversion to risk seeking, is commonly considered to be a personality trait, and greater risk taking is
sometimes found to be associated with greater personal and corporate success (MacCrimmon and Wehrung,
1990).
Two problems have marred the notion of risk attitudes in the EU-sense as a personality trait. Different
methods of measuring people’s utility have been shown to result in different classifications (Slovic,
1964). The certainty-equivalent method, for example, results in utility function with more extreme risk atti-
tudes (more risk aversion for gains, more risk seeking for losses) than the probability equivalence method.
Furthermore, individuals do not appear to be consistently risk seeking or risk averse across different domains
and situations even when using the same assessment method, as documented in both laboratory studies
(Schoemaker, 1990) and managerial contexts. MacCrimmon and Wehrung (1986, 1990) found, for example,
that managers appear to have different risk attitudes when making decisions involving personal versus com-
pany money or when evaluating financial versus recreational risks.
Dyer and Sarin (1982) introduced the notion of relative risk-attitude in an attempt to identify a component
of risk taking that had cross-situational stability for a particular individual. Their framework separates dif-
ferences in marginal value for the outcomes of risky choices from attitude towards uncertainty, two factors
that are confounded within the EU framework. They hypothesized that domain differences in apparent risk
attitude (inferred from the shape of the utility function) might be the result of differences in marginal value
for outcomes in different domains (e.g. decreasing marginal value for money, but increasing marginal
value for time). As a result, a person’s relative risk attitude, the curvature of the utility function after marginal
value has been factored out, might still be stable across domains, even though apparent risk taking could
differ. Unfortunately, Keller (1985) and Weber and Milliman (1997) found no evidence of greater cross-
situational stability of relative risk attitude in their empirical tests of the model.
These problems limit the predictive validity of EU-based assessments of risk attitude. Given the volatility
of EU-based assessments, it is not surprising that such measures and scales have not had much success in
predicting people’s choices or behavior in situations or domains outside of those assessed by the instrument
264 Journal of Behavioral Decision Making
Copyright # 2002 John Wiley & Sons, Ltd. Journal of Behavioral Decision Making, 15: 263–290 (2002)

(Bromiley and Curley, 1992). The observed content-specificity of responses suggests, in fact, that responses
should not be combined across content domains. The Choice Dilemma scale by Kogan and Wallach (1964),
for example, asks people for probability equivalents in twelve choice dilemmas from different domains of
life which are then combined into a single score that purports to report a person’s (implicitly content-
independent) risk attitude.1 Despite its obvious problems, the scale is still in use, partly for lack of better
alternatives.
RISK ATTITUDE WITHIN A RISK–RETURN FRAMEWORK
More recently, some researchers have argued that risk attitude is more naturally conceptualized in the risk–
return framework of risky choice used in finance (Sarin and M. Weber, 1993). In this framework, people’s
preference for risky options is assumed to reflect a tradeoff between an option’s expected benefit, usually
equated to expected value (EV), and its riskiness. In finance, riskiness of an option is equated to its variance,
but psychological risk–return models (Weber, 1997, 1998) treat perceived riskiness as a variable that can
differ between individuals and as a function of content and context:
PreferenceðXÞ ¼ aðExpected BenefitðXÞÞ þ bðPerceived RiskðXÞÞ þ c ð1Þ
This decomposition of preference provides for different (and not mutually exclusive) ways in which the
outcome domain can affect people’s choices under risk (Weber and Milliman, 1997). Preferences and thus
choices might differ because the decision maker perceives the risks and returns to be of similar magnitude in
two domains, but likes risk (positive perceived-risk coefficient b) in one domain (e.g. recreational risks) and
dislikes it (negative perceived-risk coefficient b) in the other domain (e.g. financial risks). Alternatively,
choices might differ because the decision maker perceives the risks and benefits to differ in magnitude in
the two domains, while attitude towards perceived risk (coefficient b) is the same for both domains. Mellers,
Schwartz, and Weber (1997) show that the reflection effect (apparent risk aversion for choices between lot-
teries involving gains, but risk seeking for choices between lotteries involving losses) is associated with both
types of processes. Some individuals perceive the risks of lotteries that involve only gains or only losses,
respectively, to be the similar (responding, for example, simply to the variance of outcomes), but have a
negative attitude towards perceived-risk for gains (i.e. are perceived-risk averse) and a positive perceived-
risk attitude for losses (i.e. are perceived-risk seeking). For the majority of individuals, however, the reflec-
tion effect is the result of differences in the perception of the riskiness of different choice alternatives. In the
domain of gains, the lottery is considered the riskier option and is avoided (perceived-risk aversion), whereas
in the domain of losses, the sure loss is considered the riskier option and is avoided (i.e. also perceived-risk
aversion, even though the lottery is selected).
Perceived-risk attitude, a term coined by Weber and Milliman (1997) and operationalized as the risk trade-
off coefficient b within their risk–return framework, refers to the same concept that Yates and Stone (1992)
call ‘risk repugnance’. This label reflects their assumption that ‘pure’ attitude towards risk is always negative
and that apparent evidence to the contrary is always the result of discrepancies between perceptions of risks
or benefits between the decision maker and some objective external observer. Microeconomics shares the
assumption that risk is repugnant to people, who will expect a premium in returns to take on any risk.
The label ‘perceived-risk attitude’ is more neutral and allows at least for the possibility that some people
might, at times, be attracted by perceived risk (Coombs, 1975).
1The aggregation of a linear transformations of probabilities of the favorable risky outcome that makes respondents indifferent betweenthe risky choice and the sure status quo is not only insensitive to domain-specific differences in risk attitude, but also ignores cross-scenario differences in the utilities of outcomes.
E. U. Weber et al. A Domain-specific Risk-attitude Scale 265
Copyright # 2002 John Wiley & Sons, Ltd. Journal of Behavioral Decision Making, 15: 263–290 (2002)

The management literature illustrates the utility of distinguishing between differences in risk perception
and in attitude towards perceived risk. Cooper, Woo, and Dunkelberger (1988) report that, contrary to man-
agerial folklore, the characteristic that differentiates entrepreneurs from other managers is not a greater pre-
ference for risk but instead an overly optimistic perception of the risks involved. For an outside observer who
perceives risks more realistically, entrepreneurs will thus appear to take great risks. However, when differ-
ences in risk perception are factored out, entrepreneurs—just as other managers—demonstrate a preference
for tasks that are only moderate in risk (Brockhaus, 1982). March and Shapira (1987) report that managers
make a strong distinction between gambling (where the odds are exogenously determined and uncontrolla-
ble) and risk taking (where skill or information can reduce uncertainty and risks can be managed). Controll-
ability and manageability (whether realistic or illusory) reduces the perception of the riskiness of the
situation, so that apparently risk-seeking decisions are really driven by the perception that risk is manageable
and hence low.
Empirical investigations have shown systematic individual, group, and cultural differences in perceptions
of the riskiness of risky choice options (Bontempo, Bottom, and Weber, 1997; Weber, 1988; Slovic, 1997)
and greater agreement on expected returns (Siebenmorgen, Weber, and Weber, ‘Communicating asset risk:
How the format of historic volatility information affects risk perceptions and risk decisions’, under review,
2001; Weber, Anderson, and Birnbaum, 1992). Situational differences such as outcome framing have also
been shown to result in differences in perceptions of risk (Schwartz and Hasnain, 2001). Observed differ-
ences in risk perception tend to be in the direction and of the magnitude to account for observed individual
and group differences in risk taking, without requiring any assumptions about differences in attitude towards
risk as it is perceived (Weber, 1998). In other words, after accounting for differences in the perception of the
riskiness of choice alternatives, perceived-risk attitude (the value of coefficient b, i.e. the willingness of
people to select an alternative with a particular level of risk) has shown considerable cross-group and
cross-situational consistency (Weber, 1998). The domain specificity of risk taking (and of risk-attitudes
defined in the EU-sense) thus seems to arise from differences in the perception of the riskiness of
choicealternatives in different content domains. It stems from differences in the definition of what
constitutes or contributes to risk in different types of situations, rather than from differences in true attitude
towards risk.
ATTITUDE–BEHAVIOR RELATIONSHIP
The relationship between attitudes and behavior has been a major topic of investigation in social psychology
(e.g. Eagly and Chaiken, 1993). The best-known model of the relationship is the theory of reasoned action
(Ajzen and Fishbein, 1977) and its elaboration in the theory of planned behavior (Ajzen, 1991). In this
framework, attitudes and subjective norms about a behavior (as well as perceived behavioral control) influ-
ence behavioral intentions which, in turn, determine the likelihood of the behavior occurring. Attitudes
themselves are defined as the rational integration of the expectancies and values put on the outcomes of
the behavior, much like the weighted integration of risks and returns in equation (1) above. Preference
for risky option X in our framework thus corresponds to attitude towards risky option X in the Ajzen and
Fishbein framework. The conceptualization of ‘attitude’ and its relationship to behavior is, however, some-
what different in this paper and in behavioral decision theory (BDT) in general. The risk–return framework
described in equation (1) decomposes preference for option X (or attitude towards option X, in the social
psychological use of the word) more finely and allows for individual differences in the evaluation and inte-
gration of its components. Perceived-risk attitude (the ‘attitude’ in the risk–return framework) refers (only)
to the positive or negative weight assigned to the perceived riskiness of the option when determining its over-
all desirability. Another difference between the risk–return (and BDT) framework and the Ajzen–Fishbein
framework is that the former ignores the two variables—subjective norms about the appropriateness of
266 Journal of Behavioral Decision Making
Copyright # 2002 John Wiley & Sons, Ltd. Journal of Behavioral Decision Making, 15: 263–290 (2002)

behavior and perceived control2—that the theory of planned behavior identifies as determinants of behavior
in addition to ‘attitude’ or overall preference. BDT instead assumes implicitly that behavioral intentions and
behavior are solely a function of a person’s preference for risky option X. This assumption may be too sim-
plistic, as we will show below.
CONTENT-SPECIFIC RISK-PERCEPTION AND RISK-BEHAVIOR SCALES
If risk taking is assessed solely for predictive purposes (e.g. to predict how a person or group will resolve
risky decisions in the future), it may suffice to observe their current behavior in that domain and to describe
such choices (in a shorthand fashion) as risk-seeking or risk-averse in the EU-sense. For prediction purposes,
it is immaterial whether observed behavior is the result of beliefs about the riskiness of the choice situation or
of attitudes towards (perceived) risk. This distinction becomes important, however, when one assesses peo-
ple’s risk-taking with the goal of changing their risk-taking behavior. Intervention requires knowledge of the
processes underlying the behavior. Different interventions promise to be successful, for example, if apparent
risk aversion on part of an individual is the result of his or her unrealistic perception of the riskiness of deci-
sions in this domain than if it is the result of a pathological aversion to taking (even small) perceived risks.
Because both measures of risk attitude have their use, depending on the purpose of the assessment, the psy-
chometric scale described in this paper is designed to measure risk attitude both ways: (1) in the way it is
typically conceived, as a descriptive label of the degree to which an individual appears to avoid or seek out
risky options or behaviors and (2) as attitude towards perceived risk, which takes into consideration indivi-
dual or situational differences in the way risks (and/or benefits) are perceived before labeling a particular
choice or behavior as risk-seeking or risk-averse.
Goldstein and Weber (1997) document a transition from content-independent to content-specific theories
in several areas of cognitive psychology, including memory, learning, and problem solving. BDT is also
starting to show a trend in that direction. Assuming that risk-taking is influenced jointly by the situation
and by characteristics of the decision maker (Bromiley and Curley, 1992), situational differences need to
be considered (controlled for or factored out) before stable individual differences can be seen. Decision
domains between which respondents have shown different degrees of risk-taking include games of
chance/gambling, financial investing, business decisions, and personal decisions (MacCrimmon and
Wehrung, 1986, 1990). Personal decisions can be further broken down into categories that differ in content
and thus in familiarity and controllability, variables known to affect risk perception and risk taking (Slovic
et al., 1986): health/safety decisions (seatbelt usage, smoking), recreational decisions (sky diving versus
bowling), social decisions (confronting coworkers or family members), and ethics decisions (cheating on
exams, terminating a comatose family member’s life support).
GENDER DIFFERENCES IN RISK TAKING
Byrnes, Miller, and Schafer (1999) conducted a meta-analysis of 150 studies comparing risk-taking beha-
viors of men and women in a variety of domains (e.g. financial or health risks) and tasks (e.g. hypothetical
choices or self-reported behaviors). They found that men were taking more risks overall, though the
magnitude of the gender difference varied as a function of domain. For example, the mean effect size for
self-reported drinking/drug use behavior was only 0.04, while the effect size for risky driving differences was
2The work by Slovic, Fischhoff, and Lichtenstein (e.g. 1986) on psychological risk dimensions suggests that perceptions ofcontrollability of the risk are incorporated into the perception of the magnitude of the risk. This does not rule out the possibility that theymay also moderate perceived-risk attitudes or the mapping from preference and behavioral intention to actual behavior.
E. U. Weber et al. A Domain-specific Risk-attitude Scale 267
Copyright # 2002 John Wiley & Sons, Ltd. Journal of Behavioral Decision Making, 15: 263–290 (2002)

0.29. A response pattern of this sort might be the result of gender differences in risk perception that vary as a
function of content domain, or the result of differences in perceived-risk attitude that vary by domain. To
examine gender differences in risk taking and to distinguish between different explanations for such differ-
ences, we assessed the risk perceptions and risk behaviors of male and female respondents for decisions from
different content domains.
ORGANIZATION OF PAPER AND PREDICTIONS
Study 1 describes construction of the alpha-version of our risk-attitude scale, which consists of 10-item sub-
scales in five content domains. Study 2 documents the discriminant and convergent validity and test–retest
reliability of that scale. Based on insights acquired in Studies 1 and 2, Study 3 presents the beta-version of the
scale, with 8-item subscales in four content domains (health/safety, ethical, social, and recreational risks) and
two 4-item subscales that divide financial risk taking into an investment and a gambling component.
Our predictions in testing the scale were as follows: (a) individuals will show differences in conventional
risk attitude as a function of domain; (b) risk perception will differ as a function of domain; (c) differences in
risk-perception will account for observed differences in risk behavior, allowing perceived-risk attitude to be
consistent across domains. We also expected to (d) replicate previously observed gender differences in risk
taking (conventional risk attitudes), but expected those to (e) be the result of differences in risk perception or
expected benefits rather than gender differences in perceived-risk attitude.
STUDY 1 SCALE DEVELOPMENT
MethodFive hundred and sixty undergraduate students at The Ohio State University (307 women and 253 men) who
were enrolled in an introductory psychology course, received course credit for taking part in the study. The
students were primarily freshmen and sophomores between the ages of 16 and 46, with a median age of 18.
They completed a paper-and-pencil questionnaire in groups of 50–70 individuals.
The questionnaire consisted of a total of 101 items in five domains of risk: financial, health/safety, recrea-
tional, ethics, and social. These domains were identified based on a review of the literature on risk-taking
behaviors (e.g. Byrnes et al., 1999), including a review of existing risk-taking measures, in an attempt to
cover the full range of risk-taking situations encountered by young adults in Western cultures. There were
21 items assessing risky financial behaviors, 20 items assessing health/safety behaviors, and 17, 19, and 24
items measuring recreational, ethics, and social risky behaviors, respectively. Sample items were as follows:
‘Co-signing a new car loan for a friend’ (financial), ‘Driving home after you had three drinks in the last two
hours’ (health/safety), ‘Trying bungee jumping’ (recreational), ‘Cheating on an exam’ (ethical), and ‘Speak-
ing your mind about an unpopular issue at a social occasion’ (social).
The set of 101 items was presented twice. For the Risk-Behavior scale, respondents evaluated their like-
lihood of engaging in these risk behaviors (i.e. ‘ . . . indicate your likelihood of engaging in each activity’) on
a five-point rating scale ranging from 1 (‘Extremely unlikely’) to 5 (‘Extremely likely’). For the Risk-
Perception scale, participants rated their perception of the risk entailed by each risky behavior (i.e.
‘ . . . indicate your gut level assessment of how risky each situation is’) on a five-point rating scale ranging
from 1 (‘Not at all risky’) to 5 (‘Extremely risky’). Items were not presented by subscales but were randomly
interspersed. The random ordering of items was different for the two scales. The order of scales was counter-
balanced.3
3Order effects in this and subsequent studies were not significant.
268 Journal of Behavioral Decision Making
Copyright # 2002 John Wiley & Sons, Ltd. Journal of Behavioral Decision Making, 15: 263–290 (2002)

ResultsWith the goal of creating 10-item subscales, we selected the 10 items with the highest item-total correlations
to their own subscale. The resulting 50 items are shown in Appendix A. Psychometric theory suggests 0.30 as
the minimum item-total correlation for discriminating items (e.g. Nunnally and Bernstein, 1994). The major-
ity of items selected for the final 10-item scales had item-total correlations around or above 0.40. We kept a
couple of items with item-total correlations just below 0.30 on the Risk-Behavior Scale, because they had
high item-total correlations on the Risk-Perception Scale, in an effort to balance the items’ discriminating
ability on both scales. Based on the resulting 10-item subscales, we computed internal consistency reliability
indices and conducted ordinary least-squares (OLS) factor analyses.
Reliability
Exhibit 1 shows the values of coefficient alpha and the average item-total correlations for the Risk-Behavior
and Risk-Perception Scales, separately for each of the five subscales. For both scales, the Ethics subscale was
most reliable while the Social subscale was least reliable.
Factor analyses
To determine the number of factors underlying the Risk-Behavior judgments, we conducted an OLS4
exploratory factor analysis with oblique target rotation on the correlation matrix of the 50 scale items, using
a program called CEFA (Browne et al., 1999). Target rotation allows for a specification of the general pattern
of loadings to be expected and provides information on the positions of zero/unspecified loadings (Gorsuch,
1983). Based on the number of hypothesized subscales, we first specified a five-factor model. However, this
model was not easily interpretable, i.e. items had high loadings on multiple factors. A six-factor model was
easier to interpret and explained 40.4% of the variance.
The model’s factor structure is shown in Exhibit 2. Financial items loaded on two factors. Most of them,
and especially the ones having to do with gambling behavior, loaded on Factor 1 (‘financial gambling risk’,
which accounted for 3.6% of the variance). The three items related to investment behaviors had loaded very
highly on Factor 2 (‘investment risk’, which accounted for 4.6% of the variance). Three of the health/safety
items (frequent binge drinking, seatbelt use, and cigarette smoking) loaded on Factor 3 (‘health/safety risk’
with 2.9% of the variance). The other health/safety items had low loadings on all six factors. Two ethics
items (buying an illegal drug, and drunk driving) also loaded on Factor 3, suggesting that respondents treated
these behaviors as health/safety hazards rather than ethics risks. The other ethics items loaded Factor 5
(‘ethics risks’, with 18.8% of the variance). Almost all recreational items loaded on Factor 4 (‘recreational
risk’, with 4.0% of the variance) and most social items on Factor 6 (‘social risk’, with 6.5% of the variance).
The correlations among factors ranged from r¼ 0.002 (between the Investment and Health/Safety factors) to
0.46 (between the Health/Safety and Ethics factors), with an average correlation of 0.23.
We also conducted an OLS factor analysis with oblique rotation of the 50 Risk-Perception items. After
fitting both a five- and a six-factor model, we found the more parsimonious five-factor solution (accounting
for 38.5% of the variance) easier to interpret. The five factors corresponded well to the five subscales we had
hypothesized, with most of the ethics, financial, health/safety, social, and recreational items loading on five
distinct factors accounting respectively for 21.5%, 4.1%, 3.3%, 6.1%, and 3.5% of the variance. The correla-
tions among factors ranged from r¼ 0.14 (between the Health/Safety and Social factors) to 0.54 (between
the Health/Safety and Ethics factors), with an average correlation of 0.32.
4OLS factor analysis was used in preference to maximum likelihood factor analysis, because the distributions of some of the items(mostly from the Ethical and Health/Safety subscales) were skewed. However, tests of fit and standard errors for OLS are not easilyobtained and not well known (Browne and Cudeck, 1993).
E. U. Weber et al. A Domain-specific Risk-attitude Scale 269
Copyright # 2002 John Wiley & Sons, Ltd. Journal of Behavioral Decision Making, 15: 263–290 (2002)

Ex
hib
it1
.C
ron
bac
h’s
alp
has
and
mea
nit
em–
sub
scal
e-to
tal
corr
elat
ion
(an
dra
ng
eso
fco
rrel
atio
ns)
for
Ris
k-B
ehav
ior
and
Ris
k-P
erce
pti
on
sub
scal
es
Stu
dy
1S
tud
y3
Alp
ha
Item
–to
tal
corr
elat
ion
Alp
ha
Item
–to
tal
corr
elat
ion
Ris
kR
isk
Ris
kR
isk
Ris
kR
isk
Ris
kR
isk
Su
bsc
ale
beh
avio
rsp
erce
pti
on
sb
ehav
iors
per
cep
tio
ns
beh
avio
rsp
erce
pti
on
sb
ehav
iors
per
cep
tio
ns
Fin
anci
al0
.69
0.7
20
.36
(0.2
0–
0.4
8)
0.3
8(0
.27
–0
.45
)0
.84
0.7
70
.57
(0.5
1–
0.6
3)
0.4
7(0
.28
–0
.65
)In
ves
tmen
t—
——
—0
.84
0.6
70
.68
(0.6
1–
0.7
3)
0.4
6(0
.27
–0
.54
)G
amb
lin
g—
——
—0
.89
0.8
70
.75
(0.7
2–
0.8
0)
0.7
3(0
.58
–0
.84
)H
ealt
h/s
afet
y0
.73
0.8
10
.39
(0.3
1–
0.4
7)
0.4
8(0
.35
–0
.60
)0
.77
0.7
60
.47
(0.4
1–
0.5
5)
0.4
6(0
.37
–0
.60
)R
ecre
atio
nal
0.8
20
.81
0.4
9(0
.36
–0
.63
)0
.49
(0.4
1–
0.5
7)
0.8
30
.80
0.5
5(0
.47
–0
.67
)0
.50
(0.4
0–
0.6
0)
Eth
ical
0.8
30
.84
0.5
3(0
.48
–0
.59
)0
.54
(0.4
5–
0.6
1)
0.7
80
.81
0.5
0(0
.37
–0
.63
)0
.53
(0.4
0–
0.6
0)
So
cial
0.6
90
.71
0.3
5(0
.22
–0
.46
)0
.37
(0.2
8–
0.4
8)
0.7
00
.70
0.4
0(0
.27
–0
.52
)0
.40
(0.3
3–
0.5
6)
Note
:S
amp
lesi
zes
ran
ged
fro
m5
39
to5
57
(Stu
dy
1)
and
fro
m3
43
to3
57
(Stu
dy
3)
usi
ng
pai
rwis
ed
elet
ion
.
270 Journal of Behavioral Decision Making
Copyright # 2002 John Wiley & Sons, Ltd. Journal of Behavioral Decision Making, 15: 263–290 (2002)

Exhibit 2. Factor loadings of 50 items of Risk-Behavior and Risk-Perception scales for Study 1
Risk behaviors (N¼ 547) Risk perceptions (N¼ 539)
Factor Factor
Item 1 2 3 4 5 6 1 2 3 4 5
Financial4 0.39 0.15 0.29 0.07 0.02 �0.01 0.32 0.09 �0.05 0.21 0.159 0.47 0.05 �0.21 0.06 �0.03 0.02 0.41 �0.00 0.16 0.01 �0.0129 0.06 0.76 �0.07 0.04 0.00 0.02 0.27 0.00 0.09 0.00 0.0730 0.12 0.67 0.07 �0.05 �0.01 �0.04 0.38 0.16 �0.02 �0.08 0.1131 �0.01 0.70 �0.02 0.03 �0.04 0.03 0.20 0.10 0.08 �0.05 0.1132 0.45 0.15 �0.01 0.05 0.09 �0.02 0.43 �0.04 0.20 0.09 �0.0333 0.53 0.00 �0.02 0.10 �0.14 0.19 0.42 �0.04 0.20 �0.07 0.1344 0.20 �0.08 0.30 �0.02 0.09 0.19 0.15 0.25 0.02 0.26 0.1546 0.33 0.12 0.26 �0.01 0.17 0.07 0.31 0.19 �0.08 0.20 0.1147 0.15 0.10 0.01 0.00 0.15 0.04 0.42 0.03 0.04 �0.08 0.21
Health/safety14 0.10 0.07 �0.12 0.15 0.33 0.12 0.15 0.07 0.11 0.25 0.0417 �0.06 0.12 0.52 0.09 0.22 0.07 �0.07 0.38 0.05 0.38 0.0323 0.04 �0.07 0.21 0.18 0.10 0.02 �0.06 0.31 0.28 0.15 �0.0625 0.22 0.06 0.08 0.11 0.17 0.05 0.06 0.05 0.17 0.31 0.0028 0.05 �0.08 0.25 0.05 0.26 �0.05 0.27 0.47 �0.02 �0.05 �0.0735 �0.03 �0.02 0.28 0.22 0.03 �0.03 �0.01 0.44 0.18 �0.03 0.0736 0.13 �0.02 0.32 0.01 0.21 �0.01 �0.06 0.69 0.09 �0.05 0.0637 0.08 �0.06 0.20 0.06 0.22 0.01 0.10 0.41 0.15 0.14 �0.0340 0.17 0.05 0.23 0.17 0.20 �0.04 0.06 0.53 0.18 0.05 �0.0142 0.15 �0.08 0.52 �0.07 0.01 0.11 0.07 0.53 �0.10 0.12 0.10
Recreational6 0.14 0.02 0.01 0.46 0.10 �0.15 0.16 �0.10 0.48 0.00 0.0815 0.05 �0.02 0.02 0.27 0.05 0.29 �0.03 0.23 0.34 0.09 �0.0118 �0.11 0.03 �0.09 0.65 �0.00 0.04 0.02 0.10 0.57 0.10 �0.0519 0.10 0.10 0.06 0.43 0.19 �0.09 0.19 �0.10 0.39 0.09 0.1620 �0.02 0.03 �0.06 0.60 �0.09 0.10 �0.06 0.14 0.51 �0.07 0.0721 0.38 �0.05 �0.01 0.34 0.00 �0.01 �0.03 0.10 0.25 0.14 0.3322 �0.02 �0.05 0.04 0.77 �0.05 �0.07 0.17 �0.03 0.61 �0.13 0.0826 �0.12 0.09 �0.11 0.36 0.11 0.21 0.01 0.05 0.47 0.04 0.0239 �0.12 0.03 0.10 0.74 �0.09 0.02 0.11 0.05 0.55 0.03 �0.0448 �0.01 �0.03 0.09 0.62 �0.05 �0.04 0.01 0.02 0.55 0.06 �0.03
Ethics5 0.09 �0.02 0.34 0.01 0.34 0.15 �0.19 0.24 �0.01 0.55 0.157 0.09 �0.02 �0.00 �0.04 0.67 �0.11 0.19 0.04 �0.08 0.48 �0.138 0.07 �0.00 0.14 0.02 0.55 �0.23 0.14 0.14 �0.04 0.52 �0.0513 �0.04 0.01 0.47 0.12 0.27 0.08 �0.19 0.54 0.06 0.22 0.0116 0.06 �0.04 0.05 �0.03 0.51 0.05 0.03 �0.13 0.06 0.63 0.0524 �0.14 0.12 �0.12 0.13 0.63 0.08 �0.01 �0.03 0.16 0.61 �0.0727 0.12 0.08 0.11 �0.02 0.51 �0.20 0.20 0.06 0.11 0.54 �0.2441 0.11 �0.06 0.01 �0.03 0.56 0.04 0.02 0.10 �0.13 0.59 0.0045 �0.12 �0.02 �0.04 0.02 0.66 0.14 �0.10 �0.05 0.10 0.61 0.1049 �0.15 0.05 �0.06 0.07 0.58 0.17 �0.07 �0.11 0.06 0.57 0.22
Social1 �0.08 �0.01 0.06 0.05 �0.09 0.56 �0.11 �0.05 0.08 �0.05 0.602 �0.11 0.10 0.10 �0.12 0.06 0.64 0.02 0.04 �0.03 0.05 0.593 0.03 0.05 �0.18 0.03 0.02 0.32 0.35 0.06 �0.02 �0.08 0.38
Continues
E. U. Weber et al. A Domain-specific Risk-attitude Scale 271
Copyright # 2002 John Wiley & Sons, Ltd. Journal of Behavioral Decision Making, 15: 263–290 (2002)

Subscale correlations
As our a-priori specification of subscales appeared to be relatively adequate (especially for the risk-percep-
tion items), scores on each subscale were obtained as the average score on the ten items belonging to the
subscale. Correlations across respondents among the five subscales scores of both the Risk-Behavior and
Risk-Perception scale are reported in Exhibit 9, with an average correlation among subscales of 0.44.
Gender differences
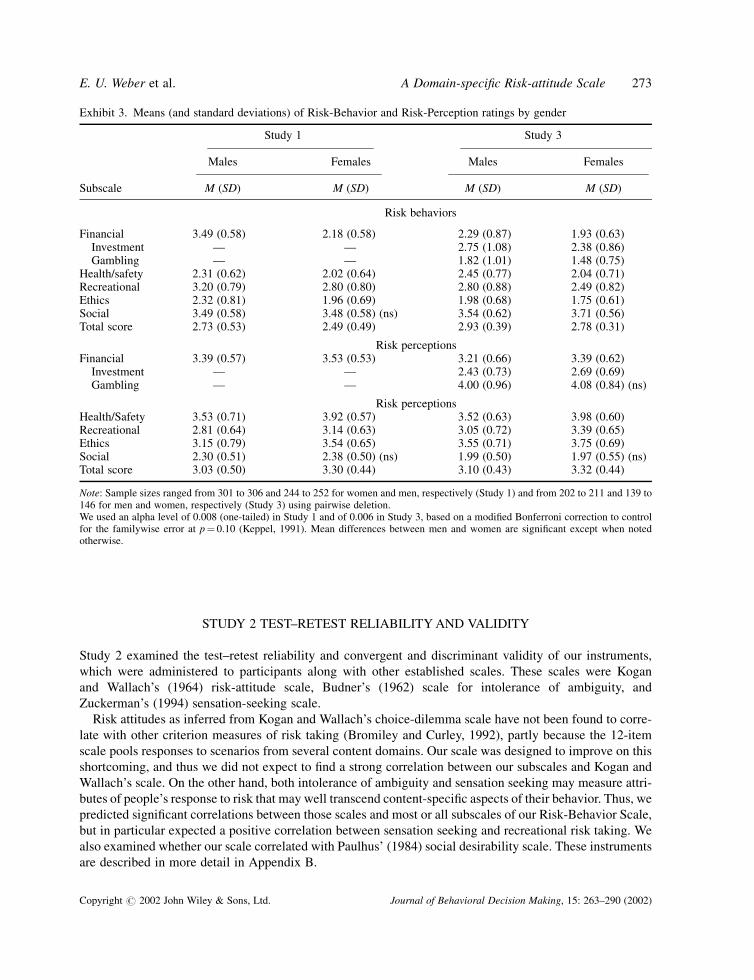
Exhibit 3 shows the subscale means and standard deviations for the 307 women and 253 men in our sample.
Male and female respondents differed significantly5 in their perceptions of all risk categories except social
risks (where female respondents perceived risks to be greater, though not significantly so), a finding that
replicates and generalizes the results of Slovic (1997) who only examined gender differences in risk percep-
tion in the health/safety domain. These gender differences in risk perception were paralleled by significant
male–female differences in reported risk taking (again in all domains except social risk), with female respon-
dents being less likely to engage in risky behaviors.
Discussion of the results of Study 1The results of the factor analyses suggest that our specification of content domains may need to be modified
for risk behaviors.6 Paralleling the distinction made by managers between ‘gambling’ and ‘risk taking’
(March and Shapira, 1987), risk behavior in the financial domain seemed to depend on whether the financial
risk fell into the less controllable ‘gambling’ or more manageable ‘investment’ category. Ajzen’s (1991) the-
ory of planned behavior might explain these differences in behavior by differences in subjective norms about
the appropriateness of taking financial risks in those two subdomains.
The ethics risk factor accounted for the largest proportion of the variance of responses for both the Risk-
Perception and Risk-Behavior scale, but risk behavior was contingent on a subcategorization of ethics risks
with possibly different subjective norms about the appropriateness of risk taking. Some ethics risks were
treated as essentially health/safety risks, whereas others were in their own category. The fact that the factor
structure for Risk Behaviors and Risk Perceptions showed some differences suggests that respondents’ judg-
ments of the riskiness of activities was not just a simple transformation of their willingness to engage in the
judged activities, but the result of a different and somewhat independent evaluation.
Exhibit 2. Continued
10 �0.04 �0.07 0.03 0.13 0.18 0.34 0.27 0.12 0.07 0.02 0.1811 0.20 �0.02 0.08 0.28 0.04 0.08 0.21 0.01 0.27 0.12 0.0812 0.02 0.00 0.05 �0.03 �0.01 0.54 �0.06 0.05 0.05 0.00 0.4334 0.07 0.04 0.04 0.13 �0.12 0.36 0.14 �0.17 0.17 �0.03 0.2838 0.30 �0.04 �0.20 0.00 0.15 0.27 0.36 0.11 �0.02 0.07 0.2043 0.04 0.02 �0.02 0.04 �0.05 0.48 �0.01 0.05 �0.00 �0.04 0.4550 0.30 �0.05 �0.04 0.09 0.04 0.37 0.03 �0.05 0.06 0.05 0.49
Note: Loadings greater than 0.30 are shown in bold. Correlation matrices are available from the authors upon request.
5We used nonparametric tests to compare groups whenever the variables were not normally distributed and obtained similar results.Significance tests, unless otherwise noted, use a type-I error of 0.05.6Since the six-factor model was derived post-hoc, based on an exploratory data analysis, we will try to replicate the factor structure of ourscales in Study 3.
272 Journal of Behavioral Decision Making
Copyright # 2002 John Wiley & Sons, Ltd. Journal of Behavioral Decision Making, 15: 263–290 (2002)
STUDY 2 TEST–RETEST RELIABILITY AND VALIDITY
Study 2 examined the test–retest reliability and convergent and discriminant validity of our instruments,
which were administered to participants along with other established scales. These scales were Kogan
and Wallach’s (1964) risk-attitude scale, Budner’s (1962) scale for intolerance of ambiguity, and
Zuckerman’s (1994) sensation-seeking scale.
Risk attitudes as inferred from Kogan and Wallach’s choice-dilemma scale have not been found to corre-
late with other criterion measures of risk taking (Bromiley and Curley, 1992), partly because the 12-item
scale pools responses to scenarios from several content domains. Our scale was designed to improve on this
shortcoming, and thus we did not expect to find a strong correlation between our subscales and Kogan and
Wallach’s scale. On the other hand, both intolerance of ambiguity and sensation seeking may measure attri-
butes of people’s response to risk that may well transcend content-specific aspects of their behavior. Thus, we
predicted significant correlations between those scales and most or all subscales of our Risk-Behavior Scale,
but in particular expected a positive correlation between sensation seeking and recreational risk taking. We
also examined whether our scale correlated with Paulhus’ (1984) social desirability scale. These instruments
are described in more detail in Appendix B.
Exhibit 3. Means (and standard deviations) of Risk-Behavior and Risk-Perception ratings by gender
Study 1 Study 3
Males Females Males Females
Subscale M (SD) M (SD) M (SD) M (SD)
Risk behaviors
Financial 3.49 (0.58) 2.18 (0.58) 2.29 (0.87) 1.93 (0.63)Investment — — 2.75 (1.08) 2.38 (0.86)Gambling — — 1.82 (1.01) 1.48 (0.75)
Health/safety 2.31 (0.62) 2.02 (0.64) 2.45 (0.77) 2.04 (0.71)Recreational 3.20 (0.79) 2.80 (0.80) 2.80 (0.88) 2.49 (0.82)Ethics 2.32 (0.81) 1.96 (0.69) 1.98 (0.68) 1.75 (0.61)Social 3.49 (0.58) 3.48 (0.58) (ns) 3.54 (0.62) 3.71 (0.56)Total score 2.73 (0.53) 2.49 (0.49) 2.93 (0.39) 2.78 (0.31)
Risk perceptionsFinancial 3.39 (0.57) 3.53 (0.53) 3.21 (0.66) 3.39 (0.62)
Investment — — 2.43 (0.73) 2.69 (0.69)Gambling — — 4.00 (0.96) 4.08 (0.84) (ns)
Risk perceptionsHealth/Safety 3.53 (0.71) 3.92 (0.57) 3.52 (0.63) 3.98 (0.60)Recreational 2.81 (0.64) 3.14 (0.63) 3.05 (0.72) 3.39 (0.65)Ethics 3.15 (0.79) 3.54 (0.65) 3.55 (0.71) 3.75 (0.69)Social 2.30 (0.51) 2.38 (0.50) (ns) 1.99 (0.50) 1.97 (0.55) (ns)Total score 3.03 (0.50) 3.30 (0.44) 3.10 (0.43) 3.32 (0.44)
Note: Sample sizes ranged from 301 to 306 and 244 to 252 for women and men, respectively (Study 1) and from 202 to 211 and 139 to146 for men and women, respectively (Study 3) using pairwise deletion.We used an alpha level of 0.008 (one-tailed) in Study 1 and of 0.006 in Study 3, based on a modified Bonferroni correction to controlfor the familywise error at p¼ 0.10 (Keppel, 1991). Mean differences between men and women are significant except when notedotherwise.
E. U. Weber et al. A Domain-specific Risk-attitude Scale 273
Copyright # 2002 John Wiley & Sons, Ltd. Journal of Behavioral Decision Making, 15: 263–290 (2002)

MethodOne hundred and twenty-one participants, a subset of the respondents who participated in Study 1, were
asked to return one month later for Study 2. The 62 women and 59 men, aged between 17 and 23 (with a
median age of 18), were chosen to provide an approximately normal distribution of total Risk-Behavior scale
scores within each gender group.
Participants filled out both the 50-item Risk-Behavior and Risk-Perception scales developed in Study 1.
They also rated the benefits they expected to obtain from engaging in each risky behavior (‘ . . . indicate the
benefits you would obtain from each situation’) on a five-point rating scale from 1 (‘No benefits at all’) to 5
(‘Great benefits’). Items for the Benefits scale were presented in a (different) random order. Participants also
provided responses to the validation scales described above.
To validate the behavioral intentions reported by respondents on the Risk-Behavior Scale, we collected
self-reports of the frequency of common risky behaviors in the recent past in each of the five content
domains. Participants indicated, using a three-point rating scale from 1 (‘Never’) to 3 (‘Several times’),
how often they had engaged in various risky behaviors (i.e. ‘ . . . indicate the frequency with which you
engaged in the following behaviors during each time period’). Because it was more difficult to find repre-
sentative risky behaviors in some domains (i.e. recreational) than others (i.e. financial), the number of items
per subscale varied from 4 to 15. Sample items were: ‘Break up with a girlfriend/boyfriend’ (social), ‘Buy
illegal drugs’ (ethics), ‘Loan a large amount of money to a relative/friend’ (financial), ‘Engage in binge
drinking’ (health/safety), and ‘Do something risky or dangerous on a dare’ (recreational).
Additionally, we observed respondents in a series of five risky monetary decisions made in a lab ‘casino’
setting. These decisions were made in the context of a card game that involved choices between drawing a
card from a ‘non-risky’ pile with constant, but relatively low payoffs or from a ‘risky’ pile with some prob-
ability of a higher payoff, but also the chance of winning nothing. These decisions involved real monetary
payoffs that ranged from $3 to $20 and averaged around $11 (for details of this task, see Weber, Shafir, and
Blais, ‘Predicting risk sensitivity in humans and lower animals: Risk as variance or coefficient of variation?
under review, 2001). Respondents were scored on the number of choices (out of 5) in which they chose the
riskier of the two gambles.
Respondents answered the questionnaires and played the card game in a lab setting in small groups, taking
about 90 minutes to complete both tasks.
Results: Risk-BehaviorReliability
Test–retest reliabilities were computed for the participants who completed the Risk-Behavior Scale twice
over a one-month interval. The correlations were somewhat low for the Financial and Social subscales
(0.44 and 0.58, respectively), but respectable for the Health, Ethics, and Recreational subscales (0.75,
0.72, and 0.80, respectively).7,8 Test–retest reliability was similar for the Risk-Perception Scale, with lower
values for the Financial and Social subscales (0.42 and 0.47, respectively), but better values for the Health,
Ethics, and Recreational subscales (0.66, 0.67, and 0.56, respectively).
Validity
As predicted, the Kogan and Wallach measure of risk attitude did not significantly correlate with any of the
five Risk-Behavior subscales. Intolerance of ambiguity, on the other hand, correlated significantly with the
7All reported correlations are significant at the 0.05 level, unless noted otherwise. Nonparametric procedures yielded results similar invalue to the Pearson correlations.8The fact that respondents initially filled out the full 101-item scale (in Study 1) rather than the 50-item scale used in Study 2 might haveattenuated test–retest reliability.
274 Journal of Behavioral Decision Making
Copyright # 2002 John Wiley & Sons, Ltd. Journal of Behavioral Decision Making, 15: 263–290 (2002)

Social and Recreational Risk-Behavior subscales, (r¼�0.30 and �0.42, respectively). Also as predicted,
sensation seeking (in its various subscales) correlated significantly with the Risk-Behavior subscales in
all five domains, with the highest correlations between the thrill-and-adventure-seeking subscale and the
Recreational Risk-Behavior subscale, r¼ 0.56, and the disinhibition subscale and the Ethics Risk-Behavior
subscale, r¼ 0.53. The same was true for intolerance for ambiguity, which correlated with all Risk-Behavior
subscales except Investment risk, with an average correlation of 0.28 and the highest correlation (0.65) with
the Recreational risk subscale. The impression management subscale score of the Paulhus’ (1984) social
desirability scale was significantly correlated with the Ethics and Health/Safety Risk-Behavior subscales,
r¼�0.51 and �0.34, respectively, i.e. the desire to present themselves in a positive way was associated with
lower reported likelihoods to engage in risky ethics and health/safety behaviors.
The self-reported frequencies9 of past risky behaviors in the five domains correlated significantly with the
behavioral intentions for behaviors in the same domain (i.e. the risk-behavior subscale scores), as shown in
Exhibit 4. The average correlation was 0.49 and correlations were particularly high correlations for the
Ethics (r¼ 0.74), Recreational (r¼ 0.64) and Health/Safety (r¼ 0.71) subscales. The card game result,
scored as the number of choices out of 5 for which a respondent chose the risky option over the sure thing,
correlated significantly with the Financial Risk-Behavior subscale (r¼ 0.28), as expected, and less strongly
with the other subscales.
Results: Relationship between Risk Perception and Risk BehaviorConventional risk attitudes
Respondents in this study were selected to span the full range of conventional risk attitudes (from strongly
risk averse to strongly risk seeking), as measured by their total score on the Risk-Behavior Scale. It is still
possible, of course, for the distribution of risk attitudes to be different in the five content domains. Exhibit 5
Exhibit 4. Pearson correlations between Risk-Behavior subscales and self-reported behavioral frequencies, and cardgame choices
Risk Behavior subscales
Financial Health/safety Ethics Recreational Social
CorrelatesFinancial risk-taking 0.37 0.33 0.27 0.19 (ns) 0.27Health/Safety risk-taking 0.43 0.71 0.56 0.32 0.16 (ns)Ethical risk-taking 0.37 0.42 0.74 0.31 0.09 (ns)Recreational risk-taking 0.39 0.43 0.43 0.64 0.30Social risk-taking 0.14 (ns) 0.14 (ns) 0.11 (ns) 0.003 (ns) 0.21Cardgame score 0.28 0.22 0.24 0.21 0.09 (ns)
ns¼ nonsignificant at the 0.05 level.Note: Sample sizes ranged from 93 to 121 using pairwise deletion.
9The five subscales of self-reported risky behaviors were built from items that correlated at least 0.30 with their hypothesized subscale.This resulted in 31 items on whose correlation matrix (listwise deletion, N¼ 89) we conducted an OLS exploratory factor analysis withoblique target rotation using CEFA. In general the pattern of loadings agreed with our a-priori specifications. In some cases, the factorstructure was different (e.g. the item ‘Drive/ride a motorcycle’ had higher loadings on the Recreational factor than on the Health/Safetyfactor). This pattern made sense a-posteriori, so this item was reassigned to the Recreational subscale. Coefficient alphas for thesubscales were clearly inadequate for the Social (4 items) and Financial (3 items) subscales (0.07 and 0.50, respectively), which mightpartly explain their low correlations with other constructs, but were higher for the Ethics (10 items), Health/Safety (7 items), andRecreational (7 items) subscales (0.65, 0.66, and 0.77, respectively). We report the correlations among the self-reported risky behaviorsand the Risk-Behavior and Risk-Perception subscales even though the internal consistency estimates of the subscales were not optimal,but some of these results should be interpreted with caution.
E. U. Weber et al. A Domain-specific Risk-attitude Scale 275
Copyright # 2002 John Wiley & Sons, Ltd. Journal of Behavioral Decision Making, 15: 263–290 (2002)

shows, however, that the distribution of conventional risk attitudes across respondents was about the same in
each of the five domains. Individuals were classified as risk seeking if their score on a subscale was more than
one standard deviation above the mean, as risk averse if their subscale score was more than one standard
deviation below the mean, and as risk neutral if their subscale score was in between. It should be noted that
the distribution shown in Exhibit 5 is not what one would expect from a random sample of college students,
since we selected respondents to span the full range of conventional risk attitudes.
While the distribution of risk attitudes across respondents was about the same for all five content domains,
this was not the case for individual respondents. As Exhibit 6 shows (and consistent with previous results),
conventional risk attitudes in the five content domains were not consistent for a given individual. No
respondent was consistently risk-averse in all five domains, and only four individuals were consistently
risk-seeking.
Perceived-risk attitudes: regressing risk-behavior on expected benefits and perceived risk
Across respondents and subscale items, risk perceptions and risk behaviors were negatively correlated
(between �0.51 and �0.77) in each of the five risk domains, suggesting perceived-risk aversion. However,
perceived-risk attitudes need to be assessed at the individual-subject level and need to consider individual
differences in perceived benefits. Just as risk behavior and perceived risk, ratings of expected benefits were
significantly different for male and female respondents for all subscales except for social risk. In particular,
men expected risky activities in financial, health/safety, recreational and ethics domain to have greater ben-
efits than women did. The opposite was true for some of the socially risky behaviors, though this difference
was significant for only three of the 10 social risk items. To assess the effect of individual and gender differ-
ences in expected benefits and perceived risk on risk behavior, we regressed risk behavior on expected ben-
efits and perceived risks, with a separate regression for each individual and each risk domain.
Exhibit 7 shows the average regression coefficients for the intercept term, expected benefits, and perceived
risks (i.e. c, a, and b in equation (1) respectively), as well as the average R2 of the individual-subject regres-
sions of risk behavior in each domain. Domain influenced the intercept term as well as the effect of perceived
Exhibit 5. Distribution of risk attitudes across respondents by risk domain
Conventional risk attitude Perceived-risk attitude
Content domain Averse Neutral Seeking Averse Neutral Seeking
Financial 14 86 16 44 72 0Health/safety 18 79 19 45 70 1Recreational 18 79 19 43 71 0Ethical 18 80 18 49 65 2Social 19 82 15 50 66 0
Exhibit 6. Frequency of respondents with indicated pattern of risk-attitudes acrossdomains
Pattern across domains Conventional risk attitude Perceived-risk attitude
Averse for all 0 2Averse or neutral 39 97Neutral for all 41 14Neutral or seeking 30 1Seeking for all 4 0Seeking or averse 2 2
276 Journal of Behavioral Decision Making
Copyright # 2002 John Wiley & Sons, Ltd. Journal of Behavioral Decision Making, 15: 263–290 (2002)

risk and expected benefit on risk behavior. Expected benefits increased the likelihood of the risk behavior
most for recreational risks and least for financial and social risks. Perceived risks reduced the likelihood of
the risk behavior most for financial risks and least for health/safety risks. None of the regression coefficients
in any of the five domains differed significantly as a function of gender.
Behavior of each respondent in each domain was classified as perceived-risk seeking (averse) if the regres-
sion coefficient for perceived risk was significant10 and positive (negative). Individuals with regression coef-
ficients not significantly different from zero were categorized as perceived-risk neutral. Exhibit 5 shows that,
across respondents, the distribution of perceived-risk attitudes is very similar for the five risk domains. It also
shows that perceived-risk seeking is very rare, despite the fact that our selection had included respondents
who appeared to be risk seeking based on their risk behavior, as shown by the conventional risk-attitudes in
the left column of Exhibit 5. Our analysis that regressed risk behavior on perceived risks and benefits sug-
gests that most individuals who reported that they were likely to engage in risky behaviors must have done so
with the belief that these behaviors were not very risky or, alternatively, carried high benefits. Very few of our
respondents indicated willingness to engage in behaviors that they considered to be risky.
Exhibit 6 shows the number of individuals who had consistent or inconsistent perceived-risk attitudes
across the five risk domains. The great majority of respondents (99 out of 116) were perceived-risk averse
for all or most of the five content domains (with usually one or two domains in which the coefficient of
perceived risk on behavior was still negative but not significantly different from zero). Fourteen individuals
were perceived-risk neutral for all five domains, while nobody was perceived-risk seeking for all domains. A
comparison of the two columns of Exhibit 6 confirms our hypothesis that perceived-risk attitude (PRA) does,
indeed, show greater cross-situational consistency than conventional risk attitudes. While consistent in sign,
however, the absolute magnitude of PRA differed considerably across domains, to the point that there were
no significant correlations across respondents between the PRAs estimated for different content domains.
Given that the attitude towards perceived-risk for most respondents was either negative or neutral across
the five risk domains, we also regressed each individual’s risk behavior on perceived benefits and risks
across all 50 items. The proportion of variance in risk behavior accounted for by this regression ranged
from 0.16 to 0.88, with a mean of 0.52. One hundred and seven participants out of 116 (92%) had significant
negative regression coefficients for perceived risk (i.e. were perceived-risk averse). The remaining 13
individuals were perceived-risk neutral, i.e. their reports of perceived risk did not significantly predict their
risk behavior.
Exhibit 7. Average coefficients and R2 (across respondents) of individual-subject regressions ofrisk behavior on perceived benefits and perceived risk by risk domain
Regression coefficients
Content domain Intercept Perceived benefit Perceived risk R2
Financial 2.92d 0.20a �0.28c 0.42Health/safety 1.30a 0.27a �0.10a 0.50Recreational 2.31bc 0.38b �0.16ab 0.50Ethical 2.07b 0.32ab �0.21b 0.50Social 2.66cd 0.20a �0.11a 0.36
Note: Within each column, superscripts indicate whether a pairwise comparison is significant at the 0.05 level(with Bonferroni correction for multiple comparisons); the presence of the same letter indicates that thedifference is not significant.
10Given the small number of data points for each regression (n¼ 10), we used a significance level of 0.10 when making this classificationto ensure an appropriate level of power.
E. U. Weber et al. A Domain-specific Risk-attitude Scale 277
Copyright # 2002 John Wiley & Sons, Ltd. Journal of Behavioral Decision Making, 15: 263–290 (2002)

Perceived-risk attitude (assessed either within each content domain, or across content domains) did not
correlate with sensation seeking or intolerance for ambiguity. Instead, the moderate correlations that these
personality traits showed with many of the subscales of our Risk-Behavior instrument were associated with
corresponding correlations between these personality measures and either perceived risk, expected benefits,
or both.
Halo effects
Another serendipitous finding worth noting was that the relationship between perceptions of risks and ben-
efits was different from their actual relationship in most real-world contexts, where greater risks tend to be
associated with greater benefits. Instead of finding a positive correlation, however, respondents’ estimates of
risks and benefits across behaviors in all domains were negatively correlated (i.e. greater expected benefits
were associated with smaller perceived risks; average r¼�0.46). Similar results have been reported by other
researchers (see Slovic, 1997). In addition, we found a new halo effect, namely a positive correlation
between coefficients a and b across individuals. Respondents who gave a higher positive weight to benefits
in the regression of benefits and risks on behavior tended also to give a smaller negative weight to perceived
risk; this correlation ranged from 0.33 to 0.54 for the five risk domains.
Discussion of results of Study 2Our Risk-Behavior Scale showed reasonable test–retest reliability and convergent and discriminant validity.
Its five subscales correlated well with self-reports of the frequency of recent risky behavior in each content
domain (with somewhat lower correlations for the financial and social subscales), and showed much smaller
correlations with self-reports of risky behavior frequencies in other domains. As predicted, there also
were commonalities across subscales with other measures. In particular, all subscales showed moderate posi-
tive correlations with subscales of the sensations-seeking scale. As a note of caution, the ethics and health/
safety subscales showed moderate negative correlations with a measure of social desirability. Thus, respon-
dents’ answers to these two subscales of our instrument may be somewhat influenced by a desire to give
socially desirable answers. Alternatively, the desire to present oneself in a positive light may be related to
a lower willingness to engage in risky activities in order to protect one’s self-image.
Study 2 confirmed our hypotheses about the content dependence of behavior-inferred risk attitudes. It also
showed that apparent differences in risk attitude (i.e. behavioral intentions that appeared to be risk-seeking in
one domain and risk-averse in another domain) were explained by corresponding differences in perceived
risk and expected benefits, with the result that perceived-risk attitudes (that describe attitude towards risk
after domain differences in the perception of risk and benefits are taken into consideration) showed far
greater cross-situational consistency. The same pattern of results pertained to gender differences. Gender
differences showed up in Risk Behaviors, Risk Perceptions, and Expected Benefits (in four of the five risk
domains), but not in respondents’ perceived-risk attitudes.
There were far greater individual differences in risk (and benefit) perception than in perceived-risk attitude
(which was moderately negative for most individuals and did not differ between gender), suggesting that—
while more stable across situations—perceived-risk attitude may not prove itself a very informative trait
variable. Individual differences (e.g. on sensation seeking and intolerance of ambiguity) influenced risk tak-
ing primarily by affecting risk and benefit perceptions, rather than the trade-off between risks and benefits.
STUDY 3 REFINEMENT OF SCALE
Study 3 attempted to increase the reliability and validity of some of the Risk-Behavior and Risk-Perception
subscales. We also wanted to replicate the six-factor model, uncovered in Study 1, with separate factors
278 Journal of Behavioral Decision Making
Copyright # 2002 John Wiley & Sons, Ltd. Journal of Behavioral Decision Making, 15: 263–290 (2002)

(subscales) for financial gambling risks (exogenous and uncontrollable) and financial investment risks
(potentially more ‘manageable’).
MethodThree hundred and fifty-seven undergraduate students at The Ohio State University (211 women and 146
men) who were enrolled in an introductory psychology course received course credit for taking part in
the study. Primarily freshmen and sophomores and aged between 17 to 43 (with a median age of 18), they
filled out our instrument in a class setting in groups of 50–70 individuals.
To improve item quality, we added 14 items to the 50 items used in Studies 1 and 2. In addition, we
reworded some of the original items (e.g. the items having to do with stock market investment) to clarify
their meaning. We also modified the rating scale format, labeling each scale point rather than just the end-
points. Our goal was to generate subscales with better psychometric properties (especially in the health/
safety and social domains) and to examine the multidimensional nature of the financial subscale by increas-
ing the number of financial items related to either financial investing and other financial decisions (e.g. lend-
ing money to a friend, getting a car loan) versus gambling, There were 14 financial items in this version (five
having to do with gambling, four with stock market investment, and five with other risky financial decisions),
18 items assessing health/safety behaviors, and 9, 11, and 12 items measuring recreational, ethically, and
socially risky behaviors, respectively.
Participants answered both the Risk-Perception and Risk-Behavior scales. The items from different sub-
scales were again randomly intermixed, with a different ordering for each scale.
ResultsReliability
To reduce the overall length of the scales to 40 items, we selected eight items per subscale (those with the
highest item–subscale-total correlations). Just as in Study 1, we only retained items with item–subscale-total
correlations close to or greater than 0.30. Most of the selected items were the same as those in the original
scale, but there were some substitutions. The final scale, as shown in Appendix C, also reflects some minor
changes in wording intended to clarify the intent of some items.
Exhibit 1 shows the values of coefficient alpha and the average item-total correlations for the Risk-
Behavior and Risk-Perception scales, separately for each of the six subscales. Note that for the Risk-Beha-
vior scale, the gambling subscale was most reliable while the social subscale was (again) least reliable. For
the Risk-Perception scale, the gambling subscale also was the most reliable, while the investment subscale
was the least reliable. The coefficient alpha across all 40 items was 0.88 for the Risk-Behavior scale and 0.89
for the Risk-Perception scale. The Risk-Behavior financial and health/safety subscales both has higher
alphas than in Study 1, showing that we succeeded, at least in these two cases, to increase the internal con-
sistency of these subscales.
Factor analyses
Based on Study 1, we expected our scales to be composed of six subscales. We conducted an OLS explora-
tory factor analysis with oblique target rotation on the correlation matrix of the 40 risk-behavior items. The
six-factor model accounted for 50.3% of the variance. The resulting factor loadings are reported in Exhibit 8.
The six factors were easily interpretable as risks related to financial investing (accounting for 7.6% of the
variance), gambling (3.7%), health/safety (21.1%), recreation (6.0%), ethics (3.2%), and social behaviors
(8.6% of the variance).
The investment, gambling, recreational, and social factors were well-defined with most of the items load-
ing 0.30 or higher on their a-priori specified factor and, in almost all cases, only on that factor. Some of the
E. U. Weber et al. A Domain-specific Risk-attitude Scale 279
Copyright # 2002 John Wiley & Sons, Ltd. Journal of Behavioral Decision Making, 15: 263–290 (2002)

Exhibit 8. Factor loading of 40 items of Risk-Behavior and Risk-Perception scales for Study 3
Risk behaviors (N¼ 343 ) Risk perceptions (N¼ 343)
Factor Factor
Item 1 2 3 4 5 6 1 2 3 4 5 6
Investment7 0.80 �0.09 �0.16 0.06 0.11 0.09 0.68 �0.03 �0.03 �0.12 0.03 0.15
18 0.61 0.14 �0.06 0.02 0.06 �0.07 0.26 0.10 0.07 0.05 �0.12 0.0224 0.69 0.20 �0.07 0.06 0.00 0.05 0.61 0.02 �0.18 0.08 0.20 �0.0230 0.80 �0.13 �0.06 0.04 0.14 �0.12 0.66 �0.09 0.06 0.01 0.10 0.00
Gambling3 0.01 0.83 �0.05 0.08 0.03 �0.04 �0.04 0.86 �0.23 0.04 0.07 0.05
11 0.05 0.82 �0.01 0.05 0.05 0.02 0.02 0.97 �0.21 �0.02 0.14 0.0222 0.06 0.72 0.06 0.06 0.02 0.04 0.05 0.81 �0.01 0.03 0.04 0.0733 0.00 0.55 0.11 �0.01 0.31 �0.17 0.02 0.58 0.11 0.04 0.06 �0.09
Health/safety4 0.07 0.08 0.42 0.11 0.11 0.02 0.02 0.03 0.16 0.04 0.46 0.108 0.08 0.09 0.52 0.06 0.00 0.00 0.02 0.03 0.31 0.16 0.21 �0.04
27 �0.11 �0.04 0.43 0.06 0.30 �0.02 �0.05 0.03 0.48 0.05 0.08 �0.0529 �0.02 �0.06 0.52 �0.08 0.24 �0.10 0.02 0.04 0.58 �0.07 0.15 0.0432 �0.02 0.00 0.41 0.19 0.18 �0.18 �0.01 0.06 0.51 0.07 0.00 0.0136 �0.11 �0.05 0.36 0.12 0.10 0.07 0.03 �0.02 0.52 0.03 0.02 0.0239 �0.09 0.06 0.48 0.13 0.01 0.00 0.07 �0.06 0.51 0.26 �0.01 �0.0840 �0.07 0.18 0.48 �0.20 0.03 0.16 0.06 �0.07 0.47 �0.01 0.13 0.15
Recreational2 �0.01 �0.03 0.04 0.57 �0.11 0.21 0.00 0.01 �0.09 0.40 0.10 0.196 0.00 0.02 0.08 0.55 0.13 �0.17 �0.05 0.01 0.09 0.55 0.01 �0.18
15 �0.02 0.08 �0.32 0.59 0.05 0.10 �0.07 0.01 0.08 0.49 �0.10 0.1517 0.03 0.18 0.11 0.58 �0.04 �0.05 �0.06 0.11 0.12 0.48 0.10 0.0021 0.00 �0.02 0.01 0.72 �0.01 0.09 0.03 0.02 0.07 0.58 0.02 0.0631 0.03 �0.03 0.19 0.57 �0.16 �0.04 �0.02 �0.03 �0.06 0.62 0.04 �0.0337 0.01 �0.01 �0.06 0.53 0.22 �0.08 0.05 0.04 0.15 0.53 �0.16 0.0338 0.09 �0.07 0.14 0.70 �0.09 0.08 0.21 �0.06 �0.13 0.68 0.06 0.01
Ethical5 �0.03 �0.01 0.03 0.02 0.82 �0.02 �0.17 0.07 0.20 �0.02 0.67 0.149 0.13 0.27 0.01 0.08 0.40 �0.08 0.15 0.10 0.11 0.20 0.32 �0.07
12 0.08 0.22 0.25 0.03 0.28 �0.04 0.09 0.21 0.40 �0.07 0.13 �0.0213 �0.05 0.08 0.10 0.02 0.41 0.16 0.04 0.13 0.08 0.04 0.49 �0.0414 �0.03 �0.01 0.03 �0.01 0.84 �0.10 �0.08 0.07 0.16 �0.06 0.65 0.0320 0.18 �0.05 0.15 0.04 0.24 0.18 0.18 �0.02 0.00 0.17 0.57 �0.0425 0.02 0.11 0.24 0.10 0.24 �0.07 0.09 0.05 0.13 0.05 0.37 0.0328 0.23 0.06 0.31 �0.12 0.24 0.15 0.20 0.01 0.11 �0.04 0.55 0.01
Social1 0.02 �0.11 0.04 �0.03 �0.16 0.64 �0.04 �0.05 0.02 �0.04 �0.03 0.52
10 �0.02 0.01 �0.04 �0.08 0.12 0.56 0.06 0.03 �0.08 0.02 0.09 0.4516 0.04 �0.07 0.07 �0.02 �0.10 0.59 0.10 0.08 0.08 �0.04 �0.06 0.5419 0.18 �0.01 �0.07 0.06 0.04 0.29 0.14 0.04 0.02 0.10 �0.19 0.4023 �0.04 0.06 �0.08 0.04 0.13 0.30 �0.02 0.13 0.21 0.05 �0.22 0.3526 0.01 0.05 0.16 0.07 �0.04 0.34 0.07 �0.06 0.04 �0.03 0.25 0.4534 �0.16 �0.06 �0.10 0.07 0.00 0.45 �0.10 �0.07 �0.17 0.12 0.08 0.4435 �0.07 �0.02 0.09 �0.03 0.03 0.62 �0.07 �0.04 �0.01 0.02 0.03 0.69
Note: Loadings greater than or equal to 0.30 are reported in bold. Correlation matrices are available from the authors upon request.
280 Journal of Behavioral Decision Making
Copyright # 2002 John Wiley & Sons, Ltd. Journal of Behavioral Decision Making, 15: 263–290 (2002)

intended ethics items, however, again had low loadings on the ethics factor or loadings greater than 0.30 on
the health/safety factor as well. Item 4 (‘Buying an illegal drug for your own use’) had loadings greater than
0.30 on the health/safety subscale in both Studies 1 and 3. Hence this item, intended as an ethical item, was
added to the health/safety subscale. The correlations among factors ranged (in absolute terms) from 0.07
(between the investment and social factors) to 0.49 (between the gambling and ethics factors), with an aver-
age absolute correlation among factors of 0.22.
The factor analysis conducted on the Risk-Perception scale yielded a very similar factor structure this
time. Accounting for 47.0% of the variance, the six-factor solution could be interpreted as an investment
(5.2% of the variance), gambling (4.5%), health/safety (19.7%), recreational (6.3%), ethics (3.8%), and
social risk factor (7.4% of the variance). For the Risk-Perception scale, the majority of even the ethics
and health/safety items loaded on (only) their respective factors. The correlations among factors ranged from
0.05 (between the gambling and social factors) to 0.44 (between the gambling and health/safety factors),
with an average absolute correlation of 0.24.
As our a-priori specification of subscales appeared to be adequate (with one adjustment on the Ethics
Risk-Behavior subscale), scores on each subscale were defined as the average score on the items listed as
belonging to the subscale in Exhibit 8 and Appendix C. Correlations among the six Risk-Behavior subscales
are reported in Exhibit 8 and showed an average (absolute) correlation of 0.26.
Gender differences
As in Study 1, women and men differed in both their risk perceptions and reported behavioral intentions or
risk behaviors.11 As shown in Exhibit 3, men perceived the risk associated with these behaviors to be
Exhibit 9. Pearson correlations among subscales and with total score for Risk-Behavior scale in Studies 1 and 3
Subscale Financial Investment Gambling Health/safety Ethical Recreational Social
Study 1Financial 1.00Health/Safety 0.46 — — 1.00Ethical 0.46 — — 0.67 1.00Recreational 0.44 — — 0.47 0.46 1.00Social 0.36 — — 0.31 0.32 0.46 1.00Total score 0.71 — — 0.79 0.80 0.78 0.63
Study 3Financial 1.00
Investment 0.84 1.00Gambling 0.79 0.33 1.00
Health/Safety 0.29 0.04 0.44 1.00Ethical 0.51 0.28 0.56 0.61 1.00Recreational 0.36 0.25 0.34 0.34 0.34 1.00Social �0.07 0.02 �0.15 0.06 0.04 0.13 1.00Total score 0.60 0.43 0.55 0.60 0.45 0.75 0.33
Note: Sample sizes ranged from 539 and 547 (Study 1) and from 341 to 357 (Study 3) using pairwise deletion.
11Since there were gender differences in both risk preception and risk taking, we factor analyzed the responses to both scales separatelyby gender (in both Studies 1 and 3). A visual inspection of the factor loadings does not reveal any obvious differences between the twogender groups. However, this examination of factor invariance across gender in solely descriptive and does not provide a comparison ofmodel fit for the two groups. More sophisticated techniques would require the fitting of correlation matrices that are too large relative toour available sample size.
E. U. Weber et al. A Domain-specific Risk-attitude Scale 281
Copyright # 2002 John Wiley & Sons, Ltd. Journal of Behavioral Decision Making, 15: 263–290 (2002)

significantly smaller in all domains except for gambling and social risks, where the differences were not
significant. Men were also significantly more likely to engage in most risky behaviors than were women,
with the exception of social risks, where women reported significantly greater risk taking. Exhibit 3 also
shows that, for both male and female college students, reported intentions to take risks were lowest for gam-
bling situations (with a mean of 1.65 on a five-point scale) and highest for social risks (with a mean of 3.63
on the same scale).
Discussion of results of Study 3Study 3 was designed to replicate the six-factor model uncovered in Study 1. Even though scale items and
rating scales were slightly different, the six-factor solution received empirical support in Study 3 as well. Our
item substitution did not succeed completely in obtaining a clear factor separation between ethics and health/
safety risk, which suggests that risks in these two domains have common characteristics, as confirmed by the
relatively high subscale correlations (0.67 and 0.61 in Studies 1 and 3, respectively). In general though, items
had moderate to high loadings on their specified factors, and these factors were not highly correlated, which
supports the idea that risk-taking perceptions and preferences are multi-faceted and cannot be captured by a
single measure or index across content domains.
GENERAL DISCUSSION
Our results strongly support the hypothesis that risk taking is domain-specific. This means that—by
definition—conventional risk-attitudes, i.e. risk attitudes inferred from behavior either directly or via utility
functions that are derived from risky choices, are also domain-specific rather than reflections of a stable
attitude or trait. In addition to documenting the domain-specificity of risk attitudes for a far more compre-
hensive set of risk domains than previously compared in a single study, our paper makes three other
contributions.
First, it provides information about the nature of the content-specificity of risk taking. In particular, indi-
vidual, gender, and content domain differences in apparent risk taking seem to be associated primarily with
differences in the perception of the activities’ benefits and risk, rather than with differences in attitude
towards perceived risk.
Second, our paper provides a new risk-attitude scale that allows researchers and practitioners to assess
both conventional risk attitudes and perceived-risk attitudes in six commonly encountered content domains.
For many applications, the reasons for observed individual or domain differences in risk taking are imma-
terial if risk attitudes are measured merely for predictive purposes. In those cases, one or more of the sub-
scales of the Risk-Behavior instrument provided in Appendix C will suffice. Reasons for differences in risk
taking become important, however, if risk attitudes are measured with the goal of influencing the observed
behavior (i.e. convincing an individual or group to make more risk-averse or more risk-seeking choices).
In this case, both conventional risk-attitudes (from the Risk-Behavior Scale) and perceived-risk attitudes
(by regressing risk-behavior scores on perceived risks and benefits; see scale instructions in Appendix D)
need to be assessed, to find whether discrepancies between observed and desired behavior are the result
of (possibly unrealistic) perceptions of risks or benefits or the result of (possibly inappropriate) attitude
towards perceived risk.
Third, our studies provide additional evidence for the hypothesis that perceived-risk attitude, which
factors domain differences in risk perception out of risk behavior, is significantly more consistent
across domains for a particular respondent than conventional risk attitude. Most respondents were
significantly or mildly perceived-risk averse in all content domains. What differed between individuals
282 Journal of Behavioral Decision Making
Copyright # 2002 John Wiley & Sons, Ltd. Journal of Behavioral Decision Making, 15: 263–290 (2002)

(partly as a function of gender) and between domains were perceptions of the benefits and risks of risky
activities.
We would like to end with some speculations about the processes that might underlie the pattern of
responses observed in our three studies and modeled by the risk–return model of equation (1). The
evidence reported is only correlational, leaving the causal direction of the relationship between risk
perception and risk-taking undetermined and equation (1) a purely functional ‘as-if’ model of risk-taking.
What our data show, however, is that personality variables (sensation seeking, tolerance for ambiguity,
gender) affect both risk perception and risk-taking, while having little or no effect on attitude towards
perceived risk. Situational factors (i.e. the content of the decision) on the other hand, also influenced
perceived-risk attitude.
The serendipidous finding of Study 2, i.e. our replication and extension of halo effects in the perception
and integration of the risks and benefits associated with risky choices or behaviors suggests that affective
processes might play a role in risk-taking. Alhakami and Slovic (1994) showed that a frequently observed
inverse relationship between risk and benefit perception (individuals who perceive greater risks also antici-
pate lower benefits across a range of risky activities) is the result of people’s reliance on general affective
evaluations when making risk/benefit judgments. While there is a small literature that links affect and risk
perception going back to Johnson and Tversky (1983), most BDT models of risk taking (including EU
theory, prospect theory, and the risk–return framework) implicitly assume some (cognitive) integration of
probability and outcome information. Until recently, the role of affect in this process and in risk taking
has been largely ignored even though many choice anomalies (patterns of behavior that are hard to explain
within the usual frameworks of BDT) follow easily from the assumption that people decide based on affect
experienced at the time of the decision (see Loewenstein and Lerner, 2001; Loewenstein et al., 2001). This
paper provides additional evidence that affective processes are implicated in risk-taking, possibly in the
following way. Individual or gender differences (e.g. in sensation seeking) may influence people’s affective
response towards risk. Affective responses color perceptions of risks and benefits (Alhakami and Slovic,
1994) which in turn influence risk taking, as shown in our studies. While not providing any direct evidence
about mediating (cognitive or affective) processes, our scales allow for a functional analysis of differences in
risk taking that goes further in providing explanations useful for interventions than any other existing
approach.
The results of this paper agree with Sitkin and Weingart’s (1995) interactional model of risk-taking, in
which situational characteristics as well as person-centered characteristics jointly influence risk-taking.
Situational constraints include the content domain of the risky decision as well as contextual variables
such outcome framing and aspiration levels (Lopes, 1987; March and Shapira, 1992). Person-centered
characteristics include age, gender, culture, and personality. Our results suggest that both sets of variables
seem to influence risk-taking mostly by changing people’s perception of the riskiness and benefits of
decision alternatives, rather than by affecting their willingness to take on more or less risk. This might
explain the lack of success of Coombs’ (1975) unfolding model of risk taking, which assumed that
individuals’ ‘ideal point’ for risk would affect their willingness to take on risk (i.e. their perceived-risk
attitude) rather than their risk perception. Individual differences in ideal points for risk and uncertainty are
measured by Zuckerman’s (1979) construct of sensation seeking, which has some biological basis and
varies with age and gender. While sensation seeking was correlated with risk behavior, as well as risk
perceptions and expected benefits, it was not associated with attitudes towards perceived risk. While
perceived-risk attitudes were more consistent in sign across domains than conventional risk attitudes,
in the sense that most respondents had negative attitudes towards risk as they perceived it in most or
all content domains, perceived-risk attitudes differed in magnitude between domains. Rather than
reflecting a stable individual difference, perceived-risk attitudes in a particular domain may reflect
subjective norms about appropriate levels of risk taking, as suggested by Ajzen and Fishbein’s (1977)
theory of reasoned action.
E. U. Weber et al. A Domain-specific Risk-attitude Scale 283
Copyright # 2002 John Wiley & Sons, Ltd. Journal of Behavioral Decision Making, 15: 263–290 (2002)

ACKNOWLEDGEMENTS
This research was supported by a grant from the John D. and Catherine T. MacArthur Foundation and by NSF grantSES-0079664 to the first author.
REFERENCES
Ajzen I. 1991. The theory of planned behavior. Organizational Behavior and Human Decision Processes, 50: 179–211.Ajzen I, Fishbein M. 1977. Attitude—behavior relations: theoretical analysis and review of empirical research.Psychological Bulletin 84: 888–918.
Alhakami AS, Slovic P. 1994. A psychological study of the inverse relationship between perceived risk and perceivedbenefits. Risk Analysis, 14: 1085–1096.
Arrow KJ. 1971. Essays in the Theory of Risk Bearing. Markham: Chicago.Blais A-R, Weber EU. 2001. Domain-specificity and gender differences in decision making. Risk Decision and Policy, 6:
47–69.Bontempo RN, Bottom WP, Weber EU. 1997. Cross-cultural differences in risk perception: a model-based approach.Risk Analysis, 17: 479–488.
Brockhaus RH. 1982. The psychology of the entrepreneur. In The Encyclopedia of Entrepreneurship, Kent CA, SextonDL, Vesper KG (eds). Prentice Hall: Englewood Cliffs, NJ.
Bromiley P, Curley S. 1992. Individual differences in risk taking. In. Risk-taking Behavior, Yates JF (ed.). John Wiley:New York.
Browne MW, Cudeck R. 1993. Alternative ways of assessing model fit. In Testing Structural Equation Models, BollenKA, Long JS (eds). Sage Publications: Newbury Park, CA.
Browne MW, Cudeck R, Tateneni K, Mels G. 1999. CEFA: Comprehensive Exploratory Factor Analysis, Version 1.03.[WWW document and computer program]. http://quantrm2.psy.ohio-date.edu/browne/
Budner S. 1962. Intolerance of ambiguity as a personality variable. Journal of Personality, 30: 29–50.Byrnes JP, Miller DC, Schafer WD. 1999. Gender differences in risk taking: a meta-analysis. Psychological Bulletin,
125: 367–383.Coombs CH. 1975. Portfolio theory and the measurement of risk. In Human Judgment and Decision (pp. 63–68), Kaplan
MF, Schwartz S (eds). Academic Press: New York.Cooper AC, Woo CY, Dunkelberg WC. 1988. Entrepreneurs’ perceived chances for success. Journal of BusinessVenturing, 3: 97–108.
Dyer JS, Sarin RK. 1982. Relative risk aversion. Management Science, 28: 8.Eagly AH, Chaiken S. 1993. The Psychology of Attitudes. Harcourt, Brace, Jovanovich: Fort Worth, TX.Goldstein WM, Weber EU. 1997. Content and discontent: indications and implications of domain specificity in
preferential decision making. In Research on Judgment and Decision Making (pp. 566–617), Goldstein WM, HogarthRM (eds). Cambridge University Press: Cambridge.
Gorsuch RL. 1983. Factor Analysis. Erlbaum: Hillsdale, NJ.Johnson EJ, Tversky A. 1983. Affect, generalization, and the perception of risk. Journal of Personality and SocialPsychology, 45: 20–31.
Kahneman D, Tversky A. 1979. Prospect theory: an analysis of decision under risk. Econometrica, 47: 263–291.Keller LR. 1985. An empirical investigation of relative risk aversion. IEEE Transactions of Systems, Man, andCybernetics, 15: 475–482.
Keppel G. 1991. Design and Analysis: A Researcher’s Handbook. Prenctice Hall: Englewood Cliffs, NJ.Kogan N, Wallach MA. 1964. Risk-taking: A Study in Cognition and Personality. Holt: New York.Lopes LL. 1987. Between hope and fear: the psychology of risk. Advances in Experimental Social Psychology, 20:
255–295.Loewenstein G, Lerner JS. 2001. The role of affect in decision making. In Handbook of Affective Science, Davidson R,
Scherer K, Goldsmith H (eds). Oxford University Press: New York.Loewenstein GF, Weber EU, Hsee CK, Welch E. 2001. Risk as feelings. Psychological Bulletin, 127: 267–286.MacCrimmon KR, Wehrung DA. 1986. Taking Risks: The Management of Uncertainty. Free Press: New York.MacCrimmon KR, Wehrung DA. 1990. Characteristics of risk taking executives. Management Science, 36: 422–435.March JG, Shapira Z. 1987. Managerial perspectives on risk and risk taking. Management Science, 33: 1404–1418.March JG, Shapira Z. 1992. Variable risk preferences and the focus of attention. Psychological Review, 99: 172–183.
284 Journal of Behavioral Decision Making
Copyright # 2002 John Wiley & Sons, Ltd. Journal of Behavioral Decision Making, 15: 263–290 (2002)
Mellers BA, Schwartz A, Weber EU. 1997. Do risk attitudes reflect in the eye of the beholder? In Choice, Decision, andMeasurement (pp. 57–71), Marley AAJ (ed.). Lawrence Erlbaum: Hillsdale, NJ.
Nunnally JC, Bernstein IH. 1994. Psychometric Theory (3rd edn). McGraw-Hill: New York.Paulhus DL. 1984. 2-component models of socially desirable responding. Journal of Personality and Social Psychology,
46: 598–609.Paulhus DL. 1991. Measurement and control of response bias. In Measures of Personality and Social Psychological
Attitudes (pp. 17–59), Robinson JP, Shaver PR, et al. (eds). Academic Press: San Diego.Pratt JW. 1964. Risk aversion in the small and in the large. Econometrica, 32: 122–136.Sarin RK, Weber M. 1993. Risk-value models. European Journal of Operations Research, 70: 135–149.Schoemaker PJH. 1990. Are risk-preferences related across payoff domains and response modes? Management Science,
36: 1451–1463.Schoemaker PJH. 1993. Determinants of risk-taking: behavioral and economic views. Journal of Risk and Uncertainty, 6:
49–73.Schwartz A, Hasnain M. 2001. Risk perception and risk attitude in informed consent. Working paper, Department of
Medical Education, University of Illinois at Chicago.Sitkin SB, Weingart LR. 1995. Determinants of risky decision making behavior: a test of the mediating role of risk
perceptions and risk propensity. Academy of Management Journal, 38: 1573–1592.Slovic P. 1964. Assessment of risk taking behavior. Psychological Bulletin, 61: 330–333.Slovic P. 1997. Trust, emotion, sex, politics, and science: surveying the risk-assessment battlefield. In Psychological
Perspectives to Environmental and Ethical Issues in Management (pp. 277–313), Bazerman M, Messick D, TenbrunselA, Wade-Benzoni K (eds). Jossey-Bass: San Francisco, CA.
Slovic P, Fischhoff B, Lichtenstein S. 1986. The psychometric study of risk perception. In Risk Evaluation andManagement (pp. 3–24), Covello VT, Menkes J, Mumpower J (eds). Plenum Press: New York.
Von Winterfeldt D, Edwards W. 1986. Decision Analysis and Behavioral Research. Cambridge University Press:Cambridge.
Weber EU. 1988. A descriptive measure of risk. Acta Psychologica, 69: 185–203.Weber EU. 1997. The utility of measuring and modeling perceived risk. In Choice, Decision, and Measurement: Essays
in Honor of R. Duncan Luce (pp. 45–57), Marley AAJ (ed.). Erlbaum: Mahwah, NJ.Weber EU. 1998. Who’s afraid of a little risk? New evidence for general risk aversion. In Decision Research from
Bayesian Approaches to Normative Systems: Reflections on the Contributions of Ward Edwards, Shanteau J, MellersBA, Schum D (eds). Kluwer Academic Press: Norwell, MA.
Weber EU. 2001a. Personality and risk taking. In International Encyclopedia of the Social and Behavioral Sciences,Smelser NJ, Baltes PB (eds).
Weber EU. 2001b. Decision and choice: risk, empirical studies. In International Encyclopedia of the Social andBehavioral Sciences, Smelser NJ, Baltes PB (eds).
Weber EU, Anderson C, Birnbaum MH. 1992. A theory of perceived risk and attractiveness. Organizational Behaviorand Human Decision Processes, 52: 492–523.
Weber EU, Bottom WP. 1989. Axiomatic measures of perceived risk: some tests and extensions. Journal of BehavioralDecision Making, 2: 113–131.
Weber EU, Hsee CK. 1998. Cross-cultural differences in risk perception but cross-cultural similarities in attitudestowards risk. Management Science, 44: 1205–1218.
Weber EU, Kirsner B. 1997. Reasons for rank-dependent utility evaluation. Journal of Risk and Uncertainty, 14: 41–61.Weber EU, Milliman R. 1997. Perceived risk attitudes: relating risk perception to risky choice. Management Science, 43:
122–143.Yates JF, Stone ER. 1992. The risk construct. In Risk-taking Behavior, Yates JF (ed.). John Wiley: New York.Zuckerman M. 1994. Behavioral Expressions and Biosocial Bases of Sensation Seeking. Cambridge University Press:
New York.
Authors’ biographiesNancy Betz is Professor of Psychology at The Ohio State University. She is a prolific scholar and academic leader in thearea of vocational psychology. Her work has focused on barriers to women’s pursuit of careers in the sciences and engi-neering, among these mathematics anxiety and low career-related self-efficacy expectations.
Ann-Renee Blais earned her PhD in Quantitative Psychology at The Ohio State University. Her dissertation focusedon the role of individual differences and situational appraisals on coping in stressful situations. She is currently a post-doctoral researcher at the Center for Interuniversity Research and Analysis on Organizations (CIRANO) in Montreal,Quebec.
E. U. Weber et al. A Domain-specific Risk-attitude Scale 285
Copyright # 2002 John Wiley & Sons, Ltd. Journal of Behavioral Decision Making, 15: 263–290 (2002)

Elke U. Weber is Professor of Psychology and Management at Columbia University. Her research addresses the inter-relationship between perceptual, motivational, and memory processes in human decision making.
Authors’ addresses:
Nancy Betz, The Ohio State University, USA
Ann-Renee Blais, Center for Interuniversity Research and Analysis on Organizations, Montreal, Quebec, Canada.
Elke U. Weber, Columbia University, USA
APPENDIX A
For each of the following statements, please indicate the likelihood of engaging in each activity. Provide a
rating from 1 to 5, using the following scale:
1 2 3 4 5
Extremely unlikely Not sure Extremely likely
1. _______ Admitting that your tastes are different from those of your friends. (S)
2. _______ Arguing with a friend who has a very different opinion on an issue. (S)
3. _______ Asking your boss for a raise. (S)
4. _______ Betting a day’s income at the horse races. (F)
5. _______ Buying an illegal drug for your own use. (E)
6. _______ Chasing a tornado by car to take photos that you can sell to the press. (R)
7. _______ Cheating a fair amount on your income tax. (E)
8. _______ Cheating on an exam. (E)
9. _______ Co-signing a new car loan for a friend. (F)
10. _______ Dating someone that you are working with. (S)
11. _______ Deciding to share an apartment with someone you don’t know well. (S)
12. _______ Disagreeing with your father on a major issue. (S)
13. _______ Driving home after you had three drinks in the last two hours. (E)
14. _______ Eating ‘expired’ food products that still ‘look okay’. (H)
15. _______ Exploring an unknown city or section of town. (R)
16. _______ Forging somebody’s signature. (E)
17. _______ Frequent binge drinking. (H)
18. _______ Going camping in the wild. (R)
19. _______ Going down a ski run that is too hard or closed. (R)
20. _______ Going on a safari in Kenya. (R)
21. _______ Going on a two-week vacation in a foreign country without booking accommodations
ahead. (R)
22. _______ Going whitewater rafting at high water in the spring. (R)
23. _______ Ignoring some persistent physical pain by not going to the doctor. (H)
24. _______ Illegally copying a piece of software. (E)
25. _______ Taking a medical drug that has a high likelihood of negative side effects. (H)
26. _______ Traveling on a commercial airplane. (R)
27. _______ Plagiarizing a term paper. (E)
28. _______ Engaging in unprotected sex. (H)
286 Journal of Behavioral Decision Making
Copyright # 2002 John Wiley & Sons, Ltd. Journal of Behavioral Decision Making, 15: 263–290 (2002)

29. _______ Investing 10% of your annual income in a blue chip stock. (F)
30. _______ Investing 10% of your annual income in a very speculative stock. (F)
31. _______ Investing 10% of your annual income in government bonds (treasury bills). (F)
32. _______ Investing in a business that has a good chance of failing. (F)
33. _______ Lending a friend an amount of money equivalent to one month’s income. (F)
34. _______ Moving to a new city. (S)
35. _______ Never using sunscreen when you sunbathe. (H)
36. _______ Never wearing a seatbelt. (H)
37. _______ Not having a smoke alarm in or outside of your bedroom. (H)
38. _______ Openly disagreeing with your boss in front of your coworkers. (S)
39. _______ Periodically engaging in a dangerous sport (e.g. mountain climbing or sky diving). (R)
40. _______ Regularly riding your bicycle without a helmet. (H)
41. _______ Shoplifting a small item (e.g. a lipstick or a pen). (E)
42. _______ Smoking a pack of cigarettes per day. (H)
43. _______ Speaking your mind about an unpopular issue at a social occasion. (S)
44. _______ Spending money impulsively without thinking about the consequences. (F)
45. _______ Stealing an additional TV cable connection. (E)
46. _______ Taking a day’s income to play the slot-machines at a casino. (F)
47. _______ Taking a job where you get paid exclusively on a commission basis. (F)
48. _______ Trying bungee jumping. (R)
49. _______ Using office supplies for your personal business. (E)
50. _______ Wearing unconventional clothes. (S)
Note: E¼ ethical, F¼financial, H¼ health/safety, R¼ recreational, and S¼ social items.
APPENDIX B: SCALES USED TO ESTABLISH CONVERGENT AND DISCRIMINANT
VALIDITY OF THE RISK-BEHAVIOR SCALE
(1) The Choice Dilemma Questionnaire (Kogan and Wallach, 1964) is a 12-item measure of risk attitude.
A sample item of this scale is: ‘Mr B, a 45-year-old accountant, has recently been informed by his physician
that he has developed a severe heart ailment. The disease would be sufficiently serious to force Mr. B to
change many of his strongest life habits—reducing his work load, drastically changing his diet, giving up
favorite leisure-time pursuits. The physician suggests that a delicate medical operation could be attempted
which, if successful, would completely relieve the heart condition. But its success could not be assured, and
in fact, the operation might prove fatal’.
After reading this scenario, the participants are asked to check the lowest probability that they would con-
sider acceptable to make it worthwhile for Mr B to undergo the operation, from ‘The chances are 1 in 10 that
the operation will be successful’ to ‘The chances are 9 in 10 that the operation will be successful’ (with 3 in
10, 5 in 10, and 7 in 10). The participants can also indicate they believe that, no matter what the probabilities,
Mr B should not undergo the operation (chances of 10 in 10). A score is computed by adding the number
corresponding to the odds selected with overall scores between 12 and 120. Kogan and Wallach (1964)
reported internal consistencies (Cronbach’s alpha) of, respectively, 0.53 (n¼ 114) and 0.62 (n¼ 103) for
men and women. In our sample, the coefficient alpha was 0.69 overall.
(2) The Intolerance of Ambiguity Scale (Budner, 1962) is a 16-item scale (eight positive and eight nega-
tive). Example of an item would be, for item 5,’ What we are used to is always preferable to what is
unfamiliar’. There are six response categories for each item, from ‘Strong agreement’ (scored as 7) to
E. U. Weber et al. A Domain-specific Risk-attitude Scale 287
Copyright # 2002 John Wiley & Sons, Ltd. Journal of Behavioral Decision Making, 15: 263–290 (2002)

‘Strong disagreement’ (scored as 1). An overall score is computed by adding responses across all items (with
reverse scoring for the negative items), with a range of 16 to 112. Budner (1962) reported internal consis-
tencies (Cronbach’s alpha) of 0.39 to 0.62, with various samples, and an mean test–retest correlation of 0.85
(N¼ 80), for different time intervals. In our sample, the coefficient alpha was 0.68.
(3) The Sensation-seeking Scale version V (Zuckerman, 1994) is composed of 40 forced-choice items,
divided in four subscales (10 items per subscale): thrill and adventure seeking (TAS), experience seeking
(ES), disinhibition (Dis.), and boredom susceptibility (BS). For each item, two options are presented, and
the respondent chooses the one that best describes what he or she likes or the way he or she feels. An example
of a disinhibition item is ‘(a) I like ‘‘wild’’ uninhibited parties. or (b) I prefer quiet parties with good con-
versation’. One point is given for each choice that is thought to represent the four subscales. In the example
presented above, one point would be given, in the Dis. subscale, to (a). Hence, the scores for the subscales
can range from 0 to 10.
Zuckerman (1994) reported reliabilities of 0.83–0.86 for the total score, 0.77–0.82 for TAS, 0.61–0.67 for
ES, 0.74–0.78 for Dis., and 0.56–0.65 for BS. We computed the coefficient alphas in our sample and found
the following values: 0.76 for the total score, 0.73 (TAS), 0.61 (ES), 0.70 (Dis.), and 0.54 (BS), which are
close to the values reported by Zuckeman (1994).
(4) A measure of social desirability (SDR), the Balanced Inventory of Desirable Responding (BIDR)
Version 6 (Paulhus, 1984) was included to investigate discriminant validity. The BIDR measures self-decep-
tive positivity (SDE), i.e. the tendency to give honest but positively biased answers, and impression manage-
ment (IM), i.e. deliberate self-presentation (Paulhus, 1991). Respondents rate their agreement with the 40
statements of the scale on a continuum from 1 (not true) to 7 (very true), with 20 statements measuring SDE
and 20 statements, IM. ‘I don’t care to know what other people really think of me’ is an item measuring SDE
and ‘I never cover up my mistakes’ measures IM.
Scores are computed by giving one point to each extreme response (6 or 7) (reversing the negative items),
with a range of scores, on both scales, of 0 to 20. All 40 items can also be summed to give an overall measure
of social desirability. Paulhus (1991) reported internal consistency coefficients (for various samples)
(Cronbach’s alpha) from 0.68 to 0.80 for SDE, from 0.75 to 0.86 for IM, and of 0.83 for SDR. He also found
test–retest correlations of 0.69 for SDE, and 0.65 for IM, over a 5-week period. In our sample, the alphas
were the following: 0.76 for SDE, 0.81 for IM, and 0.84 for SDR, and these values are quite close to the ones
reported by Paulhus (1991).
APPENDIX C
For each of the following statements, please indicate your likelihood of engaging in each activity or beha-
vior. Provide a rating from 1 to 5, using the following scale:
1 2 3 4 5
Very unlikely Unlikely Not sure Likely Very likely
1. Admitting that your tastes are different from those of your friends. (S) _______
2. Going camping in the wilderness, beyond the civilization of a campground. (R) _______
3. Betting a day’s income at the horse races. (G) _______
4. Buying an illegal drug for your own use. (H) _______
5. Cheating on an exam. (E) _______
6. Chasing a tornado or hurricane by car to take dramatic photos. (R) _______
7. Investing 10% of your annual income in a moderate growth mutual fund. (I) _______
288 Journal of Behavioral Decision Making
Copyright # 2002 John Wiley & Sons, Ltd. Journal of Behavioral Decision Making, 15: 263–290 (2002)

8. Consuming five or more servings of alcohol in a single evening. (H) _______
9. Cheating by a significant amount on your income tax return. (E) _______
10. Disagreeing with your father on a major issue. (S) _______
11. Betting a day’s income at a high stake poker game. (G) _______
12. Having an affair with a married man or woman. (E) _______
13. Forging somebody’s signature. (E) _______
14. Passing off somebody else’s work as your own. (E) _______
15. Going on a vacation in a third-world country without prearranged travel and hotel
accommodations. (R) _______
16. Arguing with a friend about an issue on which he or she has a very different opinion. (S) _______
17. Going down a ski run that is beyond your ability or closed. (R) _______
18. Investing 5% of your annual income in a very speculative stock. (I) _______
19. Approaching your boss to ask for a raise. (S) _______
20. Illegally copying a piece of software. (E) _______
21. Going whitewater rafting during rapid water flows in the spring. (R) _______
22. Betting a day’s income on the outcome of a sporting event (e.g. baseball,
soccer, or football). (G) _______
23. Telling a friend if his or her significant other has made a pass at you. (S) _______
24. Investing 5% of your annual income in a conservative stock. (I) _______
25. Shoplifting a small item (e.g. a lipstick or a pen). (E) _______
26. Wearing provocative or unconventional clothes on occasion. (S) _______
27. Engaging in unprotected sex. (H) _______
28. Stealing an additional TV cable connection off the one you pay for. (E) _______
29. Not wearing a seatbelt when being a passenger in the front seat. (H) _______
30. Investing 10% of your annual income in government bonds (treasury bills). (I) _______
31. Periodically engaging in a dangerous sport (e.g. mountain climbing or sky diving). (R) _______
32. Not wearing a helmet when riding a motorcycle. (H) _______
33. Gambling a week’s income at a casino. (G) _______
34. Taking a job that you enjoy over one that is prestigious but less enjoyable. (S) _______
35. Defending an unpopular issue that you believe in at a social occasion. (S) _______
36. Exposing yourself to the sun without using sunscreen. (H) _______
37. Trying out bungee jumping at least once. (R) _______
38. Piloting your own small plane, if you could. (R) _______
39. Walking home alone at night in a somewhat unsafe area of town. (H) _______
40. Regularly eating high cholesterol foods. (H) _______
Note: E¼ ethical, I¼ investment, G¼ gambling, H¼ health/safety, R¼ recreational, and S¼ social items.
APPENDIX D
Instructions and scales for risk perceptions scale
People often see some risk in situations that contain uncertainty about what the outcome or consequences
will be and for which there is the possibility of ‘bad’ consequences. However, riskiness is a very personal and
intuitive notion, and we are interested in your gut level assessment of how risky each situation is.
For each of the following statements, please indicate how risky you perceive each situation. Provide a
rating from 1 to 5, using the following scale:
E. U. Weber et al. A Domain-specific Risk-attitude Scale 289
Copyright # 2002 John Wiley & Sons, Ltd. Journal of Behavioral Decision Making, 15: 263–290 (2002)

1 2 3 4 5
Not at all Moderately Extremely risky
risky risky
Instructions and scales for expected benefits scale
For each of the following statements, please indicate the benefits you would obtain from each situation.
Provide a rating from 1 to 5, using the following scale:
1 2 3 4 5
No benefits Moderate Great benefits
at all benefits
290 Journal of Behavioral Decision Making
Copyright # 2002 John Wiley & Sons, Ltd. Journal of Behavioral Decision Making, 15: 263–290 (2002)


