
Single Molecule Detection using Optical...
58
Single Molecule Detection using Optical Waveguide Master’s Thesis in Applied Physics MATHIAS ELMESKOG Department of Applied Physics Division of Biological Physics Chalmers University of Technology Gothenburg, Sweden 2013
Transcript of Single Molecule Detection using Optical...
Single Molecule Detection using OpticalWaveguideMaster’s Thesis in Applied Physics
MATHIAS ELMESKOG
Department of Applied PhysicsDivision of Biological PhysicsChalmers University of Technology
Gothenburg, Sweden 2013


THESIS FOR THE DEGREE OF MASTER OF SCIENCE
Single Molecule Detection usingOptical Waveguide
MATHIAS ELMESKOG
Department of Applied PhysicsDivision of Biological Physics
Chalmers University of TechnologyGothenburg, Sweden 2013

Single Molecule Detection using Optical Waveguide
MATHIAS ELMESKOG
©MATHIAS ELMESKOG, 2013
Department of Applied PhysicsDivision of Biological PhysicsSE-412 96 GothenburgSwedenTelephone +46(0)31-772 10 00
Printed at Chalmers Reproservice Gothenburg, 2013
Cover illustration: In the image on the front page the optical waveguide platform is illu-minated by a 532 nm laser from the side. Here the waveguide is placed on the stage of aupright microscope and a 20x objective used for alignment purposes. The platform is athree layer symmetric optical waveguide with a etched well at the center. This well is 2by 2mm and ⇡ 3µm deep. ©Mathias Elmeskog

Single Molecule Detection using Optical Waveguide
MATHIAS ELMESKOGDepartment of Applied PhysicsDivision of Biological PhysicsChalmers University of TechnologyGothenburg, Sweden 2013
Abstract
Molecular interactions with single molecule sensitivity is a growing field with application inpharmaceutical development and diagnostics. Existing techniques that can be used for singlemolecule interaction studies, such as total internal reflection fluorescence (TIRF) microscopyare often expensive and complicated to use. They also have critical limitations, for example theneed of labeling with fluorophores.
In this thesis a novel method based on a single mode optical waveguide is investigated forsurface binding with single molecule sensitivity. A three layer planar waveguide is used wherethe core layer is a light carrier. The refractive index of the cladding layers are matched to thatof water in order to make it compatible with measurements in a liquid environment. Mountedunder a regular upright microscope, the evanescent field in the waveguide can be used for ex-citation of fluorophores or for monitoring the scattering intensity. In this project the lattermethod was used exclusively. It was shown 20 nm gold nano particles bound to, or very closeto, the core layer surface of the optical waveguide could be visualized. The ability to performreal time measurements makes it possible to determine if a gold nano particle binds reversiblyor irreversibly to the surface. The possibility to functionalize the core layer surface in di↵erentways has also been studied.
The concept was further developed into a biosensing technique using an antibody sandwich assayto detect amyloid-� peptides at very low concentrations. This is of interest due to amyloid-�peptides suspected role in developing plaque in brain tissue which lead to Alzheimer’s disease.To be able to detect traces of this peptide in blood plasma at an early stage could help developtechniques to inhibit or stop the development process of the disease. It was found to be possibleto detect amyloid-� 1-37, 1-37 indicates the number of amino acids in the peptide, down toat least a concentration of 100 fM in the bulk solution added to the waveguide chip using thewaveguide technique.
Keywords: Optical waveguide, evanescent field, single molecule sensitivity, surface sensitivemeasurement, biosensing, Alzheimer’s disease, amyloid-� peptide.


Acknowledgements
I would like to take the opportunity to thank all the people who have not only made this projectpossible but also fun and personal rewarding.
Fredrik Hook my main supervisor and examiner. For giving me the opportunity to do thisproject and be a part of this scientific adventure. All the insights and discussions not onlyabout the project but also intriguing and sometimes quite strange topics.
Bjorn Agnarsson for all the support and help with everything! Thank you. And the pizza atFoxes.
Anders Lundgren for immense patience of a physicists ignorance towards chemistry and bi-ology. All the guidance and hands on training in the lab, insights and knowledge.
Biological Physics Group for the openness and warmth making it easy to go to work. Formaking me not once hesitate to ask a question to anybody in the group and always gettingan enthusiastic answer back. For the ”fika”breaks with all the good discussions and laughs.
Friends It is quite convenient to have most of your closest friends grouped up and in thesame boat. Long studying days that sometimes gets longer due to completely unrelateddiscussions sometimes they get shorter due to great teamwork and sharing of knowledge.Looking back later in my life I will most certainly remember these years as laughs and funtimes. This is because of you.
Family The road to get to this point have been all but straight. For the love over the years thesupport in tough times and pushing me to continue.
Ewa for the understanding, love and support late evenings and early sundays when work havebeen necessary. And kissing in the staircase.
Mathias Elmeskog, Gothenburg, 22 September 2013


Contents
1 Introduction 1
1.1 Background and Motivation . . . . . . . . . . . . . . . . . . . . . . . . . . . . . . 11.1.1 Alzheimer’s Disease . . . . . . . . . . . . . . . . . . . . . . . . . . . . . . 11.1.2 Techniques for Measurement of Molecular Interactions used Today . . . . 2
1.2 Thesis Outline . . . . . . . . . . . . . . . . . . . . . . . . . . . . . . . . . . . . . 2
2 Evanescent-Waveguide 4
2.1 Optical Theory for Waveguides . . . . . . . . . . . . . . . . . . . . . . . . . . . . 42.1.1 Maxwell’s Equations . . . . . . . . . . . . . . . . . . . . . . . . . . . . . . 52.1.2 Characteristics of Symmetric Waveguides . . . . . . . . . . . . . . . . . . 6
2.2 Experimental Setup . . . . . . . . . . . . . . . . . . . . . . . . . . . . . . . . . . 7
3 Biological Foundation 9
3.1 Vesicles and Lipid Bilayers . . . . . . . . . . . . . . . . . . . . . . . . . . . . . . . 93.2 Ligand-Receptor Kinetics . . . . . . . . . . . . . . . . . . . . . . . . . . . . . . . 10
3.2.1 Ligand-Receptor Interaction . . . . . . . . . . . . . . . . . . . . . . . . . . 113.2.2 Ligand-Receptor Dynamics . . . . . . . . . . . . . . . . . . . . . . . . . . 113.2.3 The Langmuir Model . . . . . . . . . . . . . . . . . . . . . . . . . . . . . . 13
3.3 Biological Functionalization of Surfaces . . . . . . . . . . . . . . . . . . . . . . . 163.3.1 Creating a Functionalized Supported Lipid Bilayer . . . . . . . . . . . . . 163.3.2 Silanization of Glass Surfaces . . . . . . . . . . . . . . . . . . . . . . . . . 17
3.4 Introduction to Alzheimer’s Disease . . . . . . . . . . . . . . . . . . . . . . . . . 183.4.1 Structures and Properties of Amyloid-� Peptides . . . . . . . . . . . . . . 193.4.2 Development and E↵ects on the Brain with Alzheimer’s Disease . . . . . 193.4.3 Available Treatments and Diagnostics . . . . . . . . . . . . . . . . . . . . 19
4 Reference Techniques 20
4.1 QCM-D - Quartz Crystal Microbalance with Dissipation monitoring . . . . . . . 204.2 SPR - Surface Plasmon Resonance . . . . . . . . . . . . . . . . . . . . . . . . . . 224.3 NTA - Nano-particle Tracking Analysis . . . . . . . . . . . . . . . . . . . . . . . 22
5 Materials and Methods 23
5.1 Gold Nano Particles Fabrication and Coating . . . . . . . . . . . . . . . . . . . . 235.1.1 Fabrication of Gold Nano Particles . . . . . . . . . . . . . . . . . . . . . . 23
i

CONTENTS
5.1.2 Coating with Polyethylene Glycol . . . . . . . . . . . . . . . . . . . . . . . 235.2 Bilayer Formation . . . . . . . . . . . . . . . . . . . . . . . . . . . . . . . . . . . 24
5.2.1 Bilayer Formation with QCM-D . . . . . . . . . . . . . . . . . . . . . . . 245.2.2 Bilayer Formation with the Evanescent Waveguide Technique . . . . . . . 24
5.3 NTA Concentration Characterization . . . . . . . . . . . . . . . . . . . . . . . . . 245.4 Immuno Assay for Amyloid � Detection . . . . . . . . . . . . . . . . . . . . . . . 24
5.4.1 QCM-D Preparation and Measurement . . . . . . . . . . . . . . . . . . . 255.4.2 Evanescent Waveguide Preparation and Measurements . . . . . . . . . . . 265.4.3 SPR Preparation and Measurements . . . . . . . . . . . . . . . . . . . . . 26
6 Results 286.1 Gold Nano Particle Size and Visibility in Waveguide System . . . . . . . . . . . . 28
6.1.1 Size Distribution of Gold Nano Particles . . . . . . . . . . . . . . . . . . . 286.1.2 Concentration Characterization . . . . . . . . . . . . . . . . . . . . . . . . 306.1.3 20 nm Gold Nano Particles in the Waveguide System . . . . . . . . . . . . 30
6.2 Dynamic Range Measurements . . . . . . . . . . . . . . . . . . . . . . . . . . . . 326.2.1 Comparison Between Intensity and Number of Surface Bound Gold Nano
Particles . . . . . . . . . . . . . . . . . . . . . . . . . . . . . . . . . . . . 336.3 Validation of Amyloid-� 1-37 Detection using QCM-D and SPR . . . . . . . . . . 356.4 Immuno Assay for Detection of Amyloid-� 1-37 using the Optical Waveguide System 37
7 Discussion 407.1 Gold Nano Particle Characterization using NTA and SEM . . . . . . . . . . . . . 407.2 QCM-D Measurements and Comparison with the Waveguide System . . . . . . . 407.3 Amyloid-� Measurements using Optical Waveguide . . . . . . . . . . . . . . . . . 417.4 Image and Data Processing . . . . . . . . . . . . . . . . . . . . . . . . . . . . . . 43
8 Conclusion 44
9 Future Perspectives 459.1 Solving Blocking and Functionalization Problems . . . . . . . . . . . . . . . . . . 459.2 Multiple Wavelength Measurements for Ratio Determination of Di↵erent Amyloid-
� Peptides . . . . . . . . . . . . . . . . . . . . . . . . . . . . . . . . . . . . . . . . 459.3 Smartphone Applications . . . . . . . . . . . . . . . . . . . . . . . . . . . . . . . 45
Bibliography 48
ii

1Introduction
Biological physics is a fast growing field of study with enormous potential. It spansfrom studying single molecule interactions to construction of mind controlled mechan-ical hand prosthesis [1]. In the quest for knowledge, human kind strives to study theextremes of any unit scale irrespective if it is length, time, speed or concentration. To
achieve this, scientist develop tools in cunning ways to measure and observe passages of eventswhich their own senses lack the ability to comprehend.
1.1 Background and Motivation
”Why do we do this?” is a question my supervisor Bjorn Agnarsson often remind me to have inback of my mind. This will not only keep the work on the right track it will also make sure thatthe work we do have some kind of meaning. In this small section the work done is motivatedfrom both the point why this is important in a lager picture and the advantages it has comparedto other available techniques.
1.1.1 Alzheimer’s Disease
Alzheimer’s disease is the most common form of dementia in the world today with approximately20-30 million cases [2, 3]. The clinical signs are behavioral changes, progressive cognitive dete-rioration and memory loss. It is believed that peptide amyloid-� accumulates in brain tissue inthe earliest stages of the disease [3]. This makes it much desired to measure this accumulation ofamyloid-�. Unfortunately it is quite late in the dementia process that these plaques become vis-ible in scans with the techniques available today. It is suggested that high levels of amyloid-�42or the ratio amyloid-�42/amyloid-�40 in plasma is a strong indicator for future risk to developAlzheimer’s disease [4]. However there are reports that conclude the opposite and this could beaccording to H. Zetterberg, professor of neurochemistry at Gothenburg University, ”...due to thefact that A�42 is notoriously di�cult to measure in plasma.” [2].
The diagnosis of Alzheimer’s disease is a di�cult process even with technology available to-day and it includes many di↵erent aspects, including brain scans, blood tests, analyzing patient
1

Chapter 1. Introduction
medical history, studies of behavioral changes and medical revisits. To make any of these stepseasier, or to be able to find a method that can replace two or more of this components wouldsimplify this process a lot. There are today no available treatments for Alzheimer’s disease butthere have been progress and there is hope for using low-density lipoprotein receptor–relatedprotein-1 (LRP) to clear amyloid-� from the brain [5].
In this work an attempt to develop a surface based technique to detect amyloid-� peptidesat very low concentration is presented using an optical waveguide platform.
1.1.2 Techniques for Measurement of Molecular Interactions used Today
There are several established techniques for measurement of molecules binding to a surface, twoof these are quartz crystal microbalance with dissipation (QCM-D) and surface plasmon reso-nance (SPR). These two techniques were used in this work as reference techniques and it willbe shown that they have some crucial limitations compared to the optical waveguide technique.The most important one is the sensitivity region, which will be described later in this report.
In the optical waveguide system an evanescent field is used to make measurements surfacesensitive. Why and how this evanescent field is created is presented in chapter 2. Total internalreflection fluorescence (TIRF) is another technique that uses evanescent fields in measurements.The technique used in this work relates very much to TIRF but has some advantages over TIRF,as it is cheaper and simpler, it has a larger area of illumination, and the penetration depth canbe tuned. The most important di↵erence is that in the waveguide system the molecules do nothave to be stained with fluorophore. For an in depth text on TIRF the reader is referred to atext by Daniel Axelrod [6].
There are other techniques to observe gold nano particles on a surface, one example is darkfield microscopy but they have some crucial limitations. With TIRF and the waveguide systemthere is the possibility to measure during the binding process. This is not possible with darkfield microscopy because the solution on top of the sample must be rinsed before the surfacebecomes visible. Also the gold nano particles must be much larger compared to the gold nanoparticles that can be used in the waveguide system in order to be observed, the limit size forobservation in dark field microscopy is about 60 nm. This is quite large relative to the particlesthat can be seen in the waveguide system making the particles less a↵ected by gravity and havefaster di↵usion rate.
1.2 Thesis Outline
The author has a background in physics making it natural if this reflects in the thesis. Someparts about chemistry and biology is quite basic while some areas of physics and mathematicsis not explained in depth.
Chapter 2 - Evanescent-Waveguide In this chapter the optical waveguide platform is ex-plained. The physics behind the exponential decaying evanescent wave is also discussed.The experimental setup used in this work is explained.
2

1.2. Thesis Outline
Chapter 3 - Biological Foundation In order to understand and be able to analyze the re-sults, some basic knowledge about biological systems is useful. This chapter is an intro-duction to molecular dynamics and theoretical models for molecular binding to surfaces.
Chapter 4 - Reference Techniques The techniques used for characterization and referenceare explained from a theoretical standpoint and their relevance for this thesis.
Chapter 5 - Materials and Methods This section explains the experiments, material usedand preparations of the measurements.
Chapter 6 - Results In this chapter the results are briefly presented and explained.
Chapter 7 - Discussion Here the results are discussed in more depth. Also reflections andthoughts of the preparation steps are discussed and how they could e↵ect the results.
Chapter 8 - Conclusions The conclusions drawn from the work is presented.
Chapter 9 - Future Perspective During the time working with this project a lot of thoughtson how to further develop the method. In this chapter some of the ideas are presented.Also suggestions of further measurements validating the presented work are discussed.
3

2Evanescent-Waveguide
The main method during this thesis is an evanescent waveguide technique for measure-ments on biological systems in liquid environments. In this chapter the three layerwaveguides structure and functionality will be discussed more in depth. Since the corelayer, the layer where the measurements are done, is a spin on glass material that is
in surface properties very similar to silicon dioxide glass on the surface after plasma treatmentthe possibilities for surface modification and functionalization of various kinds are many.
2.1 Optical Theory for Waveguides
An optical waveguide is a structure of materials with di↵erent refractive indices that confineslight within its core. The most common and used waveguide is an optical fiber that has a largearea of use, from signal transfers to house decorations. A propagating wave in the core createsan exponentially decaying evanescent field at the edge of the core layer and into the surroundingmaterial as shown in figure 2.1. This evanescent tail can be used to visualize nano particles closeto the surface.
n3
n2
n1
xz
y
a
-a
Figure 2.1: Structure of a layer slab planar waveguide. n1, n2 and n3 are the refractive indices ofthe di↵erent materials. The thickness of the core layer is 2a with x-coordinate zero at the center ofthe core layer (the green layer).
4

2.1. Optical Theory for Waveguides
2.1.1 Maxwell’s Equations
When for example a gold nano particle is very close to the core layer surface the particle willscatter light. This scattered light comes from the evanescent field from the wave guide. To un-derstand where the evanescent field comes from and how light behave in a waveguide structurethere is natural to look at Maxwell’s equations.
Since the layers are non-magnetic and non-conductive material the reduced Maxwell’s equa-tions can be used,
r ·E = 0 (2.1)
r ·H = 0 (2.2)
r⇥E = �µ0@H
@t(2.3)
r⇥H = ✏@E
@t(2.4)
where E is the electrical field, H the magnetic field, ✏ the media permittivity and µ0 permeability.Using the vectorial formular⇥(r⇥E) = r(r·E)�r2E with the simplified Maxwell’s equationsa two vectorial wave equations called the homogeneous wave equations can be derived
r2E = µ0✏@2E
@t2(2.5)
r2H = µ0✏@2H
@t2. (2.6)
There are a infinite number of possible solutions for these equations. Using the harmonic wavesolution, E(r,t) = E(r)ei!t, on the homogeneous wave equations the Helmholtz equation isobtained that describes the electric and magnetic field distribution in the structure. Since theinteresting field is the electric field the rest of this derivation will concentrate on that. Helmholtzelectric field distribution equation then can be written as
r2E(r) + k2n2(r)E(r) = 0 (2.7)
where k = !
c
, ! is the angular frequency, c is the speed of light in vacuum and n(r) therefractive index distribution. The wave propagation in z-direction is approximated as a planewave propagation the expression can be rewritten as
E(r) = E(x,y)e�i�z (2.8)
where � is a propagation constant for the wave along the propagating axis z. Combining thiswith the Helmholtz equation for the electric field the following expression can be derived
@2E(x,y)
@x2+
@2E(x,y)
@y2+
@2E(x,y)
@z2+ (k2n2(r)� �2)E(x,y) = 0 (2.9)
In this thesis a flat three layer waveguide is constructed confining the light only in the x-direction. Using equation (2.9) the electric field distribution can be derived for the separate
5

Chapter 2. Evanescent-Waveguide
layers. Assuming that the thickness of the core layer is 2a with x = 0 at the center of the corelayer.
@2E(x,y)
@x2+ (k2n2
1 � �2)E(x,y) = 0 x > a (2.10a)
@2E(x,y)
@x2+ (k2n2
2 � �2)E(x,y) = 0 �a < x < a (2.10b)
@2E(x,y)
@x2+ (k2n2
3 � �2)E(x,y) = 0 x < �a (2.10c)
The top layer and the bottom layers are called cladding layers. In the cladding layers there isan expected exponential decay which is the evanescent field. Choosing appropriate boundaryconditions equation 2.10 can be solved.
Ey
=
8>>><
>>>:
A cos(�a� �)e��(x�a) x > a
A cos(�x� �) �a x a
A cos(�a+ �)e⇠(x+a) x < �a
(2.11)
where A is a non determined constant, � a phase constant and �, �, ⇠ are constants that arerelated to the refractive indices of the layers and given by the expressions below.
� =q
k20n22 � �2 (2.12a)
� =q�2 � k20n
21 (2.12b)
⇠ =q�2 � k20n
23 (2.12c)
As can be seen from equation 2.11 the electric field decays exponentially into the claddinglayers with a decay length given by the equations 2.12. The exponential decay makes this a verysurface sensitive technique.
2.1.2 Characteristics of Symmetric Waveguides
In equation 2.11 it can be noticed that the evanescent field does not have to be symmetricaround the center of the core layer. This depends on the refractive indices of the cladding layers.A symmetric waveguide has the same refractive index in both cladding layers [7]. The theorybehind this can of course be looked at in more depth but here the very basics are explained.The penetration depth is defined as where the electric field amplitude has dropped to 1/e of it’svalue on the surface. Using this the penetration depth can be written as[7]
d =�
2⇡
1qn2eff
� n2cladding
(2.13)
6

2.2. Experimental Setup
Figure 2.2: The di↵erent characteristics of the evanescent field depending on the refractive indicesof the di↵erent layers. (a) Total internal reflection in the substrate. (b-d) Characteristics of theexcitation field depending on the refractive index with (b) higher, (c) lower and (d) approx. the sameas the refractive index of the sample solution. Image used with permission from Bjorn Agnarsson[7].
where � is the wavelength of the connected laser and neff
is the e↵ective refractive index of thewaveguide mode. The e↵ective refractive index can be calculated numerically from the Maxwell’sequations 2.10
neff
=c�
!(2.14)
For a single mode waveguide and typical wavelength and e↵ective refractive index the penetra-tion depth will be in order of 100-200 nm.
A symmetric waveguide structure has some crucial advantages compared to an asymmetricstructure. A large variety of polymers can be used as cladding layers and thereby it is possibleto tune the penetration depth. This can also be accomplished be varying the geometric struc-ture of the waveguide, for example core thickness. The illumination area is quite big makingit possible to do measurements on a larger area. But probably the main advantage with thisend-fire evanescent waveguide platform is that measurements on a single molecule attached onfor example a gold nano particle can be done, this means that measurements can be made labelfree. To be able to do measurements label free have a number of advantages, for example thatlabels bleach during measurements and may alter the functionality of the measured molecule.
2.2 Experimental Setup
The basic setup for the experiments is very easy including a regular microscope, 532 nm laser andcomputer which are all commercially available, the tricky part is the custom made waveguide.Even though the setup is easy, it is to this day quite hard to use for an unexperienced user. Inthis section the main components will be discussed and their importance for the setup.
The microscope that was used was an upright Olympus BX61 microscope that has a high accu-racy z-axis stage for optimal focus abilities. The lenses used were a 2x and 20x for alignment oflaser fiber and waveguide, a 100x wet objective with the numerical aperture of 1.0 was used formeasurements.ImageJ, a free software, was used to control the microscope, stage and camera. A setup of microscrews was setup to be able to very precise align the optical laser fiber. This is critical for theexperiment and good measurements. This alignment had to be adjusted continuously not tolose signal.
7

Chapter 2. Evanescent-Waveguide
100x
Laser Fiber
2mm
Figure 2.3: Schematic view of the waveguide system used. The laser comes in from the right andthe fiber is aligned for the best possible connection to create a good evanescent field. There are threelayers on the silicon wafer, the bottom layer is a CYTOP which is a polymer, the middle layer isthe core layer which is spin on glass, the top layer is a CYTOP layer equal to the bottom layer.In the middle of the chip a well is etched through the CYTOP down to the core layer. The well is2mm by 2mm and approximative 3µm deep which also is the thickness of both CYTOP layers. Allmeasurements was done with liquid on the well and a 100x liquid immersed objective with a numericalaperture of 1.0.
8

3Biological Foundation
Biological physics spans a large range of topics but in general methods from physicsis just used to understand and answer biological questions. In this chapter a shortoverview of the biological foundations for this thesis is presented. Simple structuresof biological membranes, surface functionalization and molecule binding dynamics is
discussed. In this thesis a measuring technique of peptides is investigated with the goal of ultrahigh sensitivity technique for measuring amyloid � peptides for Alzheimer’s disease diagnostics.Therefore an introduction to Alzheimer’s disease is presented.
3.1 Vesicles and Lipid Bilayers
All living organisms are built by biological cells which is a structure with di↵erent functiongroups, contained by a protecting membrane. The size of a cell vary in the region of 1 - 100µm[8].This membrane, and what it contains, have a huge impact on the functionality of the cell andthereby life itself. The membrane makes a barrier to the outside world protecting the cell butit must also enable the passage of vital nutrients in to the cell and allow waste materials toget out se figure 3.1. At the same time it must be flexible and durable to allow cell movement,division and growth. For this reason there is of great importance to understand the structure ofthe membrane and how it works.
The biological cell membrane is a structure of self assembled lipid molecules that have hydropho-bic tails and a hydrophilic head, see figure 3.2a. To minimize the free energy of the aqueous lipidsolution the hydrophilic head will screen the hydrophobic tails from the water molecules andspontaneous aggregates are formed [8]. These aggregates can make di↵erent shapes for examplespheres, vesicles (spherical shells) and supported layers depending on parameters like criticalchain length, optimum head group area and lipid concentration [9]. It is now easy to assumethat the lipids are fixed which is not the case, they are constantly moving around in the mem-brane like a two dimensional liquid. Applying force to this kind of structure will reshape it andrip it apart if the force is too big. Calculations on membrane deformation is a very interestingtopic but will not be further discussed in this thesis, for a deeper insight in the subject see thebook ”Physical Biology of the Cell” [8].
9

Chapter 3. Biological Foundation
Figure 3.1: Simple sketch of a Eukaryotic cell with the cell nucleus and di↵erent function groups.There are many types of membrane structures with embedded proteins but the one here magnified isa lipid bilayer called plasma membrane.
(a) (b) (c)
2.5nm
approx 150nm
Figure 3.2: (a) Lipid molecule with hydrophobic tails and hydrophilic head that creates a structureabout 2.5nm long. There are many di↵erent type of lipids but since the most important for this thesisis the phospholipid which have two tails to one head group this will be for the illustration.(b) Selfassembled lipid vesicle, which is a spherical shell. The size of a vesicle can very di↵erent and theycan be made in many di↵erent sizes. In the work represented here they are approx. 100 � 150 nm.(c) A supported lipid bilayer on for example SiO2. Both the lipid bilayer and the vesicle are about5nm thick.
Functional proteins are embedded in the membrane giving the membrane some of its func-tionality enabling interactions between the surroundings and inner structure of the cell. Some ofthese proteins are just embedded on the top layer of the membrane and some go right throughit. The interactions and dynamics of interactions are discussed further in the next section.
3.2 Ligand-Receptor Kinetics
In this section the goal is to understand and build a statistical model system of two di↵erentmolecules binding to each other. This model will help interpreting results and data, and isespecially important for single molecule binding experiments. To create a model system it isoften a good idea to start with the easiest scenario. In this case that means that no accountwill be taken to what molecules are interacting. See figure 3.3 for a graphical representations
10

3.2. Ligand-Receptor Kinetics
that will be used in this section. This fairly basic model is a great tool in biology and bindingdynamics and as will be shown later on show the competition between translational entropy andbinding energy for biology relevant solution systems.
3.2.1 Ligand-Receptor Interaction
In this thesis single molecule interactions are monitored and therefore knowledge about thenature of biological interactions are relevant. In the most fundamental case of molecular bindingbetween a ligand (L) and a receptor (R) a new complex is formed (LR). With a large a�nitybetween the ligand and receptor the complex will stay this way and not separating. However ifthe a�nity is low they will separate again to form a free ligand and receptor and be open fornew interactions. When time goes towards infinity this will create a equilibrium between freeligands and receptors and the complex LR, this is represented by the equation:
L+Rk
on���*)���k
off
LR (3.1)
where koff
and kon
are kinetic rate constants for the forward and reverse reactions and aredescribed by the equation [10]
dLR
dt= k
on
[L][R]� koff
[LR] (3.2)
where the square brackets indicate concentrations. These equations can be investigated furtherfor relevant relations but they are not relevant for this thesis and left for the reader to read ifinterested [8].
Figure 3.3: Representations of two di↵erent molecules that are able to react with each other withthe receptor to the left and the ligand to the right.
3.2.2 Ligand-Receptor Dynamics
One case scenario is when there is only one receptor but many ligands in the system. Usingthis and a mathematical grid representing the possible locations for the ligands in the solution,di↵erent microstates is created with di↵erent configurations enabling the possibility for statisticalcalculations, see figure 3.4. The number of microstates can be expressed as
Nmicrostates
=⌦!
L!(⌦� L)!(3.3)
where ⌦ is the number of lattice sites and L the number of ligands. The main goal here isto derive a mathematical model to calculate the probability for a ligand to be bound to the
11

Chapter 3. Biological Foundation
receptor as a function of the ligand concentration. Here it comes natural to construct a ratiobetween the number of microstates where one ligand has bound to the receptor divided with thetotal number of microstates. There are a few di↵erent ways this can be achieved and here theBotzmann distribution and partition function are chosen.
Figure 3.4: Grid representation of ligand receptor solution. The number of ligands are L the numberof lattice sites are ⌦ and one receptor.
The probability for a ligand to be bound to a receptor is pbound
and here it is very impor-tant to understand and a key for this derivation that there are only two classes of states. Thefirst one contains all microstates where the receptor is not occupied and the second one is all themicrostates where the receptor is occupied. Using this the weight of the states can be calculatedas
Wreceptoroccupied
= e��✏
b
X
solution
e��(L�1)✏sol (3.4)
where the first exponential term is the bound ligand and the sum is the free ligands in thesolution, ✏
b
is the binding energy for the bounden ligand and ✏sol
is the energy of the free ligandsin the solution. Since the Boltzmann factor is the same for all ligands in the solution arranging(L� 1) ligands on ⌦ lattice sites the sum can be written as
X
solution
e��(L�1)✏sol =
⌦!
(L� 1)!(⌦� (L� 1))!e��(L�1)✏
sol (3.5)
The sum of all possible microstates is the partition function and is given by
Z(L,⌦) =X
solution
e��L✏
b + e��✏
b
X
solution
e��(L�1)✏sol (3.6)
where the first sum is for the non-bound ligands and the second sum is for the bound ligands inthe di↵erent microstates. The second sum is already evaluated in equation 3.5. With the sameapproach for the first sum the sum can be written as:
X
solution
e��L✏
sol = e��L✏
sol
⌦!
L!(⌦� L)!(3.7)
12

3.2. Ligand-Receptor Kinetics
Using the two equations 3.5 and 3.7 and putting them in the partition function yields
Z(L,⌦) =⌦!
L!(⌦� L)!e��L✏
sol +⌦!
(L� 1)!(⌦� (L� 1))!e��(L�1)✏
sole��L✏
b (3.8)
if L ⌧ ⌦ the simplification ⌦!(⌦�L) ⇡ ⌦L can be used. And now all components to write down
pbound
are found
pbound
=⌦L�1
(L�1)!e��L✏
be��(L�1)✏sol
⌦L
L! e��L✏
sol + ⌦L�1
(L�1)!e��L✏
be��(L�1)✏sol
. (3.9)
By defining�✏ = ✏b
�✏sol
and multiplying both the numerator and denominator with (L!/⌦L)e�L✏sol
this equation can be further reduced to
pbound
=L
⌦e���✏
1 + L
⌦e���✏
. (3.10)
The last step now is to convert this to an equation depending on concentrations. The volume ofthe solution is V
solution
which leads to the ligand concentration as c = L/Vsolution
and a referenceconcentration as c0 = ⌦/V
solution
pbound
=(c/c0)e���✏
1 + (c/c0)e���✏
. (3.11)
This equation goes under many di↵erent names such as Langmuir adsorption isotherm and Hillfunction [8]. The characteristics of the curve created by this equation is very similar to figure3.7 which is derived from the special case of this type of dynamics and is called The LangmuirModel and will be discussed in depth in the following section.
3.2.3 The Langmuir Model
In the optical waveguide system, and reference methods, used in this thesis the receptors will beimmobilized on a surface. This will allow the usage of the Langmuir model, which is a specialcase of ligand-receptor dynamics theory, that describes how surface adsorptions of moleculesrelates to molecular concentrations. By creating a relation between the amount of receptorson the surface (⇥
max
) and a time dependent amount of bound ligands to a receptor (⇥(t)) therelative surface coverage can be calculated as ⇥(t)/⇥
max
.
When adding a solution of ligands to the surface with the immobilized receptors ligands willstart to bind to the receptors, see figure 3.5a. The relative surface coverage will get higher untilthe system has reached an equilibrium, see figure 3.5b. Equation 3.2 can be used to describethe kinetics of this system, a graphical representation of surface coverage is seen in figure 3.6.The kinetic parameters k
on
and koff
together with the law of mass action can be described asthe di↵erential equation
d⇥(t)
dt= k
on
C(⇥max
�⇥(t))� koff
⇥(t) (3.12)
13

Chapter 3. Biological Foundation
a. b. c.
Figure 3.5: Illustration of the surface coverage over time. In (a) the ligands are injected in thesolution starting to bind to the receptors. (b) an equilibrium is reached between ligands binding into the receptor and ligands releasing creating the maximum coverage of the system. (c) ligands areremoved from the bulk solution by for example rinsing lowering the relative surface coverage.
Figure 3.6: A graphical representation of the relative surface coverage based on the Langmuir theory.(a), (b) and (c) represent the same stages as in figure 3.5. Figure used with permission from OlovWahlsten, Biological Physics, Chalmers University of Technology.
where C is the ligand concentration in the solution. Rearranging 3.12 with the time dependentcomponents to one side and non time dependent components to the other yields
d⇥(t)
dt+⇥(t)(k
on
C + koff
) = kon
C⇥max
(3.13)
which is a quite straight forward equation to solve using a integrating factor �(t) and applyingthe chain rule for derivation. By using a exponential integrating factor �(t) = e(konC+k
off
)t thisequation can be solved
d
dt(e(konC+k
off
)t⇥(t)) = kon
C⇥max
e(konC+k
off
)t (3.14)
By integrating both sides of this equation and setting the initial condition ⇥(0) = 0 (since thesurface coverage is zero before any ligands have been injected in the solution) the solution forthe equation can be expressed as
⇥(t) =kon
C⇥max
kon
C + koff
(1� e�(kon
C+k
off
)t) (3.15)
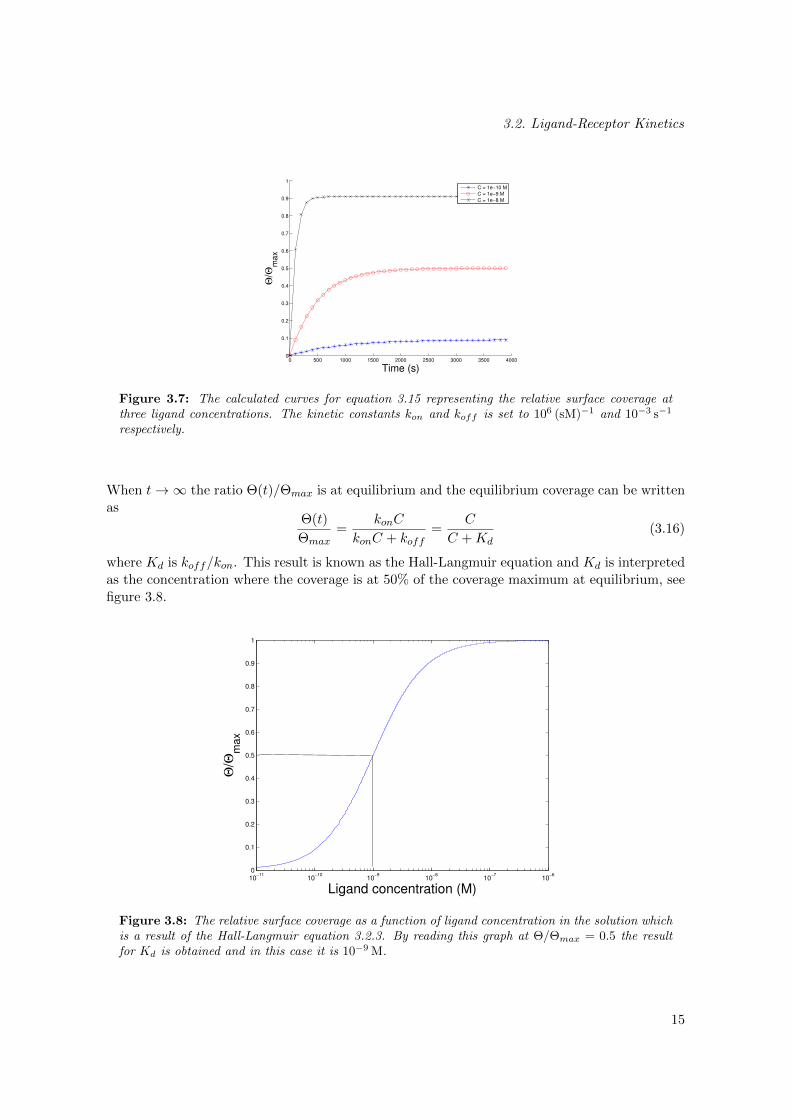
Figure 3.7 show how the surface coverage is related to change in ligand concentration.
14
3.2. Ligand-Receptor Kinetics
0 500 1000 1500 2000 2500 3000 3500 40000
0.1
0.2
0.3
0.4
0.5
0.6
0.7
0.8
0.9
1
Time (s)
!/!
ma
x
C = 1e!10 MC = 1e!9 MC = 1e!8 M
Figure 3.7: The calculated curves for equation 3.15 representing the relative surface coverage atthree ligand concentrations. The kinetic constants k
on
and koff
is set to 106 (sM)�1 and 10�3 s�1
respectively.
When t ! 1 the ratio ⇥(t)/⇥max
is at equilibrium and the equilibrium coverage can be writtenas
⇥(t)
⇥max
=kon
C
kon
C + koff
=C
C +Kd
(3.16)
where Kd
is koff
/kon
. This result is known as the Hall-Langmuir equation and Kd
is interpretedas the concentration where the coverage is at 50% of the coverage maximum at equilibrium, seefigure 3.8.
10!11
10!10
10!9
10!8
10!7
10!6
0
0.1
0.2
0.3
0.4
0.5
0.6
0.7
0.8
0.9
1
Ligand concentration (M)
!/!
ma
x
Figure 3.8: The relative surface coverage as a function of ligand concentration in the solution whichis a result of the Hall-Langmuir equation 3.2.3. By reading this graph at ⇥/⇥
max
= 0.5 the resultfor K
d
is obtained and in this case it is 10�9 M.
15

Chapter 3. Biological Foundation
3.3 Biological Functionalization of Surfaces
Receptors are immobilized on surfaces by functionalization of the surface. Methods dependingon what type of native surface is used and what kind of reactions are expected when a solutionis added to the surface. There are numerous of methods to achieve this, and here two mainmethods are used. One is to form a lipid bilayer containing the receptors on the surface andno reactions with the surface will happen and the second one is silanization of a glass surfacethat will react with the silicon in the glass making the surface extremely reactive. This givesthe ability to immobilize receptors on the surface.
3.3.1 Creating a Functionalized Supported Lipid Bilayer
To understand this type of surface functionalization one must know a little more about self as-sembly. In this section some equations will just be stated without any derivation, so the readermust either trust the author or read a book or course in condensed soft matter physics.
As mentioned in previous sections the main component of a biological membrane are lipidswith a hydrophobic tail and a hydrophilic head group. How these lipids aggregate and self as-semble is mainly dependent on the concentration of lipids and they will assemble in a way thatwill minimize the free energy in the solution. Since the main objective here is to understandbilayer formation, the focus will be on self assembly of vesicles and bilayers even though theymay take may other shapes like spheres or rods. It is always good to have a mathematical the-ory to fall back on and that explains when and why physical phenomena occurs when di↵erentparameters are changed. A good starting point is to see whether it is energetically favorable forthe lipids to self assemble or not. The following equation turns out to be a powerful tool.
XN
= N
X1e
(✏1�✏
N
)k
B
T
�N
. (3.17)
This equation can be used to calculate the volume fraction XN
of solute molecules in an aggre-gate with N molecules. ✏
N
is the energy change when a single lipid molecule is taken from thebulk solution and put in this aggregate. The free solute molecule fraction is X1 and ✏1 is thefree energy of a single molecule. T is the temperature in Kelvin and k
B
the Boltzmann constant.
Now the interpretation of this equation is straight forward. If ✏N
� ✏1 then the most moleculesin the solution will be isolated molecules, on the other hand if ✏
N
< ✏1 the molecules willaggregate and the system will have a lower free energy. Depending on what kind of lipid com-position there is in the solution the molecules will aggregate more or less easily. Phospholipidsform aggregates easily into vesicles structures due to the fact that they have two tails creatingsmall values of critical chain length but keeping large hydrocarbon volume together with a opti-mum head group area. ✏
N
is very dependent on the shape of the aggregate formed, the di↵erentshapes will have di↵erent surface energy for example which is one factor in the free energy model.
For a sheet like structure as in figure 3.2 (c) equation 3.17 can be written as
XN
= N [X1e↵] e�↵N
1/2(3.18)
↵ =
pN(✏
N
� ✏1)
kB
T. (3.19)
16

3.3. Biological Functionalization of Surfaces
✏1 comes from the fact that the sheet is handled as if it is infinite. This is of course not the casesince there must be a higher free energy at the edges of the sheet. For vesicles on a surface toform a supported lipid bilayer instead of staying as vesicles on the surface it most be energeticallyfavorable for the system. Since the edges of a supported lipid bilayer have a relative high freeenergy the bilayer will only form if the sheet is big enough to be energetically favorable see figure3.2 b.By doing this reversed a supported lipid bilayer can be created on a surface by applying a solu-tion with a high concentration of vesicles.
Figure 3.9: When adding a solution containing vesicles, that have receptors in the membrane, theywill land on the surface as shown in the first stage. As it gets crowded on the surface the vesicle willstart to fuse and opens up. If there is enough vesicles landing on the surface a bilayer will be createdwith the embedded receptors. The receptors have now been immobilized for experiments with addedligands.
To be able to create lipid bilayers on the wave guide surface does not only indicate that thesurface has many desired properties it also works as a functionalization of the surface. The lipidbilayer can be used as a platform for many di↵erent platforms for example membrane proteinbehavior. In figure 3.10 there is a comparison between lipid bilayer formation in QCM-D andthe waveguide system. The di↵erent steps that can be seen in figure 3.9 is observed as changesin the measurement in figure 3.10.
3.3.2 Silanization of Glass Surfaces
Silanization is a functionalization to make the surface very reactive. This is done by creating aself assembled monolayer on a mineral surface containing hydroxyl groups like glass. In figure3.11 the chemical structure of (3-aminopropyl)-diethoxy-methylsilane (APDMES) silane boundto a SiO2 surface that was used in this work. Glutaraldehyde bind to the NH3 groups and ontop of that the antibody is immobilized.
17

Chapter 3. Biological Foundation
68 70 72 74 76 78 80
!100
!80
!60
!40
!20
0
(a)
Time (min)
! f
(H
z)
2 4 6 8 10 12 14 16 181000
2000
3000
4000
5000
6000
(b)
Time (s)
Inte
nsi
ty
Figure 3.10: Results for bilayer formation in waveguide and QCM-D experiments. (a) is the resultfrom QCM-D measurement. When the vesicles land on the crystal surface the frequency goes downuntil a critical point of surface coverage is reached and the vesicles collapse to a lipid bilayer and thefrequency goes back up. (b) is the intensity measurement for the waveguide experiment and here itis the same principle but instead of frequency the intensity is measured and where the frequency goesdown the scattering intensity goes up.
Si - O - Si - O - Si - O - Si - O - Si - O - Si - O - Si - O - Si - O - Si - O
O
SiCH3 CH3
(CH )2 3
NH3
O
SiCH3 CH3
(CH )2 3
NH3
O
SiCH3 CH3
(CH )2 3
NH3
Figure 3.11: Chemical structure of bound (3-aminopropyl)-diethoxy-methylsilane (APDMES) to aSiO2 surface.
3.4 Introduction to Alzheimer’s Disease
Alzheimer’s disease is a neurologic disorder in the brain and the first documented case with thespecific name was presented by Alois Alzheimer in 1906. He discovered plaques in the brainand he called them ”military bodies” and dense bundles of fibrils. It was not until 1985 thanresearchers succeeded to purify plaques in the brain, and investigated the main components ofthis plaques. It was a 4 kD amyloid-� peptide [11]. This peptide has been proposed to be the
18

3.4. Introduction to Alzheimer’s Disease
driving force in the disease process [4]. Alzheimer’s disease is a huge research area so this sectionwill just be a short introduction of the disease and its mechanisms.
3.4.1 Structures and Properties of Amyloid-� Peptides
Amyloid-� is a peptide with a defined length of 36-43 amino acids. The di↵erent lengths ofthe peptide gives it di↵erent properties and are therefore grouped in smaller categories. Theamyloid-� is formed by sequential cleavage of amyloid precursor protein that is present in manydi↵erent tissues but can mainly be found in synapses of neurons. The peptide have no definedstructure or folding and therefore it will not crystallize.
3.4.2 Development and E↵ects on the Brain with Alzheimer’s Disease
As mentioned the most common theory for what is behind the progress of Alzeimer’s diseaseis accumulation of amyloid-� plaques in the brain e↵ecting the functionality of the brain. Thiscauses dementia and since there is no cure the patient e↵ected will get worse and eventually die.
3.4.3 Available Treatments and Diagnostics
Diagnosing potential patients with Alzheimer’s disease is today not a straight forward medicaltest. There is a long process with many di↵erent aspects to it, with blood tests, brain scans,analyze of medical history and repeated examination of behavioral changes. Since it is thoughtthat the main reason for this declining function of the brain is due to accumulation of peptidein the brain forming plaques it is much desired to solve this problem. This can be done bypreventing plaques to form and degrade plaques that already have been formed.
Today there are no cure for Alzheimer’s disease, there are just medication and other treat-ments helping some of the symptoms like sleep deprivation, dementia and behavioral changes.They do not treat the cause of Alzheimer’s disease just damp the symptoms. There are treat-ments that are under development that could treat what is believed to be the cause, and that isthe plaques in the brain. This could be done by using low-density lipoprotein receptor–relatedprotein-1 (LRP) to clear amyloid-� from the brain [5].
19

4Reference Techniques
To verify results obtained with a new method and characterize result data a com-plementary technique, preferable a well established one, can be used as a reference. Inthis project where a new technique for measurement of molecular binding to a surfaceis developed there have been two main complementary techniques, Quartz Crystal
Microbalance with Dissipation monitoring (QCM-D) and Surface Plasmon Resonance (SPR).Nano-particle Tracking Analysis (NTA) have been used to characterize the gold nano particlesused in the experiments. In this chapter these three methods are briefly explained.
(a) QCM-D (b) BIAcore 2000 SPR
Figure 4.1: The two main complementary devises to characterize and for referent measurements.(a)A Q-Sense E4 QCM-D device. (Image with permission from q-sense.com) (b) The BIAcore 2000SPR that was used in this work.
4.1 QCM-D - Quartz Crystal Microbalance with Dissipationmonitoring
QCM-D is an acoustic wave based measurement technique for quantifying adsorption on a surfacewhich allows measurements of small mass changes and viscoelastic properties in real time. This
20

4.1. QCM-D - Quartz Crystal Microbalance with Dissipation monitoring
is achieved by measuring the frequency shift, caused by mass adsorption of molecules, on anoscillating quartz crystal. Quartz is a piezoelectric material that will deform with an externalelectrical field and will generate an electric field if deformed. When an alternating current, withan appropriate frequency, is applied to an AT1 cut quartz crystal it will start to oscillate at itsresonance frequency in a shear fashion as demonstrated in Figure 4.2. The resonance frequencyis dependent on the thickness of the quartz crystal since the crystal is in resonance when thetop and the bottom are in anti-phase[12]. This gives the condition that an odd multiple of �/2should match the thickness of the crystal to obtain resonance.
(a)
10 mm
(b)
Figure 4.2: (a) Shows a schematic overview of the QCM-D quartz crystal cross section. Byapplying an alternating voltage over the crystal it starts to oscillate as the arrows indicate. Whenthe acoustic wave created is an odd multiple of �/2 that matches the thickness of the crystal it fulfillsthe requirements for resonance. (b) Illustration of a QCM-D quartz crystal.
The frequency shift of the resonance have a linear relation towards the adsorbed mass on thesurface described by the Sauerbrey relation [13],
�m = �C�f
n(4.1)
where�f is the the frequency resonance shift, �m is the change in mass due to adsorption to thesurface, C is a crystal specific constant and for the regular 5MHz crystal C = 17.7 ng/(Hzcm2)and n is the number of the harmonic used. Assuming that it is possible to make readout fromacquired data as low as �f ⇡ 0.1Hz the sensitivity of the system is around 1 ng/cm2. In spiteof the high sensitivity for this technique it has a wide range for detectible molecular weights,from just a few hundred Da up to GDa [14].
The dissipation gives information about the viscoelastic properties of the adsorbed layer. Ifa complete rigid layer is applied there will be no shift in the dissipation for example a layer ofgold, a soft layer will show a larger shift in the dissipation. This dissipation is monitored byturning the applied alternating voltage rapidly on and o↵ continuously, while the potential is o↵the decrease of the oscillation amplitude is measured. This decrease in amplitude is a result ofenergy dissipating to surrounding media. Using this the dissipation D can be calculated[15],
D =1
2⇡
Edissipated
Estored
(4.2)
1An AT cut crystal is a crystal that is cut at 35,25°with the optical axis.
21

Chapter 4. Reference Techniques
where Edissipated
is the energy loss for each oscillation while the potential is o↵ and Estored
isthe energy stored in the system.
4.2 SPR - Surface Plasmon Resonance
Surface Plasmon Resonance (SPR) is a highly sensitive measuring technique for surface adsorp-tion and binding. Since SPR is a highly surface sensitive technique it makes a very good referenceto the waveguide scattering system and are able to measure the same biological systems with ahigh sensitivity.
SPR measures the changes in surface plasmon resonance angle that occurs due to excitationsof laterally propagating surface plasmons on planar metal surfaces, for example gold. The con-dition for plasmon resonance on the surface is extremely sensitive to changes of the interfacialrefractive index, �n
interface
[16]. �ninterface
changes with adsorption of biomaterial on thesurface and will give a change in surface plasmon resonance angle.
4.3 NTA - Nano-particle Tracking Analysis
In the waveguide scattering system, gold nano-particles are used for their ability to scatter lightvery e�ciently. The NTA is used to characterize the nano-particles before and after modifica-tion to determine their size distribution. This gives not only information about the size anddistribution of the size but also if the modification was successful and if the nano-particles haveaggregated. Since the scattering is strongly dependent on the radius of a solid sphere nano-particle this is crucial.
Nano-particle Tracking Analysis (NTA) is based on measuring Brownian motion of nano-particlesin a solution [17]. This is accomplished by shooting a laser beam through a prism with the so-lution on top, the the scattering signal of individual particles are recorded in a movie file usinga regular microscope with a camera. The data is processed with a software that uses the two-dimensional Stokes-Einstein equation [18]
< x,y >2=K
B
Tt
s
3⇡⌘dh
, (4.3)
where < x,y >2 is the mean square displacement, KB
the Boltzmann constant, T temperatureof the system, ⌘ the viscosity of the solution, t
s
the sampling time and dh
the hydrodynamicdiameter of the nano particle.
22

5Materials and Methods
During this thesis many di↵erent methods were used due to that the main methodfor this thesis is a newly developed method that have not yet been fully characterized.For this reason the reference methods will be extra important for interpretation ofthe data obtained. In this chapter the materials and methods used are explained. All
chemicals are purchased from Sigma-Aldrich (USA) if not otherwise is stated. All water usedwas deionized and filtered using a MilliQ unit (Millipore, France). The bu↵er in all experimentswas a phosphate bu↵ered silane (PBS) that was prepared with 200ml of milliQ water and adissolved PBS tablet, the PBS was the degased.
5.1 Gold Nano Particles Fabrication and Coating
For all waveguide based measurements gold nano particles were used due to their ability toscatter 532 nm light very e�ciently. For this gold nano particles coated with polyethylene glycol(PEG) containing biotin were fabricated. The size distribution for the gold nano particles beforeand after coating can be seen under results figure 6.1.
5.1.1 Fabrication of Gold Nano Particles
Fabrication of gold nano particles is quite straight forward. 1µl tannic acid 1% was added to32ml of milliQ in a beaker, 8ml sodium citrate 1% was mixed with 160ml milliQ water. Thetwo solutions were heated to 65 °C and then mixed in a larger beaker and kept at 65 °C withconstant stirring. After 2.5 hour the temperature was raised to 95 °C for a 1.5 hour. By then thesolution had reached a nice deep crimson red. The gold nano particle solution was then dividedin four 50ml falcon tubes and placed in the fridge.
5.1.2 Coating with Polyethylene Glycol
To make the gold nano particles stable and to prevent aggregation in a salt solution like PBS thegold nano particles were coated with polyethylene glycol (PEG). This also gives the opportunityto biotinylate the particles. Using a micro balance 0.006 g of PEG-COOH and 0.0015 g of PEG-Biotin were mixed with 1.5ml milliQ water and distributed equal between three of the falcontubes containing 50ml gold nano particle each and left over night. Then the solution was
23

Chapter 5. Materials and Methods
distributed in 30 1.5ml vials and centrifuged 60 minutes at 5000 g. The pellet that was formedin the bottom of the vial was pipetted up and diluted to 1.5ml again and centrifuged again thesame way, this was repeated 5 times. After the last centrifugation the pellets were not dilutedto create a stock solution.
5.2 Bilayer Formation
In order to test the waveguide surface it is good to compare bilayer formation in the di↵erentsystems. The shape of measurement curves in the QCM-D forming bilayer is well documentedand are therefor suitable for this kind of comparison see figure 3.10.
5.2.1 Bilayer Formation with QCM-D
A Q-Sense E4 instrument was used and a commercially available SiO2 (Q-Sense AB, Sweden)crystal was cleaned in UV-ozon oven for two times ten minutes with rinsing in milliQ waterbetween. The crystal was then dried in a stream of nitrogen and mounted in the QCM-Dchamber. PBS was used as a running bu↵er and the flow rate was 100µl/min. Then 1mg/mlPOPC-PE:PEG-Biotin was injected and a bilayer was formed during flow.
5.2.2 Bilayer Formation with the Evanescent Waveguide Technique
The evanescent waveguide chip was plasma cleaned for ten minutes, then rinsed with milliQ anddried with a stream of nitrogen. After this cleaning procedure the chip was mounted under themicroscope with a regular glass coverslip and double-sided tape. The laser was roughly aligned atthe edge of the chip using naked eye. 20µl of PBS was put on the well and a 100X wet objectivewas used to locate a suitable area for measurements. Laser alignment and power, exposure time,gain and focus was then optimized for measurement. Then 10µl of 1mg/ml POPC-PE:PEG-Biotin was added to the drop on the well and the bilayer formation was recorded.
5.3 NTA Concentration Characterization
The NTA is mainly made for size measurements for nano particles but here a small investigationwas made to see if it is possible to use the NTA technique for concentration measurements.The NTA used was a Nanosight LM10 (Nanosight, England) and Nanosight 2.0 software. Astock solution with calculated concentration of 0.2 nM gold nano particles was diluted in a series4/1000, 2/1000, 1/1000 and 1/2000. To see if there was any di↵erence in the result measurementson both regular gold nano particles with a size of 30 nm and polyethylene glycol (PEG) chains onthem and the size then goes up to 59 nm. Each sample was measured three times for 60 secondsfor each measurement, the gain was set to 619, shutter 1495, blurr 5x5 and the threshold wasadjusted to only count particles that were in focus.
5.4 Immuno Assay for Amyloid � Detection
A immuno assay was developed for measurement of amyloid-� peptides and investigated withthree di↵erent measurement techniques. Two that are commercial available and established andthe new evanescent waveguide technique. The biological system is basically the same for alldi↵erent measuring techniques and in figure 6.10 there is a sketch of the biological system.
24

5.4. Immuno Assay for Amyloid � Detection
5.4.1 QCM-D Preparation and Measurement
As mentioned in chapter 4 the QCM-D method is well established for surface measurements ofbiological structures. This makes it very good as a reference method. In all QCM-D measure-ments a Q-Sense E4 instrument was used, purchased from Q-Sense AB, Sweden.
Commercial QCM-D Crystal
As a starting point, a commercially available QCM-D quartz crystal was used, coated with SiO2
(Q-Sense AB, Sweden). Three crystals of the same kind was used and treated exactly the sameexcept for the step when the peptide of interest was added so there was one positive control andtwo negative. The crystal was cleaned in a UV-ozon oven for 2 ⇤ 10 minutes with rinsing withmilliQ water between the cleaning and after. The crystal was thoroughly dried with a streamof N2 and then put in a solution with 10% 3-Aminopropyldimethylethoxsilane (APDMES, abcrGMbH & Co. Germany) and 90% methanol that completely covered the the crystal, it wasleft for incubation for one hour. After one hour the crystal was first rinsed with methanol andthen milliQ water. After the silanization the crystal incubated in a petri dish with PBS and 2%glutaraldehyde for 15 minutes.
After these functionalization steps of the surface the crystal was dried and quickly mountedin the QCM-D and the chamber was filled with PBS, which also was the running bu↵er at100µl/min. The antibody 6E10 (Covance, USA), with the concentration 50µg/ml, was injectedin the chamber and incubated for 20 minutes without flow. A short pulse of ,less then oneminute at regular injection speed, ethanolamine was injected through the chamber at a highconcentration (1M). Human serum albumin (HSA) was then injected with a concentration of10mg/ml and incubated without flow until no more adsorption could be measured. Then thepeptide of interest was added, here channel three was used as a positive control and a solutionwith amyloid-� at 250 nM for 20 minutes no flow. After injection of the peptide in channelthree the antibody 4G8 (Covance, USA) with the a concentration of 10µg/ml was added untilsaturation. Streptavidin was injected at a concentration of 10µg/ml for 15 minutes. The laststep was to inject the biotinylated gold nano particles and measuring until saturation.
Spin on Glass Coated QCM-D Crystal
In the waveguide experiments the contact surface will be a spin on glass (SOG) material soto get a more accurate interpretation of the QCM-D results three crystals were coated with a400 nm thick SOG film.
The crystals was then plasma cleaned for 10 minutes and rinsed in milliQ water. After thiscleaning procedure the same steps as with the non coated crystal were taken. Crystals werefunctionalized with 10% APDMES and 90% methanol for 2 hours, rinsed with methanol andmilliQ, put in a solution with PBS and 2% glutaraldehyde for 15 minutes, dried with a streamof nitrogen, mounted in QCM-D chambers, 6E10 at a concentration of 25µg/ml for 50 minuteswith no flow, ethanolamine 1M less then one minute, human serum albumin with the concentra-tion 10mg/ml 10 minutes incubation with no flow, amyloid-� 1-37 250 nM with channel threeas a negative control, 4G8 with the concentration 10µg/ml, streptavidin with the concentration10µg/ml and the last step was to inject the biotinylated gold nano particles and measure untilsaturation.
25

Chapter 5. Materials and Methods
5.4.2 Evanescent Waveguide Preparation and Measurements
The really strong side of the QCM-D and the SPR is the flow systems were micro pumps willcreate flow over the surface, this will make the adsorption less sensitive for di↵usion limitationsof the binding. This is also a weakness because it requires quite a lot of material. Even thoughthe steps of the antibody sandwich seen in figure 6.10 are quite the same small alterations be-tween measurements will occur, they will be discussed in the discussion chapter. For a more indepth description of the experimental setup see chapter 2.2.
The waveguide chips were rinsed in milliQ water and dried in a stream of nitrogen before beingplasma cleaned for 10 minutes and rinsed in milliQ again and dried thoroughly. 20µl of 10%APDMES and 90% methanol were pipetted on the waveguide well after they had been placedin petri dishes. About 40µl of pure methanol was placed at the edges of the petri dish and thelid was put on. The APDMES was incubated for one hour without any mixing. The chip wasthen rinsed with first methanol and then milliQ water and placed in a petri dish with 3ml of2% glutaraldehyde for 15 minutes. After the incubation the chip was rinsed in first PBS andmilliQ and dried with nitrogen.
A 20µl drop of PBS was placed on the well of the chip and 20µl of 50µg/ml 6E10 was pipettedin the PBS drop and incubated for one hour with hand mixing each five minutes with a pipet.The chip was then rinsed using 20µl of PBS and mix and waste 16 times. 20µl of HSA at aconcentration of 10mg/ml was injected in the drop on top of the well this was incubated forone hour without any mixing then rinsed 16 times with PBS. Ethanolamine was then injectedand rinsed within one minute with 16 times of PBS. Then the amyloid-� was added at desiredconcentration and incubated for note nor with mixing each five minutes and rinsed 16 times withPBS. The second antibody biotynilated 4G8 was then added at a concentration of 50µg/ml anda volume of 20µl for one hour with mixing each five minutes and the same rinsing procedureas the other steps. The last step done on the lab bench is to add 20µl streptavidin with theconcentration 50µg/ml for 30 minutes then rinsed 16 times with PBS.
After the preparations with building the biological system on the lab bench the chip was readyfor measurements. The chip was placed under the microscope and laser roughly aligned with ahigh laser power (around 30mW), then the well and a suitable area was located to be able to dothis a 2X and 20X objective was used. To get good measurements it was important to put sometime to optimize the parameters as focus, laser alignment and power, camera gain and exposuretime. During all measurements a 100X wet objective was used.
A time laps was then started with one image per second to one image each ten seconds de-pending on the condition and suspected binding rate. The length of the measurement wasdepending on the binding rate but often around 1000 seconds. All measurements was saved as astack of ti↵-files and processed with MatLab (Mathworks, USA) and the free software ImageJ.
5.4.3 SPR Preparation and Measurements
The SPR used in my studies was a Biacore2000 (Biacore, Sweden) with standard gold surfaces.The machine run with PBS until stable baseline then the measurements was restarted for betterreadout. For surface functionalization a 1-Ethyl-3-(3-dimethylaminopropyl) carbodiimide (EDC)and N-Hydroxysuccinimide (NHS) coupling agents were used. 37.5µl of 2mg/ml EDC was
26

5.4. Immuno Assay for Amyloid � Detection
diluted to 150µl and 5.72µl of 2mg/ml NHS was also diluted to 150µl both using PBS. Thetwo solutions were then mixed and 150µl was injected over a period of 15 minutes. The antibody6E10 was injected for 10 minutes with 10µl/min at a concentration of 10µg/ml. Ethanolaminewas injected for one minute 10µl/min at 1M then amyloid-� 1-37 at 250 nM 10µl/min for tenminutes. The last step was to add the second antibody 4G8 for ten minutes with a flow of10µl/min at the concentration 10µg/ml.
27

6Results
In this chapter the main results obtained during this project are presented. Many di↵erentmethods have been used to acquire and process the data. The two main softwares that wereused for the processing of data are commercially available numeric mathematics softwareMATLAB and the free image processing software ImageJ . The results can be divided into
two main parts. The first one is characterization of the waveguide and the second is an immuneassay method for detection of peptide proteins in solution with the optical waveguide.
6.1 Gold Nano Particle Size and Visibility in Waveguide System
It is important to characterize the gold nano particles used in the experiments in order to beable to interpret the results correctly. The particle scatter intensity is strongly dependent on thegold core size, to know this aid in the optimization of the settings before measurements. NTAand SEM was used for this characterization and also to determine an approximative concen-tration of the gold nano particles. Since the NTA is not a primary technique for concentrationdetermination, experiments were made to establish whether NTA could be trusted for this kindof measurement.
6.1.1 Size Distribution of Gold Nano Particles
In chapter 5, the manufacturing process of the gold nano particles was described. The expectedsize of these gold nano particles are 20-25 nm. To verify this size of the non-coated gold nanoparticles NTA and SEM were used. Figure 6.1 shows the NTA results for the regular gold nanoparticles and the PEG and PEG-biotin coated gold nano particles used for all experiments. Thepeaks are quite narrow which indicates a good distribution around the average size. As expectedthe coated gold nano particles are bigger than the non coated gold nano particles. Knowing thesize di↵erence between them gives the possibility to estimate how the coating polymer chainsare orientated. The measured size di↵erence between the coated and the non-coated are 26 nm,this indicates that the polymer chains are orientated perpendicular to the gold nano particlessurface.
Comparing the size of the same gold nano particles in figure 6.1 and figure 6.2 shows thatthe size results in NTA are approximately 10 nm larger than in the measurement using SEM.
28

6.1. Gold Nano Particle Size and Visibility in Waveguide System
0 20 40 60 80 100 120 1400
1
2
3
4
5
6
7
Diameter (nm)
Co
nce
ntr
atio
n (
10
8 #
/ml)
0 20 40 60 80 100 120 1400
2
4
6
8
10
12
14
Diameter (nm)C
on
cen
tra
tion
(1
08 #
/ml)
34nm
60nm
Figure 6.1: Two NTA measurements for the same gold nano particles. One measurement for thenon-coated gold nano particles (left) and one with the PEG coating (right). The gold nano particleswith coating is on average 26 nm larger in diameter.
This is a consistent error in this particle size range and has to be kept in mind when usingthe NTA system. The di↵erence in resulting size is thought to come from that NTA measureshydrodynamic size of the particle.
21nm
Figure 6.2: SEM image of the gold nano particles used in QCM-D measurements as well as thewaveguide system. The measured size of the gold nano particles is about 21 nm. Groupings of goldnano particles on the surface is thought to come from drying e↵ects.
29

Chapter 6. Results
6.1.2 Concentration Characterization
For the experiments done in this work, an approximative value for the concentration is enough.NTA is a measurement system for determining size distribution, but it can also be used to puta value on the concentration. Since measuring concentration is not what the NTA is made fora small study was done to see how accurate it can measure this. Figure 6.3 show that if thesolution is in a concentration of approximately 0.2 pM the NTA can be used to determine theconcentration with satisfying accuracy. There is one important aspect to keep in mind whiledoing these measurements, that is to choose the threshold in such a way that only particles thatare in focus are traced during measurement. This could origin from that the algorithm used isbased on Stokes-Einstein equation in two dimensions. In the waveguide system a concentrationof approximately 6.7 pM was used.
1 2 3 40
1
2
3
4
5
6
7
8x 10
!13
Co
nce
ntr
atio
n (
Mo
lar)
Dilutions
Measure value 1Measure value 2Measure value 3Calculated (expected)
(a) Gold Nano Particles
1 2 3 40
1
2
3
4
5
6
7
8x 10
!13
Co
nce
ntr
atio
n (
Mo
lar)
Dilutions
Measure value 1Measure value 2Measure value 3Calculated (expected)
(b) Gold Nano Particles with PEG
Figure 6.3: Measured and calculated concentrations for two di↵erent solutions of gold nano particleswith four di↵erent concentrations. The blue, cyan and yellow colors on the di↵erent dilutions aredi↵erent measurement on the same concentration for better statistics. All solutions was diluted froma stock with a concentration of 0.2 nM. Dilutions 1,2,3 and 4 were diluted 4/1000, 2/1000, 1/1000and 1/2000 respectively. Figure (a) shows the results with 20� 25 nm gold nano particles and figure(b) the same gold nano particles coated with polyethylene glycol making the nano particles yielding asize about 59 nm.
6.1.3 20 nm Gold Nano Particles in the Waveguide System
After characterization of the functionalized 20 nm gold nano particles it had to be determined ifthe gold nano particles could be measured individually bound to the waveguide cora layer sur-face. To test this, the waveguide surface was functionalized with PLL and a solution of HSA andbiotynilated BSA was electrostatically immobilized on the surface. Streptavidin was used as alinker between the surface and the modified gold nano particles, the system is shown in figure 6.4.
Figure 6.5 shows the individual 20 nm gold nano particles immobilized at the core layer surfaceof the waveguide chip. This is based on the knowledge that the gold nano particles have notaggregated at any large extent in the bulk solution and that intensity steps from the bound goldnano particles can be observed during binding. The initial image, figure 6.5 (a), contains some
30

6.1. Gold Nano Particle Size and Visibility in Waveguide System
- - - - - - - - - - - - - - - - - - - - - - - - - + + + +
PLL
HSA
BSA+biotin Streptavidin
AuNP-PEG
Figure 6.4: The Poly-L-Lysine (PLL) surface functionalization for immobilization of gold nanoparticles to the waveguide core surface. After plasma cleaning of the surface the surface will benegative charged, the PLL is positive charged and will electrostatically bind to the surface. A solutionis then added with a mixture of HSA and BSA-biotin with di↵erent concentrations of the BSA-biotin.Streptavidin is then used as a linker between the biotin on the BSA and the functionalized gold nanoparticles.
spots as well. This is however not gold nano particles it is dirt either from the preparationsor biological residues that did not leave the surface during the cleaning process. In figure 6.5(b) stripes can be observed with the length period of approximately 10µ m. These stripes arethought to origin from interference between the first and second mode in the optical waveguide.To prevent this and get a single mode waveguide work is done to tune the thickness of the corelayer and obtain a single mode optical waveguide. By fine tuning the alignment of the laser fiberat the edge of the waveguide chip the stripes can be prevented, but during long measurementsthe laser fiber drifts and the stripes will reappear. In figure 6.6 the intensity over time can beseen for a small area where one or more gold nano particles have bounded. It can be observedthat the steps in intensity are approximately multiples of each other. Even the larger steps aremultiples of the single particle intensity step and could either be an aggregate or a few singulargold nano particles that bind faster then the frame rate which here is one second.
31

Chapter 6. Results
(a) Surface before injecting gold nano particles (b) Surface after 30 min
Figure 6.5: Images of the surface before (a) and 30 minutes after (b) the gold nano particles wereadded. The measurement was done with the (approx.) 20 nm gold nano particles that have beencharacterized in this section. The surface was functionlized with PLL and biotynilated BSA. Eachframe is 74µm by 74µm.
Figure 6.6: Intensity for a few gold nano particles that bind to the surface. Each graph correspondto a small area at the numbers in the image. Looking at the intensity curves it can be observedthat there are steps of around 2000 of this arbitrary unit (AU) or multiples of 2000. Since we knowthat the gold nano particles have not aggregated to a significant extent the conclusion is that in thisexperiment a 20 nm gold nano particle give an intensity response about 2000 AU.
6.2 Dynamic Range Measurements
To get a feeling for the sensitivity and the dynamic range in QCM-D and to compare that to thesensitivity for the waveguide system a measurement was made to calculate the number of goldnano particles needed to get a frequency shift of one Hertz in QCM-D. The gold nano particleswere immobilized using biotynilated BSA in di↵erent concentrations and the frequency shift wasmeasured in QCM-D. The results can be seen in figure 6.7. Thereafter the same surfaces were
32

6.2. Dynamic Range Measurements
investigated with SEM to determine the number of gold nano particles per unit area. Figure 6.8shows the SEM images from that measurement. Calculated from these images there would beroughly 15 000 gold nano particles per Hz in response measured with QCM-D for a area same asthe measure area in the waveguide system which is 74 by 74µm. With the most stable base lineachievable in QCM-D 0.5Hz can be distinguished. That is 7500 gold nano particles in a 74 by74µm frame which are not countable in the waveguide system and there for over the detectionregion for the system. QCM-D and the waveguide systems dynamic range is not overlapping.
0 2000 4000 6000 8000 10000 12000 14000!180
!160
!140
!120
!100
!80
!60
!40
!20
0
20
Time (s)
f (
Hz)
0,1% Biotin
0,01% Biotin
0,001% Biotin
0,0001% Biotin
PLL
HSA+Biotin StreptavidinAuNP
!
Figure 6.7: QCM-D results from gold nano particles binding to a surface. The crystal was coatedwith PLL and a mixture of HSA and BSA-Biotin with di↵erent concentration was bound to the PLL.Rinsing with bu↵er after the solution with biotynilated BSA and HSA some of the material leavesthe surface making the frequency go up. Streptavidin was then added and biotynilated gold nanoparticles with the same concentration for all surfaces bound to the streptavidin. SEM images of thethe surfaces with the highest and lowest concentration of BSA-biotin can be seen in figure 6.8.
6.2.1 Comparison Between Intensity and Number of Surface Bound GoldNano Particles
During this project many experiments and measurements were carried out using the opticalwaveguide platform. Some for plain characterization and some to achieve and develop a sensingtechnique. One question was if there is a linear relationship between the intensity and gold nanoparticles bound to the surface. Figure 6.9 shows the number of particles binding to the surfaceover time and also the measured frame intensity over time. Comparing the absolute intensitychanges between two di↵erent measurement carried out on two di↵erent waveguides is a bit moredi�cult. The scattering signal response for the gold nano particles must be roughly the sameand to achieve this the settings are critical. This is sometimes preferred any way because itis much easier to determine the frame intensity than counting individual particles. Figure 6.9shows intensity and number of particles bound to the surface corresponding to the measurement
33

Chapter 6. Results
(a) QCM-D Surface with 1ppm Biotin (b) QCM-D Surface with 0,1% Biotin
Figure 6.8: Scanning electron microscope (SEM) images of the two QCM-D crystals used for bindinggold nano particles, the results can be seen in figure 6.7. (a) SEM image of the crystal with 1ppmbiotin in the HSA. (b) SEM image of the crystal with 0,1% biotin in the HSA.
results in figure 6.5.
Using the combination of functionalization with PLL and blocking with HSA have been shownin this work to not be e↵ective enough for use in the waveguide system. The biological systemused for these measurements can be seen in figure 6.4. At concentrations of biotynilated BSAapproximately 1000 times lower than the lowest possible concentration that could be measuredwith the QCM-D there were no contrast between the negative and positive control. Measure-ments with the waveguide system were inconsistent since the blocking was not good enough. Thenegative control could bind several hundreds of particles which is the same order of magnitudeas the lowest concentrations examined.
34

6.3. Validation of Amyloid-� 1-37 Detection using QCM-D and SPR
14 16 18 20 22 24 26 28 300
500
1000
1500
2000
# P
art
icle
s
Time (min)
14 16 18 20 22 24 26 28 300
3
6
9
12
Inte
nsi
ty
# ParticlesFrame intensity
Figure 6.9: Measurement of the number of particles in a frame and comparison with the intensityover the same frame for a image stack in a waveguide experiment. The waveguide was coated withPLL and a solution with a mixture of biotynilated BSA and HSA was added du to waveguide. Notethat the intensity is an arbitrary unit and can not be compared directly to other measurements. Thereis a clear indication that the intensity over a frame correlates well to the number of particles boundto the surface.
6.3 Validation of Amyloid-� 1-37 Detection using QCM-D andSPR
In order to investigate whether the biological system proposed for detection of amyloid-� couldbe implemented to the waveguide platform, it was first necessary to test it using reference meth-ods. For theses reference measurements QCM-D and SPR was used. Figure 6.10 is a schematicimage of this biological system which is an antibody sandwich assay. The antibody 6E10 wascovalently immobilized on the surface with APDMES and glutaraldehyde whereupon the surfacewas blocked with HSA. Amyloid-� 1-37 is known to bind 6E10 and a secondary antibody 4G8also bind to the peptide. The 4G8 antibody is biotynilated and streptavidin is used as a linkerbetween the 4G8 and the functionalized gold nano particle. The measurement with QCM-D andSPR are important references to gain knowledge how the biological system behaves.
The SPR measurement was done to test if the di↵erent antibodies behaved in a similar way asdescribed in a reference article by Muthu Ramakrishnan [19]. This was performed in order tovalidate the possibility to immobilize the antibody on other surfaces and keeping the functionalityof the antibody. Figure 6.11 shows that this was possible and that the protocol worked wellenough to proceed with. The antibody 6E10 could be immobilized and keep the functionalityand binding the amyloid-� peptide. There are two di↵erent functionalization methods used inthe SPR and the waveguide for immobilizing the 6E10 antibody. In the SPR measurement weused an EDC-NHS functionalization and in the waveguide APDMES and glutaraldehyde butboth target the same molecular groups of the 6E10.
Figure 6.12 shows the results from the QCM-D measurement on a SOG coated crystal. Thecrystal with SOG and functionalized with APDMES has shown to have little to no e↵ect on themeasurement compared to a regular SiO2 surface functionalized with APDMES. Results using
35

Chapter 6. Results
HSA
Biotin
AuNP
Streptavidin
4G8
Aß 1-37
6E10
Figure 6.10: Simple sketch of the di↵erent components of the immune assay. Antibody 6E10 isimmobilized on a surface that has been silanized by APDMES and the surface is blocked with HSA.The peptide of interest, amyloid-� 1-37, binds to the 6E10 antibody but not to the HSA. Biotinylated4G8 binds to the peptide and linked with streptavidin to a gold nano particle coated with PEG andbiotin. Note that the figure is not to scale.
2000 3000 4000 5000 6000 7000 8000 90001.2
1.4
1.6
1.8
2
2.2
2.4x 10
4
Time (s)
Re
spo
nse
Un
it
EDC-NHS
6E10
Ethanolamine
Aß 1-37
4G8
Figure 6.11: SPR measurement with the Amyloid-� system for reference. The surface was function-alized with EDC-NHS, 6E10 is the first antibody that was immobilized to the surface. Ethanolaminewas used to remove losely bound proteins on the surface. The peptide of interest, amyloid-� (250 nM)was then injected followed up by the secondary antibody 4G8. This measurement was done for refer-ence to literature for behavioral properties of the two antibodies.
QCM-D and the biological system described were easy to reproduce, the amount of antibody6E10 and HSA was the same between repeated measurements. The measurement also seemsindependent of what surface is used, SiO2 or SOG (data not shown). In the negative control nounspecific binding can be observed indicating that for this dynamic range the surface chemistryworks properly.
36

6.4. Immuno Assay for Detection of Amyloid-� 1-37 using the Optical Waveguide System
0 25 50 75 100 125 150 175 200 225 250!110
!90
!70
!50
!30
!10
10(a)
Time(min)
! F
(H
z)
0 25 50 75 100 125 150 175 200 225 2500
2
4
6
8
10
12
! D
0 25 50 75 100 125 150 175 200 225 250!110
!90
!70
!50
!30
!10
10(b)
Time(min)
! F
(H
z)
0 25 50 75 100 125 150 175 200 225 2500
2
4
6
8
10
12
! D
Amyloid!ß 1!376E10
6E10
Ethanolamine
Ethanolamine
HSA
HSA
4G8
4G8
Streptavidin
Streptavidin
AuNP
AuNP
Figure 6.12: QCM-D measurements for the amyloid-� antibody sandwich system. (a) is the positivemeasurement with 250 nM and (b) is the negative with the only di↵erence that the amyloid-� peptidewas not injected in the chamber of the negative control.The two di↵erent lines in the frequency shiftis two di↵erent overtones of the vibrating crystals.
6.4 Immuno Assay for Detection of Amyloid-� 1-37 using theOptical Waveguide System
In this section, the results from a method for detection of amyloid-� peptides are presented.Figure 6.13 show the result of the intensity measurement done on the biological system givenin figure 6.10 using the optical waveguide platform. In the preparation a solution with approx-imately 10 nM amyloid-� peptide was added and incubated for one hour with mixing each fiveminutes. During the measurement no gold nano particles were observed binding in the negativecontrol even though movement of particles could be seen coming close to the surface and thenleave again, indicating a good blocking of the system surface using HSA. The result presented infigure 6.13 is shown as intensity over time because the amount of particles that bound over timewas to many to be counted. As the curve in the positive control indicates the binding follows aexpected behavior for particles binding to a surface.
A series of measurements with di↵erent amyloid-� peptide concentrations were made, the resultsare presented in table 6.1. Figure 6.14 is one of the 100 fM measurements with image that showbefore and 15 minutes after gold nano particles were added. This indicates that the detectionregion is very low, even lower than the concentrations that have been used in this experiment.Even though this is a good indicator further experiments and measurements are necessary todetermine a detection limit.
37

Chapter 6. Results
Table 6.1: Number of particles counted for three di↵erent concentrations of the peptide amyloid-�1-37 in the waveguide system. The gold nano particles were counted 10 min after they were addedand the background was subtracted.
Concentration # Particles
10 nM >3000
1 nM 350 ± 10
10 pM 150 ± 10
100 fM 100 ± 10
1 2 3 4 5 6 7 8 9 100
50
100
150
200
250
300
Time (min)
Inte
nsity
10 nM peptideNegative control
Figure 6.13: Intensity measurement with the waveguide system of approx. 10 nM amyloid-� 1-37solution compared with the negative control. The two waveguide chips were functionalized in thesame manner and the biological system is the same except that the peptide has not been added in thenegative control. The two insets are the surfaces at the end of the measurement.
38

6.4. Immuno Assay for Detection of Amyloid-� 1-37 using the Optical Waveguide System
(a) Surface before injecting gold nano particles (b) Surface after 15 min
Figure 6.14: Measurement for detection of amyloid-� with the concentration 100 fM. The left imageis before gold nano particles was added and the right image shows the surface 15 minutes after. Somegold nano particles are marked one by one and the red area is a region with good contrast and manydetectible bindings.
39

7Discussion
In the work presented here there are many steps that must be individual done for eachmeasurement, from fabrication of the waveguide platform to building up the biologicalsystem and measurements. In this chapter, results and potential errors are discussed morein depth.
7.1 Gold Nano Particle Characterization using NTA and SEM
Measuring the size distribution with the NTA is quite straightforward and reliable. Comparingthe size of the gold nano particles obtained with the SEM, it is found that 10 nm have to besubtracted from the measured size obtained in the NTA to get the actual size. This has beenconsistent and is thought to originate from the fact that NTA measures the hydrodynamic par-ticle size while the SEM measures the gold nano particle core. For the scattering signal observedin the waveguide system this is more relevant because the scattering of the surface functional-ization on the gold nano particles will be negligible.
The use of NTA for concentration determination is not quite as straightforward. Setting theparameters in the software is much more critical, with the most critical being the thresholdoption. To get the most accurate result the threshold should be chosen in a way such that onlynano particles in focus are measured. One possible explanation for this is that the software is,as mentioned, based on a two dimensional algorithm. Being consistent with this gives the resultin figure 6.3.
7.2 QCM-D Measurements and Comparison with the Waveg-uide System
QCM-D is a well known and established technique and as far as equipment used it is very reliable.At the department where this project was done QCM-D is used frequently and the knowledgeabout the system and measurements are extensive. This is a good starting point for both prepa-rations, experiments and discussions involving the QCM-D system. Regarding the the resultsthis gives good confidence that no errors have been done with the aspect of the system. Mean-while there are factors that can e↵ect the result that can be summed up as the human factor.
40

7.3. Amyloid-� Measurements using Optical Waveguide
Dilutions, cleaning of chambers and tubes, the miss happening of injecting air in the chamber etc.
The results obtained with the QCM-D technique shows that the functionalized gold nano par-ticles works as probes and that the HSA works for blocking of the surface. At least at theconcentrations detectible in the QCM-D system. To remember is that on a single waveguideframe the lowest amount of gold nano particles that can be detected is around 7500 for theQCM-D, which is far above the detection region with the waveguide system.
Since the results obtained from the QCM-D measurements are approximately what was expectedand no errors were detected the conclusion is that the QCM-D results are valid. Unfortunately,the QCM-D results can not be compared to the waveguide system directly. The dynamic rangeof detection do not overlap between the waveguide and QCM-D. QCM-D has a wide dynamicrange while the waveguide has not, but the waveguide has a much lower detection limit. Thisresults in that there is no way to determine if the functionalization of the surface is good or notonly that it partly has worked. A surface that gives a good result in QCM-D does not necessar-ily mean that it has a good surface coverage which is crucial to measure the concentrations ofinterest in the waveguide system.
QCM-D measurements gives a lot of positive information though. One is that the biologicalsystem, seen in figure 6.10 behaves as hoped. It gives a strong indication that the bindings arespecific and that blocking with HSA to make the surface inert. We can also see that within thetime of interest there are no detectible detachments from the surface. Potentially this is goodfor measurements in the waveguide system, since if there are no detachments only a referenceimage is needed before injecting gold particles and on image after a specific time.
7.3 Amyloid-� Measurements using Optical Waveguide
The waveguide system used in this project have shown great potential for measurement of molec-ular bindings to a functionalized surface. This could be achieved without staining the moleculeswith fluorophore and instead use gold nano particles as labels, scattering the evanescent fielddirectly and monitoring with a regular upright microscope. In this section the problems andquestions that we have encountered during the process are discussed.
There are di↵erences between measuring with QCM-D and the waveguide system. In QCM-D aflow system is used for adding solutions to the chamber containing the surface this is somethingthat we do not have in the waveguide system, all solutions were added by hand with a pipettefor building up the biological system and to add gold nano particles in the waveguide system.Also with QCM-D all steps in building up the biological system can be followed in real time, thisis not possible with the waveguide. The big advantage for the waveguide system over QCM-Dis the low detection limit.
Fabrication of the waveguide platform is done by hand in the cleanroom laboratory at ChalmersUniversity of Technology, Sweden. This fabrication by it self is very delicate and susceptible toerrors. On several occasions it has been suspected that the surface at the sensing region is insome way not accessible for functionalization. This could have many di↵erent explanations. Oneis that the well has not been etched properly and that there is still CYTOP left at the surfaceor other residues from the fabrication. It is possible that this could happen but the explanation
41

Chapter 7. Discussion
has been discarded in this work because other experiments has not su↵ered the same problems.
A strong indication that the negative control measurement showing few or no particles bindto the surface is that the positive controls show more or less binding depending on the concen-tration. Zero binding has never been seen in a positive control but has been observed in negativecontrol. The suspicion of faulty silanization came from observations in varying results of thenegative control using HSA to block the surface minimizing unspecific binding to the surface.There were mainly two di↵erent result in the negative control, the expected one where very few(1-10) or no gold nano particles bound to the surface. This is of course very desired since itgives the possibility for a very low detection limit, with zero unspecific binding in theory thedetection limit is infinitely low. But some times the binding was massive with several thousandsof gold nano particles binding to the surface. To determine if the binding is an artifact or a goodpositive result for high concentration the time for the binding have to be considered. When thesurface is not blocked the binding happens very fast, under 30 seconds. For high concentrationwith good blocking this takes a lot longer time around 10 minutes.
From this profound di↵erence in binding behavior it can be concluded that this is a surfacefunctionalization or blocking problem. This narrows down the possible explanations to prob-lems with the silanization or covering the surface with HSA. Since the silane reacts with thesilanols on the surface it is important that the surface is very clean. This procedure is explainedin chapter 5. Due to the variating results for the negative control, it is suspected that the plasmatreatment was not su�cient and/or dependent how the process was done. Previous observationsfrom colleagues show that the e�ciency of the plasma treatment are dependent on where inthe chamber the sample is placed. In the work done here that has not been considered. Afterthe plasma treatment the waveguide has also been brought through air to be rinsed with milliQwater. This could build up a monolayer of dirt from the air on the surface. Also if the waveguideis not dried properly and there are water residues on the surface this will prevent silanization.In few measurements circular dark spots have been observed, which are thought to be waterresidues that have prevented silanization.
If the surface observed has been properly functionalized and gold nano particles are injectedwithout the surface being blocked massive binding to the surface is expected. The binding pro-cess here would also be very rapid. This leads to the suspicion that during the preparation of thewaveguide enough HSA has reached the surface to give a proper blocking. It was thought thatthe relative high concentration of HSA would be enough to get a good monolayer of HSA on thesurface. A fully satisfying answer to this problem has not been reached at the time of writingbut there are good indications that this can be solved. This will be achieved by optimizing theprocess by ensuring that the plasma treatment is good, taking precautions with the rinsing withmilliQ and the drying process and have a solid procedure for silanization. It has been observedthat evaporating the silanes on to the surface gives a better and more even result as comparedto solution based silane.
Another important source of faulty results relates to the problem of getting materials, i.e pro-teins and particles to the sensor interface due to di↵usion limitations, which has large impactin stationary systems without controlled flow like the waveguide system. Therefore all stepsexcept the blocking stage with HSA was mixed each five minutes with a pipet. Not mixingthe HSA might have been a mistake. Also this di↵usion limit could be more severe at this low
42

7.4. Image and Data Processing
concentrations and volumes. To exemplify this think about the experiment with the 100 fMamyloid-� solution. In this experiment approximately 100 gold nano particles bound to the74µm by 74µm frame. The well is 2mm by 2mm, which gives approximately 730 measurementframes which results in total 73 000 molecule bound to the well bottom surface. In the solutionon the well there are about 1 800 000 peptides in total this gives that the concentration has gonedown about 4%. This is the theoretical case. The peptide can also stick to other surfaces duringthis process for example in the mixing of the solution the peptide can stick to inner walls of thecontainer tube used for mixing the solution, or the inside of the pipet tips. This is especiallycritical at this low concentrations.
All handling of the sample is a potential risk. This includes the rinsing and mixing of thesample in each step. It is a bit harder than one might think, by mistake it is very easy to scratchthe surface with the pipet tip. What e↵ect this kind of contact has is not totally clear but shouldbe avoided.
Measurement with the waveguide system is not as straight forward as compared to the QCM-D.There are many di↵erent parameters that have to be considered before starting a measurement.Laser power, laser fiber alignment, exposure time, gain, find a good place etc. must be opti-mized. One major problem is the stripes observed in figure 6.5, at the time this is written thereare no satisfying explanation for this. They can be avoided by finding a very small interval inthe z-direction of the laser fiber. This is not always easy and over time they can reappear dueto drift in the micro screws used to align the fiber.
A good illumination and exposure settings are important to be able to process the gatheredimages. To get the optimal signal to noise ratio the bound gold nano particles should notsaturate but be just below saturation to use the dynamic range the camera have to o↵er.
7.4 Image and Data Processing
For image processing the free software ImageJ has been used. It is a great tool for handlingimage stacks and processing images but can sometimes be hard to handle for good results. Usingthe particle count plugin in ImageJ a threshold must be chosen for at what intensity peaks willbe counted as particles. There are a couple of things that can go wrong here and must be keptin mind. One thing that must be considered is the illumination varying in time. If it is, particlesthat have been counted in one frame could not be counted in the next even if the particle isstill attached to the surface due to that the drop in illumination makes the particle go underthe set threshold. The intensity can be corrected by choosing a particle on the surface that onewould guess should not change its intensity over time and use that to correct for intensity drift.Unfortunately there are local changes in intensity as could be seen in figure 6.5. These stripescan move over time making it very hard to make corrections in a good way.
43

8Conclusion
In this work 20 nm surface functionalized gold nano particles were successfully visualizedbound to a streptavidin modified surface using a regular upright microscope, 532 nm laserand a planar symmetric optical waveguide. The gold nano particles were bound to thefunctionalized core layer of the waveguide where they could be visualized due to their abil-
ity to scatter the evanescent field on the surface. Measurements were done in liquid and in realtime making it possible to determine if a gold nano particle bound reversible or irreversible.
Comparing the dynamic range of the waveguide with the dynamic range of QCM-D it is shownthat the waveguides highest range of bound gold nano particles that could be measured isaround one order of magnitude lower then the lowest possible detection of gold nano particleswith QCM-D. Since the waveguide in theory has an infinitely low detection limit a lot of workhave been done regarding the surface chemistry and on improving the background signal. Withproper silanization and covalently bound HSA as a blocking agent a good inert surface wasachieved. This was not the case when the surface was functionalized with PLL and HSA waselectrostatically bound down to the surface. To get material, di↵erent molecules and gold nanoparticles, down to the surface mixing the solution is of great importance. We also saw that evenat relative high concentrations it can be di�cult to get material down to the surface due todi↵usion limitations.
A biosensing technique for detection of amyloid-� was developed based on an antibody sand-wich and using biotynilated gold nano particles as labels. Using this biological system on thewaveguide, concentration down to 100 fM of amyloid-� 1-37 could be detected.
44

9Future Perspectives
Even though the results presented here are very promising there are a lot of morework that could be done. Both to validate the results further, but also there is a lot ofpotential in the system presented in this work.
9.1 Solving Blocking and Functionalization Problems
As mentioned in the chapter 7 there has been some problem with blocking the surface andmaking the measurements consistent. This problem is thought to arise due to a systematic errorand should be able to be solved. To do this every step should be validated more in detail thentime have allowed in this work. Maybe the most critical is the examine the plasma cleaning andthe protocol of cleaning the waveguide platform. Evaporation of silan on the surface to get amore homogenous silan monolayer should also be investigated further.
9.2 Multiple Wavelength Measurements for Ratio Determina-tion of Di↵erent Amyloid-� Peptides
In the optical waveguide system multiple lasers can be used for illumination. This gives theopportunity to use di↵erent label nano particles for di↵erent molecules binding to the surface.Using silver nano particles and gold nano particles with green and blue laser will make it easyto distinguish two di↵erent molecules binding to the surface.
This could be used for example to measure the ration between amyloid-�42/amyloid-�40 pep-tides mentioned in the introduction. Hopefully this can be done just by analyze the RGB valuesof a single frame.
9.3 Smartphone Applications
By using a regular smartphone, the optical waveguide platform, laser and cheap ”toy” opticsimages on surfaces covered with 65 nm can be seen in figure 9.1 and 9.2. Hopefully this can beused to create a cheap method and device to be able to detect di↵erent molecules in solutions.
45

Chapter 9. Future Perspectives
(a) Full image of the negative control (b) Well crop of negative control
Figure 9.1: The image of the negative control sample. (a) is the full image from the iPhone and(b) is the well cropped out digitally, the area is indicated by the red dotted line. Here there is a verylow intensity indicating that no gold nano particles or very few have bound to the surface.
(a) Full image of the positive control (b) Well crop of positive control
Figure 9.2: Image of the positive control with 65 nm gold nano particles bound to the surface. (a)is the full image and (b) is the well cropped out digitally, the area is indicated by the red dotted line.
46

Bibliography
[1] McManus, T. (2009) The future of mind-controlled prostheses. O & P Business News :Linking the Orthotic and Prosthetic Profession 18, 20–22,24. Copyright - Copyright SLACKINCORPORATED Oct 15, 2009; Last updated - 2010-06-06.
[2] Zetterberg, H. (2007) Identification of a beta]-amyloid-binding plasma protein, lrp1: impli-cations for biomarker research and therapy in alzheimer’s disease. Biomarkers in Medicine1, 347–8.
[3] Blennow, K, de Leon, Mony, J, & Zetterberg, H. (2006) Alzheimer’s disease. The Lancet368, 387–403.
[4] Blennow, K, Zetterberg, H, & Fagan, A. M. (2012) Fluid biomarkers in Alzheimer disease.Cold Spring Harbor perspectives in medicine 2, a006221.
[5] Sagare, A, Rashid, D, Bell, R. D, Johnson, B, Hamm, K, Pendu, R, Marky, A, Lenting,P. J, Wu, Z, Zarcone, T, Goate, A, Mayo, K, Perlmutter, D, Coma, M, Zhong, Z, &Zlokovic, B. V. (2007) Clearance of amyloid-beta] by circulating lipoprotein receptors.Nature medicine 13, 1029–31.
[6] Axelrod, D. (1989) in Fluorescence Microscopy of Living Cells in Culture Part B. Quanti-tative Fluorescence Microscopy–Imaging and Spectroscopy, Method. Cell Biol., eds. Taylor,D. L & Wang, Y.-L. (Academic Press) Vol. 30, pp. 245–270.
[7] Agnarsson, B, Ingthorsson, S, Gudjonsson, T, & Leosson, K. (2009) Evanescent-wavefluorescence microscopy using symmetric planar waveguides. Optics express 17, 5075–82.
[8] Phillips, R, Kondev, J, & Theriot, J. (2009) Physical Biology of the Cell. (Garland Science).
[9] Jones, R. A. L. (2011) Soft Condensed Matter. (Oxford University Press).
[10] Bongrand, P. (1999) Ligand-receptor interactions. Rep. Prog. Phys 921.
[11] Glenner, G. G & Wong, C. W. (1984) Alzheimer’s disease: initial report of the purificationand characterization of a novel cerebrovascular amyloid protein. 1984. Biochemical andbiophysical research communications 425, 534–9.
[12] Jansho↵, a, Galla, H, & Steinem, C. (2000) Piezoelectric Mass-Sensing Devices asBiosensors-An Alternative to Optical Biosensors? Angewandte Chemie (International ed.in English) 39, 4004–4032.
47

BIBLIOGRAPHY
[13] Sauerbrey, G. (1959) Verwendung von schwingquarzen zur wagung dunner schichten undzur mikrowagung. Zeitschrift Fur Physik 155, 206–222.
[14] Cooper, M. a. (2004) Advances in membrane receptor screening and analysis. Journal ofmolecular recognition : JMR 17, 286–315.
[15] Rodahl, M, Hook, F, Krozer, A, Brzezinski, P, & Kasemo, B. (1995) Quartz crystal mi-crobalance setup for frequency and Q-factor measurements in gaseous and liquid environ-ments. Review of Scientific Instruments 66, 3924.
[16] Branden, M, Tabaei, S. R, Fischer, G, Neutze, R, & Hook, F. (2010) Refractive-index-basedscreening of membrane-protein-mediated transfer across biological membranes. Biophysicaljournal 99, 124–33.
[17] Saveyn, H, De Baets, B, Thas, O, Hole, P, Smith, J, & Van der Meeren, P. (2010) Accurateparticle size distribution determination by nanoparticle tracking analysis based on 2-DBrownian dynamics simulation. Journal of colloid and interface science 352, 593–600.
[18] Dragovic, R. a, Gardiner, C, Brooks, A. S, Tannetta, D. S, Ferguson, D. J. P, Hole, P, Carr,B, Redman, C. W. G, Harris, A. L, Dobson, P. J, Harrison, P, & Sargent, I. L. (2011) Sizingand phenotyping of cellular vesicles using Nanoparticle Tracking Analysis. Nanomedicine :nanotechnology, biology, and medicine 7, 780–8.
[19] Ramakrishnan, M, Kandimalla, K. K, Wengenack, T. M, Howell, K. G, & Poduslo, J. F.(2009) Surface plasmon resonance binding kinetics of Alzheimer’s disease amyloid betapeptide-capturing and plaque-binding monoclonal antibodies. Biochemistry 48, 10405–15.
48 48


![Single Molecule Microscopy and Hole-Burning Spectroscopy ...€¦ · droplets [xvi,xvii] using confocal microscopes and sensitive optical detection schemes. Direct imaging of single](https://static.fdocuments.net/doc/165x107/5ed9264f6714ca7f47693d21/single-molecule-microscopy-and-hole-burning-spectroscopy-droplets-xvixvii.jpg)


