Simulation Software as a Tool for Supply Chain Analysis ... · supply chains were analysed,...
16
Computer Science and Information Systems 13(3):983–998 DOI: 10.2298/CSIS160803039S Simulation Software as a Tool for Supply Chain Analysis and Improvement Cuauhtémoc Sánchez Ramírez 1* , Dulce Rocío Mota López 1 , Giner Alor Hernández 1 , Jorge Luis García Alcaraz 2 , Diego Alfredo Tlapa Mendoza 3 1 Division of Research and Postgraduate Studies, Instituto Tecnológico de Orizaba, Av. Oriente 9, 852. Col Emiliano Zapata, C.P. 94320 Orizaba, Veracruz, México. {csanchez, galor}@itorizaba.edu.mx, [email protected] 2 Department of Industrial Engineering, Autónoma de Ciudad Juárez, Avenida del Charro, # 450 Norte Colonia Partido Romero, C.P. 32310 Ciudad Juárez, Chihuahua, México [email protected] 3 Engineering, Architecture and Design Faculty, Universidad Autónoma de Baja California, Carretera Transpeninsular Ensenada-Tijuana # 3917, Colonia Playitas. C.P. 22860. Ensenada, Baja California, México [email protected] Abstract. Effective decision making in the automotive supply chain is complex, due to the increasing number of suppliers and customers who form part of it. For this reason, the use of tools that allow to improve the performance of the supply chain is necessary. Simulation Software is one of these tools. Therefore, in this paper a simulation model to improve the performance of an automotive supply chain is developed. Using sensitivity analysis, this study finds the values that allow the supply chain to improve its order fulfilment indicator. In the sensitivity analysis, the variables Cycle Time, Production Adjustment Time, Delivery Time, Raw Material Inventory, and Finished Good Inventory, were modified. The results show that: 1) in the base line scenario, only the 78.85% of the orders are fulfilled, and 2) to fulfil the 100% of the orders Cycle Time, Production Adjustment Time, and Delivery Time must be reduced to one week. Keywords: simulation software, supply chain automotive, decision making. 1. Introduction In a globalized market, such as the automotive sector, both assemblers and suppliers have been forced to improve their processes and products, as well as to define strategies to enlarge their warranty time and offer better after-sale services. Thus, strategies based only on costs are no longer the base for a competitive advantage. In the automotive sector, proper supply chain management is key for its success due to the amount of components needed to manufacture a vehicle. According to [1], a supply chain (SC) is a network of independent organizations working in coordination to control, manage, and improve the material flow and information, from the raw material suppliers to the final customer. Also, SC can be defined as a network of autonomous or semiautonomous business entities collectively responsible for moving a product or service from the supplier to the customer [2]. In this
Transcript of Simulation Software as a Tool for Supply Chain Analysis ... · supply chains were analysed,...
Computer Science and Information Systems 13(3):983–998 DOI: 10.2298/CSIS160803039S
Simulation Software as a Tool for Supply Chain Analysis and Improvement
Cuauhtémoc Sánchez Ramírez1*, Dulce Rocío Mota López1, Giner Alor Hernández1, Jorge Luis García Alcaraz2, Diego Alfredo Tlapa Mendoza3
1 Division of Research and Postgraduate Studies, Instituto Tecnológico de Orizaba, Av. Oriente 9, 852. Col Emiliano Zapata, C.P. 94320 Orizaba, Veracruz, México.
{csanchez, galor}@itorizaba.edu.mx, [email protected] 2 Department of Industrial Engineering, Autónoma de Ciudad Juárez, Avenida del Charro, #
450 Norte Colonia Partido Romero, C.P. 32310 Ciudad Juárez, Chihuahua, México [email protected]
3 Engineering, Architecture and Design Faculty, Universidad Autónoma de Baja California, Carretera Transpeninsular Ensenada-Tijuana # 3917, Colonia Playitas. C.P. 22860. Ensenada,
Baja California, México [email protected]
Abstract. Effective decision making in the automotive supply chain is complex, due to the increasing number of suppliers and customers who form part of it. For this reason, the use of tools that allow to improve the performance of the supply chain is necessary. Simulation Software is one of these tools. Therefore, in this paper a simulation model to improve the performance of an automotive supply chain is developed. Using sensitivity analysis, this study finds the values that allow the supply chain to improve its order fulfilment indicator. In the sensitivity analysis, the variables Cycle Time, Production Adjustment Time, Delivery Time, Raw Material Inventory, and Finished Good Inventory, were modified. The results show that: 1) in the base line scenario, only the 78.85% of the orders are fulfilled, and 2) to fulfil the 100% of the orders Cycle Time, Production Adjustment Time, and Delivery Time must be reduced to one week.
Keywords: simulation software, supply chain automotive, decision making.
1. Introduction
In a globalized market, such as the automotive sector, both assemblers and suppliers have been forced to improve their processes and products, as well as to define strategies to enlarge their warranty time and offer better after-sale services. Thus, strategies based only on costs are no longer the base for a competitive advantage. In the automotive sector, proper supply chain management is key for its success due to the amount of components needed to manufacture a vehicle.
According to [1], a supply chain (SC) is a network of independent organizations working in coordination to control, manage, and improve the material flow and information, from the raw material suppliers to the final customer. Also, SC can be defined as a network of autonomous or semiautonomous business entities collectively responsible for moving a product or service from the supplier to the customer [2]. In this
984 Cuauhtémoc Sánchez-Ramírez et al.
context, a SC network is essentially an information-flow-driven dynamic network with the operation of material flow and cash flow, which add complexity to the network [3]. Furthermore, the current SC design and structure increase this complexity.
In order to overcome shortcomings of the traditional analytical methods in modelling and analysing SC networks, simulation – especially discrete event simulation – has been widely used as a decision-making tool for supply chain optimisation. Simulation is the process of exercising a model for a particular instantiation of the system and specific set of inputs in order to predict the system‟s response [4]. It has been widely recognized as the best and most suitable methodology for investigation and problem-solving in real-world and complex systems in order to choose correctly, understand why, diagnose problems, explore possibilities, train personnel and managers, and find optimal solutions [5].
From a similar perspective, supply chain simulation is defined as a kind of scientific method that builds and runs the simulation model of a real-world supply chain system. This method allows users to observe the operation of the entire SC and perform a “What if” analysis among different scenarios [6].
In this regard, computer simulations allow users to try out different strategies or alternatives without actually implementing them in practice. Another advantage of supply chain simulation is that it helps reduce costs, as changing real systems can be expensive [7]. Similarly, it increases customer satisfaction, because customers, in general, do not like to be part of „„failed experiments‟‟ [2]. In addition, SC performance improvement initiatives strive to match supply with demand, thereby driving costs down while improving customer satisfaction. There are several cases of SC computer simulation, from RFID-enabled supply chain analysis [8], construction supply chain [9], automotive supply chain framework [10], to selection of new facility in supply chain [11], among others.
As regards the automotive supply chain, simulation is submitted to many decisions. Moreover, the number of variables and key indicators to be considered in the evaluation and model development are much extended and complex. People only consider a part of these variables, or the ones they believe are the most important. Unfortunately, this limits the best solution area, thus reducing the effectiveness of the decision [12].
The modelling process is crucial from the supply chain resilience perspective. The simulation model should provide adequate performance measures to assess the real system‟s behavior [13]. One of the principal key performance indicators (KPI) for SCs is order fulfilment. Two variables that impact on this indicator are cycle time and inventory management [14].
Since SC has been widely improved by system dynamics (SD) based simulation modelling [15, 16, 17], this article proposes a SD-based simulation model through a sensitivity analysis that aims at evaluating the impact of five variables on the automobile SC performance. These variables are: Cycle Time (CT), Production Adjustment Time (PAT), Delivery Time (DT), Raw Material Inventory (RMI), and Finished Good Inventory (FGI). The case study is conducted in a Mexican company that is member of the Automotive Cluster of Coahuila.
The article is thus structured as follows: section 2 presents the background on SC and the SD approach, while section 3 discusses the model development. Then, section 4 reports the results from the analysis. Finally, section 5 includes the conclusions and directions for future work.
Simulation Software as a Tool for Supply Chain Analysis and Improvement 985
2. Background
Several articles that indicates the tools and techniques to evaluate the performance of supply chains were analysed, focusing primarily on the simulation tool. Subsequently, several articles that uses SD to simulate supply chains were selected. In this case, only those that consider cycle time in their supply chain evaluation performance and those that are applicable to the automotive industry were taken in consideration.
2.1. Supply Chain
The main objective of SC management is to create initiatives to improve SC development, while diminishing costs and improving customer service. To accomplish this, suppliers, producers, and distributors must be in constant synchronization [18]. However, in the practice, this is not always possible to achieve. Some of the most common obstacles include failure to comply with time agreed and scheduled [19], variability of cycle times in every SC process, uncertainty (which can affect the demand) [20], and custom problems among countries [21].
Fortunately, many decision-making techniques and tools have been developed to analyse and evaluate SC performance. They depend on the attributes or variables to be considered and the goal of the analysis. Similarly, these techniques and tools are included in three main categories: economic, multi-criteria, and simulation.
Economic techniques integrate the attributes to be measured in a monetary quantity, while multi-criteria techniques integrate qualitative and quantitative attributes. Finally, simulation methods are a combination of both economic and multi-criteria tools [22, 22]. Simulation models have been used for SC evaluation in terms of B2B collaboration [23], electric SC distribution [25], partnership performance evaluation [26], and SC sustainability [27, 28], among others.
Simulation is an effective tool in production operations and logistics systems. Its main strength – if compared with math programming methods or stochastic models – is that users can observe, analyse, and learn the system‟s dynamic behaviours [12] from the simulation model. There are different types of simulation for SC evaluation, but five are the most important: i) Simulation on calculation sheet; ii) System dynamics (SD); iii) Discrete event simulation; iv) Dynamics systems; and v) Business simulators. This study relies on a SD approach, since it helps easily represent delays, which expose the behaviour of the system studied [29].
2.2. Supply Chain under a System Dynamics Approach
SD is a methodology developed by Jay Forrester in the beginning of the 60s. Thanks to its interdisciplinary focus, SD helps understand the dynamic characteristics of a complex system. Similarly, causal loop diagrams are the main tools of this methodology [30].
Many SD-based simulation models have been developed for many contexts, and they all consider cycle time as an important variable affecting the performance of both SCs and the automotive industry. For instance, [31] developed a model to analyse planning
986 Cuauhtémoc Sánchez-Ramírez et al.
strategies of SC resources, whereas [32] proposed strategies for a food SC, where transport and delivery times were important factors. Likewise, [33] analysed the increasing capacity of a SC in which the product lifetime was short. Among the relevant variables, authors considered production time adjustments to ensure fast response to the demand.
From a similar perspective, [34] evaluated the impact of the Tohoku Earthquake as a disruption to the industrial SCs of Japan in 2011. Similarly, the work of [35] presented a multi-tier study on SC performance in the automotive industry, while [36] proposed a model to evaluate inventory trends in emerging market supply chains. Finally, cost reduction in the procurement processes of an automotive SC is analysed in [37].
3. Development of the Model
In Mexico, the automotive industry is important for the national economy. It accounts for 6% of the country‟s Gross Domestic Product (GDP) and represents 18% of the total employment in the manufacturing sector [38].
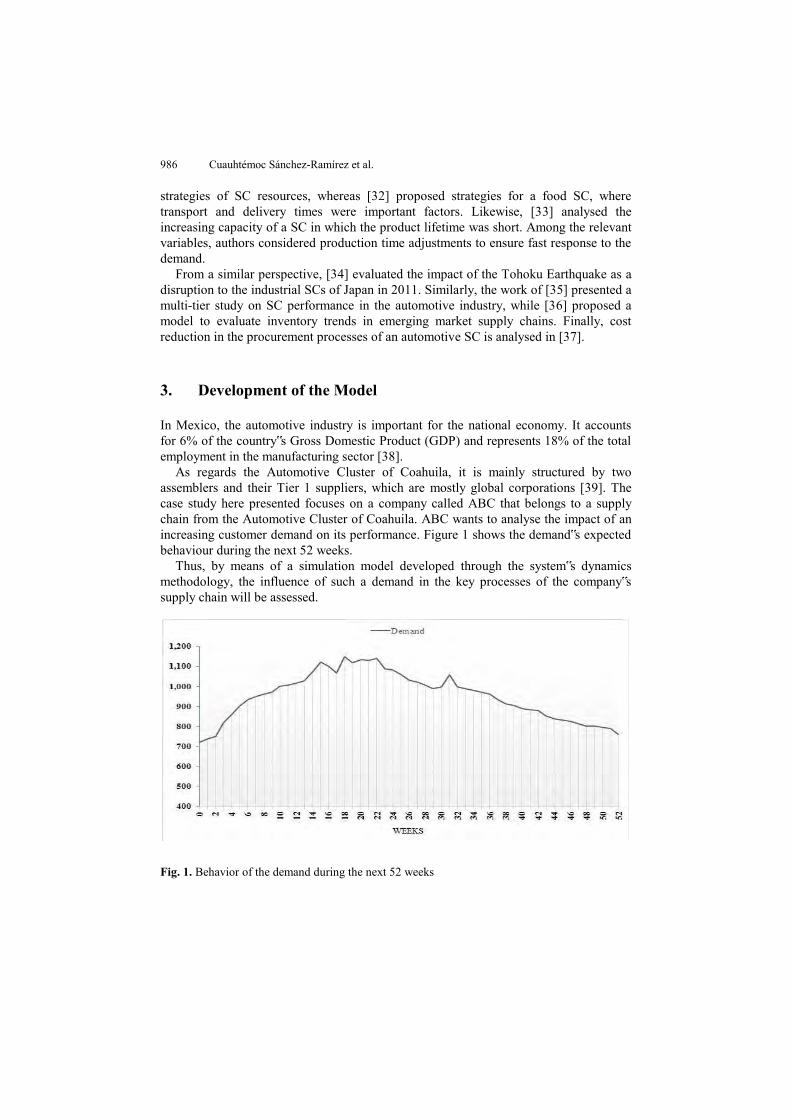
As regards the Automotive Cluster of Coahuila, it is mainly structured by two assemblers and their Tier 1 suppliers, which are mostly global corporations [39]. The case study here presented focuses on a company called ABC that belongs to a supply chain from the Automotive Cluster of Coahuila. ABC wants to analyse the impact of an increasing customer demand on its performance. Figure 1 shows the demand‟s expected behaviour during the next 52 weeks.
Thus, by means of a simulation model developed through the system‟s dynamics methodology, the influence of such a demand in the key processes of the company‟s supply chain will be assessed.
Fig. 1. Behavior of the demand during the next 52 weeks
Simulation Software as a Tool for Supply Chain Analysis and Improvement 987
3.1. Causal Loop Diagram
The works of [40, 41] are considered to structure the causal loop diagram, which is divided in three processes for a better comprehension: 1) Sourcing, 2) Production and, 3) Distribution and Evaluation. These processes are described below.
Sourcing: Raw Material Inventory: Inventory level of available material for the
production process. Orders to Supplier: Indicates when a raw material order has been generated to
the supplier. Delivery Time: Time that the supplier takes to make the order.
Production: Production Capacity: Maximum production capacity of a company, according
to its resources. Cycle Time: Time to transform raw material into a finished good.
Distribution and Evaluation: Demand: Customer requirements. Evaluation: Difference between customer requirements and what the company
supplies of those requirements. Finished Good Inventory: Inventory level of finished product used to supply
the orders. Shipments to Customers: Orders supplied to customers.
Figure 2 shows the main variables of the model through a causal loop diagram. In order to understand a causal loop diagram, it is necessary to analyze the cause-effect relationships ( among the variables. For instance, variable Production Capacity has a positive relationship with Production Rate (represented by the positive sing in the arrowhead). This means that if the Production Capacity increases, the Production Rate will also increase, and vice versa. Conversely, Cycle Time has a negative relationship with Production Rate (represented by the negative sing in the arrowhead). Thus, if the Cycle Time increases, the Production Rate will decrease, and vice versa.
A closed loop of causes and effects forms a feedback loop, which defines the dynamics of the model. The feedback loops of the diagram are described below:
Loop B1: If the Raw Material Inventory decreases, the number of Orders to Supplier will surge. This increases the amount of Raw Material in Transit. When Raw Material in Transit is delivered to the company, the Raw Material Inventory will grow.
Loop B2: If the Finished Good Inventory increases, the number of Shipments to Customers will also increase. Increased Shipments to Customers will decrease the Finished Good Inventory.

988 Cuauhtémoc Sánchez-Ramírez et al.
Fig. 2. Causal loop diagram
3.2. Equations
The equations from the simulation model that correspond to the key processes of the automotive supply chain are described below.
Sourcing. In the supply chain, the orders to supplier (OS) are requested according the condition shown by Equation 1.
IF RMI + RMT <= OP THEN SP ELSE 0, (1)
where SP is the supplier lot, RMI is the raw material inventory, RMT is the raw material in transit, and OP represents the order point. Thus, if the sum of RMI and RMT is less than or equal to OP, an order will be requested. RMI behaves as expressed in Equation 2.
d(RMI) = OS(t) - RP(t), (2)
where RP stands for the real production.
Production. The production (P) is calculated as the sum of the demand (D) and the product of such D and the correction factor (CF), as described in Equation 3.
P = D + (D*CF) (3)
However, due to the time lag in the production process, it is necessary to calculate the desired production level (DPL) to correct such time lag (Equation 4).
DPL = DELAY(P, PAT) (4)
Simulation Software as a Tool for Supply Chain Analysis and Improvement 989
The function DELAY is used to represent the time lag, which returns a delayed value of P, with a duration specified by the production adjustment time (PAT).
In addition, it is necessary to consider that P is limited by constraints such as the company‟s production capacity (PC) and the available RMI. Therefore, the RP is the minimum between the DPL, PC and RMI, as shown in Equation 5.
RP = MIN{DPL, PC, RMI} (5)
Thus, the finished good inventory (FGI) behaves according to Equation 6.
d(FGI) = RP(t) - SCT (t), (6)
where SCT are the shipments to customers (SCT takes the minimum value between FGI and D) calculated by Equation 7.
STC = MIN{FGI, D} . (7)
Distribution and evaluation. The total shipments to customers (TSC) and the total demand (TD) are calculated as expressed in Equations 8 and 9, respectively.
n TSC = Σ STCi
i=1
(8)
n TD = Σ Di,
i=1 (9)
where n is the number of weeks simulated. Finally, the KPI considered in the simulation model is Order fulfilment OF, since it measures the company‟s responsiveness to comply with customer orders (Equation 10).
OF = (TSC/TD)*100% (10)
4. Results and Analysis
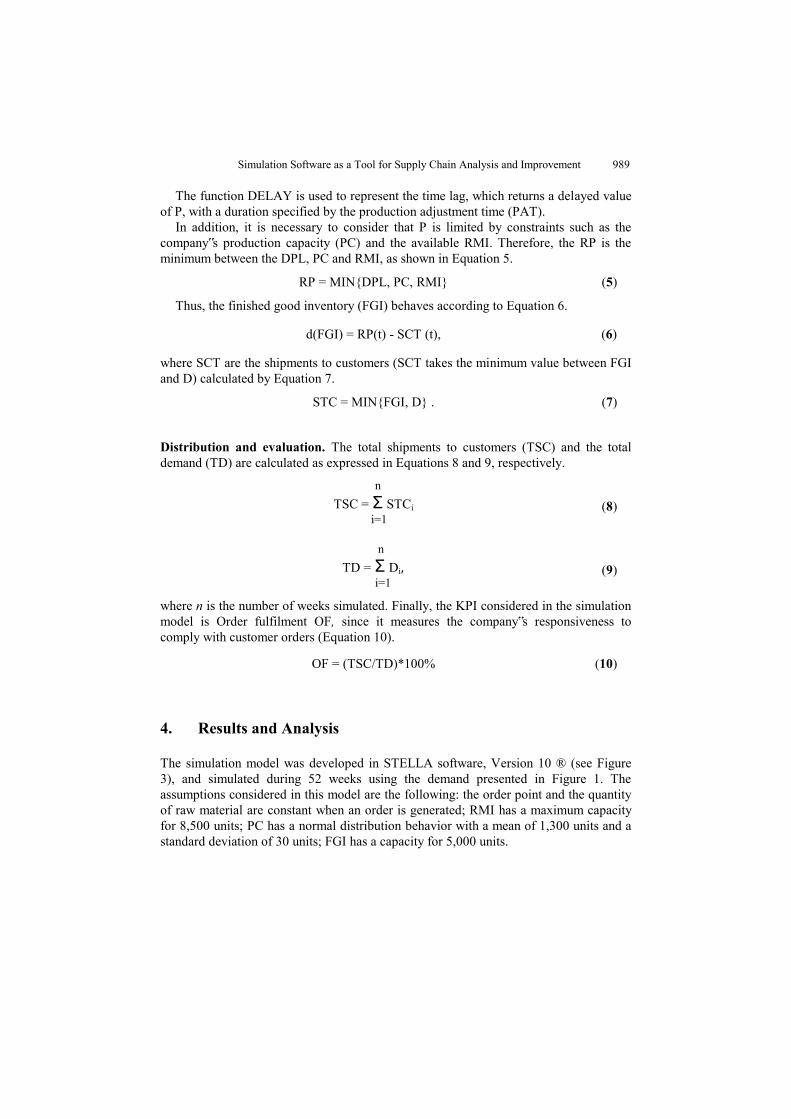
The simulation model was developed in STELLA software, Version 10 ® (see Figure 3), and simulated during 52 weeks using the demand presented in Figure 1. The assumptions considered in this model are the following: the order point and the quantity of raw material are constant when an order is generated; RMI has a maximum capacity for 8,500 units; PC has a normal distribution behavior with a mean of 1,300 units and a standard deviation of 30 units; FGI has a capacity for 5,000 units.
990 Cuauhtémoc Sánchez-Ramírez et al.
Fig. 3. Simulation model
Table 1, indicates the initial simulation values and results of the model. The parameters Cycle Time, Production Adjustment Time, Order Point, Raw Material Inventory and Finished Good Inventory, were obtained from data provided by the ABC company, while the Delivery Time of Raw Material and Supplier Lot are parameters defined by the company‟s supplier. As can be observed, during the 52 weeks six orders for raw material are placed. Also, only 78.85% of the orders are fulfilled, since it takes three weeks to receive the raw material. This demonstrates that variable Delivery Time of raw material has an important impact on the company‟s performance.
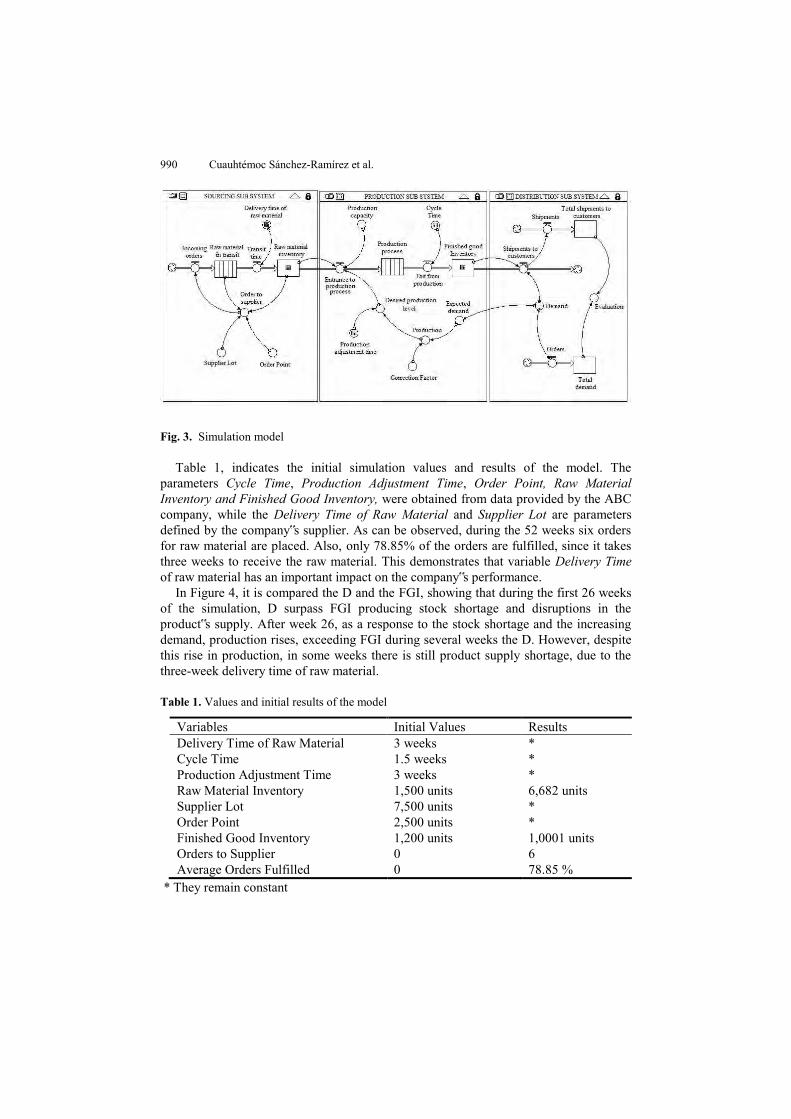
In Figure 4, it is compared the D and the FGI, showing that during the first 26 weeks of the simulation, D surpass FGI producing stock shortage and disruptions in the product‟s supply. After week 26, as a response to the stock shortage and the increasing demand, production rises, exceeding FGI during several weeks the D. However, despite this rise in production, in some weeks there is still product supply shortage, due to the three-week delivery time of raw material.
Table 1. Values and initial results of the model
Variables Initial Values Results Delivery Time of Raw Material 3 weeks * Cycle Time 1.5 weeks * Production Adjustment Time 3 weeks * Raw Material Inventory 1,500 units 6,682 units Supplier Lot 7,500 units * Order Point 2,500 units * Finished Good Inventory 1,200 units 1,0001 units Orders to Supplier 0 6 Average Orders Fulfilled 0 78.85 %
* They remain constant
Simulation Software as a Tool for Supply Chain Analysis and Improvement 991
Fig. 4. Demand vs FGI according to the initial simulation values
4.1. Sensitivity Analysis and Results
As shown in Table 1, the company would not successfully satisfy the customer‟s orders if the demand were the one presented in Figure 1. A sensitivity analysis is therefore conducted to find the values in the variables that will enable to fulfil all the orders, and thus improve ABC‟s performance. As mentioned in the introduction, variables CT, PAT, DT, RMI, and FGI are considered in the evaluation. The values for CT were chosen according to operational specifications of the company, while PAT, RMI and FGI were defined though the experience of the company‟s managers and DT corresponds to the delivery service provided by the raw material supplier. Thus, two scenarios are proposed in the simulation.
The first scenario considers the following data: CT= 1.5 weeks PAT = 1, 2, and 3 weeks DT = 1, 2, and 3 weeks RMI = 1000, 2000, and 3000 units FGI =1000, 2000, and 3000 units Table 2 shows the results from the first scenario evaluation. Note that CT remains
constant during the evaluation, since it is a critical variable. The table 2, indicates that among the set values exist a behavioral pattern. In general, a larger DT and PAT, decreases the OF. In the other hand, a larger RMI and a larger FGI, increases the OF. This behavioral pattern, prove the logic described in the causal diagram. Unfortunately, in this scenario it is not possible to fulfil 100% of the orders. Order fulfilment would increase up to 99.02% with CT=1.5, PAT=1, DT=1, RMI=2000 and FGI=3000.
992 Cuauhtémoc Sánchez-Ramírez et al.
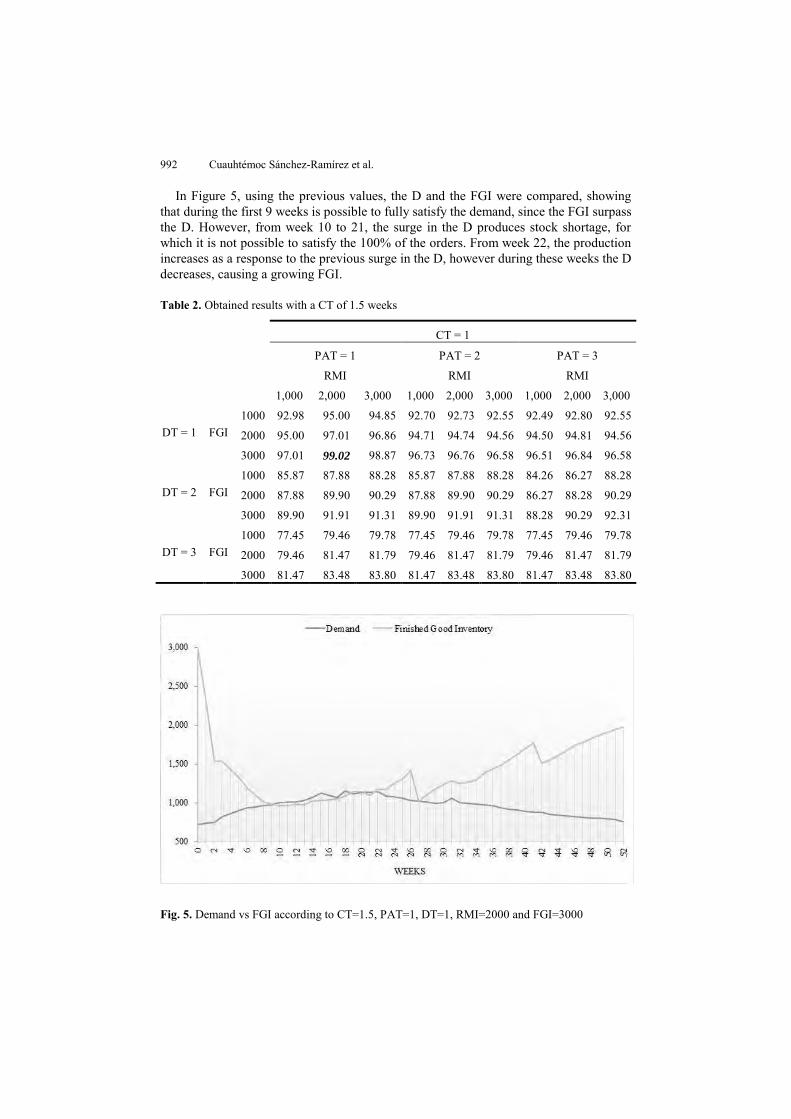
In Figure 5, using the previous values, the D and the FGI were compared, showing that during the first 9 weeks is possible to fully satisfy the demand, since the FGI surpass the D. However, from week 10 to 21, the surge in the D produces stock shortage, for which it is not possible to satisfy the 100% of the orders. From week 22, the production increases as a response to the previous surge in the D, however during these weeks the D decreases, causing a growing FGI.
Table 2. Obtained results with a CT of 1.5 weeks
CT = 1
PAT = 1 PAT = 2 PAT = 3
RMI RMI RMI
1,000 2,000 3,000 1,000 2,000 3,000 1,000 2,000 3,000
DT = 1 FGI 1000 92.98 95.00 94.85 92.70 92.73 92.55 92.49 92.80 92.55
2000 95.00 97.01 96.86 94.71 94.74 94.56 94.50 94.81 94.56
3000 97.01 99.02 98.87 96.73 96.76 96.58 96.51 96.84 96.58
DT = 2 FGI 1000 85.87 87.88 88.28 85.87 87.88 88.28 84.26 86.27 88.28
2000 87.88 89.90 90.29 87.88 89.90 90.29 86.27 88.28 90.29
3000 89.90 91.91 91.31 89.90 91.91 91.31 88.28 90.29 92.31
DT = 3 FGI 1000 77.45 79.46 79.78 77.45 79.46 79.78 77.45 79.46 79.78
2000 79.46 81.47 81.79 79.46 81.47 81.79 79.46 81.47 81.79
3000 81.47 83.48 83.80 81.47 83.48 83.80 81.47 83.48 83.80
Fig. 5. Demand vs FGI according to CT=1.5, PAT=1, DT=1, RMI=2000 and FGI=3000
Simulation Software as a Tool for Supply Chain Analysis and Improvement 993
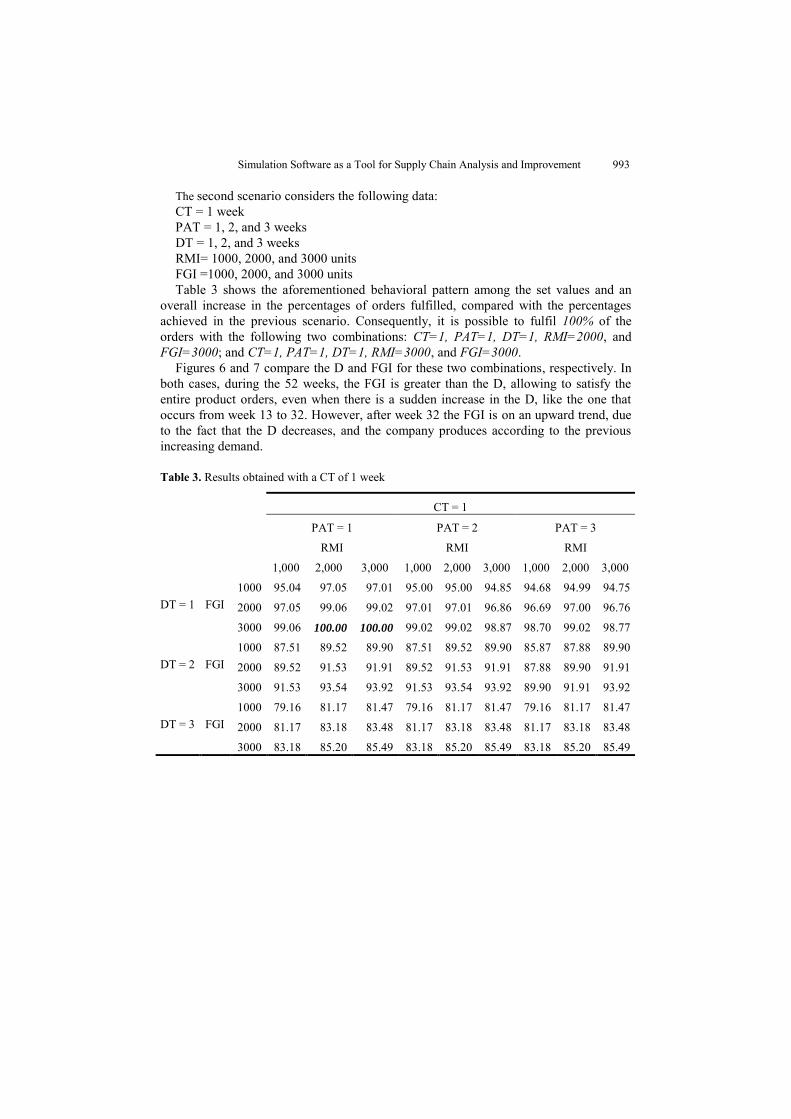
The second scenario considers the following data: CT = 1 week PAT = 1, 2, and 3 weeks DT = 1, 2, and 3 weeks RMI= 1000, 2000, and 3000 units FGI =1000, 2000, and 3000 units Table 3 shows the aforementioned behavioral pattern among the set values and an
overall increase in the percentages of orders fulfilled, compared with the percentages achieved in the previous scenario. Consequently, it is possible to fulfil 100% of the orders with the following two combinations: CT=1, PAT=1, DT=1, RMI=2000, and FGI=3000; and CT=1, PAT=1, DT=1, RMI=3000, and FGI=3000.
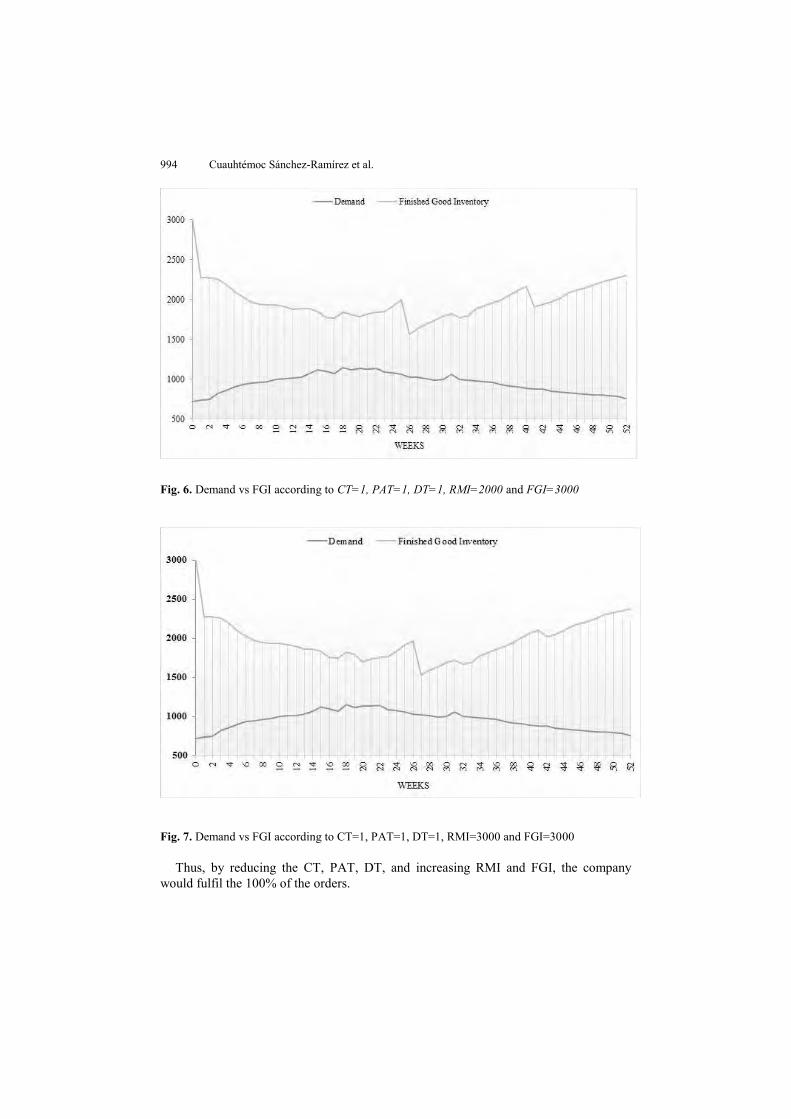
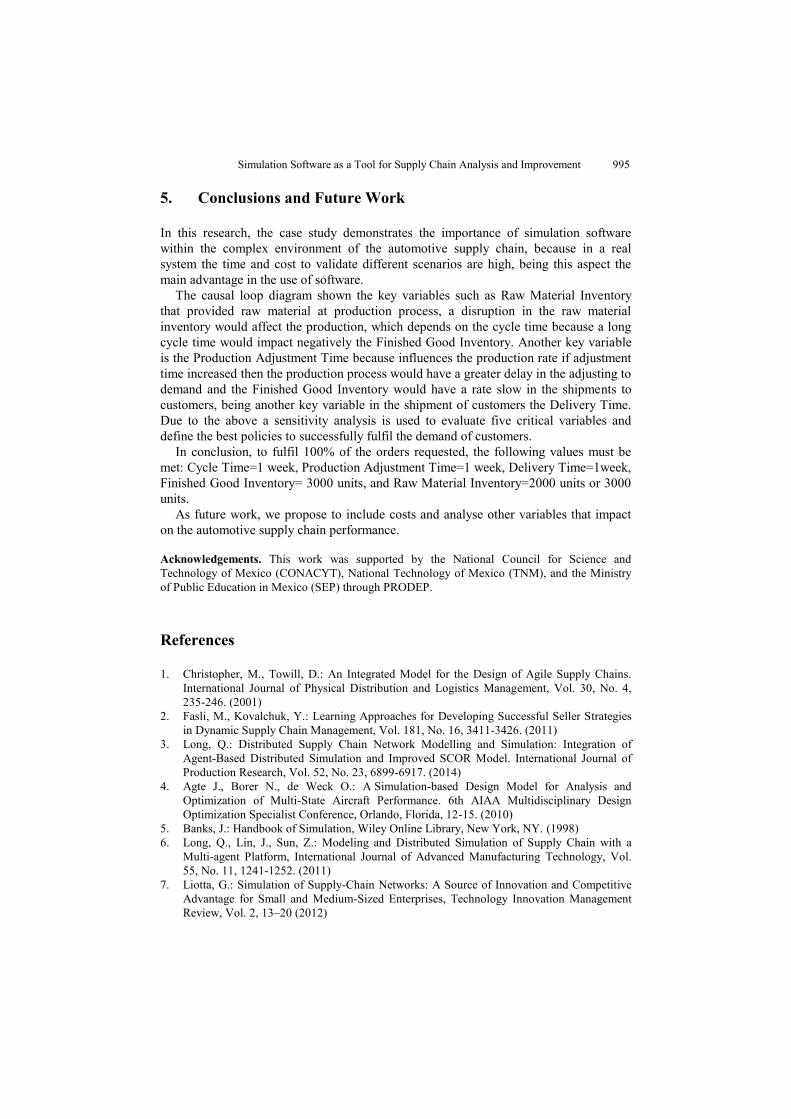
Figures 6 and 7 compare the D and FGI for these two combinations, respectively. In both cases, during the 52 weeks, the FGI is greater than the D, allowing to satisfy the entire product orders, even when there is a sudden increase in the D, like the one that occurs from week 13 to 32. However, after week 32 the FGI is on an upward trend, due to the fact that the D decreases, and the company produces according to the previous increasing demand.
Table 3. Results obtained with a CT of 1 week
CT = 1
PAT = 1 PAT = 2 PAT = 3
RMI RMI RMI
1,000 2,000 3,000 1,000 2,000 3,000 1,000 2,000 3,000
DT = 1 FGI 1000 95.04 97.05 97.01 95.00 95.00 94.85 94.68 94.99 94.75
2000 97.05 99.06 99.02 97.01 97.01 96.86 96.69 97.00 96.76
3000 99.06 100.00 100.00 99.02 99.02 98.87 98.70 99.02 98.77
DT = 2 FGI 1000 87.51 89.52 89.90 87.51 89.52 89.90 85.87 87.88 89.90
2000 89.52 91.53 91.91 89.52 91.53 91.91 87.88 89.90 91.91
3000 91.53 93.54 93.92 91.53 93.54 93.92 89.90 91.91 93.92
DT = 3 FGI 1000 79.16 81.17 81.47 79.16 81.17 81.47 79.16 81.17 81.47
2000 81.17 83.18 83.48 81.17 83.18 83.48 81.17 83.18 83.48
3000 83.18 85.20 85.49 83.18 85.20 85.49 83.18 85.20 85.49
994 Cuauhtémoc Sánchez-Ramírez et al.
Fig. 6. Demand vs FGI according to CT=1, PAT=1, DT=1, RMI=2000 and FGI=3000
Fig. 7. Demand vs FGI according to CT=1, PAT=1, DT=1, RMI=3000 and FGI=3000
Thus, by reducing the CT, PAT, DT, and increasing RMI and FGI, the company would fulfil the 100% of the orders.
Simulation Software as a Tool for Supply Chain Analysis and Improvement 995
5. Conclusions and Future Work
In this research, the case study demonstrates the importance of simulation software within the complex environment of the automotive supply chain, because in a real system the time and cost to validate different scenarios are high, being this aspect the main advantage in the use of software.
The causal loop diagram shown the key variables such as Raw Material Inventory that provided raw material at production process, a disruption in the raw material inventory would affect the production, which depends on the cycle time because a long cycle time would impact negatively the Finished Good Inventory. Another key variable is the Production Adjustment Time because influences the production rate if adjustment time increased then the production process would have a greater delay in the adjusting to demand and the Finished Good Inventory would have a rate slow in the shipments to customers, being another key variable in the shipment of customers the Delivery Time. Due to the above a sensitivity analysis is used to evaluate five critical variables and define the best policies to successfully fulfil the demand of customers.
In conclusion, to fulfil 100% of the orders requested, the following values must be met: Cycle Time=1 week, Production Adjustment Time=1 week, Delivery Time=1week, Finished Good Inventory= 3000 units, and Raw Material Inventory=2000 units or 3000 units.
As future work, we propose to include costs and analyse other variables that impact on the automotive supply chain performance. Acknowledgements. This work was supported by the National Council for Science and Technology of Mexico (CONACYT), National Technology of Mexico (TNM), and the Ministry of Public Education in Mexico (SEP) through PRODEP.
References
1. Christopher, M., Towill, D.: An Integrated Model for the Design of Agile Supply Chains. International Journal of Physical Distribution and Logistics Management, Vol. 30, No. 4, 235-246. (2001)
2. Fasli, M., Kovalchuk, Y.: Learning Approaches for Developing Successful Seller Strategies in Dynamic Supply Chain Management, Vol. 181, No. 16, 3411-3426. (2011)
3. Long, Q.: Distributed Supply Chain Network Modelling and Simulation: Integration of Agent-Based Distributed Simulation and Improved SCOR Model. International Journal of Production Research, Vol. 52, No. 23, 6899-6917. (2014)
4. Agte J., Borer N., de Weck O.: A Simulation-based Design Model for Analysis and Optimization of Multi-State Aircraft Performance. 6th AIAA Multidisciplinary Design Optimization Specialist Conference, Orlando, Florida, 12-15. (2010)
5. Banks, J.: Handbook of Simulation, Wiley Online Library, New York, NY. (1998) 6. Long, Q., Lin, J., Sun, Z.: Modeling and Distributed Simulation of Supply Chain with a
Multi-agent Platform, International Journal of Advanced Manufacturing Technology, Vol. 55, No. 11, 1241-1252. (2011)
7. Liotta, G.: Simulation of Supply-Chain Networks: A Source of Innovation and Competitive Advantage for Small and Medium-Sized Enterprises, Technology Innovation Management Review, Vol. 2, 13–20 (2012)
996 Cuauhtémoc Sánchez-Ramírez et al.
8. Mehrjerdi, Y.Z.: RFID-enabled Supply Chain Systems with Computer Simulation. Assembly Automation, Vol. 29, No. 2, 174–183. (2009)
9. Vidalakis, C., Tookey, J., Sommerville, J.: Logistics Simulation Modelling Across Construction Supply Chains. Construction Innovation, Vol. 11, No. 2, 212-228. (2011)
10. Brintrup, A., Ledwoch, A., Barros, J.: Topological Robustness of the Global Automotive Industry, Vol. 9, No. 1, 1-17. (2016)
11. Azadeh A., Keramati A., Karimi A., Sharahi Z., Pourhajikrci, J.: Design of Integrated Information System and Supply Chain for Selection of New Facility and Suppliers by a Unique Hybrid Meta-heuristic Computer Simulation Algorithm. International Journal of Advanced Manufacturing Technology, Vol. 71, No. 5-8, 775-793. (2014)
12. Umeda, S., Lee, T.: Design Specifications of a Generic Supply Chain Simulator. Proceedings of the 2004 Winter Simulation Conference. 1158 – 1166. (2004).
13. Carvalho, H., Barroso, A., Machado, V., Azevedo, S., Machado, V.: Supply Chain Resilience: A Simulation Study, Vol. 22, 1611-1612. (2011)
14. Croxton, K.L.: The Order Fulfillment Process. The Internatioanl Journal of Logistic Management, Vol. 14, No. 1, 19–32. (2003)
15. Huang, M., Ip, W. H., Yung, K. L., Wang, X., Wang, D.: Simulation Study Using System Dynamics for a CONWIP-controlled Lamp Supply Chain. International Journal of Advanced Manufacturing Technology, Vol. 32, No. 1-2, 184-193. (2007)
16. Tako, A., Robinson, S.: The Application of Discrete Event Simulation and System Dynamics in the Logistics and Supply Chain Context. Decision Support System, Vol. 52, No. 4, 802-815. (2012)
17. Shamsuddoha, M.: Integrated Supply Chain model for Sustainable Manufacturing: A System Dynamics Approach in Sustaining Competitive Advantage Via Business Intelligence, Knowledge Management, and System Dynamics. Advances in Business Marketing and Purchasing, 155-399. (2015)
18. Alfnes, E., Dreyer, H. C., Hvolby, H. H., Steger-Jensen, K., Fraser, K.: A Concept for Collaborative Supply Chain Planning. Paper presented at the Cognitive Infocommunications (CogInfoCom), IEEE 3rd International Conference. (2012)
19. Osman, M.: Route Finding Procedures for Performing Distribution Routing Function in Supply Chain. Paper presented at the Industrial Engineering and Operations Management (IEOM), 1-4. (2015)
20. Barroso, A., Machado V., Machado, V.: Demand Information Sharing Impact on Supply Chain Management under Demand Uncertainty. A simulation model. Paper presented at the 2013 IEEE International Conference on Industrial Engineering and Engineering Management. (2013)
21. Yang, Y., Qiu-Ling C.: A Multi-objective Optimization Approach to Improve the Customs Clearance Process for Imported Goods. Paper presented at the Industrial and Information Systems (IIS), 2nd International Conference on, Vol. 1, 163-166. (2010)
22. Ba, B. H., Prins C., Prodhon, C.: Models for Optimization and Performance Evaluation of Biomass Supply Chains: An Operations Research perspective. Renewable Energy, Vol. 87, No. 2, 977-989. (2016)
23. Kusi-Sarpong, S., Bai, C., Sarkis, J., Wang, X.: Green Supply Chain Practices Evaluation in the Mining Industry using a Joint Rough Sets and Fuzzy TOPSIS Methodology. Resources Policy, Vol. 46, 86-100. (2015).
24. Tan, P., Lee, S., Goh, A.: Multi-criteria Decision Techniques for Context-aware B2B Collaboration in Supply Chains. Decision Support Systems, Vol. 52, No. 4, 779-789. (2012)
25. Rojas-Zerpa, J., Yusta, J.: Application of Multicriteria Decision Methods for Electric Supply Planning in Rural and Remote Areas. Renewable and Sustainable Energy Reviews, Vol. 52, 557-571. (2015)
26. Piltan, M., Sowlati, T.: A Multi-criteria Decision Support Model for Evaluating the Performance of Partnerships. Expert Systems with Applications, Vol. 45, 373-384. (2016)
Simulation Software as a Tool for Supply Chain Analysis and Improvement 997
27. Ding, H., Liu, Q., Zheng, L.: Assessing the Economic Performance of an Environmental Sustainable Supply Chain in Reducing Environmental Externalities. European Journal of Operational Research, Vol. 255, No. 2, 463-480. (2016)
28. Erol, I., Sencer, S., Sari, R.: A New Fuzzy Multi-criteria Framework for Measuring Sustainability Performance of a Supply Chain. Ecological Economics, Vol. 70, No. 6, 1088-1100. (2011)
29. Bemhard A., Marios, A.: System Dynamics Modelling in Supply Chain Management: Research View. In Proccedings of the 2000 Winter Simulation Conference, 342-351. (2000)
30. Sterman, J.: Business Dynamics – Systems Thinking and Modeling for a Complex World. Mc Graw Hill. (2000)
31. Ritchie-Dunham, J.: A Strategic Supply Chain Simulation Model. In Proceedings of the 2000 Winter Simulation Conference, 1260-1264. (2000)
32. Georgiadis, P., Vlachos, D., Iakovou, E.: A System Dynamics Modeling Framework for a Strategic Supply Chain Management of Food Chains. Journal of Food Engineering, Vol. 70, No. 3, 351-364. (2004)
33. Kamath, N., Roy, R.: Capacity Augmentation of a Supply Chain for a Short Lifecycle Product: A System Dynamics Framework. European Journal of Operational Research, Vol.179, No. 2, 334-351. (2007)
34. Matsuo, H.: Implications of the Tohoku Earthquake for Toyota׳s Coordination Mechanism: Supply Chain Disruption of Automotive Semiconductors. International Journal of Production Economics, Vol. 61, 217-227. (2015)
35. Márcio, A., Scavarda, L.F., Pires, S., Ceryno, P., Klingebiel, K.: A Multi-tier Study on Supply Chain Flexibility in the Automotive Industry. International Journal of Production Economics, Vol. 158, 91-105. (2014)
36. Saranga, H., Mukherji, A., Shah, J.: Inventory Trends in Emerging Market Supply Chains: Evidence from the Indian Automotive industry. IIMB Management Review, Vol. 27, No. 1, 6-18. (2015)
37. Pereira, G. M., Sellitto, M. A., Borchardt, M., Geiger, A.: Procurement Cost Reduction for Customized Non-critical Items in an Automotive Supply Chain: An Action Research Project. Industrial Marketing Management, Vol. 40, No. 1, 28-35 (2011)
38. AMIA: Estadísticas a Propósito de la Industria Automotriz. [Online]. Available: http://www.amia.com.mx (current June 2016).
39. Sanchez-Ramírez, C., Cedillo-Campos, M. G., Pérez-Villanueva, P., Martínez-Flores, J. L.: Global Economic Crisis and Mexican Automotive Suppliers: Impacts on the Labor Capital. Simulation: Transactions of the Society for Modelling and Simulation International, Vol 87, No. 8, 711-725. (2011)
40. Forrester, J.: Industrial Dynamics. Editorial Pegasus. (1961). 41. Cedillo-Campos, M. G., Sanchez-Ramírez, C.: Introducción al Análisis Dinámico de
Sistemas Industriales. Editorial Trillas, México. (2008)
Cuauhtémoc Sánchez Ramírez is a full-time researcher of the Division of Research and Postgraduate Studies of the Orizaba Technology Institute. He received a PhD in Industrial Engineering from COMIMSA, center of research of National Council of Science & Technology of Mexico (CONACYT). His research projects have been granted by CONACYT and PRODEP. Dr. Sánchez is member founding of Industrial Process Optimization Network (ROPRIN) and member of the National Researcher System by CONACYT level 1. His research interests are modeling and simulation of logistics process and supply chain from a system dynamics approach. He is author/coauthor around 30 journal and conference papers in logistics and supply chain
998 Cuauhtémoc Sánchez-Ramírez et al.
management. ORCID Number: orcid.org/0000-0002-0344-1966. Scopus Author ID: 50361872500. Dulce R. Mota-López in 2013 she graduated (MEng) with distinction from the Industrial Engineering Department at the Instituto Tecnológico de Orizaba. She has been involved in research on system dynamics simulation with special interest in production scheduling, inventory planning and agri-food supply chain management. Currently, she is a PhD student at the División of Postgraduate Students of the same institution. Her current work focuses on the dynamic sustainability assessment of industrial ecosystems. Giner Alor-Hernandez is a full-time researcher of the Division of Research and Postgraduate Studies in Instituto Tecnológico de Orizaba. He received a MSc and a PhD in Computer Science from the Center for Research and Advanced Studies of the National Polytechnic Institute (CINVESTAV), Mexico. He has led 10 Mexican research projects granted by CONACYT, DGEST, and PRODEP. He is author/coauthor of around 130 journal and conference papers on computer science. His research interests include Web services, e-commerce, Semantic Web, Web 2.0, service-oriented and event-driven architectures, and enterprise application integration. He is an IEEE and ACM Member. He is a National Researcher recognized by the National Council of Science & Technology of Mexico (CONACYT). ORCID: http://orcid.org/0000-0003-3296-0981 , Scopus Author ID: 17433252100. Jorge Luis Garcia-Alcaraz is a full-time researcher at the Autonomous University of Ciudad Juarez. He received a PhD in Industrial Engineering from Ciudad Juarez Technology Institute (Mexico) and a Postdoc from University of La Rioja (Spain). His main research areas are related to Multicriteria decision making applied to manufacturing, production process modeling and statistical inference. He is founding member of the Mexican Society of Operation Research and active member in the Mexican Academy of Industrial Engineering. Currently, Dr. Garcia is a National Researcher Level II recognized by the National Council of Science & Technology of Mexico (CONACYT). Actually. Dr. Garcia is author/coauthor in around 120 journals, international conferences and congress. ORCID number: orcid.org/0000-0002-7092-6963, Scopus Author ID: 55616966800 Diego Tlapa is a professor of industrial engineering in the Faculty of Engineering, Architecture and Design at the Autonomous University of Baja California, Mexico. He is member of the National System of Researchers of the National Council of Science and Technology in Mexico and member of the optimization of industrial processes network (ROPRIN); his research focuses on supply chain management, and processes improvement projects including six sigma and lean manufacturing. He has participated in several research projects related to process improvement and is author/coauthor of 20 journal papers and conference papers. Received: August 3, 2016; Accepted: November 13, 2016.