Massachusetts Reservoir Simulation Tool—User’s · PDF fileThe Massachusetts...
30
Massachusetts Reservoir Simulation Tool—User’s Manual Open-File Report 2016–1136 U.S. Department of the Interior U.S. Geological Survey
-
Upload
hoangxuyen -
Category
Documents
-
view
222 -
download
1
Transcript of Massachusetts Reservoir Simulation Tool—User’s · PDF fileThe Massachusetts...

Massachusetts Reservoir Simulation Tool—User’s Manual
Open-File Report 2016–1136
U.S. Department of the InteriorU.S. Geological Survey


Massachusetts Reservoir Simulation Tool—User’s Manual
By Sara B. Levin
Open-File Report 2016–1136
U.S. Department of the InteriorU.S. Geological Survey

U.S. Department of the InteriorSALLY JEWELL, Secretary
U.S. Geological SurveySuzette M. Kimball, Director
U.S. Geological Survey, Reston, Virginia: 2016
For more information on the USGS—the Federal source for science about the Earth, its natural and living resources, natural hazards, and the environment—visit http://www.usgs.gov or call 1–888–ASK–USGS.
For an overview of USGS information products, including maps, imagery, and publications, visit http://store.usgs.gov.
Any use of trade, firm, or product names is for descriptive purposes only and does not imply endorsement by the U.S. Government.
Although this information product, for the most part, is in the public domain, it also may contain copyrighted materials as noted in the text. Permission to reproduce copyrighted items must be secured from the copyright owner.
Suggested citation:Levin, S.B., 2016, Massachusetts reservoir simulation tool—User’s manual: U.S. Geological Survey Open-File Report 2016–1136, 22 p., http://dx.doi.org/10.3133/ofr20161136.
ISSN 2331-1258 (online)

iii
Contents
Introduction.....................................................................................................................................................1Model Overview and System Requirements .............................................................................................1Simulating a Single-Reservoir System .......................................................................................................2
Reservoir Information Screen ............................................................................................................3Water Usage ..........................................................................................................................................4Demand Management Scenarios ......................................................................................................5Running the Simulation ........................................................................................................................6Model Results and Summary Statistics ............................................................................................6
Simulating a Multiple-Reservoir System .................................................................................................11Configuring a Multiple-Reservoir System .......................................................................................11Setup Operating Rules and Demand Management Scenarios ...................................................14Model Results and Summary Statistics ..........................................................................................16
Adding a New Reservoir .............................................................................................................................18Estimating Groundwater Parameters .......................................................................................................21
Transmissivity ......................................................................................................................................21Distance from Reservoir Shoreline to Aquifer Boundary ............................................................21Storage Coefficient .............................................................................................................................21Perimeter and Surface Area in Contact with Sand and Gravel ..................................................21
Deleting a Reservoir ....................................................................................................................................22References Cited..........................................................................................................................................22
Figures
1. Screenshot showing the opening menu screen of the Massachusetts Reservoir Simulation Tool ..............................................................................................................................2
2. Screenshot showing the select reservoir screen of the Massachusetts Reservoir Simulation Tool ..............................................................................................................................2
3. Screenshot showing the single-reservoir system simulation screen for the Massachusetts Reservoir Simulation Tool ...............................................................................3
4. Screenshot showing the water usage screen for the Massachusetts Reservoir Simulation Tool ..............................................................................................................................4
5. Screenshot showing the demand management scenario screen for the Massachusetts Reservoir Simulation Tool ...............................................................................5
6. Screenshot showing the single-reservoir system simulation summary report screen in the Massachusetts Reservoir Simulation Tool.......................................................7
7. Screenshot showing the annual flow duration curve simulation summary screen for the Massachusetts Reservoir Simulation Tool ..................................................................8
8. Screenshot showing the zero-spill days tab of the Massachusetts Reservoir Simulation Tool ..............................................................................................................................9
9. Screenshot showing the reservoir failures summary screen of the Massachusetts Reservoir Simulation Tool ..........................................................................................................10
10. Screenshot showing the multiple-reservoir system selection screen of the Massachusetts Reservoir Simulation Tool .............................................................................11

iv
11. Screenshot showing the multiple-reservoir system configuration screen in the Massachusetts Reservoir Simulation Tool .............................................................................12
12. Graphs showing example of A, nested and B, non-nested reservoir watersheds ..........13 13. Screenshot showing monthly water transfer rules for contributing reservoirs the
multiple-reservoir system operating rules screen in the Massachusetts Reservoir Simulation Tool ............................................................................................................................15
14. Screenshot showing monthly usage factors at the terminal reservoir on the multiple-reservoir system operating rules screen of the Massachusetts Reservoir Simulation Tool ............................................................................................................................17
15. Screenshot showing the add reservoir screen in the Massachusetts Reservoir Simulation Tool ............................................................................................................................18
16. Screenshots showing an example of A, a daily climate data input file and B, a bathymetric input file for the Massachusetts Reservoir Simulation Tool .........................20
Conversion FactorsU.S. customary units to International System of Units
Multiply By To obtain
gallon (gal) 3.785 liter (L)million gallons (Mgal) 3,785 cubic meter (m3)gallon per day (gal/d) 0.003785 cubic meter per day (m3/d)million gallons per day (Mgal/d) 0.04381 cubic meter per second (m3/s)
Abbreviations
AFDC annual flow duration curve
GIS geographic information system
USGS U.S. Geological Survey
Massachusetts Reservoir Simulation Tool— User’s Manual
By Sara B. Levin
IntroductionThe U.S. Geological Survey developed the Massachusetts Reservoir Simulation Tool to examine the effects of reservoirs on
natural streamflows in Massachusetts by simulating the daily water balance of reservoirs. The simulation tool was developed to assist environmental managers to better manage water withdrawals in reservoirs and to preserve downstream aquatic habitats.
Model Overview and System RequirementsThe Massachusetts Reservoir Simulation Tool simulates the daily water balance equation of a water-supply reservoir and
estimates the magnitude, frequency, and duration of spillage below the dam over the period of record. The tool was developed as a Microsoft Access database application (Levin, 2016b) to facilitate storage and handling of reservoir data. The application has a menu-driven user interface that allows the simulation of single- or multiple-reservoir systems. Reservoir information and input datasets for 70 reservoirs in Massachusetts that were studied by Levin and others (2011) are included in the database. Users have the ability to input information and simulate additional reservoirs. The tool is compatible with Microsoft Access version 2010 or later. The tool has not been tested and is not supported for operating systems other than Microsoft Windows.
Figure 1 shows the opening menu screen of the reservoir simulation tool. Users have the option of simulating a single-reservoir system, which includes only one reservoir, or simulating a multiple-reservoir system, which contains 2 to 10 hydrologically connected reservoirs.

2 Massachusetts Reservoir Simulation Tool—User’s Manual
Simulating a Single-Reservoir SystemTo simulate a single reservoir, select the “Simulate a single-reservoir system” button on the opening screen (fig. 1). A dialog
box will open which selects the reservoir to be simulated (fig. 2). Users may select the water supplier or town name, if known, from the top dropdown box. The reservoirs operated by the selected water supplier will be listed in the next dropdown box. If the water supplier is not known, select “View All” to choose a reservoir from all the reservoirs in the database. After selecting a reservoir, click the “View Reservoir Information” button to bring up the data and information for the selected reservoir (fig. 3).
Figure 1. The opening menu screen of the Massachusetts Reservoir Simulation Tool.
Figure 2. The select reservoir screen of the Massachusetts Reservoir Simulation Tool.

Simulating a Single-Reservoir System 3
Reservoir Information Screen
Figure 3 shows the single-reservoir simulation screen where the input data for the selected reservoir can be reviewed, including daily inflows to the reservoir, daily precipitation and evaporation at the reservoir surface, the elevation, storage, and surface area profiles, and parameters used in groundwater interactions. Additionally, users can review or edit monthly water usage factors and add monthly controlled releases or demand management scenarios to the simulation. Text boxes that are white indicate values that can be altered; text boxes in grey are for display only and cannot be edited.
Information on the single-reservoir system simulation screen (fig. 3) is organized on three tabs. The “Reservoir and aquifer properties” tab contains watershed and reservoir information. Users may view the drainage area, reservoir capacity, maximum surface area, and enter a value for dam leakage and seepage, if known. Groundwater interactions with the reservoir may be
Figure 3. The single-reservoir system simulation screen for the Massachusetts Reservoir Simulation Tool.

4 Massachusetts Reservoir Simulation Tool—User’s Manual
Figure 4. The water usage screen for the Massachusetts Reservoir Simulation Tool.
estimated in the simulation by clicking on the check box at the top of the right-hand column in the tab. Values for transmissiv-ity, storage coefficient, average shoreline-to-aquifer boundary distance, and length of perimeter intersecting the aquifer must be entered if the check box is checked. Guidance for estimating these parameter values is provided in the “Adding a New Reservoir” section in this report. Links at the bottom of the tab enable users to view daily flow into the reservoir, precipitation and evaporation (climate data), and storage volume and surface area relations with water-surface elevation at various reservoir depths. These values cannot be altered but may be viewed or exported to a text file. If groundwater contributions are included in the simulation, users can view or edit the groundwater scaling factors.
Water Usage
In the “Water Usage” tab, the user can review or edit monthly usage factors, controlled releases, and other withdrawals (fig. 4). Monthly usage factors are used to vary the annual average withdrawal rate by month to account for seasonal differences

Simulating a Single-Reservoir System 5
in withdrawal patterns. Monthly withdrawal volumes are computed by the simulation tool by multiplying the monthly usage fac-tor for the month by the average annual withdrawal volume entered by the user. Monthly usage factors are computed by dividing the average monthly withdrawal by the average annual withdrawals. The sum of the monthly usage factors is always 12. Default monthly usage factors were computed for reservoirs in the database using reported water use data from 2000 to 2004.
Controlled releases are water releases from the reservoir into the receiving stream for ecological or other purposes. Default releases are zero for all reservoirs in the database but users may specify monthly release values.
Demand Management Scenarios
Demand management plans are used by many towns to reduce water withdrawals from a reservoir during extended drought periods, either through water use restrictions or by using water from alternative water sources. The “Demand management scenarios” tab (fig. 5) allows the user to specify a demand management plan that reduces reservoir withdrawals when reservoir
Figure 5. The demand management scenario screen for the Massachusetts Reservoir Simulation Tool.

6 Massachusetts Reservoir Simulation Tool—User’s Manual
levels become depleted. To implement a demand management scenario in the simulation, check the box for the appropriate level scenario; this will make the input boxes for that scenario editable. For each month, the percentage of full reservoir volume and the percentage of water demand reduction are specified. If the reservoir storage falls below the specified percentage of full volume during the simulation, the demand management plan will be implemented and the withdrawal rate for the simulation day will be reduced by the specified reduction percentage.
Demand management scenarios can be tiered with up to three levels to implement increasing reductions in withdrawals as water levels at reservoirs get lower. The scenarios should be entered from left to right such that each scenario is implemented at a lower reservoir storage volume than the scenario before it. For example, in figure 5, level 1, 2, and 3 scenarios are imple-mented. If the reservoir storage falls below 80 percent but remains greater than or equal to 75 percent for any day in May, the level 1 scenario will be implemented and the withdrawal on the next day will be reduced by 10 percent. If the reservoir storage falls below 75 percent but is greater than or equal to 70 percent, the level 2 scenario will be implemented and withdrawals will be reduced by 15 percent. If reservoir storage falls below 70 percent in May, the level 3 scenario will be implemented and the withdrawal volume will be reduced by 20 percent.
Running the Simulation
The user must enter the average annual withdrawal rate from the reservoir in million gallons per day at the top of the simulation screen (fig. 3). When all reservoir, water use, and demand management scenarios have been reviewed and specified, run the model by clicking on the “Run Simulation” button. Run time varies and may take several minutes for simulations that include groundwater estimates. A progress bar indicating the status of the simulation is shown at the bottom right corner of the application. The user can select the checkbox under the “Run Simulation” button to export the daily simulation data to a text file that includes reservoir storage, inflows to the reservoir, precipitation and evaporation from the reservoir surface, groundwater inflows and losses, total withdrawals, and controlled and uncontrolled spillage for each day of the simulation. All volumes in the exported file are in million gallons.
Model Results and Summary Statistics
After a simulation is complete, a summary report will show a comparison of streamflow metrics for both estimated unal-tered streamflow and outflows directly below the dam (fig. 6). Unaltered streamflow is the streamflow that would occur if no dam were present and is estimated by multiplying the inflows to the reservoir (in million gallons per day per square mile) by the total drainage area to the dam (this includes the drainage area to the reservoir plus the reservoir surface area). Altered flows are any outflows from the reservoir, including controlled spills, uncontrolled spills, and seepage and leakage.
Results are organized on four tabs. The “Monthly Flow” tab (fig. 6) shows the median of the monthly median flow for the period of record for estimated unaltered and altered flows. If the first or last month of the period of record is incomplete for a reservoir, these incomplete months are excluded from the monthly median results.
The “Annual Flow Duration Curve” tab (fig. 7) displays metrics related to the annual flow duration curve (AFDC) for unal-tered and altered flows. The median of the annual 10th, 25th, 50th, 75th, and 90th percentiles are given for unaltered and altered flows, in million gallons per day. The median AFDC is computed by determining the flow volume for each annual exceedance probability and then computing the median across all years being studied. The AFDC graph shows the median daily flow volume for each exceedance probability in a given year. The median AFDC for unaltered and altered flows are plotted along with the 95-percent confidence intervals. Data used to create the AFDC plot can be exported to a comma-delimited file by clicking on the “Export median AFDC deviation point plot data” button.
The AFDC deviation point is the lowest exceedance probability at which the distribution of altered flows becomes statisti-cally significantly different at the 95-percent confidence level from the distribution of estimated unaltered flows. The AFDC deviation point is computed by iteratively performing a Kolmogorov-Smirnov two-sample test of independence (Conover, 1980) on the unaltered and altered flows at each AFDC exceedance probability from the highest exceedance probability to the lowest. Typically, the lowest flows are the most highly altered compared with estimated unaltered flows. In most cases, flows at exceed-ance probabilities lower than the deviation point (left of the red line in the plot) are not statistically significantly different from unaltered flows. In some cases, there may be flows with exceedance probabilities lower than the AFDC deviation point (to the left of the red line in the plot) that are also statistically significantly different from unaltered flows. These are not noted in the summary report. If these areas are of interest, the user can export the data and compute the Kolmogorov-Smirnov test to deter-mine if flows at exceedance probabilities lower than the AFDC deviation point are statistically significantly altered.
The AFDC deviation point is only computed for reservoirs with the default period of record of 44 years. For reservoirs added by the user with a different length period of record, the AFDC plot will be calculated, but the deviation point will not be computed. Unaltered and altered flow volumes for each annual exceedance probability for each year can be exported by clicking

Simulating a Single-Reservoir System 7
Figure 6. The single-reservoir system simulation summary report screen in the Massachusetts Reservoir Simulation Tool.

8 Massachusetts Reservoir Simulation Tool—User’s Manual
Figure 7. The annual flow duration curve simulation summary screen for the Massachusetts Reservoir Simulation Tool.

Simulating a Single-Reservoir System 9
on the “Export all annual flow duration data” button. The Kolmogorov-Smirnov two-sample test may then be computed on the data for a particular exceedance probability using other statistical software packages or online calculators. Kolmogorov-Smirnov test computations in this report were performed using R statistical software (R Core Team, 2011).
The “Zero-Spill Days” tab (fig. 8) shows the number of days in which there was no spillage at the dam (this includes both controlled releases and uncontrolled spills). The median number of no-spill days per month is computed and graphed. The median number of no-spill days per year, the median annual maximum duration of a no-spill period, and the median first and last no-spill day of the year are also computed and displayed on this tab. The “Reservoir Failures” tab lists all the days in which the reservoir active storage was insufficient to meet the water demand (fig. 9).
Figure 8. The zero-spill days tab of the Massachusetts Reservoir Simulation Tool.

10 Massachusetts Reservoir Simulation Tool—User’s Manual
Figure 9. The reservoir failures summary screen of the Massachusetts Reservoir Simulation Tool.

Simulating a Multiple-Reservoir System 11
Simulating a Multiple-Reservoir SystemReservoir systems that comprise two or more hydrologically connected reservoirs may be simulated by choosing the
“Simulate a multiple-reservoir system” button on the opening screen (fig. 1) and specifying the water supplier and the number of reservoirs in the system (fig. 10). The reservoir simulation tool can simulate up to a maximum of 10 connected reservoirs in a system. Keep in mind that uncertainty related to model inputs and operating rules increases with each additional reservoir. Additionally, the limited operating rule configurations may not be adequate for systems with complex routing or operating rules. Because operational rules that govern transfers between reservoirs can have very large effects on spillage metrics, this tool is not recommended for reservoir systems of more than three reservoirs unless the operating rules are known with certainty or there are no active transfers between reservoirs in the system. The limitations of this model are described in Levin (2016a).
Figure 10. The multiple-reservoir system selection screen of the Massachusetts Reservoir Simulation Tool.
Configuring a Multiple-Reservoir System
After choosing the supplier and number of reservoirs in the system, the system configuration screen will appear (fig. 11). A reservoir is considered a contributing reservoir if water is transferred into another reservoir in the system either through a gravity-fed channel or stream or by pumping. A receiving reservoir is any reservoir in the system that receives water from a contributing reservoir. The terminal reservoir is the last reservoir in the system and does not transfer water to any other reservoir in the system. Reservoirs can be set up in series or in parallel by specifying each contributing and receiving reservoir pair in the system. Reservoirs should be entered such that for each contributing and receiving reservoir pair, the contributing reservoir is entered before the receiving reservoir. System configurations for the reservoirs in the database can be found in Waldron and Archfield (2006) and Levin and others (2011).

12 Massachusetts Reservoir Simulation Tool—User’s Manual
Figure 11. The multiple-reservoir system configuration screen in the Massachusetts Reservoir Simulation Tool.
For each contributing and receiving reservoir pair, a watershed configuration is selected. Reservoir drainage areas may be either nested or non-nested (fig. 12). Nested watersheds (fig. 12A) are those in which the contributing reservoir watershed is located within the watershed of the receiving reservoir. All outflows from the contributing reservoir flow downstream to the receiving reservoir, including transfers for water supply, uncontrolled spills, controlled spills for ecological flows, and seepage and leakage from the dam. Non-nested watersheds (fig. 12B) are not connected by a stream, and water is transferred from the contributing reservoir by a pumping system or aqueduct into a different drainage basin. In non-nested systems, only water trans-ferred for water supply (specified on the operating rules screen) is transferred to the receiving reservoir. Controlled and uncon-trolled spillage and seepage and leakage from the contributing reservoir dam flow into the stream directly below the contributing reservoir and do not enter the receiving reservoir. Leakage and seepage through or around the dam may be entered, if known, by the user for each contributing reservoir and the terminal reservoir. During simulation, seepage and leakage are subtracted from the available storage for each day.

Simulating a Multiple-Reservoir System 13
Horse Pond Brook
Horse Pond
DoanePond
72°03'30"72°04'30"72°05'30"72°06'30"
42°18'30"
42°17'30"
42°16'30"
0 0.2 0.4 MILES
0 0.6 KILOMETERS0.3
Reservoir watershed
EXPLANATION
Stream
Base from U.S. Geological Survey digital data, 1:25,000 scaleMassachusetts State Plane
A
Figure 12. Example of A, nested and B, non-nested reservoir watersheds. Illustration does not reflect actual aqueduct placement.

14 Massachusetts Reservoir Simulation Tool—User’s Manual
Mill Brook
Roaring Brook
SANDWASHRESERVOIR (07S)
FARNHAMRESERVOIR (02S)
73°08'73°09'73°10'73°11'73°12'73°13'
42°23'30"
42°22'30"
42°21'30"
Illustration does not reflect actual aqueduct placement
0 0.6 MILES0.3
0 0.8 KILOMETERS0.4
Reservoir watershed
EXPLANATION
Stream
Aqueduct
Base from U.S. Geological Survey digital data, 1:25,000 scaleMassachusetts State Plane
B
Figure 12. Example of A, nested and B, non-nested reservoir watersheds. Illustration does not reflect actual aqueduct placement. —Continued
Setup Operating Rules and Demand Management Scenarios
The system operating rules screen (fig. 13) allows the user to specify the total annual withdrawal from the system, specify contributing and receiving reservoirs, configure water transfers between reservoirs, modify default monthly usage factors at the terminal reservoir, and implement demand management scenarios in the simulation. The screen is organized with a series of tabs, one for each reservoir in the system (fig. 13). At the top of the screen, the annual system withdrawal rate at the terminal reservoir must be entered by the user. For each contributing reservoir, a target receiving reservoir is selected. The storage level of the target reservoir triggers a water transfer from the contributing reservoir to the receiving reservoir. If the daily storage level falls below the specified percentage of full storage for a given month, the contributing reservoir will transfer the specified vol-ume of water for that day. For example, in figure 13, the contributing reservoir is Horse Pond and the target reservoir is Doane Pond, both in North Brookfield, Massachusetts. If storage at Doane Pond falls at or below 30 percent of full storage (70 percent depleted) for any day between November and May, Horse Pond will transfer 0.3 million gallons to Doane Pond for that day. During June through October, the percentage of full storage is 100 percent, meaning that Horse Pond will transfer 0.6 million gallons to Doane Pond every day in these months. The target reservoir does not have to be the same as the terminal reservoir.

Simulating a Multiple-Reservoir System 15
Figure 13. Monthly water transfer rules for contributing reservoirs the multiple-reservoir system operating rules screen in the Massachusetts Reservoir Simulation Tool.

16 Massachusetts Reservoir Simulation Tool—User’s Manual
For example, in a three-reservoir system in a linear series, transfers to the reservoir in the middle from the topmost reservoir may be based on the storage volume of the terminal reservoir rather than the storage at the middle reservoir.
Controlled releases are releases from the reservoir for the purpose of maintaining downstream ecological flows. Controlled release scenarios may be entered by the user. For nested reservoirs, these flows will be added to any other flows that enter the receiving reservoir. For non-nested reservoirs, controlled releases are lost from the system and enter the receiving stream that is not connected to the rest of the reservoir system.
Demand management scenarios for multiple-reservoir systems are set up in the same manner as for a single-reservoir system. The total system demand is reduced by the specified percentage when the total system storage volume (the sum of active storage at each contributing reservoir and the terminal reservoir) falls below the specified percentage of full storage.
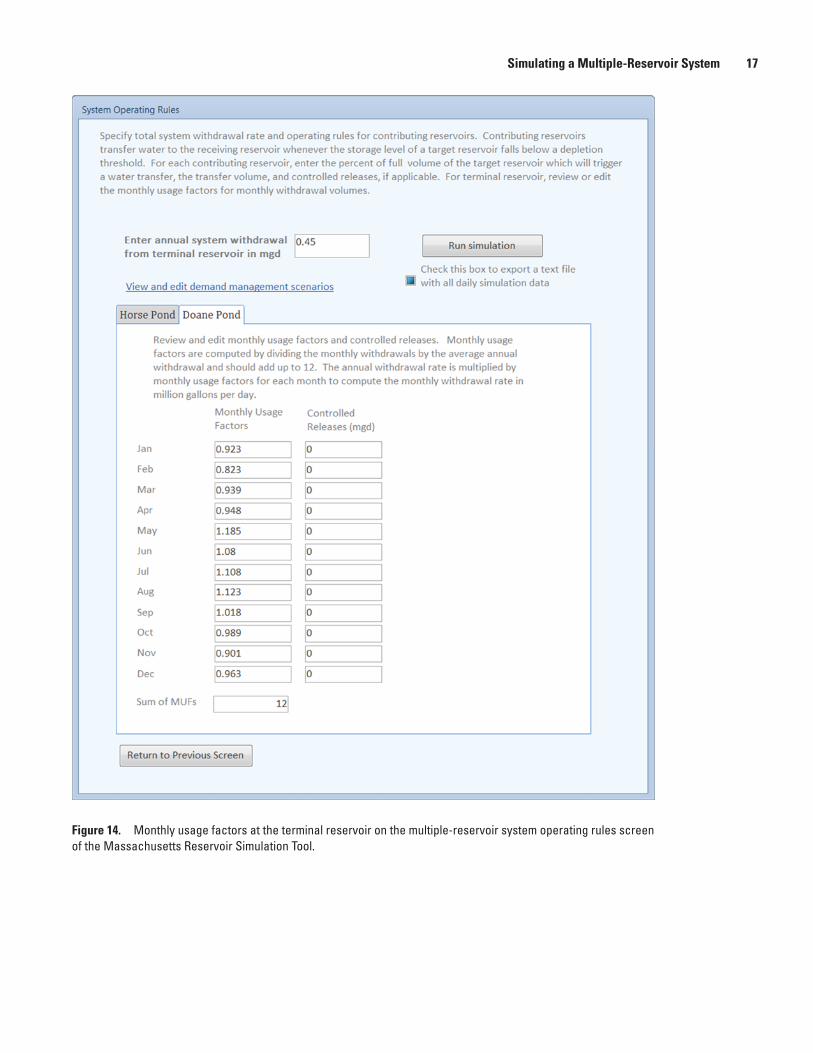
The tab for the terminal reservoir (fig. 14) contains monthly usage factors and controlled releases for the terminal reser-voir. Default monthly usage factor values have been determined from reported withdrawal rates from 2000 to 2004 but may be adjusted by the user. Monthly usage factors are computed by dividing the average monthly withdrawal volume by the annual average withdrawal volume and must add up to 12. Monthly usage factors are multiplied by the annual system withdrawal to determine the volume of water that is withdrawn at the terminal reservoir each month.
Model Results and Summary Statistics
Results for a multiple-reservoir system are displayed the same way as for a single-reservoir system (fig. 6). The simulation summary screen has four tabs for viewing different spillage metrics. By default, the displayed summary is for spillage at the terminal reservoir. To view spillage metrics at other reservoirs in the system, the user may select a different reservoir from the dropdown box at the top of the screen.
Simulating a Multiple-Reservoir System 17
Figure 14. Monthly usage factors at the terminal reservoir on the multiple-reservoir system operating rules screen of the Massachusetts Reservoir Simulation Tool.

18 Massachusetts Reservoir Simulation Tool—User’s Manual
Adding a New ReservoirThe database of the Massachusetts Reservoir Simulation Tool contains 70 reservoirs; these are reservoirs for which data
were collected during the studies by Waldron and Archfield (2006) and Levin and others (2011). To simulate a reservoir that is not included in the database, the user should select the “Add a reservoir to the database” button on the opening screen, which then produces the “Add a new reservoir to the database” dialog box (fig. 15). Necessary data for adding a reservoir include: basin information about the reservoir (reservoir name, supplier name and identification number [ID], and water-supply ID), the reservoir storage volume, the drainage area, and groundwater parameters (if applicable), daily inflows, precipitation and evapo-ration for the period of record, reservoir storage and surface area corresponding to several water-surface elevation levels, and monthly usage factors. Data are entered in four steps as outlined below:1. Enter basic reservoir information: Input the reservoir name, public water supply source ID (if known), public water
supplier name and ID (if known), maximum usable storage, and drainage area to the reservoir. The drainage area to the reservoir includes the watershed area from all inflowing streams and areas of direct drainage to the reservoir but does not include the surface area of the reservoir. If the reservoir is a receiving reservoir in a nested multiple-reservoir system, then the drainage area should include only the drainage area up to the outlet of the upstream reservoir and not include the drain-age area to the upstream contributing reservoir. If the public water supplier or reservoir owner is not listed in the dropdown
Figure 15. The add reservoir screen in the Massachusetts Reservoir Simulation Tool.

Adding a New Reservoir 19
box, a new name may be inputted by selecting the “Add new supplier” option from the dropdown list. If groundwater contributions are to be estimated for the reservoir, then select the box labeled “Check this box to include parameters for estimating groundwater contributions” and input the transmissivity, storage coefficient, width of the aquifer, and length of the perimeter that intersects the aquifer. Guidance for estimating these groundwater parameters is given in the “Estimat-ing Groundwater Parameters” section of this report. After all initial reservoir data have been entered; click on the “Add Reservoir” button.
2. Import daily inflows, precipitation, and evaporation: Click on the “Import daily inflow and climate data” button (fig. 15) to import daily reservoir inflows, precipitation, and evaporation from a comma delimited (csv) text file (fig. 16A). The csv file should contain four columns in the following order: date in dd/mm/yyyy format, streamflow in cubic feet per second, precipitation to the reservoir surface in hundredths of inches, and evaporation from the reservoir surface in hundredths of inches. The first row should contain column headers. Daily inflow and climate data should have the same period of record, which should be at least 5 years in length.
3. Import bathymetric data: Select the “Import bathymetric data” button (fig. 9) to import from a csv file the reservoir water-surface elevation in feet, total reservoir volume in million gallons (including any storage below the lowest intake), surface area in square miles, and area intersecting sand and gravel deposits in acres. Reservoir water-surface elevation can be relative to any datum and is only used to determine the change in reservoir depth during the simulation. Data should be ordered in increasing elevation, with the volume and surface areas of zero (representing the bottom of the reservoir) listed at the top of the csv input file (fig. 16B). The application will automatically compute the available storage and the ground-water scaling factor needed for simulation from the input data. Guidance for estimating the area that intersects sand and gravel deposits in provided in the “Estimating Groundwater Parameters” section of this report.
4. Enter default monthly water use information: click on the “Enter monthly water use information” button (fig. 9) to enter default values for monthly usage factors, controlled releases, and withdrawals from other users. Monthly usage factors are computed by dividing the average monthly withdrawal volume by the average annual withdrawal volume. Monthly usage factors must add up to 12.

20 Massachusetts Reservoir Simulation Tool—User’s Manual
Date Streamflow_cfs precipitation_HI evaporation_HI 10/1/1960 4.83 6.3824 8.8136 10/2/1960 2.84 0.2003 9.2753 10/3/1960 2.48 0 9.2023 10/4/1960 2.02 0 8.9188 10/5/1960 1.7 0 9.6218 10/6/1960 1.68 7.0333 8.5234 10/7/1960 1.7 20.4236 7.3604 10/8/1960 1.61 0 9.3389 10/9/1960 1.46 0 10.1402 10/10/1960 1.37 0 9.8263 10/11/1960 1.36 0 9.6974 10/12/1960 1.22 0 8.3837 10/13/1960 1.14 0 8.9471 10/14/1960 1.14 0 10.6843 10/15/1960 1.14 0 11.0525 10/16/1960 1.13 0.6551 8.4152 10/17/1960 1.56 1.4788 8.7413 10/18/1960 1.28 0 7.6777 10/19/1960 1.14 6.962 6.6589 10/20/1960 9.56 94.1436 6.2873 10/21/1960 5.58 41.2763 4.8693 10/22/1960 2.66 0 5.615 10/23/1960 2.26 1.8358 5.7138 10/24/1960 5.58 28.4458 4.9366 10/25/1960 3.98 14.8097 3.5938 10/26/1960 2.59 4.2284 5.2925
A
B Elevation_ft TotVol_Mgal SurfArea_sqmi SandGravel_acre136.7 0 0 0139 0.1 0.0004 0.03141 0.68 0.0024 1143 2.19 0.0049 2.39145 4.72 0.0072 3.75147 8.32 0.0101 5.49149 13.19 0.0132 7.39151 19.34 0.0163 8.76153 26.73 0.0192 9.95155 35.39 0.0223 11.43157 45.21 0.0248 12.75159 55.96 0.0267 13.77161 67.49 0.0286 14.75163 79.82 0.0306 15.85165 93.05 0.0329 17.19
Figure 16. An example of A, a daily climate data input file and B, a bathymetric input file for the Massachusetts Reservoir Simulation Tool.

Estimating Groundwater Parameters 21
Estimating Groundwater ParametersReservoirs with shorelines that are in contact with sand and gravel aquifers may gain or lose water due to daily changes
in reservoir stage (Archfield and Carlson, 2006). The procedure for estimating daily groundwater contributions in the Massachusetts Reservoir Simulation Tool were documented by Archfield and Carlson (2006). Parameters needed for the estimation of groundwater contributions include transmissivity, average distance from the reservoir shoreline to the aquifer boundary, storage coefficient, the length of the perimeter that intersects sand and gravel deposits, and the area that intersects sand and gravel deposits at each contour level in the bathymetric data.
Groundwater gains and losses from the reservoir system can be approximated using analytical equations for one-dimensional horizontal flow between an aquifer and a stream and are most appropriate for reservoirs in which the ratio of the average distance between the reservoir shoreline and the aquifer boundary to the length of the full-pool perimeter that intersects the sand and gravel deposits is between 0.5 and 2.3 (Archfield and Carlson, 2006). For ratios within this range, groundwater approximations match estimates from a finite-difference groundwater flow model within ±10 percent. Groundwater estimates for reservoirs with ratios outside this range are uncertain and may result in higher error rates than for reservoirs within the range.
Transmissivity
Transmissivity is entered in feet squared per day. Transmissivities for the reservoirs that have been preloaded in the simu-lation tool database range from 700 to 3,000 feet squared per day. If aquifer pumping tests are not available to determine the transmissivity at a reservoir that is being added to the database, transmissivity values can be estimated from published hydro-logic investigations atlases or water supply studies. The Massachusetts Department of Environmental Protection’s Drinking Water Program has compiled a list of publications by the U.S. Geological Survey that contain information about groundwater availability for each town in Massachusetts (Massachusetts Department of Environmental Protection, 2013); this list may be helpful in finding appropriate documents for estimating groundwater parameter properties for a reservoir that is being added to the reservoir simulation tool.
Distance from Reservoir Shoreline to Aquifer Boundary
The average perpendicular distance from the reservoir shoreline to the aquifer boundary is entered in feet. Values for this parameter for reservoirs preloaded into the database of the Massachusetts Reservoir Simulation Tool range from 250 to 3,300 feet. This parameter can be estimated from geographic information system (GIS) digital layers of sand and gravel deposits in Massachusetts (Massachusetts Office of Geographic Information, 2004) by creating perpendicular lines extending from the reservoir shoreline at regular intervals to the edge of the sand and gravel deposits and averaging the lengths of the lines.
Storage Coefficient
The storage coefficient (or specific yield) of the aquifer is dimensionless. Johnson (1967) reports values of specific yield for various aquifer materials. Storage coefficients reported in Johnson (1967) range from 0.03 to 0.19 for clay and silt, 0.10 to 0.35 for fine to coarse sand, and 0.12 to 0.35 for gravel. Storage coefficients were set to 0.2 for all reservoirs preloaded into the database of the Massachusetts Reservoir Simulation Tool.
Perimeter and Surface Area in Contact with Sand and Gravel
The length of the perimeter in contact with sand and gravel deposits when at full pool can be obtained by intersecting the digital data layer of the reservoir with the GIS digital layer of sand and gravel deposits in Massachusetts (Massachusetts Office of Geographic Information, 2004). Additionally, the area that intersects sand and gravel deposits is needed for each water-surface elevation. These values are used to determine the groundwater scaling factor (Levin and others, 2011).

Deleting a ReservoirThe user may want to delete a reservoir from the database if the data have been corrupted or if the information, such as
streamflow or other reservoir attributes, need to be updated. This can be done by clicking on the “Remove a reservoir from the database” button (fig. 1). All data for the reservoir will be permanently deleted from the database.
References Cited
Archfield, S.A., and Carlson, C.S., 2006, Ground-water contributions to reservoir storage and the effect on estimates of firm yield for reservoirs in Massachusetts: U.S. Geological Survey Scientific Investigations Report 2006–5045, 27 p. [Also avail-able at https://pubs.er.usgs.gov/publication/sir20065045.]
Conover, W.J., 1980, Practical nonparametric statistics: John Wiley & Sons, 493 p.
Johnson, A.I., 1967, Specific yield—Compilation of specific yields for various materials: U.S. Geological Survey Water-Supply Paper 1662–D, 74 p. [Also available at https://pubs.er.usgs.gov/publication/wsp1662D.]
Levin, S.B., 2016a, Effects of water-supply reservoirs on streamflow in Massachusetts: U.S. Geological Survey Scientific Inves-tigations Report 2016–5123, xx p. [Also available at http://dx.doi.org/10.3133/sir20165123.]
Levin, S.B., 2016b, Massachusetts reservoir simulation tool: U.S. Geological Survey Web page, accessed July 6, 2016, at http://webdmamrl.er.usgs.gov/sl1/slevin/rst/.
Levin, S.B., Archfield, S.A., and Massey, A.J., 2011, Refinement and evaluation of the Massachusetts firm-yield estimator model version 2.0: U.S. Geological Survey Scientific Investigations Report 2011–5125, 19 p. [Also available at https://pubs.er.usgs.gov/publication/sir20115125.]
Massachusetts Department of Environmental Protection, 2013, Massachusetts hydrologic information matrix (6th ed.): Mas-sachusetts Department of Environmental Protection, 128 p. [Also available at http://www.mass.gov/eea/docs/dep/water/compliance/hydromat.pdf.]
Massachusetts Office of Geographic Information, 2004, MassGIS data—Surficial geology (1:250,000): Massachusetts Office of Geographic Information digital data, accessed January 12, 2016, at http://www.mass.gov/anf/research-and-tech/it-serv-and-support/application-serv/office-of-geographic-information-massgis/datalayers/sg.html.
R Core Team, 2011, R—A language and environment for statistical computing: R Foundation for Statistical Computing soft-ware, accessed April 2014, at http://www.gbif.org/resource/81287.
Waldron, M.C., and Archfield, S.A., 2006, Factors affecting firm yield and the estimation of firm yield for selected streamflow-dominated drinking-water-supply reservoirs in Massachusetts: U.S. Geological Survey Scientific Investigations Report 2006–5044, 39 p. [Also available at https://pubs.er.usgs.gov/publication/sir20065044.]
22 Massachusetts Reservoir Simulation Tool—User’s Manual

For more information concerning this report, contact:Director, New England Water Science CenterU.S. Geological Survey 10 Bearfoot RoadNorthborough, MA [email protected] visit our Web site at:http://newengland.water.usgs.gov/
Publishing support by:The Pembroke Publishing Service Center

Levin— M
assachusetts Reservoir Simulation Tool—
User’s M
anual—Open-File Report 2016–1136
ISSN 2331-1258 (online)http://dx.doi.org/10.3133/ofr20161136