Simulation of Multiphase Fluid-Hammer Effects During Well ... · PDF filemodeling fully...
10
68 Oil and Gas Facilities • December 2013 Summary In this study, well-known commercial software that is capable of modeling fully transient multiphase flow in wellbore and pipeline has been used to characterize the fluid-hammer effects of well shut- in and startup on the coupled subsurface and surface systems. The original work was performed by applying sensitivity analysis to a typical production system, including well completion, wellbore, downhole equipment (e.g., packer), and the associated surface equipment (i.e., flowline, riser, and valves). This study summarizes the general course of key factors that worsen the fluid-hammer ef- fects. Fluid hammer is also known as water hammer, a shock wave produced by the sudden stoppage of, or reduction in, fluid flow. Field operations, such as pressure-transient analysis, facility maintenance, and workover, require a well shut-in process. For a typical production system, the resultant sudden rises in pressure can be critical because they have a direct impact on equipment (i.e., unsetting of the packer) and may cause damage to instrumentation. This paper provides estimates of the typical ratio of transient shock in pressure and flow rate to preconditional values, and the duration of such pressure shocks. It also proposes the best location for the shut-in valve and the length of flowline needed to reduce the fluid- hammer effects. This is a pioneering approach to integrate multiphase-flow mod- eling of transient fluid-hammer effects by targeting flow-assurance issues. The software used in the study is a fully transient, commer- cial flow-assurance simulator, and it has been used extensively for well-dynamics studies. The selected tool enables the integrated ap- proach [i.e., from sandface (bottomhole) to wellhead and topside platform, accordingly], which can be applied to surface-facility de- sign and can serve as guidance in field operations to avoid hydro- carbon leakages. Introduction Fluid hammer is a pressure surge or wave that occurs when a fluid (usually a liquid, but sometimes a gas) in motion is forced to stop or change direction suddenly (i.e., momentum change). This phe- nomenon commonly occurs when a valve is closed unexpectedly at the end of a pipeline system and a pressure wave propagates in the flowline. It may also be known as hydraulic shock. This pressure wave can cause major problems, from noise and vibration to flow- line rupture. If the pipeline is closed swiftly at the outlet (down- stream), the mass of fluid before the closure is still moving forward with a certain velocity, building up high pressure and shock waves. These may cause a loud bang or repetitive banging (as the shock waves travel back and forth), which could cause pipeline rupture. On the other hand, when an upstream valve in a pipeline is closed, the fluid downstream of the valve will attempt to continue flowing, creating a vacuum that may cause the pipe to collapse or implode. This problem can be particularly acute if the pipeline is on a downhill slope. In the field, wellhead and bottomhole pressures do not build up or deplete smoothly after well shut-in or startup, respectively. The resultant erratic pressure fluctuations are common, especially in off- shore operations in which packers are commonly installed. The cy- clic pressure surge introduced by a sudden momentum change may unset packers, hammer tubing, and damage the well completion, and may cause sand-control and other flow-assurance issues that could be very costly. Therefore, this transient scenario has drawn significant attention from the industry in the past few decades, and many independent studies have been performed in this area. Joukowsky (1900) presented an analytical solution to estimate the pressure shock (i.e., a sudden pressure rise), which has been well-recognized and widely applied until today. Joukowsky’s equa- tion presents wave amplitude as a function of flow velocity, fluid density, and wave propagation. However, during the well startup and shut-in processes, changes in wellbore pressure are instanta- neous, and the conventional steady-state models are not capable of describing this transient-pressure-oscillation process. Bendiksen et al. (1991), Han et al. (2002), and Zhang and Vairavamoorthy (2005) have hence proposed different mechanistic models that con- sidered not only pressure, flow rate, and temperature profile along the wellbore and flowline, but also phase redistribution in the near- wellbore region. Coats et al. (2003), Hu et al. (2007), and Zhang et al. (2010) con- ducted further studies by coupling subsurface and surface models implicitly and explicitly. Their findings have been applied for in- tegrated field-development planning and flow-assurance studies, especially liquid-loading and liquid-slugging problems. Ran et al. (1995), Chen et al. (2007), and Jiang et al. (2008) conducted a se- ries of analyses on changes of wellhead pressures for gas wells, but with no modeling efforts and no proposed guidelines for field oper- ations. Zhong et al. (2009) analyzed the impact of in-situ tempera- ture on pressure distribution along the wellbore through modeling efforts in two cases—well shut-in and steady-state production. This model was developed from both the mass- and energy-conservation equations. Guo et al. (2010) presented a study of phase redistribu- tion for acidic gas fluid after well shut-in, which took into consid- eration temperature as an important factor. Ghidaoui et al. (2005) presented a comprehensive overview of both historic developments and present-day research and practice in the field concerning hy- draulic transients. They had special discussions on mass and mo- mentum equations for 1D and 2D flows, numerical solutions for 1D and 2D problems, wall shear-stress models, turbulence models, boundary conditions, and future practical and research needs con- cerning water hammer. Chin and Xu (2001) demonstrated the use of transient multiphase-flow analyses in the design of a deepwater production system (i.e., by means of simulations of the subsea Simulation of Multiphase Fluid-Hammer Effects During Well Startup and Shut-in Guoqing Han, China University of Petroleum; Kegang Ling, University of North Dakota; Siew Hiang Khor, SPE, Schlumberger; He Zhang, Ryder Scott Company; and Ram Kinkar Thakur, SPE, Schlumberger Copyright © 2013 Society of Petroleum Engineers This paper (SPE 160049) was accepted for presentation at the SPE Asia Pacific Oil and Gas Conference and Exhibition, Perth, Australia, 22–24 October 2012, and revised for publication. Original manuscript received for review 14 August 2012. Revised manuscript received for review 27 January 2013. Paper peer approved 3 April 2013.
Transcript of Simulation of Multiphase Fluid-Hammer Effects During Well ... · PDF filemodeling fully...

68 Oil and Gas Facilities • December 2013 December 2013 • Oil and Gas Facilities 69
SummaryIn this study, well-known commercial software that is capable of modeling fully transient multiphase flow in wellbore and pipeline has been used to characterize the fluid-hammer effects of well shut-in and startup on the coupled subsurface and surface systems. The original work was performed by applying sensitivity analysis to a typical production system, including well completion, wellbore, downhole equipment (e.g., packer), and the associated surface equipment (i.e., flowline, riser, and valves). This study summarizes the general course of key factors that worsen the fluid-hammer ef-fects. Fluid hammer is also known as water hammer, a shock wave produced by the sudden stoppage of, or reduction in, fluid flow.
Field operations, such as pressure-transient analysis, facility maintenance, and workover, require a well shut-in process. For a typical production system, the resultant sudden rises in pressure can be critical because they have a direct impact on equipment (i.e., unsetting of the packer) and may cause damage to instrumentation. This paper provides estimates of the typical ratio of transient shock in pressure and flow rate to preconditional values, and the duration of such pressure shocks. It also proposes the best location for the shut-in valve and the length of flowline needed to reduce the fluid-hammer effects.
This is a pioneering approach to integrate multiphase-flow mod-eling of transient fluid-hammer effects by targeting flow-assurance issues. The software used in the study is a fully transient, commer-cial flow-assurance simulator, and it has been used extensively for well-dynamics studies. The selected tool enables the integrated ap-proach [i.e., from sandface (bottomhole) to wellhead and topside platform, accordingly], which can be applied to surface-facility de-sign and can serve as guidance in field operations to avoid hydro-carbon leakages.
IntroductionFluid hammer is a pressure surge or wave that occurs when a fluid (usually a liquid, but sometimes a gas) in motion is forced to stop or change direction suddenly (i.e., momentum change). This phe-nomenon commonly occurs when a valve is closed unexpectedly at the end of a pipeline system and a pressure wave propagates in the flowline. It may also be known as hydraulic shock. This pressure wave can cause major problems, from noise and vibration to flow-line rupture. If the pipeline is closed swiftly at the outlet (down-stream), the mass of fluid before the closure is still moving forward with a certain velocity, building up high pressure and shock waves. These may cause a loud bang or repetitive banging (as the shock waves travel back and forth), which could cause pipeline rupture.
On the other hand, when an upstream valve in a pipeline is closed, the fluid downstream of the valve will attempt to continue flowing, creating a vacuum that may cause the pipe to collapse or implode. This problem can be particularly acute if the pipeline is on a downhill slope.
In the field, wellhead and bottomhole pressures do not build up or deplete smoothly after well shut-in or startup, respectively. The resultant erratic pressure fluctuations are common, especially in off-shore operations in which packers are commonly installed. The cy-clic pressure surge introduced by a sudden momentum change may unset packers, hammer tubing, and damage the well completion, and may cause sand-control and other flow-assurance issues that could be very costly. Therefore, this transient scenario has drawn significant attention from the industry in the past few decades, and many independent studies have been performed in this area.
Joukowsky (1900) presented an analytical solution to estimate the pressure shock (i.e., a sudden pressure rise), which has been well-recognized and widely applied until today. Joukowsky’s equa-tion presents wave amplitude as a function of flow velocity, fluid density, and wave propagation. However, during the well startup and shut-in processes, changes in wellbore pressure are instanta-neous, and the conventional steady-state models are not capable of describing this transient-pressure-oscillation process. Bendiksen et al. (1991), Han et al. (2002), and Zhang and Vairavamoorthy (2005) have hence proposed different mechanistic models that con-sidered not only pressure, flow rate, and temperature profile along the wellbore and flowline, but also phase redistribution in the near-wellbore region.
Coats et al. (2003), Hu et al. (2007), and Zhang et al. (2010) con-ducted further studies by coupling subsurface and surface models implicitly and explicitly. Their findings have been applied for in-tegrated field-development planning and flow-assurance studies, especially liquid-loading and liquid-slugging problems. Ran et al. (1995), Chen et al. (2007), and Jiang et al. (2008) conducted a se-ries of analyses on changes of wellhead pressures for gas wells, but with no modeling efforts and no proposed guidelines for field oper-ations. Zhong et al. (2009) analyzed the impact of in-situ tempera-ture on pressure distribution along the wellbore through modeling efforts in two cases—well shut-in and steady-state production. This model was developed from both the mass- and energy-conservation equations. Guo et al. (2010) presented a study of phase redistribu-tion for acidic gas fluid after well shut-in, which took into consid-eration temperature as an important factor. Ghidaoui et al. (2005) presented a comprehensive overview of both historic developments and present-day research and practice in the field concerning hy-draulic transients. They had special discussions on mass and mo-mentum equations for 1D and 2D flows, numerical solutions for 1D and 2D problems, wall shear-stress models, turbulence models, boundary conditions, and future practical and research needs con-cerning water hammer. Chin and Xu (2001) demonstrated the use of transient multiphase-flow analyses in the design of a deepwater production system (i.e., by means of simulations of the subsea
Simulation of Multiphase Fluid-Hammer Effects During Well Startup and Shut-in
Guoqing Han, China University of Petroleum; Kegang Ling, University of North Dakota; Siew Hiang Khor, SPE, Schlumberger;
He Zhang, Ryder Scott Company; and Ram Kinkar Thakur, SPE, Schlumberger
Copyright © 2013 Society of Petroleum Engineers
This paper (SPE 160049) was accepted for presentation at the SPE Asia Pacific Oil and Gas Conference and Exhibition, Perth, Australia, 22–24 October 2012, and revised for publication. Original manuscript received for review 14 August 2012. Revised manuscript received for review 27 January 2013. Paper peer approved 3 April 2013.

68 Oil and Gas Facilities • December 2013 December 2013 • Oil and Gas Facilities 69
high-intensity pressure-protection system and emergency shut-down with support of field case studies). Wang et al. (2008) studied the water hammer in water injectors with a field trial in which pres-sure pulses generated from rapid shut-ins at different well depths in a soft-formation case and a perforated water injector, respectively, were recorded. Tang and Ouyang (2010) and Choi and Huang (2011) studied the effect of water hammer on deepwater-injection-well design. However, a general guide to relieve fluid-hammer ef-fects upon well startup or shut-in is still incomplete.
An integrated single-flow model (with wellbore and surface flowline) has been used in this study to investigate the water-hammer effects on a generic offshore production system. The selected fully transient commercial software is a proven flow-as-surance simulator and is also used extensively for well-dynamics studies. It has the capacity to model multiphase flow in wellbore and pipeline by solving five coupled mass-conservation equations, three momentum-conservation equations, and one energy-balance equation for a three-phase system (Bendiksen et al. 1991).
Mass-Conservation Equations. For gas phase,
( ) ( )gg
ggggg G
zAV
AVt
++∂
∂−=
∂∂ ψ
νρρ 1 . ...........................(1)
For liquid phase at pipe wall,
( ) ( )1 LL L L L L g e d L
L D
V GVAVt A z V V
ρ ρ ν ψ ψ ψ∂ ∂= − − − + +∂ ∂ +
.
....................................................(2)
For liquid droplets,
( ) ( )1 D L D DD DdegL
L D
AV V GVt A z V V
ρ νψψψρ
∂∂ = − − + − +∂ ∂ +
.
....................................................(3)
For phase transfer between phases,
,,
1g g g L
g L T RT R ss
V V pp p t
ρ ρρ ρ
∂ − ∂ ∂ + ∂ ∂ ∂
( ) ( )1 1g g g L L L
Lg
AV AVA z A z
ρ ν ρ νρ ρ
∂ ∂= − −
∂ ∂
( ) 111 D L Dg
LgL
AVA z
ρ νψ
ρ ρ ρ ∂
− + − ∂
1 1 1g L D
g L LG G G
ρ ρ ρ+ + + . ................................................(4)
For interfacial mass-transfer rate,
s s s s
gp pT T
R R R Rp p z T T zp t p z t T t T z t
ψ ∂ ∂ ∂ ∂ ∂ ∂ ∂ ∂ ∂ ∂ = + + + ∂ ∂ ∂ ∂ ∂ ∂ ∂ ∂ ∂ ∂
( )g L Dm m m× + + , ................................................................(5)
where
DLg
gs mmm
mR
++=
. ..............................................................(6)
Momentum-Conservation Equations. For gas phase,
( ) ( )21
1 1 cos2 4 2 4
g g gg g gg
g ig g g g i g r r g g g a D
AVV pVt z A z
S SV g v F
A A
ρ νρ ν
λ ρ ν ν λ ρ ν ν ρ α ψ
∂∂ ∂ = − − ∂ ∂ ∂
− − + + − .
....................................................(7)
For liquid phase at pipe wall,
( ) ( )
( )
21
1 1 cos2 4 2 4
sin
L L LL L LL
iLL L L L i g r r L L
LLg a e i d D L L g
L D
AVV pVt z A z
SSV g
A A
VV v v v V d gzVV
ρ νρ ν
λ ρ ν ν λ ρ ν ν ρ α
ψ ψ ψ ρ ρ α
∂∂ ∂ = − − ∂ ∂ ∂
− + +
∂− − + − −
∂+.
....................................................(8)
For liquid droplets,
( ) ( )21
soc
D L DD L DD
DD L g a e i d D D
L D
AVV pVt z A z
VV g v v v FV V
ρ νρ ν
ρ α ψ ψ ψ
∂∂ ∂ = − − ∂ ∂ ∂
+ − + − ++
, ......(9)
where va=vL for yg>0 (and evaporation from the liquid film), va=vD for
yg>0 (and evaporation from the liquid droplets), and
va=vg for yg<0 (condensation).
Mixture Energy-Conservation Equation.
2221 1 12 2 2g g g L L L D D Dm E v gh m E v gh m E v gh
t∂ + + + + + + + + ∂
221 12 2g g g g L L L Lm v H v gh m v H v gh
z∂ = + + + + + ∂
21
2D D D D Sm v H v gh H U + + + + + . ................................(10)
Combined with the operating and physical data described in the next section, the simulation results demonstrated that a pressure shock was created by a pressure difference on two sides of the shut-in valve. In the transient shut-in period, the flow rate could increase by as much as 10 times that of the production rate at a steady-state condition. Setting the closing valve at the topside platform would cause a higher peak pressure if compared with one set at the wellhead or bottomhole—this finding was in agreement with that derived from a specific case study without considering flow-line and riser by Choi and Huang (2011). Another observation from the study was that the presence of a short flowline could help to re-duce the pressure surge dramatically.
Apart from the closing-valve location and presence of a flow-line/riser, it was concluded that fluid properties had significant di-rect influence on water-hammer effects. For example, a high gas/liquid-ratio flow system resulted in a lower peak shock because the presence of a compressible fluid (such as gas) would reduce the water-hammer effect significantly. Another observation made from the study was that the location of the shut-in valve had little or no impact on the duration of pressure oscillations. Finally, a slow shut-in operation is highly recommended because it helps to reduce the pressure surge.
70 Oil and Gas Facilities • December 2013 December 2013 • Oil and Gas Facilities 71
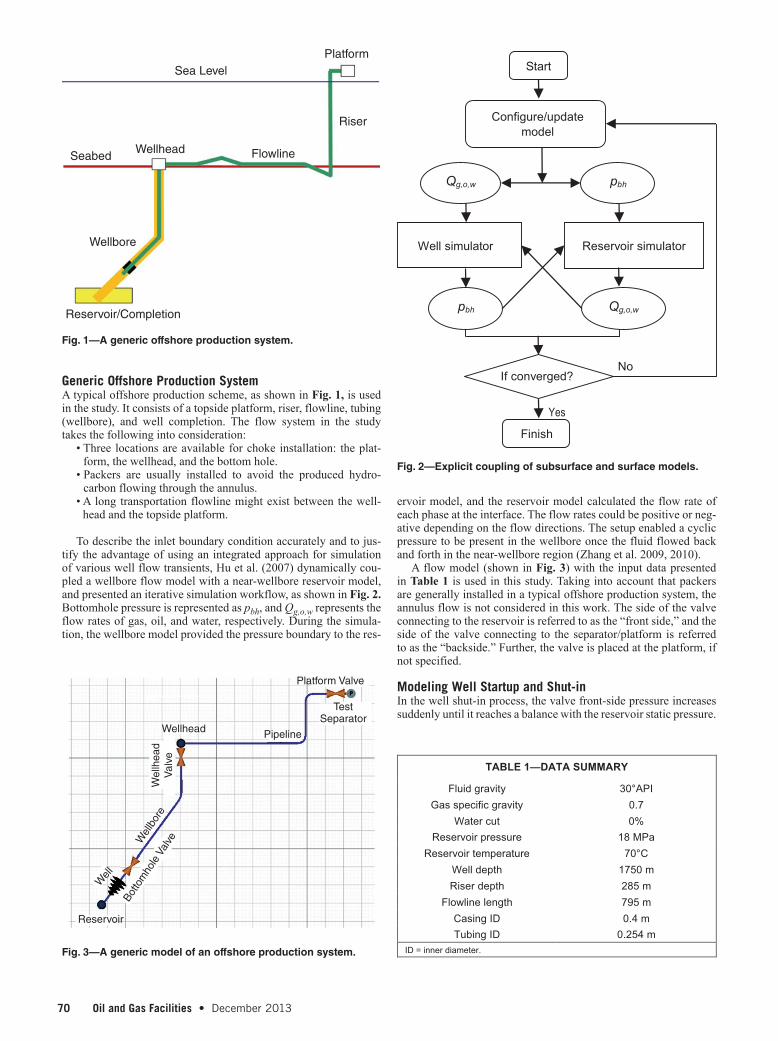
Generic Offshore Production SystemA typical offshore production scheme, as shown in Fig. 1, is used in the study. It consists of a topside platform, riser, flowline, tubing (wellbore), and well completion. The flow system in the study takes the following into consideration:
• Three locations are available for choke installation: the plat-form, the wellhead, and the bottom hole.
• Packers are usually installed to avoid the produced hydro-carbon flowing through the annulus.
• A long transportation flowline might exist between the well-head and the topside platform.
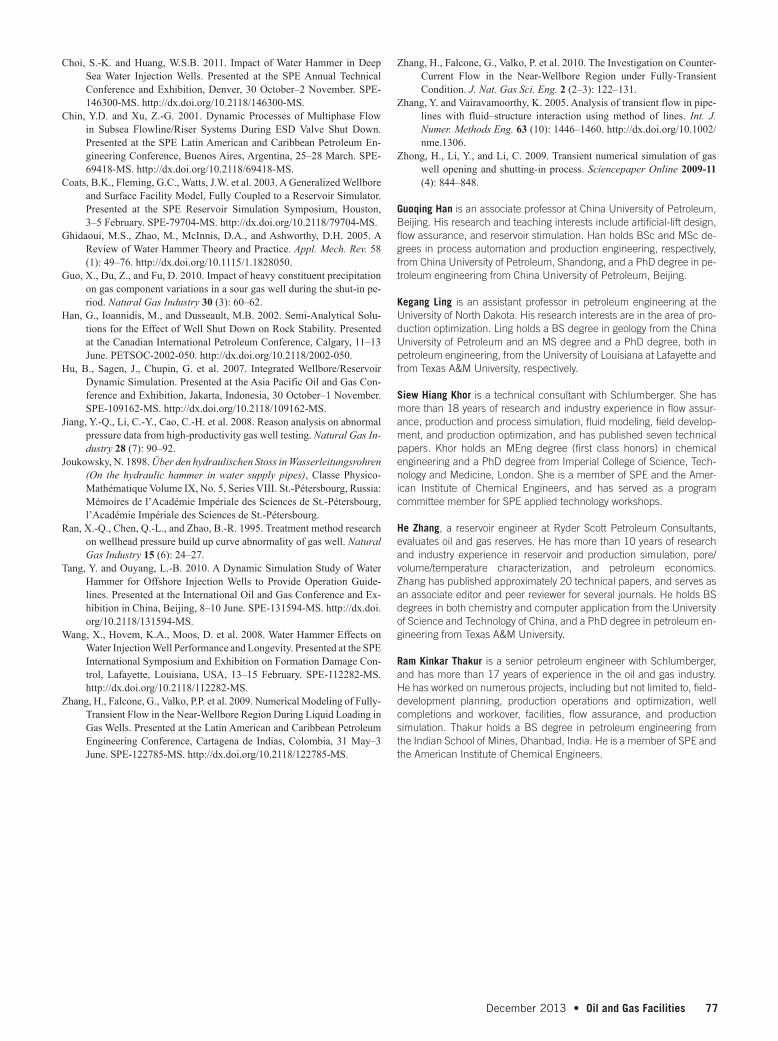
To describe the inlet boundary condition accurately and to jus-tify the advantage of using an integrated approach for simulation of various well flow transients, Hu et al. (2007) dynamically cou-pled a wellbore flow model with a near-wellbore reservoir model, and presented an iterative simulation workflow, as shown in Fig. 2. Bottomhole pressure is represented as pbh, and Qg,o,w represents the flow rates of gas, oil, and water, respectively. During the simula-tion, the wellbore model provided the pressure boundary to the res-
ervoir model, and the reservoir model calculated the flow rate of each phase at the interface. The flow rates could be positive or neg-ative depending on the flow directions. The setup enabled a cyclic pressure to be present in the wellbore once the fluid flowed back and forth in the near-wellbore region (Zhang et al. 2009, 2010).
A flow model (shown in Fig. 3) with the input data presented in Table 1 is used in this study. Taking into account that packers are generally installed in a typical offshore production system, the annulus flow is not considered in this work. The side of the valve connecting to the reservoir is referred to as the “front side,” and the side of the valve connecting to the separator/platform is referred to as the “backside.” Further, the valve is placed at the platform, if not specified.
Modeling Well Startup and Shut-inIn the well shut-in process, the valve front-side pressure increases suddenly until it reaches a balance with the reservoir static pressure.
PlatformSea Level
Riser
FlowlineWellheadSeabed
Wellbore
Reservoir/Completion
Start
Configure/update model
Qg,o,w pbh
Reservoir simulator Well simulator
pbh Qg,o,w
Finish
No
Yes
If converged?
Platform Valve
Wellhead Pipeline
Reservoir
Wel
l
Wel
lbor
e
Botto
mho
le V
alve
TestSeparator
Wel
lhea
dV
alve TABLE 1—DATA SUMMARY
Fluid gravity 30°API Gas specific gravity 0.7
Water cut 0% Reservoir pressure 18 MPa
Reservoir temperature 70°C Well depth 1750 m Riser depth 285 m
Flowline length 795 m Casing ID 0.4 m Tubing ID 0.254 m
ID = inner diameter. Fig. 3—A generic model of an offshore production system.
Fig. 2—Explicit coupling of subsurface and surface models.
Fig. 1—A generic offshore production system.

70 Oil and Gas Facilities • December 2013 December 2013 • Oil and Gas Facilities 71
On the backside of the valve, because the valve cuts off the supply, the pressure increases suddenly as the choke closes, and then it de-creases continuously as momentum removes the fluid downstream. A pressure wave (depending on the lengths of flowline and riser downstream) can be observed. This leads to a pressure difference on both sides of the valve. In the well-startup process, the backside pressure reaches a peak value close to simultaneously, which leads to a maximum flow rate. As the front-side pressure decreases grad-ually, the pressure difference of the valve reduces gradually, and eventually stabilizes. The flow rate declines correspondingly, and it finally reaches a stable value. This process starts from a transient condition and ends as a steady-state scenario.
In the well-startup process, the fluid-hammer effect is not as se-vere as in the well-shut-in process, because the unsteady-state flow rate acts as the kicking factor in the transient period. On the con-trary, in the well-shut-in process, the kicking factor is the pressure difference between the two sides of the valve.
Well-Startup Process. Characteristics of Well Startup. Taking the previously developed model, after we shut in the well for 5 hours with the valve installed at the wellhead, a stabilized system is es-tablished. Next, the well starts production in a short time period of 10 seconds. The production pressure drawdown is 2.5 MPa. The steady production rate is calculated to be 600 m3/d. The valve pres-sure and flow rate vs. time, which were measured at the wellhead, are shown in Fig. 4a.
When the valve is first opened, the flow rate reaches the peak value, and the amplitude is approximately two times greater than that of the stable rate. During the pulse (which occurs when the
valve is opened and lasts less than 0.5 seconds), the front-side pres-sure decreases monotonically, whereas the backside pressure in-creases monotonically until it balances the front-side pressure. Afterward, both the front-side and backside pressures decline si-multaneously (i.e., after a time of 18,000.2 seconds), as illustrated in Fig. 4b.
Identifying the Impacting Factors. Taking the same generic model, we perform sensitivity analysis on parameters of flow rate, gas/oil ratio (GOR), pressure drawdown, and operation period. The results are summarized in Table 2, which shows that
• The valve pressure difference reaches its peak simultaneously with well startup.
• The amplitude is proportional to the pressure drawdown in a ratio range of 0.6 to 0.7.
• Correspondingly, the flow rate reaches its peak once the valve pressure difference is at maximum. The amplitude can be up to 20+ times greater than the stabilized rate. As the drawdown or GOR increases, the ratio of flow-rate peak/stabilized values increases.
• Because the operation time of well startup is shorter, the pres-sure peak and flow-rate peak are higher. However, once the op-eration time is larger than a tolerance value (20 seconds in this case), the influence is not dominant.
• Because the values for flow rate, fluid GOR, operation time, and pressure drawdown are greater, the stabilization time is longer.
Well-Shut-In Process. Characteristics of Well Shut-In. Unlike the well-startup process, an afterflow effect can be observed in the
Fig. 4—(a) Typical in-situ pressure/flow-rate trends near valve vs. time in well-start-up process, and (b) amplification of plots of in-situ pressure/flow-rate trends near valve vs. time during the pulse.
(a)
(b)
Pressure, front of valve
Pressure, back of valve
Flow rate
Pressure, front of valve
Pressure, back of valve
Flow rate
Flow-rate peak
Pressure peak
Startup Setting pressure
18,000 18,015 18,030 18,045
2400
2100
1800
1500
1200
900
600
300
0
7.0
6.5
6.0
5.5
5.0
4.5
4.0
3.5
3.0
Pre
ssu
re, M
Pa
Flo
w R
ate, std m
3/d
Time, seconds
17,999.8 18,000 18,000.2 18,000.4 18,000.6 18,0008.8 18,001
2400
2100
1800
1500
1200
900
600
300
0
7.0
6.5
6.0
5.5
5.0
4.5
4.0
3.5
3.0
Pre
ssu
re, M
Pa
Flo
w R
ate, std m
3/d
Time, seconds

72 Oil and Gas Facilities • December 2013 December 2013 • Oil and Gas Facilities 73
well-shut-in process. This flow is associated with wellbore stor-age. When a well is first shut in, flow from the formation into the wellbore bottom hole continues (even unabated) until compression of the fluids in the wellbore causes the bottomhole pressure to rise. If the wellbore fluid is highly compressible and the well rate is low, the afterflow period can be long. Conversely, high-rate wells producing little gas have negligible afterflow periods, and, consequently, could introduce a strong hammer effect. This pressure surge transmits from both sides of the valve. For a producer, the shock is absorbed in large part by the reservoir tank; therefore, the front-side hammer effect is not as cyclic as the backside effect, but it is much stronger.
Taking the previously developed model, after the well produces for 2 hours, it establishes a stabilized production system. Next, this well is shut in by the valve at the wellhead for a short period of 10 seconds. The production pressure drawdown is 2.18 MPa. The steady production rate is calculated to be 600 m3/d. The valve pres-sure and flow rate vs. time are shown in Fig. 5.
When the valve is first closed, the backside pressure has a cyclic pattern of pressure surge, and the amplitude is less than that of the front-side pressure shock. After 5 minutes (300 seconds), the front-side pressure stabilizes. For the backside pressure oscillation, the amplitude decreases gradually, and disappears completely after a longer period―10 minutes (600 seconds).
Identifying the Impacting Factors. Taking the same generic model, we perform sensitivity analysis on parameters of flow rate, GOR, pressure drawdown, and operation period. The results are summarized in Table 3, which shows that
• After the shut-in, the front-side pressure increases quickly; however, the backside pressure increases gradually in a cyclic pattern caused by the afterflow effect. The maximum ratio of the surge peak is approximately 1.0 to 1.5 times that of the pressure drawdown.• The operation period of shut-in has a strong influence on
hammer effects. The faster the shut-in period, the worse the
TABLE 2—WELL-STARTUP SENSITIVITY-ANALYSIS RESULTS
Pressure Peak/
Drawdown Flow-Rate Peak/ Setting Flow Rate
Stabilization Time After Startup
(seconds) Remarks
Flow rate, Q (m3/d) 100 0.71 12.43 1100 GOR=0 std m3/std m3 Δt=10 seconds
666 0.62 2.07 1100 Δp=1.2 MPa GOR (std m3/std m3) 0 0.62 3.64 400 Δp=2.18 MPa 10 0.66 14.01 2500 Q=100 m /d3 Δt=10 seconds Valve operation time, Δt (seconds)
1 0.72 9.42 2500 GOR=10 std m3/std m3
20 0.68 8.42 2500 Δp=2.18 MPa 30 0.66 8.25 2500 Q=100 m3/d 40 0.64 8.00 2500 60 0.64 7.75 2500 120 0.62 7.57 2500 Drawdown, Δp (MPa) 1.2 0.704 2.33 350 GOR=0 std m3/std m3
2.18 0.701 4.12 366 Q=666 m3/d 12.22 0.588 22.9 450 Δt=1 second
TABLE 3—WELL-SHUT-IN SENSITIVITY-ANALYSIS RESULTS
Pressure Peak/
Drawdown
Stabilization Time After Startup
(seconds) Remarks
Flow rate, Q (m3/d) 100 1.22 650 GOR=0 std m3/std m3 Δt=10 seconds
666 1.52 650 Δp=1.2 MPa GOR (std m3/std m3) 0 1.12 650 Δp=2.18 MPa 10 1.04 650 Q=100 m /d3 Δt=10 seconds Valve operation time, Δt (seconds)
1 1.18 600 GOR=10 std m3/std m3
20 1.02 650 Δp=2.18 MPa 30 1.01 650 Q=666 m3/d 40 1.01 650 60 1.01 650 120 1.01 650 Drawdown, Δp (MPa) 1.2 1.44 600 GOR=0 std m3/std m3
2.18 1.27 600 Q=666 m3/d 12.22 1.05 600 Δt=1 second

72 Oil and Gas Facilities • December 2013 December 2013 • Oil and Gas Facilities 73
pressure surge will be. However, in this case, once the time is longer than 20 seconds, the pressure surge does not play a role.
• A period of 10 minutes is required for production-system stabi-lization in the typical production system.• Because the values for fluid GOR, operation time, and pres-
sure drawdown are greater, the stabilization time is longer. The results are similar to those of the well-startup study, but high flow rates lead to severe hammer effects. Note that although
the ratio of pressure peak to drawdown decreases as the draw-down increases, the pressure peak still increases.
Modeling Well Startup and Shut-in With a Different Well SchemeDifferent Valve Locations. A valve can be placed at different lo-cations: bottom hole, wellhead, or platform. Using the previous model, the hammer effects can be compared in Figs. 6 through 9. The study shows that
Fig. 5—Typical in-situ pressure trends near valve vs. time in well-shut-in process.
Pressure, front of valve
Pressure, back of valve
Flow rate
7,000 7,500 8,000 8,500 9,000
700
600
500
400
300
200
100
0
6.5
6.0
5.5
5.0
4.5
4.0
3.5
3.0
Pre
ssu
re, M
PaF
low
Rate, std
m3/d
Time, seconds
Fig. 7—Bottomhole-pressure surge upon different location of the valve (well startup).
Fig. 6—Pressure surge at separator upon different location of the valve (well startup).
0.7
0.9
1.1
1.3
18,000 18,002 18,004 18,006 18,008 18,010
Pres
sure
at S
epar
ator
, MPa
Time, seconds
Startup at bottom holeStartup at wellheadStartup at platform
14
15
16
17
18,000 18,020 18,040 18,060 18,080 18,100
Bot
tom
hole
Pre
ssur
e, M
Pa
Time, seconds
Startup at bottom holeStartup at wellheadStartup at platform

74 Oil and Gas Facilities • December 2013 December 2013 • Oil and Gas Facilities 75
• In the well-startup process, opening the valve at the platform could create a large cyclic pressure pulse. While placing the valve at the well bottom hole or the wellbore could also intro-duce a cyclic pressure shock, it is relatively compromising in these locations.
• In the well-shut-in process, placing the valve at the platform creates the greatest negative impulse on the separator. On the contrary, placing the valve at the well bottom hole or the well-head provides a tolerable pressure shock, which has less possi-bility to damage equipment. Because the afterflow effect plays a role wherever the valve is placed, the bottomhole pressure al-ways builds up monotonically and reaches the balance quickly.
Different Flowline Setups. The design of a long distance flowline on a seabed is a major challenge of offshore production systems. Apart from fluid-hammer effects, other flow-assurance aspects have been well noticed compared with onshore completions. These aspects include mineral (inorganic) scaling, gas hydrates/wax/as-phaltenes organic scaling, liquid loading/slugging, pipeline pig-ging, and emulsion.
Simulating the previous case with the flowline deactivated and activated helps to identify how the presence of a flowline can affect the amplitude of the pressure peak and its attenuation time. Figs. 10 through 12 demonstrate that the presence of a flowline can reduce the hammer effect dramatically. This supports the concept that a flowline can work as a special pressure oscillation “damper” during well startup or shut-in. The longer the flowline is, the more signifi-cant the damping effect, as presented in Fig. 10.
Figs. 11 and 12 further illustrate that the lengths of the riser and the flowline, respectively, have a stepwise effect on atten-uating pressure oscillations because of the increased system volume. Therefore, the damping effect is proportional to the length of the riser or the flowline. Comparing Figs. 11 and 12 confirms that the presence of a flowline can help reduce pres-sure shock by diverting and buffering the shock wave. The kinks shown in Fig. 12 demonstrate that the diverting effect dominates for a short flowline (i.e., with a length less than 1 m), while the buffering effect becomes more predominant for a long flowline (i.e., with a length greater than 100 m) with the same riser con-dition. For flowline with length ranging between 1 to 100 m, the diverting effect is the dominant factor in shock attenuation. We believe this observation is a result of the special diverting ef-fect arising from the perpendicular angle of the fluid-flow direc-tion and the original hammer transmission direction. As shown in Fig. 12, the diverting effect has a steeper slope than that of the buffering effect. Figs. 10 and 12 suggest that even the pres-ence of a relatively short flowline can effectively reduce water- hammer effect.
Packer Effects. Packers are installed commonly as a characteristic of an offshore production system. Taking the same model from Fig. 6, we uninstall the packer. The investigation of the pressure at the same location is shown in Fig. 13.
Comparing Fig. 13 with Fig. 8, it is clear that the pressure oscil-lation becomes attenuated in connecting with the annulus, which develops a large system volume as a buffer to absorb the oscil-
Fig. 9—Bottomhole-pressure surge upon different location of the valve (well shut-in).
Fig. 8—Pressure surge at separator upon different location of the valve (well shut-in).
0.8
0.85
0.9
0.95
1
1.05
042,7022,7002,7
Pres
sure
at S
epar
ator
, MPa
Time, seconds
Shutin at bottom holeShutin at wellheadShutin at platform
14.5
15.5
16.5
17.5
7,200 7,700 8,200 8,700 9,200 9,700
Bot
tom
hole
Pre
ssur
e, M
Pa
Time, seconds
Shutin at bottom holeShutin at wellheadShutin at platform

74 Oil and Gas Facilities • December 2013 December 2013 • Oil and Gas Facilities 75
lations. The gas occupying the annulus is the key factor in ab-sorbing pressure shock resulting from sudden shut-in. It is also found that the setting of the valve location does not affect the pres-sure oscillations.
ConclusionsA dynamic, integrated wellbore/flowline (and riser) flow model was built and used to study the flow-assurance aspect of fluid-hammer effects, which requires attention especially for offshore
Fig. 11—Pressure shock variations at different riser lengths. The valve is placed at the platform (shut-in).
Fig. 12—Pressure shock variations at different flowline lengths. The valve is placed at the platform (shut-in).
Fig. 10—Sensitivity study of horizontal-flowline length to impact pressure oscillation at separator (shut-in).
0.6
1
1.4
1.8
18,000 18,010 18,020 18,030 18,040 18,050 18,060
Pres
sure
at S
epar
ator
, MPa
Time, seconds
No horizontal flowlineHorizontal flowline length=400 ftHorizontal flowline length=800 ftHorizontal flowline length=1,600 ft
0.4
0.2
0
0.6
0.8
1.2
1
0.1 1 10 100 1000
Pres
sure
at S
epar
ator
, MPa
Length of Riser, m
0.4
0.2
0
0.6
0.8
1.2
1
1.6
1.4
0.1 1 10 100 1000
Pres
sure
at S
epar
ator
, MPa
Length of Flowline, m

76 Oil and Gas Facilities • December 2013 December 2013 • Oil and Gas Facilities 77
production operation. The simulation results have demonstrated that the proposed transient integrated approach is adequate in mod-eling and simulating the fluid-hammer effects introduced during well startup and shut-in. The application of the proposed integrated model has also helped to conclude the following:
1. Pressure drawdown has a primary effect on the pressure os-cillation amplitude, with a range of approximately 60 to 70% of the drawdown value. The amplitude of pressure oscillation exhibits little dependence on well operating time and produc-tion rate. In the first instant of well startup, the resulting tran-sient flow rate can reach as high as 10 times that of steady state.
2. During the well shut-in, the amplitude of pressure oscillation was caused primarily by water-hammer effects, and its value was dependent on various factors: the higher the GOR, the smaller its amplitude; and the longer the valve closing time, the smaller the wave amplitude. In the studied case, the wave oscillations resulting from water-hammer effects disappear after 600 seconds (i.e., 10 minutes).
3. A shut-in/startup valve located on the platform (especially near the separator) will result in severe water-hammer effects. Hence, it is advisable to place the shut-in/startup valve at the bottomhole, if possible, to reduce the hammer effects.
4. In general, the hammer effects decrease with the increase of volume (i.e., with a longer flowline). In addition, the hammer effects decrease slightly over the travel distance. For a small flow system, the water-hammer effects can be seen travelling back and forth clearly, but for most cases involving high vol-umetric flow rates, the hammer effects do not generally come back in a long flowline.
5. The fluid-hammer effect is very much dependent on fluid compressibility rather than volumetric flow rate. A higher fluid compressibility will lead to smaller pressure oscillation amplitude. In a multiphaseflow system, the total fluid com-pressibility is subjected to the in-situ GOR.
6. Finally, the volumetric effect on fluid hammering will become insignificant for a flow system with incompressible fluid. On the other hand, a small fraction of compressible fluid (such as gas) will reduce the hammer effect significantly.
Nomenclature A =pipe cross-sectional area, m2
d =diameter, m E =internal energy per unit mass, J/kg FD =drag force, N/m3
g =gravitational constant, m/s2
G =mass source, kg/s·m3
h =height, m
H =enthalpy, J/kg HS =enthalpy from mass sources, J/kg mD =VD ρL, kg/m3
mg =Vg ρg, kg/m3
mL =VL ρL, kg/m3
p =pressure, MPa pbh =bottomhole pressure, MPa Q =flow rate, std m3/d Rs =gas/oil ratio, std m3/std m3
S =perimeter, m Sf =wetted perimeter, Phase f, m t =time, seconds T =temperature, °C U =heat transfer per unit volume, J/m3
v =velocity, m/s V =volume VF =volumetric fractions (F=g, L, D) z =length coordinate, m α=angle with gravity vector, radians λ=friction coefficient ρ=density, kg/m3
ψ=mass-transfer term, kg/m3·s
Subscripts d =droplet deposition D =droplet e =droplet entrainment f =Phase f (G,L,D) g =gas i =interfacial L =liquid o =oil r =relative s =superficial w =water
AcknowledgmentsThe authors would like to express their gratitude to Bazlee Mat-zain, Michael Carney, Rodney Lessard, and Fabien Houeto for their valuable input.
ReferencesBendiksen, K.H., Malnes, D., Moe, R. et al. 1991. The Dynamic Two-Fluid
Model OLGA: Theory and Application. SPE Prod Eng 6 (2): 171–180. SPE-19451-PA. http://dx.doi.org/10.2118/19451-PA.
Chen, W., Duan, Y.-G., Liu, B.-F. et al. 2007. Abnormal Well Head Pressure of High Productivity Gas Wells in Luo Jiazhai (in Chinese). Journal of Southwest Petroleum University 29 (1): 60–63.
Fig. 13—Pressure surge at separator upon different location of the valve without packers installed (shut-in).
1.24
1.245
1.25
7,200 7,220 7,240
Pres
sure
at S
epar
ator
, MPa
Time, seconds
Shutin at bottom holeShutin at wellheadShutin at platform
76 Oil and Gas Facilities • December 2013 December 2013 • Oil and Gas Facilities 77
Choi, S.-K. and Huang, W.S.B. 2011. Impact of Water Hammer in Deep Sea Water Injection Wells. Presented at the SPE Annual Technical Conference and Exhibition, Denver, 30 October–2 November. SPE-146300-MS. http://dx.doi.org/10.2118/146300-MS.
Chin, Y.D. and Xu, Z.-G. 2001. Dynamic Processes of Multiphase Flow in Subsea Flowline/Riser Systems During ESD Valve Shut Down. Presented at the SPE Latin American and Caribbean Petroleum En-gineering Conference, Buenos Aires, Argentina, 25–28 March. SPE-69418-MS. http://dx.doi.org/10.2118/69418-MS.
Coats, B.K., Fleming, G.C., Watts, J.W. et al. 2003. A Generalized Wellbore and Surface Facility Model, Fully Coupled to a Reservoir Simulator. Presented at the SPE Reservoir Simulation Symposium, Houston, 3–5 February. SPE-79704-MS. http://dx.doi.org/10.2118/79704-MS.
Ghidaoui, M.S., Zhao, M., McInnis, D.A., and Ashworthy, D.H. 2005. A Review of Water Hammer Theory and Practice. Appl. Mech. Rev. 58 (1): 49–76. http://dx.doi.org/10.1115/1.1828050.
Guo, X., Du, Z., and Fu, D. 2010. Impact of heavy constituent precipitation on gas component variations in a sour gas well during the shut-in pe-riod. Natural Gas Industry 30 (3): 60–62.
Han, G., Ioannidis, M., and Dusseault, M.B. 2002. Semi-Analytical Solu-tions for the Effect of Well Shut Down on Rock Stability. Presented at the Canadian International Petroleum Conference, Calgary, 11–13 June. PETSOC-2002-050. http://dx.doi.org/10.2118/2002-050.
Hu, B., Sagen, J., Chupin, G. et al. 2007. Integrated Wellbore/Reservoir Dynamic Simulation. Presented at the Asia Pacific Oil and Gas Con-ference and Exhibition, Jakarta, Indonesia, 30 October–1 November. SPE-109162-MS. http://dx.doi.org/10.2118/109162-MS.
Jiang, Y.-Q., Li, C.-Y., Cao, C.-H. et al. 2008. Reason analysis on abnormal pressure data from high-productivity gas well testing. Natural Gas In-dustry 28 (7): 90–92.
Joukowsky, N. 1898. Über den hydraulischen Stoss in Wasserleitungsrohren (On the hydraulic hammer in water supply pipes), Classe Physico-Mathématique Volume IX, No. 5, Series VIII. St.- Pétersbourg, Russia: Mémoires de l’Académie Impériale des Sciences de St.-Pétersbourg, l’Académie Impériale des Sciences de St.-Pétersbourg.
Ran, X.-Q., Chen, Q.-L., and Zhao, B.-R. 1995. Treatment method research on wellhead pressure build up curve abnormality of gas well. Natural Gas Industry 15 (6): 24–27.
Tang, Y. and Ouyang, L.-B. 2010. A Dynamic Simulation Study of Water Hammer for Offshore Injection Wells to Provide Operation Guide-lines. Presented at the International Oil and Gas Conference and Ex-hibition in China, Beijing, 8–10 June. SPE-131594-MS. http://dx.doi.org/10.2118/131594-MS.
Wang, X., Hovem, K.A., Moos, D. et al. 2008. Water Hammer Effects on Water Injection Well Performance and Longevity. Presented at the SPE International Symposium and Exhibition on Formation Damage Con-trol, Lafayette, Louisiana, USA, 13–15 February. SPE-112282-MS. http://dx.doi.org/10.2118/112282-MS.
Zhang, H., Falcone, G., Valko, P.P. et al. 2009. Numerical Modeling of Fully-Transient Flow in the Near-Wellbore Region During Liquid Loading in Gas Wells. Presented at the Latin American and Caribbean Petroleum Engineering Conference, Cartagena de Indias, Colombia, 31 May–3 June. SPE-122785-MS. http://dx.doi.org/10.2118/122785-MS.
Zhang, H., Falcone, G., Valko, P. et al. 2010. The Investigation on Counter-Current Flow in the Near-Wellbore Region under Fully-Transient Condition. J. Nat. Gas Sci. Eng. 2 (2–3): 122–131.
Zhang, Y. and Vairavamoorthy, K. 2005. Analysis of transient flow in pipe-lines with fluid–structure interaction using method of lines. Int. J. Numer. Methods Eng. 63 (10): 1446–1460. http://dx.doi.org/10.1002/nme.1306.
Zhong, H., Li, Y., and Li, C. 2009. Transient numerical simulation of gas well opening and shutting-in process. Sciencepaper Online 2009-11 (4): 844–848.
Guoqing Han is an associate professor at China University of Petroleum, Beijing. His research and teaching interests include artificial-lift design, flow assurance, and reservoir stimulation. Han holds BSc and MSc de-grees in process automation and production engineering, respectively, from China University of Petroleum, Shandong, and a PhD degree in pe-troleum engineering from China University of Petroleum, Beijing.
Kegang Ling is an assistant professor in petroleum engineering at the University of North Dakota. His research interests are in the area of pro-duction optimization. Ling holds a BS degree in geology from the China University of Petroleum and an MS degree and a PhD degree, both in petroleum engineering, from the University of Louisiana at Lafayette and from Texas A&M University, respectively.
Siew Hiang Khor is a technical consultant with Schlumberger. She has more than 18 years of research and industry experience in flow assur-ance, production and process simulation, fluid modeling, field develop-ment, and production optimization, and has published seven technical papers. Khor holds an MEng degree (first class honors) in chemical engineering and a PhD degree from Imperial College of Science, Tech-nology and Medicine, London. She is a member of SPE and the Amer-ican Institute of Chemical Engineers, and has served as a program committee member for SPE applied technology workshops.
He Zhang, a reservoir engineer at Ryder Scott Petroleum Consultants, evaluates oil and gas reserves. He has more than 10 years of research and industry experience in reservoir and production simulation, pore/volume/temperature characterization, and petroleum economics. Zhang has published approximately 20 technical papers, and serves as an associate editor and peer reviewer for several journals. He holds BS degrees in both chemistry and computer application from the University of Science and Technology of China, and a PhD degree in petroleum en-gineering from Texas A&M University.
Ram Kinkar Thakur is a senior petroleum engineer with Schlumberger, and has more than 17 years of experience in the oil and gas industry. He has worked on numerous projects, including but not limited to, field-development planning, production operations and optimization, well completions and workover, facilities, flow assurance, and production simulation. Thakur holds a BS degree in petroleum engineering from the Indian School of Mines, Dhanbad, India. He is a member of SPE and the American Institute of Chemical Engineers.