SIMS 213: User Interface Design & Development Marti Hearst Tues, Jan 30, 2001.
date post
21-Dec-2015Category
view
217download
0
SIMS 247SIMS 247Information Visualization Information Visualization
and Presentation and Presentation
Prof. Marti HearstProf. Marti Hearst
October 5, 2000October 5, 2000

Today and Next TimeToday and Next Time• Why Text is ToughWhy Text is Tough
• Visualizing Concept SpacesVisualizing Concept Spaces– Clusters
– Category Hierarchies
• Visualizing Query SpecificationsVisualizing Query Specifications– Selecting Term Subsets
– Viewing Metadata
• Visualizing Retrieval ResultsVisualizing Retrieval Results– Term Hit Distribution
– Grouping of Retrieved Documents

Why Visualize Text?Why Visualize Text?
• To help with Information RetrievalTo help with Information Retrieval– give an overview of a collection– show user what aspects of their interests are
present in a collection– help user understand why documents
retrieved as a result of a query
• Text Data MiningText Data Mining– not much has been done in this yet
• Software EngineeringSoftware Engineering– not really text, but has some similar
properties

Why Text is ToughWhy Text is Tough
• Text is Text is notnot pre-attentive pre-attentive• Text consists of abstract conceptsText consists of abstract concepts
– which are difficult to visualize
• Text represents similar concepts in many Text represents similar concepts in many different waysdifferent ways– space ship, flying saucer, UFO, figment of imagination
• Text has very high dimensionalityText has very high dimensionality– Tens or hundreds of thousands of features– Many subsets can be combined together

Why Text is ToughWhy Text is Tough
The Dog.
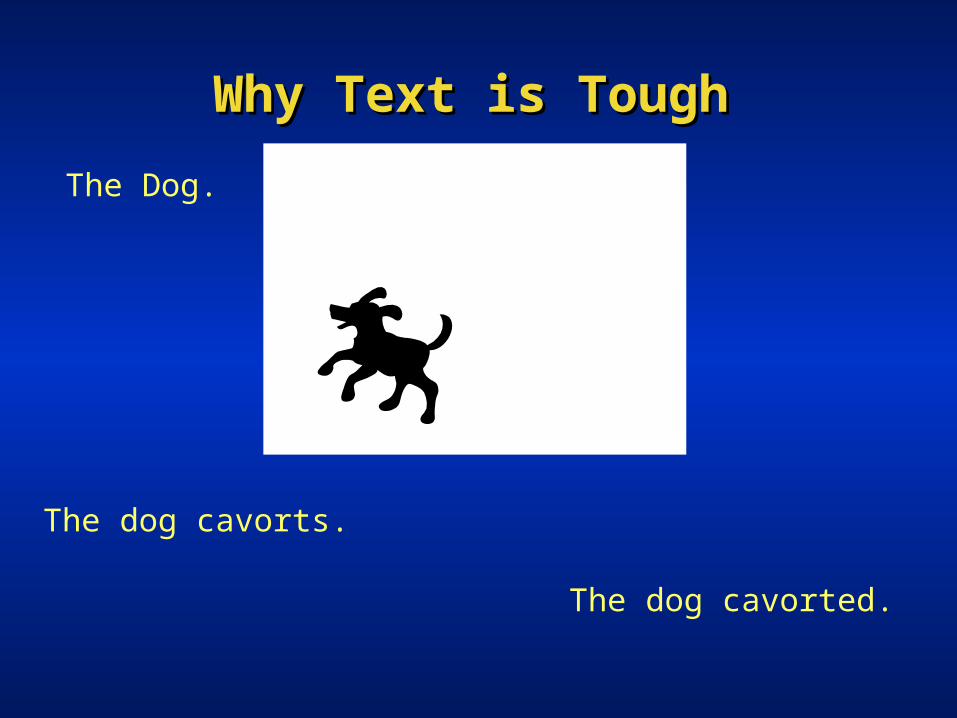
Why Text is ToughWhy Text is Tough
The Dog.
The dog cavorts.
The dog cavorted.

Why Text is ToughWhy Text is Tough
The man.
The man walks.

Why Text is ToughWhy Text is Tough
The man walks the cavorting dog.
So far, we can sort of show this in pictures.

Why Text is ToughWhy Text is Tough
As the man walks the cavorting dog, thoughtsarrive unbidden of the previous spring, so unlikethis one, in which walking was marching anddogs were baleful sentinals outside unjust halls.
How do we visualize this?
Why Text is ToughWhy Text is Tough
• Abstract concepts are difficult to Abstract concepts are difficult to visualizevisualize
• Combinations of abstract concepts Combinations of abstract concepts are even more difficult to visualizeare even more difficult to visualize– time– shades of meaning– social and psychological concepts– causal relationships

Why Text is ToughWhy Text is Tough
• Language only hints at meaningLanguage only hints at meaning• Most meaning of text lies within our Most meaning of text lies within our
minds and common understandingminds and common understanding– “How much is that doggy in the window?”
• how much: social system of barter and trade (not the size of the dog)
• “doggy” implies childlike, plaintive, probably cannot do the purchasing on their own
• “in the window” implies behind a store window, not really inside a window, requires notion of window shopping
Why Text is ToughWhy Text is Tough
• General categories have no standard General categories have no standard ordering (nominal data)ordering (nominal data)
• Categorization of documents by single Categorization of documents by single topics misses important distinctionstopics misses important distinctions
• Consider an article aboutConsider an article about– NAFTA– The effects of NAFTA on truck manufacture– The effects of NAFTA on productivity of
truck manufacture in the neighboring cities of El Paso and Juarez
Why Text is ToughWhy Text is Tough
• Other issues about languageOther issues about language– ambiguous (many different meanings
for the same words and phrases)– different combinations imply different
meanings
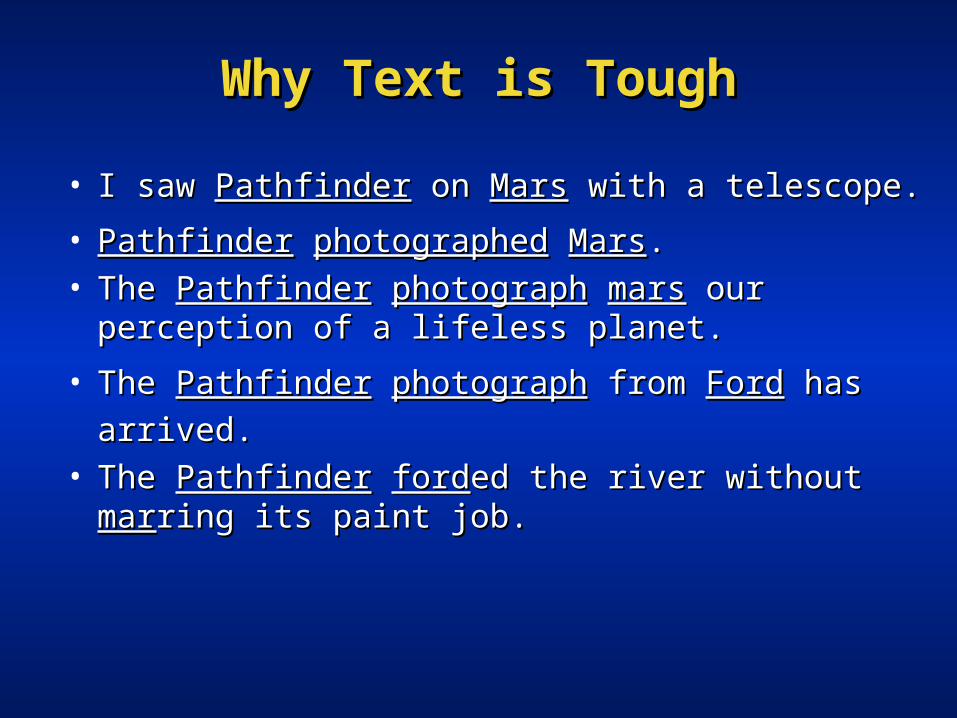
Why Text is ToughWhy Text is Tough
• I saw I saw PathfinderPathfinder on on MarsMars with a telescope. with a telescope.
• PathfinderPathfinder photographedphotographed MarsMars..• The The PathfinderPathfinder photographphotograph marsmars our our
perception of a lifeless planet.perception of a lifeless planet.
• The The PathfinderPathfinder photographphotograph from from FordFord has has
arrived.arrived.• The The PathfinderPathfinder fordforded the river without ed the river without
marmarring its paint job.ring its paint job.

Why Text is EasyWhy Text is Easy
• Text is highly redundantText is highly redundant– When you have lots of it– Pretty much any simple technique can pull
out phrases that seem to characterize a document
• Instant summary:Instant summary:– Extract the most frequent words from a text– Remove the most common English words

Guess the TextGuess the Text
• 478 said478 said• 233 god233 god• 201 father201 father• 187 land187 land• 181 jacob181 jacob• 160 son160 son• 157 joseph157 joseph• 134 abraham134 abraham• 121 earth121 earth• 119 man119 man• 118 behold118 behold• 113 years113 years• 104 wife104 wife• 101 name101 name• 94 pharaoh94 pharaoh

Text Collection OverviewsText Collection Overviews
• How can we show an overview of the How can we show an overview of the contents of a text collection?contents of a text collection?– Show info external to the docs
• e.g., date, author, source, number of inlinks• does not show what they are about
– Show the meanings or topics in the docs• a list of titles• results of clustering words or documents• organize according to categories (next time)

Clustering for Collection OverviewsClustering for Collection Overviews– Scatter/Gather
• show main themes as groups of text summaries
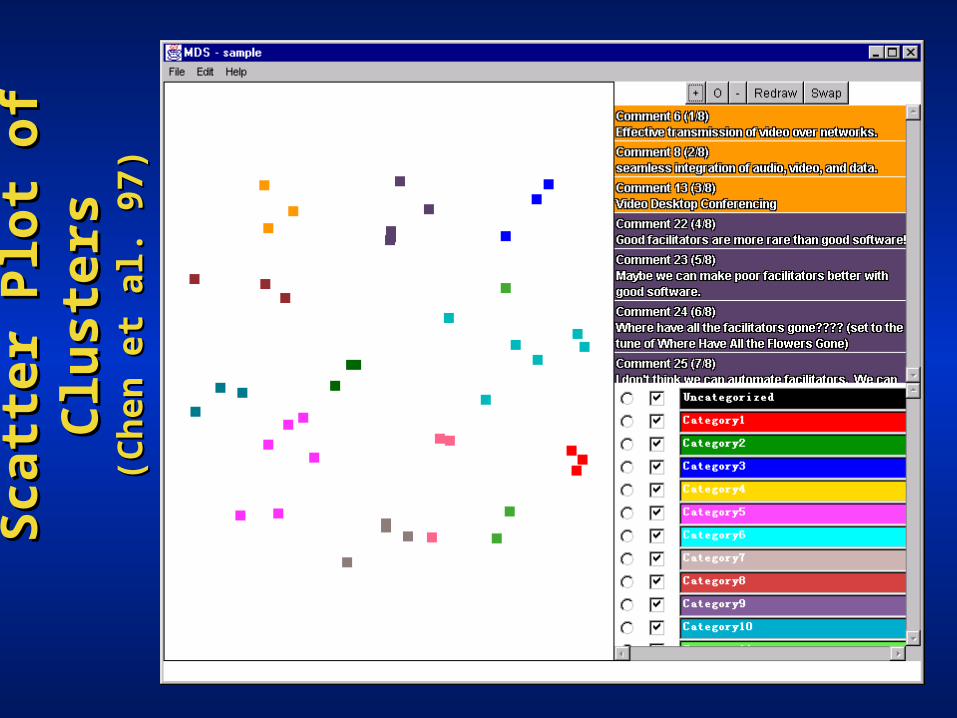
– Scatter Plots• show docs as points; closeness indicates
nearness in cluster space• show main themes of docs as visual clumps or
mountains
– Kohonen Feature maps• show main themes as adjacent polygons
– BEAD• show main themes as links within a force-
directed placement network

Clustering for Collection OverviewsClustering for Collection Overviews
• Two main stepsTwo main steps– cluster the documents according to
the words they have in common– map the cluster representation onto a
(interactive) 2D or 3D representation
Text ClusteringText Clustering
• Finds overall similarities among Finds overall similarities among groups of documentsgroups of documents
• Finds overall similarities among Finds overall similarities among groups of tokensgroups of tokens
• Picks out some themes, ignores Picks out some themes, ignores othersothers

Sca
tter
/Gat
her
Sca
tter
/Gat
her

S/G Example: query on “star”S/G Example: query on “star”
Encyclopedia textEncyclopedia text14 sports14 sports
8 symbols8 symbols 47 film, tv47 film, tv 68 film, tv (p)68 film, tv (p) 7 music 7 music97 astrophysics97 astrophysics 67 astronomy(p)67 astronomy(p) 12 steller phenomena12 steller phenomena 10 flora/fauna10 flora/fauna 49 galaxies, stars 49 galaxies, stars
29 constellations29 constellations 7 miscelleneous7 miscelleneous
Clustering and Clustering and re-clusteringre-clustering is entirely automated is entirely automated

Scatter/GatherScatter/GatherCutting, Pedersen, Tukey & Karger 92, 93, Hearst & Pedersen 95Cutting, Pedersen, Tukey & Karger 92, 93, Hearst & Pedersen 95
• How it worksHow it works– Cluster sets of documents into general “themes”, like a table of contents – Display the contents of the clusters by showing topical terms and typical titles– User chooses subsets of the clusters and re-clusters the documents within – Resulting new groups have different “themes”
• Originally used to give collection overviewOriginally used to give collection overview• Evidence suggests more appropriate for displaying retrieval results in Evidence suggests more appropriate for displaying retrieval results in
contextcontext• Appearing (sort-of) in commercial systemsAppearing (sort-of) in commercial systems

Nor
ther
n L
igh
t: u
sed
to
clu
ster
N
orth
ern
Lig
ht:
use
d t
o cl
ust
er
excl
usi
vely
. N
ow c
omb
ines
ex
clu
sive
ly.
Now
com
bin
es
cate
gori
zati
on w
ith
clu
ster
ing
cate
gori
zati
on w
ith
clu
ster
ing

Nor
ther
n L
igh
t se
con
d le
vel c
lust
ers:
N
orth
ern
Lig
ht
seco
nd
leve
l clu
ster
s:
are
thes
e re
ally
ab
out
NL
P?
are
thes
e re
ally
ab
out
NL
P?
Not
e th
at n
ext
leve
l cor
resp
ond
s to
UR
Ls
Not
e th
at n
ext
leve
l cor
resp
ond
s to
UR
Ls
Sca
tter
Plo
t of
Clu
ster
sS
catt
er P
lot
of C
lust
ers
(Ch
en e
t al
. 97)
(Ch
en e
t al
. 97)

BEAD (Chalmers 97)BEAD (Chalmers 97)
BE
AD
(C
hal
mer
s 96
)B
EA
D (
Ch
alm
ers
96)
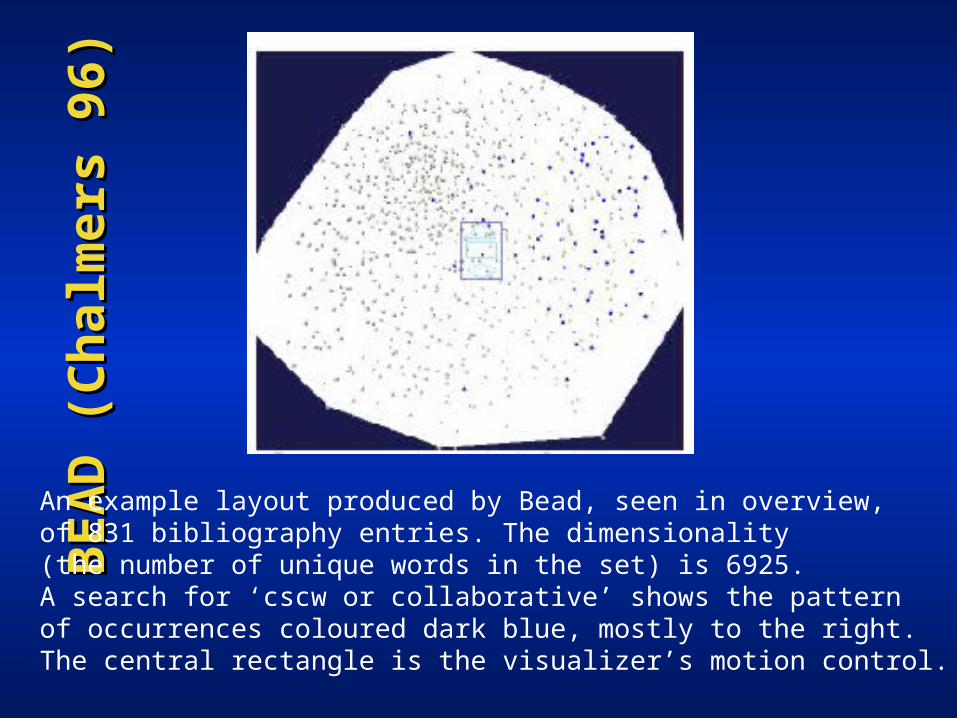
An example layout produced by Bead, seen in overview,of 831 bibliography entries. The dimensionality (the number of unique words in the set) is 6925. A search for ‘cscw or collaborative’ shows the pattern of occurrences coloured dark blue, mostly to the right. The central rectangle is the visualizer’s motion control.
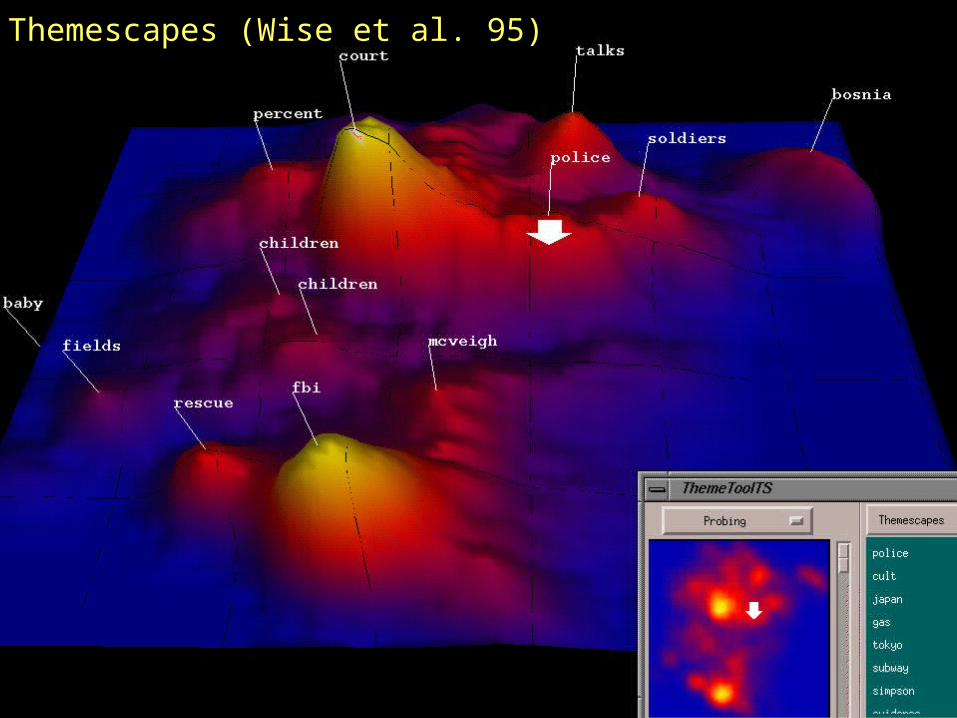
Example: ThemescapesExample: Themescapes(Wise et al. 95)(Wise et al. 95)
Themescapes (Wise et al. 95)
Clustering for Collection OverviewsClustering for Collection Overviews
• Since text has tens of thousands of Since text has tens of thousands of featuresfeatures– the mapping to 2D loses a
tremendous amount of information– only very coarse themes are detected

Galaxy of NewsRennison 95
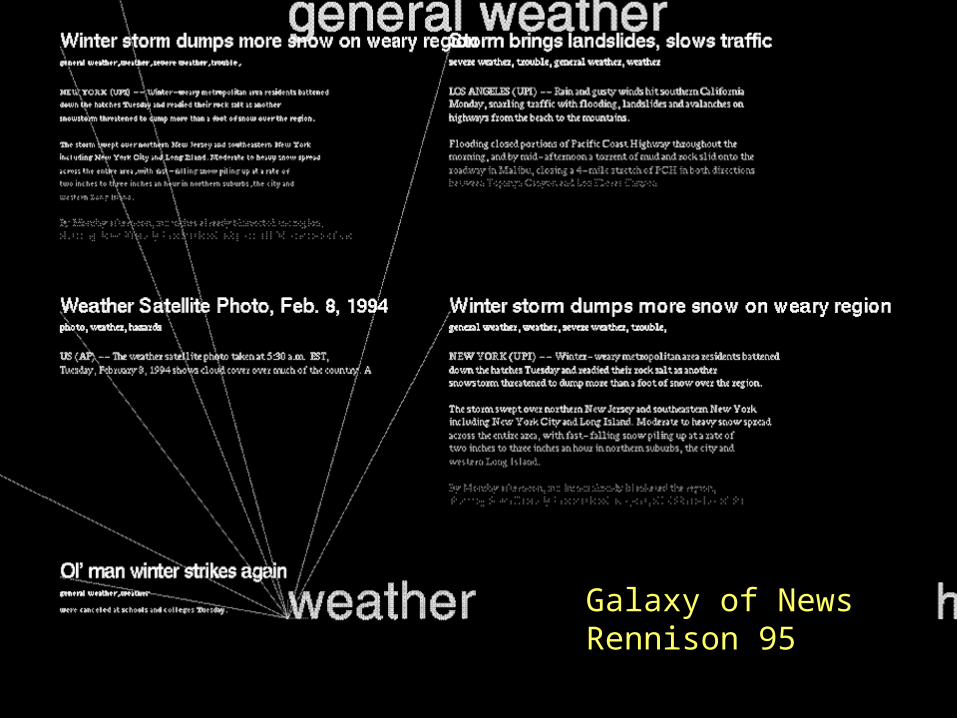
Galaxy of NewsRennison 95
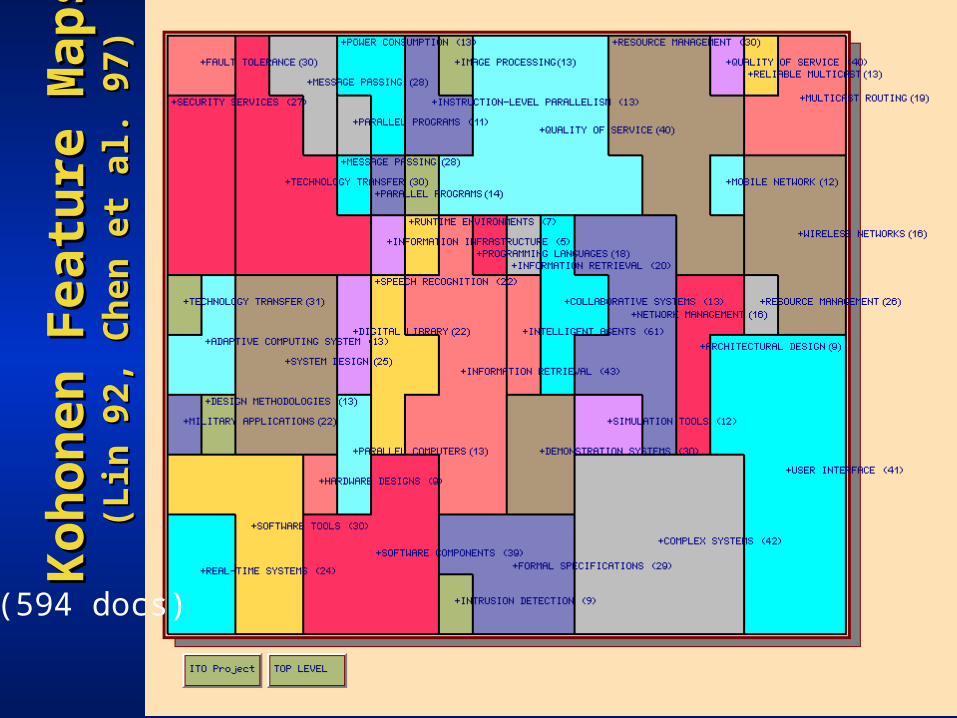
Koh
onen
Fea
ture
Map
sK
ohon
en F
eatu
re M
aps
(Lin
92,
Ch
en e
t al
. 97)
(Lin
92,
Ch
en e
t al
. 97)
(594 docs)

Study of Kohonen Feature MapsStudy of Kohonen Feature Maps
• H. Chen, A. Houston, R. Sewell, and B. H. Chen, A. Houston, R. Sewell, and B. Schatz, Schatz, JASIS 49(7)JASIS 49(7)
• Comparison: Kohonen Map and YahooComparison: Kohonen Map and Yahoo• Task:Task:
– “Window shop” for interesting home page– Repeat with other interface
• Results:Results:– Starting with map could repeat in Yahoo
(8/11)– Starting with Yahoo unable to repeat in map
(2/14)

How Useful is Collection Cluster How Useful is Collection Cluster Visualization for Search?Visualization for Search?
Three studies find negative Three studies find negative resultsresults
Study 1Study 1• Kleiboemer, Lazear, and Pedersen. Tailoring a retrieval system Kleiboemer, Lazear, and Pedersen. Tailoring a retrieval system
for naive users. In Proc. of the 5th Annual Symposium on for naive users. In Proc. of the 5th Annual Symposium on
Document Analysis and Information Retrieval,Document Analysis and Information Retrieval, 19961996
• This study comparedThis study compared– a system with 2D graphical clusters– a system with 3D graphical clusters– a system that shows textual clusters
• Novice usersNovice users• Only textual clusters were helpful (and Only textual clusters were helpful (and
they were difficult to use well)they were difficult to use well)

Study 2: Kohonen Feature MapsStudy 2: Kohonen Feature Maps
• H. Chen, A. Houston, R. Sewell, and B. Schatz, H. Chen, A. Houston, R. Sewell, and B. Schatz, JASIS 49(7)JASIS 49(7)
• Comparison: Kohonen Map and YahooComparison: Kohonen Map and Yahoo• Task:Task:
– “Window shop” for interesting home page– Repeat with other interface
• Results:Results:– Starting with map could repeat in Yahoo (8/11)– Starting with Yahoo unable to repeat in map
(2/14)

Study 2 (cont.)Study 2 (cont.)
• Participants liked:Participants liked:– Correspondence of region size to #
documents– Overview (but also wanted zoom)– Ease of jumping from one topic to
another – Multiple routes to topics– Use of category and subcategory labels

Study 2 (cont.)Study 2 (cont.)
• Participants wanted:Participants wanted:– hierarchical organization– other ordering of concepts (alphabetical)– integration of browsing and search– correspondence of color to meaning – more meaningful labels– labels at same level of abstraction– fit more labels in the given space– combined keyword and category search– multiple category assignment (sports+entertain)

Study 3: NIRVEStudy 3: NIRVE• NIRVE Interface by Cugini et al. 96. Each rectangle is a cluster. Larger clusters NIRVE Interface by Cugini et al. 96. Each rectangle is a cluster. Larger clusters
closer to the “pole”. Similar clusters near one another. Opening a cluster closer to the “pole”. Similar clusters near one another. Opening a cluster causes a projection that shows the titles.causes a projection that shows the titles.

Study 3Study 3• Visualization of search results: a comparative evaluation of text, 2D, Visualization of search results: a comparative evaluation of text, 2D,
and 3D interfaces Sebrechts, Cugini, Laskowski, Vasilakis and Miller, and 3D interfaces Sebrechts, Cugini, Laskowski, Vasilakis and Miller, Proceedings of SIGIR 99, Berkeley, CA, 1999.Proceedings of SIGIR 99, Berkeley, CA, 1999.
• This study comparedThis study compared::
– 3D graphical clusters– 2D graphical clusters– textual clusters
• 15 participants, between-subject design15 participants, between-subject design• TasksTasks
– Locate a particular document– Locate and mark a particular document– Locate a previously marked document– Locate all clusters that discuss some topic– List more frequently represented topics

Study 3Study 3• Results (time to locate targets)Results (time to locate targets)
– Text clusters fastest– 2D next– 3D last– With practice (6 sessions) 2D neared text results; 3D still slower– Computer experts were just as fast with 3D
• Certain tasks equally fast with 2D & textCertain tasks equally fast with 2D & text– Find particular cluster– Find an already-marked document
• But anything involving text (e.g., find title) much faster with But anything involving text (e.g., find title) much faster with text.text.– Spatial location rotated, so users lost context
• Helpful viz featuresHelpful viz features– Color coding (helped text too)– Relative vertical locations

Visualizing ClustersVisualizing Clusters
• Huge 2D maps may be inappropriate Huge 2D maps may be inappropriate focus for information retrieval focus for information retrieval – cannot see what the documents are about– space is difficult to browse for IR purposes– (tough to visualize abstract concepts)
• Perhaps more suited for pattern Perhaps more suited for pattern discovery and gist-like overviewsdiscovery and gist-like overviews
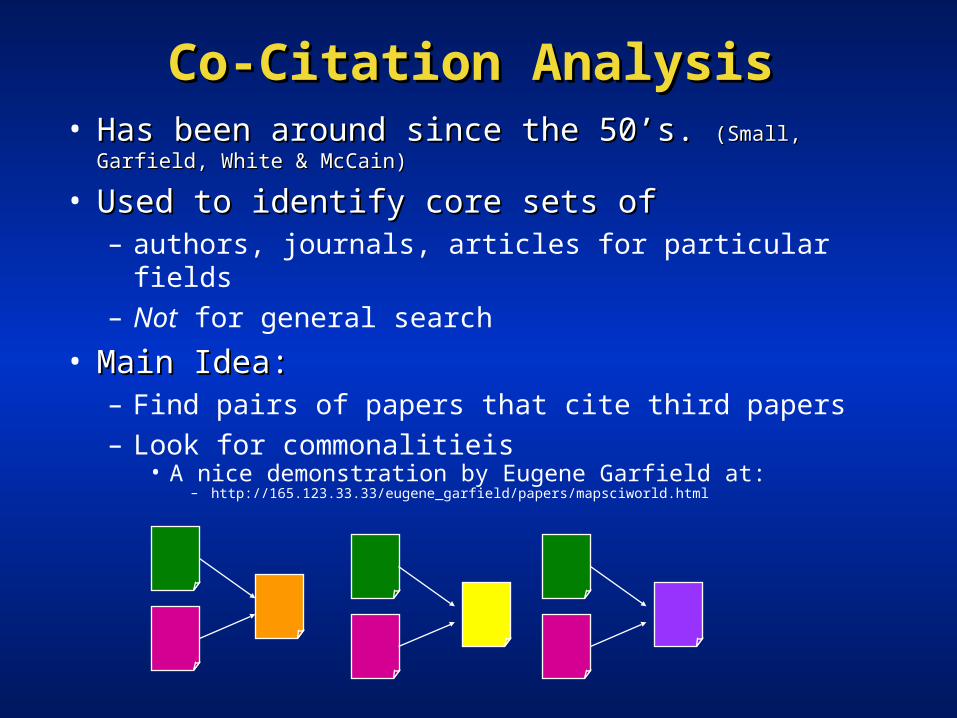
Co-Citation AnalysisCo-Citation Analysis• Has been around since the 50’s. Has been around since the 50’s. (Small, (Small,
Garfield, White & McCain)Garfield, White & McCain)
• Used to identify core sets ofUsed to identify core sets of– authors, journals, articles for particular fields – Not for general search
• Main Idea:Main Idea:– Find pairs of papers that cite third papers– Look for commonalitieis
• A nice demonstration by Eugene Garfield at: – http://165.123.33.33/eugene_garfield/papers/mapsciworld.html

Co-citation analysis Co-citation analysis (From Garfield 98)(From Garfield 98)

Co-citation analysis Co-citation analysis (From Garfield 98)(From Garfield 98)

Co-citation analysis Co-citation analysis (From Garfield 98)(From Garfield 98)
Visualizing ClustersVisualizing Clusters
• Huge 2D maps may be inappropriate Huge 2D maps may be inappropriate focus for information retrieval focus for information retrieval – cannot see what the documents are about– documents are forced into one position in
semantic space– space is difficult to browse for IR purposes
• Perhaps more suited for pattern Perhaps more suited for pattern discoverydiscovery– problem: often only one view on the space
Next TimeNext Time
• Visualizing Category OverviewsVisualizing Category Overviews• Visualizing Query Term Visualizing Query Term
SpecificationSpecification– available words– available metadata
• Visualizing Retrieval ResultsVisualizing Retrieval Results