Simple Model of Microsegregation during Solidification of...
61
Metal Process Simulation Laboratory Department of Mechanical and Industrial Engineering University of Illinois at Urbana-Champaign Urbana, IL 61801 Simple Model of Microsegregation during Solidification of Steels Young-Mok Won Brian G. Thomas Continuous Casting Consortium REPORT Submitted to Allegheny Ludlum AK Steel Columbus Stainless ISPAT Inland Steel LTV Stollberg, Inc. September 25, 2000
Transcript of Simple Model of Microsegregation during Solidification of...

Metal Process Simulation Laboratory Department of Mechanical and Industrial EngineeringUniversity of Illinois at Urbana-ChampaignUrbana, IL 61801
Simple Model of Microsegregation
during Solidification of Steels
Young-Mok WonBrian G. Thomas
Continuous Casting Consortium
REPORT
Submitted to
Allegheny LudlumAK Steel
Columbus StainlessISPAT Inland Steel
LTVStollberg, Inc.
September 25, 2000

1
Simple Model of Microsegregation
during Solidification of Steels
Young-Mok Won and Brian G. Thomas
University of Illinois at Urbana-Champaign
Department of Mechanical and Industrial Engineering
1206 W. Green Street, Urbana, IL 61801, U.S.A.
2
Abstract
A simple analytical model of microsegregation for the solidification of multicomponent steel
alloys is presented. This model is based on the Clyne-Kurz model and is extended to take into
account the effects of multiple components, columnar dendrite microstructure, coarsening and
the δ/γ transformation. A new empirical equation to predict secondary dendrite arm spacing as a
function of cooling rate and carbon content is presented based on experimental data measured by
several different researchers. The simple microsegregation model is applied to predict phase
fractions during solidification, microsegregation of solute elements, and the solidus temperature.
The predictions agree well with a range of measured data and the results of a complete finite-
difference model. The solidus temperature decreases with either increasing cooling rate or
increasing secondary dendrite arm spacing. However, the secondary dendrite arm spacing during
solidification decreases with increasing cooling rate. These two opposite effects partly cancel so
the solidus temperature does not change much during solidification of a real casting.
KEY WORDS: microsegregation; solidification; multicomponent; solute element; Clyne-Kurz
model; columnar dendrite; coarsening; δ/γ peritectic transformation; secondary dendrite arm
spacing; FDM model; steel; zero strength temperature; zero ductility temperature; cooling rate

3
I. INTRODUCTION
Solidification phenomena play a major role in such diverse operations such as casting, crystal
growth and welding. Solidification proceeds at various rates, which are sometimes far from
equilibrium. Thus, the microstructure obtained is generally not homogeneous and gives rise to
variations in composition with position at both small and large scales, which is known as
segregation.
Solute segregation is important because it leads to non-equilibrium phases, cracks, and other
problems, which lower the mechanical properties of the final product. Over the last three
decades, attention has focused on segregation of aluminum and steel alloys, owing to their great
commercial importance and susceptibility to this solidification problem. Segregation affects all
processes, including foundry, ingot and continuous casting.
Segregation is classified according to its scale as: macrosegregation and microsegregation.
Macrosegregation occurs on the scale of the grains or the entire casting and can be observed
with the naked eye. It arises from large-scale fluid flow, caused by forced, natural and solutal
convection. It requires the transport of solute-rich or -poor liquid and solid phases during
solidification over distances much larger than the dendrite arm spacing. One unavoidable cause
is the interdendritic flow of liquid due to solidification shrinkage and changes in the liquid
density. These density changes can be caused by temperature changes or by changes in the liquid
composition[1-3]. It is also affected by nozzles, which direct the liquid, electromagnetic forces,
which enhance mixing[4-6], and by thermal or mechanical bulging or deformation of the casting
during solidification[7]. Microsegregation refers to composition variation within the columnar
4
or equiaxed dendritic solidification structure, which has a length scale on the order of only a few
micrometers. Clearly, macrosegregation prediction is very complex. Among many other things,
it depends on an accurate prediction of microsegregation.
Microsegregation is caused by the redistribution of solute during solidification, as solute is
generally rejected into the liquid[8]. Its fundamental cause is the difference between the
thermodynamic equilibrium solubility of alloy elements in the different phases, which coexist in
the mushy region during solidification. This is combined with the inability of solid-state
diffusion to fully return the composition to its equilibrium constant level after solidification is
complete, owing to the short times and small diffusion coefficients involved. Quantitative
prediction of these phenomena is complicated by several difficulties:
1) quantifying the equilibrium solubility of each phase as a function of temperature. This is
traditionally done using partition coefficients, which are reasonable for low concentrations, but
requires the full multicomponent phase diagram for complex systems or higher alloy
contents[9].
2) solving for diffusion transport within the solid phases, which requires a) knowledge of the
diffusion coefficients for each element, b) the length scale, which depends on the solidifying
microstructure and varies from the secondary to the primary dendrite arm spacing to the grain
size, and c) the cooling conditions, which depend on macroscopic heat conduction in the casting.
3) linking of the microsegregation phenomena with the fluid flow and associated
macrosegregation. This is complicated because flow occurs on at least three size scales,
including flow within the interdendritic spaces, flow between grains, and flow in the bulk
liquid[10].

5
4) accounting for phase transformations such as the peritectic transformation in steel, eutectic
formation in aluminum alloys and precipitate formation.
The purpose of the present work is to develop, validate, and apply a fast and simple
microsegregation model for the solidification of multicomponent steel alloys, which can be
incorporated into other macroscopic models such as thermal-stress analysis. The solubility levels
are based on liquidus temperatures and partition coefficients taken from available measurements
for multicomponent steel alloys as are the diffusion coefficients. To obtain the microstructural
length scales, an empirical equation is developed to quantify the secondary dendrite arm spacing
as a function of carbon content and cooling rate, based on experimental measurements of the
final microstructures. This is because microstructure prediction is a very difficult task which
requires computationally intensive modeling methods such as phase field[11-16] and cellular
automata[9,17-20]. The cooling history needed by the model is planned to be calculated by a
separate model, so in the present work, the cooling rate is simply input to match experiments or
treated as a parameter. Linking of the model with flow is ignored. This simple model of
microsegregation also takes into account the effects of coarsening and the δ/γ peritectic
transformation.
To validate this simple microsegregation model, its predictions are compared with both relevant
experimental measurements by previous researchers[17,21-30] and more accurate finite
difference model calculations. Finally, the effects of cooling rate, secondary dendrite arm
spacing and steel composition on microsegregation are investigated in a parametric study.
6
II. PREVIOUS WORK
Many microsegregation models[8,10,17,18,31-38] with different assumptions and
simplifications have been developed to predict solute redistribution and related phenomena.
Numerous studies[8,31-34] on microsegregation models have been carried out for only binary
alloys. Some studies[9,10,17-20,35-38] modeled microsegregation during solidification of steels
taking into account binary[10,36], five[17-20] or more[9,37,38] solute elements and the
peritectic reaction.
The heart of most simple microsegregation models is the assumed relationship between alloy
concentration and solid fraction. This relationship can be evaluated to generate the one-
dimensional composition profile between adjacent dendrite arms. These different relationships
are now discussed, in order of increasing complexity.
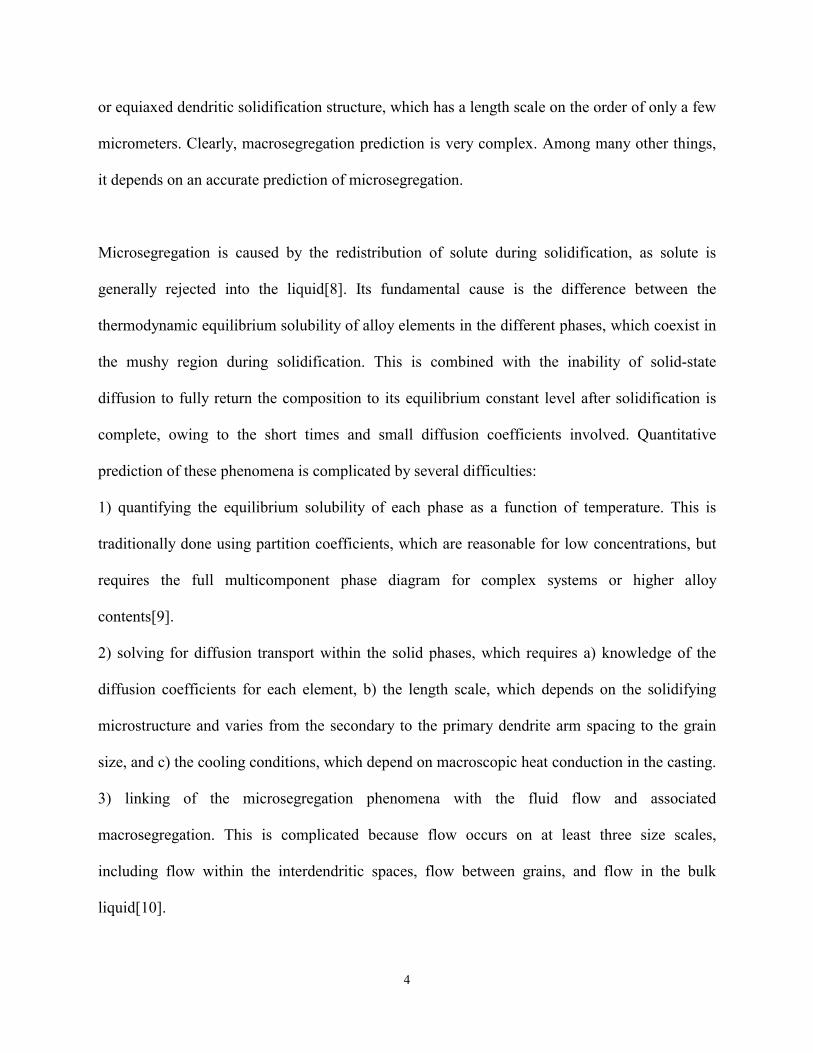
The Lever rule model is an equilibrium solidification model, which assumes complete diffusion
to equilibrium of all alloying elements in both the liquid and the solid phases as follows:
1)1(,
, +−=
iS
ioiL kf
CC (1)
where CL,i is the liquid concentration of a given solute element at the solid-liquid interface, Co,i
is the initial liquid concentration, ki is the equilibrium partition coefficient for that element and fS
is the solid fraction. The Lever rule model is usually inaccurate later during solidification,
7
because diffusion in the solid phases is too slow, especially for larger solute atoms such as
manganese.
The opposite limiting case to the Lever rule model is the Scheil equation[31] or the “non-
equilibrium Lever rule”. This model assumes no diffusion in the solid phase, complete diffusion
in the liquid phase and local equilibrium at the solid-liquid interface as follows.
1,, )1( −−= k
SioiL fCC (2)
However, it is apparent that the Scheil equation does not adequately estimate the final solute
concentration, because CL becomes infinite at fS = 1. This model is only useful for very rapid
solidification processes, such as laser welding where the cooling rates exceed 102 oC/sec[21].
In order to predict microsegregation during steel solidification, finite non-zero diffusion must be
considered at least in the solid phase. Many simple microsegregation models[32-34] have been
proposed, which assume fixed dendrite arm spacing, constant physical properties in the solid
phase, thermodynamic equilibrium at the solid-liquid interface, and straight liquidus or/and
solidus lines in the equilibrium phase diagram[39-43]. Brody and Flemings[32] have proposed a
general form of this model which assumes complete diffusion in the liquid phase and incomplete
back-diffusion in the solid phase as follows
[ ] )1/()1(,, )1(1 ii kk
SiioiL fkCC β−−β−−= (3)

8
This general form introduces β as a back-diffusion parameter, which has been quantified by
many researchers[32-34] in different ways. In the original Brody-Flemings model for a plate
dendrite[32],
β = 2α (4)
where α is a Fourier number.
α =DS t f
X2 (5)
where DS is the solute diffusion coefficient in the solid phase, tf is the local solidification time,
and X is the length scale of the microsegregation domain, usually taken to equal half of the
secondary dendrite arm spacing, λSDAS,
X =λSDAS
2 (6)
Eqs. (3) to (6) are solved assuming the known tf history to predict CL and related microstructure
parameters[32]. The Brody-Flemings model simplifies to the Scheil equation in Eq. (2) when DS
approaches zero (β = 0). On the other hand, when diffusion in the solid phase is infinitely fast,
this model should logically simplify to the other extreme: the Lever rule, Eq. (1), which
corresponds to β = 1. Clearly the model with Eq. (4) is not physically reasonable when α is large
and β exceeds 1, because it does not even conserve mass.

9
To satisfy this requirement, Ohnaka[33] presented a simple modification of β to replace Eq. (4).
It is based on comparison with approximate solutions of the diffusion equation for the plate
dendrite, assuming a quadratic solute profile in the solid.
β =2α
1 + 2α (7)
A further modification was proposed[33] to account for coarsening and irregular shaped
microstructures, such as columnar dendrites, by doubling α as follows.
β =4α
1 + 4α (8)
Ohnaka has compared concentration predictions using Eqs. (3) and (8) with other approximate
solutions, and showed that his model agreed better with experimental data of Matsumiya et
al.[17] than did predictions with Eq. (4). However, Voller et al.[8] pointed out that the
performance of this model under constant cooling conditions is significantly better than its
performance under parabolic cooling conditions.
A different modification to ensure physical reasonability in the Brody-Flemings model (0 < β <
1) was proposed by Clyne and Kurz[34] by replacing Eq. (4) as follows.
β = 2α 1 − exp −1α
� �
� �
� � �
�
− exp −1
2α� �
� �
(9)

10
However, Ohnaka[33] and Matsumiya et al.[17] criticized this model for its lack of physical
basis for intermediate values of β.
Although all of the above equations for microsegregation are semi-empirical, they are simple
analytical models that can be very useful if applied with caution. Among them, the Clyne-Kurz
model is the most popular[33]. Kobayashi[35] obtained an exact analytical solution for
microsegregation, assuming complete diffusion in the liquid phase, incomplete back-diffusion in
the solid phase, constant partition coefficient, constant diffusion coefficient and a parabolic
solidification rate. Its predictive performance is better than the above analytical models[35],
particularly if the partition coefficient, k, and Fourier number, α, are small. But, this analytical
solution has the disadvantage that all physical properties must be assumed to be constant, and
that the solidification time must be known accurately.
Matsumiya et al.[17] solved for interdendritic microsegregation using a 1-D finite-difference
numerical method, taking into account the diffusion of solute in both the liquid and the solid
phases, and hexagonal morphologies to approximate the dendrites. Battle et al.[36] developed a
similar numerical model for plate dendrites and included the equation of Kurz et al.[44] for
isothermal coarsening of the dendrite arms. The approach of Matsumiya et al. has been
developed further to consider the δ/γ transformation which occurs during solidification of
steels[18]. Wang et al.[10] developed a unified solute diffusion model for columnar and
equiaxed dendritic alloy solidification, in which nucleation, growth kinetics and dendrite
morphology are taken into account. Miettinen[9,37,38] developed models and data for

11
thermodynamic phase equilibria and diffusion for solidification of low-alloy steels and stainless
steels. The predicted thermophysical properties from the melting temperature down to room
temperature, including solidus temperatures, solute microsegregation and ferrite contents, agree
well with experimental measurements[37]. These models have been implemented into the
commercial packages Thermocalc[45], IDS[9] and MAGMA[46]. Unfortunately, these models
take longer to compute the solute distribution profile or to couple with other models, so there is
still a use for accurate simpler models.
Voller et al.[8] proposed that the effect of coarsening can be accounted for in 1-D
microsegregation models by adding an additional term to the Fourier number as follows.
α+ = α + αC (10)
This enhancement to the Fourier number accounts for the extra back-diffusion that would occur
considering the smaller arm spacing that actually exists during solidification before coarsening.
Voller et al.[8] showed that, across a wide range of cooling conditions, this model is able to
match full coarsening model results by simply adopting a constant value of αC = 0.1. They
explained that coarsening could be included in any microsegregation model by simply replacing
the Fourier number α with the parameter α+.
III. SIMPLE MICROSEGREGATION MODEL

12
The present simple microsegregation model developed in this work solves Eqs. (3), (5) and (6)
based on evaluating the Clyne-Kurz model for each solute element modified as suggested by
Ohnaka[33] to extend the model from plate to columnar dendrites and as suggested by Voller et
al.[8] to account for coarsening as follows:
1.0and)(2where,2
1exp1exp12 C =αα+α=α��
���
�
α−−�
�
�
���
���
�
α−−α=β +
+++ C (11)
This simple semi-empirical analytical model assumes:
1) Complete diffusion in the liquid phase.
2) Local equilibrium at the solid-liquid interface.
3) The equilibrium partition coefficient of solute elements applies at the solid-liquid
interface and is constant throughout solidification.
4) Nucleation undercooling effects are negligible.
5) Fluid flow effects are negligible.
A. Secondary Dendrite Arm Spacing Model
In the present model, the length scale in Eq. (6) is the final secondary dendrite arm spacing,
λSDAS, which varies with cooling conditions and alloy composition. Using λSDAS measured by
several different researchers[47-51] at various cooling rates and steel carbon contents, an
empirical relationship was obtained by a best fit as follows,

13
CC
CR
CRC
CCC
CCCC <⋅⋅=
≤<⋅⋅−=µλ⋅−−
−
15.0for9.143
15.00for)9.7201.169()m()%996.15501.0(3616.0
4935.0SDAS (12)
where CR is the cooling rate (oC/sec) and CC is the carbon content (wt%C). Figure 1 compares
the predicted and measured λSDAS as a function of carbon content at various cooling rates. The
λSDAS decreases steeply with increasing carbon content from zero to its minimum value at
0.15wt%C, and then increases with increasing carbon content until about 0.6wt%C. From
0.6wt%C to 1.0wt%C, λSDAS reduces again with increasing carbon content. This complicated
variation of λSDAS with carbon content has been noted by other investigators[47,52,53]. El-Bealy
et al.[52] suggested that this is because different solidification modes control the evolution of
structure. Jacobi et al.[47] reported that λSDAS decreases with increasing carbon content during
primary solidification of δ-ferrite. When solidification starts with γ-phase, the effect of carbon
content is not clear, because only two such alloys (0.59 and 1.48wt%C) were studied. It appears
that λSDAS decreases with increasing cooling rate for all steels, as shown in Fig. 1. At various
cooling rates and carbon contents, the λSDAS values predicted with Eq. (12) are in reasonable
agreement with the previous experimentally measured data[47-51].
B. Multicomponent Alloy Effect
In order to extend the model to multicomponent alloys, the effects of all individual components
are summed. Mutual interaction effects between the alloying components on microsegregation
are neglected. For each component, microsegregation is computed according to Eqs. (3), (5), (6)

14
and (11), using the individual values for the partition coefficient k and diffusion coefficient DS.
The liquidus temperature, Tliq, depends on steel composition as follows[39],
Tliq(
o C) = Tpure − mii� ⋅Co,i (13)
where Tpure is the melting point of pure iron (1536 oC) and mi is the slope of the liquidus line of
each solute element in the pseudo-binary Fe phase diagram, given in Table I[39]. The
temperature which corresponds to a given interface composition in the liquid, CL,i, is found by
summing the contributions of all alloying elements (indicated by subscript i) :
T (oC) = Tpure − mi
i� ⋅ CL,i (14)
where ki is the equilibrium partition coefficient of each solute element given in Table I and CL,i
depends on fS according to Eqs. (3), (5), (6) and (11). The solidus temperature is given when fS =
1.0. The equilibrium solidus temperature can be calculated using the Lever rule, Eqs. (1) and
(14).
C. Peritectic Phase Transformation Effect
In the equilibrium Fe-C phase diagram, two solid phases occur naturally: the δ-ferrite phase and
the γ-austenite phase. For carbon contents lower than 0.53wt%, when the melt cools down
slightly below the liquidus temperature, solid nucleates and grows as δ-phase, until solidification

15
is complete (low carbon content) or until the peritectic temperature is reached (middle carbon
content). At the peritectic temperature, solid γ-phase starts to form around the periphery of the δ-
phase dendrites, where the carbon content is higher. For carbon contents over 0.53wt%, the solid
nucleates from the melt as γ-phase, which grows until the end of solidification. These behaviors
have important consequences on the metal properties which control microsegregation, as shown
in Table I. The equilibrium partition coefficients, diffusion coefficients, and liquidus line slopes
of the solute elements depend greatly on the phase, according to measurements[40,41] and
extrapolations[39,42,43] from the Fe-X (X = C, Si, Mn, P and S) binary system. The enrichment
of solute elements in the interdendritic region during solidification causes a switch from δ-phase
to γ-phase solidification once the carbon concentration exceeds 0.53wt%C. This change
suddenly lowers the diffusion rates, which increases microsegregation and further lowers the
solidus temperature.
In order to incorporate the δ/γ transformation into the present model, the starting temperature,
Tstartδ / γ , and the ending temperature, Tend
δ / γ , of the δ/γ transformation are needed. The δ/γ
transformation is assumed to start when the solid-liquid interface temperature in Eq. (14) equals
the peritectic temperature, TAr4, found using the partition coefficients and diffusion coefficient of
the δ-phase, according to
Tstart
δ / γ(o C) = TAr 4 = Tpureδ / γ − ni ⋅ki
δ / L ⋅ CL,iδ
i� (15)

16
where Tpureδ / γ is the temperature of the δ/γ transformation of pure iron (1392 oC), ni is the slope of
the TAr4 line of each solute element in its pseudo-binary Fe phase diagram, given in Table I [42],
kiδ/ L is the equilibrium partition coefficient of each solute element i of the δ-phase and δ
iLC , is
the concentration of each solute element i in the δ-phase at the solid-liquid interface.
The peritectic transformation is assumed to be controlled only by carbon concentration at the
solid-liquid interface. The δ/γ transformation is assumed to be complete when the carbon
concentration at the liquid-solid interface becomes equal to 0.53wt%C, based on Eqs. (3), (5),
(6) and (11) with the diffusion, Diδ , and partition coefficients, ki
γ / L , of the γ-phase. The
corresponding carbon concentration in the solid phase is the triplepoint of the peritectic reaction
in the equilibrium Fe-C binary phase diagram[54].
The δ fraction of the solid phase is assumed to decrease parabollically from 1 at the start of the
δ/γ transformation to zero at the end, according to
δ fS =fend
δ / γ − fS
fendδ / γ − fstart
δ / γ
� � � �
� �
2
⋅ fS (16)
When the temperature is above TAr4 (i.e. before the δ/γ transformation), the solid fraction is
entirely δ-phase (fS = δfS). After the δ/γ transformation is complete, δfS is zero. The remainder of
the solid fraction is naturally γ-phase.

17
γ fS = fS −δfS (17)
Eqs. (16) and (17) are needed to evaluate the average liquid concentrations, CL,iave , needed in Eq.
(14).
CL,iave =
δ fS
fS
⋅ CL,iδ +
γ fS
fS
⋅ CL,iγ (18)
This equation is needed to evaluate Eq. (14), when both δ- and γ-phases are present.
D. Cooling History Effect
The local solidification time, tf, needed in Eq. (5) is found from the cooling history. For the
constant cooling rate assumed in the present work, this simplifies to:
t f =Tliq − Tsol
CR
(19)
A first estimate of the local solidification time is chosen by evaluating the equilibrium liquidus
and solidus temperatures from Eq. (13), and the Lever rule, Eqs. (1) and (14), respectively. From
this initial guess, the value of Tsol is improved with a few iterative steps through Eqs. (12), (6),
(19), (5), (11), (3), and (14) until consistent values are found for CL,i, fS and T (e.g. fS = 1 at Tsol).
If Eq. (15) indicates that two-phase conditions are present, then Eqs. (16)-(18) are used to

18
transform separate sets of iLC , values for the γ and δ-phases from the results of Eq. (13) to find
the single set of CL,iave values needed in Eq. (14). In practice, it is often desirable to find the entire
solid fraction and temperature relationship. Thus, it is convenient to solve these equations
simply by trial and error by systematically incrementing the solid fraction from 0 to 1 in steps of
0.001.
IV. FINITE DIFFERENCE MODEL
In order to help validate the present simple model, the one-dimensional direct finite difference
model based on that of Ueshima et al.[18] was developed and implemented to track the liquid
fraction, δ-phase solid fraction, δfS, and γ-phase solid fraction, γfS, in the mushy zone as a
function of temperature and to calculate solute redistribution. This model solves the following
diffusion equations in a hexagonal domain chosen to approximate the morphology of columnar
dendrites as shown in Figure 2.
∂CS ,i
∂t=
∂∂x
DS,i(T )∂CS ,i
∂x� � � �
� (20)
Complete mixing of solute elements in the liquid phase and local equilibrium at the liquid/δ,
liquid/γ and δ/γ interfaces are assumed. Diffusion of solute along the axial direction of the
dendrite is assumed to be negligible. Thus, the model ignores macrosegregation due to fluid
flow. As for the simple model, the equilibrium partition coefficients, diffusion coefficients and
the slope of the liquidus line of the solute elements are given in Table I. The secondary dendrite

19
arm spacing used in this study is given in Eq. (12) as functions of cooling rate and carbon
content. The calculation was made by dividing the triangular transverse cross section into 100
thin nodal areas as shown in Figure 3. Initial and boundary conditions are:
I. C. CS,i = kS / L ⋅Co,i at t = 0
B.C.∂CS ,i
∂x= 0 at x = 0, λ SDAS / 2
(21)
When the liquidus temperature, Tliq, and the δ/γ transformation temperature, TAr4, become equal
to the actual temperature of a given nodal area, the solidification and δ/γ transformation in that
area are assumed to be complete and the interfaces move to the adjacent area. Tliq and TAr4 are
calculated using Eqs. (13) and (15), respectively. Further information on this model is presented
elsewhere[17-20].
V. MODEL VALIDATION
To assess the validity of the present models, the microsegregation predictions were compared
with previous microsegregation results in three different systems where measurements and/or
numerical solutions were available.
A. Eutectic Formation in Aluminum Alloys
The first test is for an aluminum alloy with 4.9%Cu where final eutectic volume fraction was
measured[21,55]. A eutectic fraction prediction is readily obtained from Eqs. (3), (5), (6) and
20
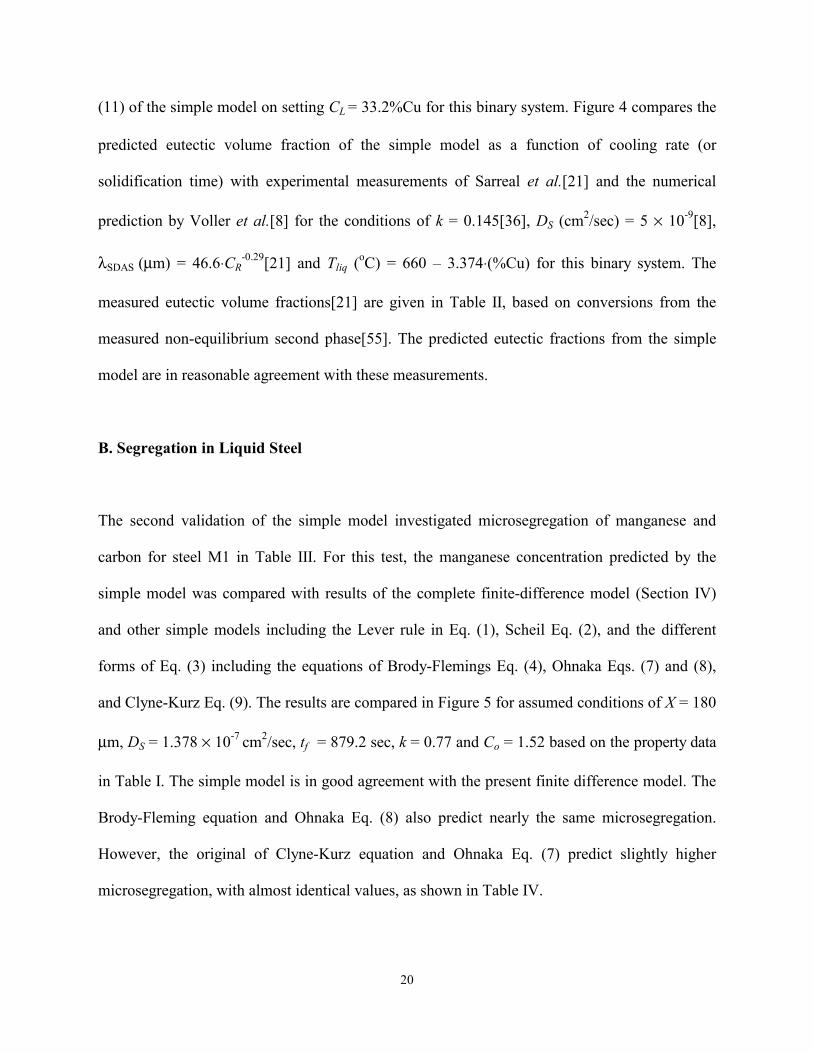
(11) of the simple model on setting CL = 33.2%Cu for this binary system. Figure 4 compares the
predicted eutectic volume fraction of the simple model as a function of cooling rate (or
solidification time) with experimental measurements of Sarreal et al.[21] and the numerical
prediction by Voller et al.[8] for the conditions of k = 0.145[36], DS (cm2/sec) = 5 × 10⁻⁹[8],
λSDAS (µm) = 46.6⋅CR-0.29[21] and Tliq (oC) = 660 – 3.374⋅(%Cu) for this binary system. The
measured eutectic volume fractions[21] are given in Table II, based on conversions from the
measured non-equilibrium second phase[55]. The predicted eutectic fractions from the simple
model are in reasonable agreement with these measurements.
B. Segregation in Liquid Steel
The second validation of the simple model investigated microsegregation of manganese and
carbon for steel M1 in Table III. For this test, the manganese concentration predicted by the
simple model was compared with results of the complete finite-difference model (Section IV)
and other simple models including the Lever rule in Eq. (1), Scheil Eq. (2), and the different
forms of Eq. (3) including the equations of Brody-Flemings Eq. (4), Ohnaka Eqs. (7) and (8),
and Clyne-Kurz Eq. (9). The results are compared in Figure 5 for assumed conditions of X = 180
µm, DS = 1.378 × 10⁻⁷ cm2/sec, tf = 879.2 sec, k = 0.77 and Co = 1.52 based on the property data
in Table I. The simple model is in good agreement with the present finite difference model. The
Brody-Fleming equation and Ohnaka Eq. (8) also predict nearly the same microsegregation.
However, the original of Clyne-Kurz equation and Ohnaka Eq. (7) predict slightly higher
microsegregation, with almost identical values, as shown in Table IV.

21
Figure 6 compares the changes of the carbon concentration in the liquid phase at the solid-liquid
interface. For the conditions of X = 180 µm, DS = 7.263 × 10⁻⁶ cm2/sec, tf = 168.3 sec, k = 0.19
and Co = 0.13, all equations except the Scheil and Brody-Fleming equations, predict almost the
same microsegregation. As Clyne and Kurz[34] explained, when α is large, the Brody-Flemings
equation predicts less enrichment in the liquid phase than does the Lever rule, so is physically
unreasonable. The Scheil equation naturally over predicts the enrichment. The other models
predict similar large β values, so their liquid concentration predictions are similar, as shown in
Table IV. Even the Lever rule (β = 1) is quite reasonable, as carbon diffusion is almost complete
for the large value of α in this problem (3.773). In summary, the liquid concentrations of the
present simple model agree well for a wide range of α, as shown in Figs. 4, 5 and 6.
For the next validation test, model predictions are compared with the experimental
measurements by Matsumiya et al.[17] for steel M1, which was solidified unidirectionally and
quenched with a columnar structure at two different cooling rates. The measured primary
dendrite arm spacing was 360 µm at cooling rates of 0.045 and 0.25 oC/sec. The secondary
dendrite arm spacing was 100 µm at 0.25 oC/sec. But, at 0.045 oC/sec, the dendrites in the
microstructure did not exhibit clear patterns for secondary dendrite arm spacing. Although it is
not exactly clear, the measurement appears to be some average of the solute concentration in the
quenched region, including both interdendritic primary arm and interdendritic secondary arm
material. Accordingly, calculations were performed with both microsegregation models for the
primary arm spacing of 360 µm at 0.045 oC/sec, and for the secondary arm spacing of 100 µm at
0.25 oC/sec. Calculations were also performed using the secondary dendrite arm spacing
obtained from Eq. (12).

22
Figure 7 compares the calculated manganese and phosphorus concentrations in the liquid phase
at the solid-liquid interface. All calculations fall between the experimental measurements for
both cooling rates, as shown in Fig. 7. The results using spacings from Eq. (12), are almost
identical for both cooling rates as for 0.045 oC/sec with the primary dendrite arm spacing of 360
µm. This is because the parameter tf / X2 is about the same, as shown in Table V. The relative
accuracy of all of these similar predictions could not be resolved within the experimental
uncertainly.
C. Solidification Temperatures of Steel
The final three validation tests focus on the non-equilibrium 75%-solid and solidus temperatures
for three different steel systems at three different cooling rates. These two solid fractions are
chosen because they are believed[20] to correlate with the sudden mechanical property changes
observed during high temperature tensile tests with in-situ melting[22-26]. Specifically, these
measurements have identified a zero strength temperature (ZST) and a zero ductility temperature
(ZDT). Above ZST, solidifying steel has no strength and no ductility, and behaves as a liquid. At
temperatures between ZST and ZDT, the steel has no ductility, but does have some strength due
to the mechanical network between dendrites. As long as some liquid remains, the steel fails in a
brittle manner due to rapid strain concentration and failure of the interdendritic liquid film.
Below ZDT, the solidifying steel behaves as a solid with both strength and ductility.

23
The ZDT should, theoretically, be found at the non-equilibrium solidus temperature, where the
solid fraction fS approaches 1. Won et al.[20] reported that the critical solid fraction at zero
strength temperature corresponds to 0.75, based on a statistical assessment of microsegregation
measurements and a finite difference model at various carbon contents and cooling rates.
Non-equilibrium pseudo Fe-C phase diagrams are calculated using both the simple model and
the present finite difference model, and are compared with ZST and ZDT measurements[22-24]
in Figures 8, 9 and 10. The experiments were performed by melting steel samples in a quartz
tube and conducting tensile tests on the solidifying steel using a Gleeble system. For the
calculations, the length scale was calculated using λSDAS from Eq. (12) and the steel
compositions are given in Table III.
The non-equilibrium phase diagram in Figure 8 is calculated for steel S1 and compared with the
ZST and ZDT measurements of Shin et al.[22] at a cooling rate of 0.17 oC/sec and a strain rate
of 0.01 sec-1. The calculated ZDT is only 1.24 ~ 4.24 oC below the equilibrium solidus
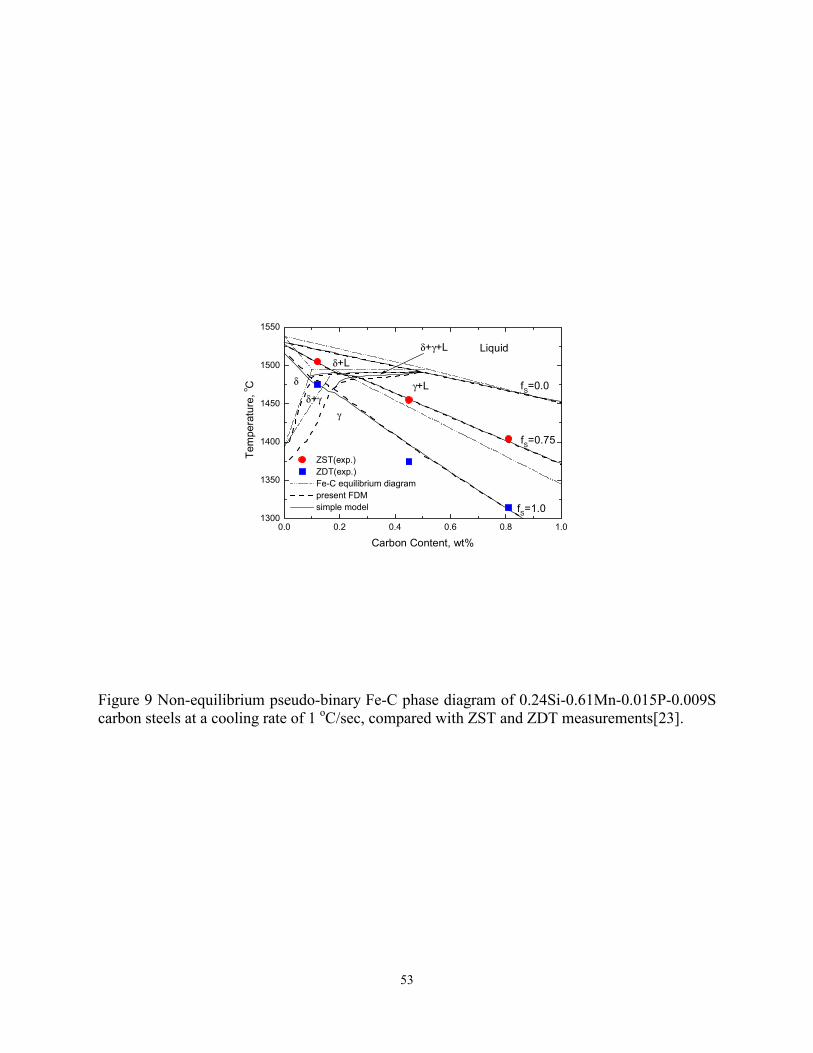
temperature, as shown in Table VI. Figure 9 is based on steel S2 for the ZST and ZDT
measurements of Seol et al.[23] at 1.0 oC/sec and 0.01 sec-1. The calculated undercooling of
ZDT below the equilibrium solidus temperature increases from 2.65 to 17.25 oC with increasing
carbon content. Figure 10 is based on steel S3 and compared with the measurements of
Schmidtmann et al.[24] at 10 oC/sec and 0.2 sec-1. The calculated undercooling of ZDT
increases from 3.73 to 31.09 oC with increasing carbon content, as shown in Table VI.
24
The extent of segregation-related undercooling of the final solidification temperature (ZDT)
increases both with increasing carbon content and with increasing the alloy content from steel S1
(Fig. 8) to S2 (Fig. 9) to S3 (Fig. 10). Increasing carbon content extends the mushy zone. More
importantly, the liquid concentration can exceed 0.53%C more easily, so γ-phase is more likely
to form during solidification. For carbon contents less than about 0.1wt%, the δ/γ transformation
takes place after solidification, so segregation undercooling is small. With greater carbon
contents, some γ-phase forms during solidification. Diffusion through the closer-packed
austenite structure is slower, so microsegregation increases and depresses the solidus
temperature further below equilibrium. In particular, the segregation of S and P becomes
increasingly important with increasing freezing range and austenite fraction. This is because
these elements also have very low partition coefficients, which are even smaller for γ-phase than
for δ-phase. Finally, the increasing depression of the solidus temperature from steels S1 to S2 to
S3 is also caused in part by the increasing cooling rate for these three case studies.
In all three figures 8 to 10, the measured ZST and ZDT data roughly agree with the calculated
temperatures at which the solid fraction becomes 0.75 and 1.0, respectively. The results of the
simple model also agree with those of the finite difference model. The slight discrepancy for 0.1
~ 0.2wt%C steels is because the simple model does not account for the diffusion between solid
phases that affects the peritectic reaction. Even so, the calculated starting temperature, Tstartδ / γ , and
ending temperature, Tendδ / γ , of the δ/γ transformation roughly agree between the two models.
Figure 11 compares predictions of the simple microsegregation model with experimentally
measured liquidus[27-30], solidus[27-30], peritectic temperatures[27-29], ZST[22-24,26] and
25
ZDT[22-26]. The liquidus, solidus and peritectic temperatures were obtained by differential
thermal analysis (DTA) at a range of slow cooling rates [27-30]. All calculations are in
reasonable agreement with the measurements, although there is more scatter in the solidus
temperature predictions. The ZST and ZDT measurements[22-26] agree well, as discussed
previously. In summary, these test results show that the proposed simple microsegregation
model can reasonably simulate a range of solidification phenomena, especially for steel.
D. Discussion
The solidus temperature measured by DTA is generally greater than the measured ZDT for the
same conditions, especially for high carbon content. This is because the DTA measurement has
difficulty detecting the solidification of the last few percent of liquid[56] which is found
segregated at the grain boundaries and governs ZDT. The present model assumes these two
temperatures are the same, and better predicts the ZDT, so solidus temperatures are naturally
underestimated in high carbon steels, as shown in Fig. 11. The model thus appears to empirically
incorporate both interdendritic and grain boundary segregation. A more sophisticated model
might simulate both interdendritic microsegregation and macrosegregation at the grain size scale
to account for the differences between grain boundary and interdendritic liquid. Such a model
could resolve the apparent discrepancy by matching both measurements. Further research is
needed with both modeling and measurements in order to quantify the behavior of alloys in steel
during the final stages of solidification.
VI. EFFECTS OF COOLING RATE AND SECONDARY DENDRITE ARM SPACING
26
The present simple microsegregation model was next applied to investigate the effects of
cooling rate and secondary dendrite arm spacing on microsegregation for three steel
compositions of 0.044, 0.18 and 0.8wt%C with 0.34%Si-1.52%Mn-0.012%P-0.015%S (i.e.
based on steel S3 in Table III). To isolate the effect of cooling rate alone on microsegregation,
the secondary dendrite arm spacings are first assumed to be constants of 44.1, 45.1 and 79.0 µm
for carbon contents of 0.044, 0.18 and 0.8wt%C, respectively. Figure 12 shows the phase
fraction results calculated with the present model as a function of temperature. The calculated
non-equilibrium solidus temperature for all three steels decreases with increasing cooling rate
from 1 to 100 oC/sec. The extent of the decrease increases from 3 to 74 oC for alloy content
increasing from 0.044 to 0.8wt%C.
To isolate the effect of length scale alone on microsegregation, the cooling rate is fixed at 10
oC/sec for three different secondary dendrite arm spacings. Figure 13 shows the evolution of the
phase fractions for the various spacings and steel compositions. The calculated non-equilibrium
solidus temperature decreases slightly with increasing secondary dendrite arm spacing. The
extent of the decrease increases from 12 to 50 oC for alloy content increasing from 0.044 to
0.8wt%C.
The solidus temperature has just been shown to decrease with both increasing cooling rate and
increasing secondary dendrite arm spacing. In real casting processes, the secondary dendrite arm
spacing itself evolves during solidification, specifically decreasing with increasing cooling rate.
In the surface region, the secondary dendrite arm spacing is small, because the cooling rate is

27
high due to the large heat extraction. In the interior, the secondary arm spacing is larger due to
the slower cooling rate. Thus, the two opposite effects should partially cancel in a real casting.
In order to investigate the combined effects of cooling rate and secondary dendrite arm spacing,
calculations were performed with both microsegregation models at the three cooling rates of 1,
10 and 100 oC/sec using the secondary dendrite arm spacing obtained from Eq. (12). Figure 14
shows the evolution of the phase fractions as a function of temperature for the conditions given
in Table VII. As expected, the phase fractions calculated at 1 oC/sec are nearly the same as those
at 100 oC/sec, because the secondary dendrite arm spacing decrease with increasing cooling rate.
This shows that decrease in solidus temperature caused by increasing cooling rate is almost
cancelled by the increase in solidus temperature accompanying the closer secondary dendrite
arm spacing. For the 0.044wt%C steel, the solidus temperatures are the same within ± 0.1 oC, as
shown in Table VIII part 3. For 0.18 and 0.8wt%C steels, the solidus temperatures still decrease
by 7.6 and 17.9 oC, respectively, due to the combined effects of increasing cooling rate from 1 to
100 oC/sec. The effect of cooling rate is more important than that of secondary dendrite arm
spacing, so the cancellation is not perfect. However, these small differences contrast with the 20
~ 70 oC changes in solidus temperatures predicted with independent changes in cooling rate or
secondary dendrite arm (See Table VIII parts 1 and 2).
VII. NON-EQUILIBRIUM PHASE DIAGRAM AND CRACK FORMATION
Figure 15 shows the non-equilibrium pseudo Fe-C phase diagram for steel S3 at cooling rates of
1, 10 and 100 oC/sec using the present analytical model. The secondary dendrite arm spacings

28
from Eq. (12) vary with both carbon content and cooling rate. For this model, the solid fractions
of 0.0, 0.75, 0.9 and 1.0 are believed to correspond to the characteristic temperatures of Tliq, zero
strength temperature (ZST), liquid impenetrable temperature (LIT) and zero ductility
temperature (ZDT), respectively.
The ability to accurately predict these temperatures is of practical consequence to the prediction,
understanding and avoidance of cracks, such as hot tears. Cracks which form above the LIT, are
refilled with liquid fed in from the bulk. Cracks, which form below LIT cannot refill, however,
because the dendrite arms are close enough to resist feeding of the liquid. This critical
temperature is proposed to correspond to a solid fraction of 0.9[19,57,58]. Figure 15 shows that
the combined effects of cooling rate and secondary dendrite arm spacing on Tliq, ZST and LIT is
not significant. However, the combined effects on ZDT are significant in steels above 0.1wt%C
with high alloy content. This is due to the enhanced segregation of solute elements near the final
stage of solidification and the lower partition coefficients for the γ-phase, relative to δ. With
increasing carbon content, increasing the cooling rate lowers ZDT more, which increases the
critical temperature range between LIT and ZDT. This suggests that the tendency for cracking
during solidification should increase with increasing cooling rate, with increasing carbon content
above 0.1wt%C and with increasing alloy content.
Further complexities arise due to flow and macrosegregation, non-uniform heat transfer,
thermal-mechanical deformation, and stress concentration. Further work is needed to incorporate
the simple model presented here into other advanced macroscopic models to simulate fluid flow,
heat transfer and stress during solidification processes.

29
VIII. CONCLUSIONS
A simple analytical model of microsegregation based on the Clyne-Kurz model has been
developed, which takes into account the effects of multiple components, columnar dendrites,
coarsening and the δ/γ transformation for application to the solidification of steels. A new
empirical equation for the secondary dendrite arm spacing, which varies with cooling rate and
carbon content, has been proposed, based on measurements by several different researchers as
follows.
CC
CR
CRC
CCC
CCCC <⋅⋅=
≤<⋅⋅−=µλ⋅−−
−
15.0for9.143
15.00for)9.7201.169()m()%996.15501.0(3616.0
4935.0SDAS
Predictions with this microsegregation model agree with both experimental measurements and
calculations with a detailed finite difference model. Model predictions for a range of steel
compositions, cooling rates and secondary dendrite arm spacings reveal:
1) The solidus temperature is lowered significantly with independent increases in either
cooling rate or secondary dendrite arm spacing.
2) In real castings, where spacings change with cooling rate, the effect of cooling rates less
than 100 oC/sec on phase fraction evolution is insignificant in low alloy steels with less
than 0.1wt%C, and for phase fractions below 0.9 in other steels.
30
3) Solute element concentration, especially phosphorus and sulfur, has a significant effect on
solidus temperature and zero ductility temperature due to their enhanced segregation near
the final stage of solidification.
The simple analytical model presented here can easily and efficiently incorporate
microsegregation phenomena into solidification calculations for use in advanced macroscopic
models.
31
NOMENCLATURE
CC average carbon concentration (wt%)
CL,iave average liquid concentration during the δ/γ transformation (wt%)
CL liquid concentration (wt%)
Co initial liquid concentration (wt%)
CR cooling rate (oC/sec)
DS diffusion coefficient (cm2/sec)
fS solid fraction
fendδ / γ ending solid fraction of δ/γ transformation
fstartδ / γ starting solid fraction of δ/γ transformation
δfS δ-phase fraction in the solid phase
γfS γ-phase fraction in the solid phase
i solute element (carbon, silicon, manganese, phosphorus or sulfur)
k equilibrium partition coefficient
m slope of the liquidus line (oC/%)
n slope of the TAr4 line (oC/%)
Tliq liquidus temperature (oC)
Tpure melting point of pure iron (1536 oC)
Tsol solidus temperature (oC)
TAr4 Ar4 transformation temperature (oC)
Tendδ / γ ending temperature of δ/γ transformation (oC)
32
Tpureδ / γ temperature of δ/γ transformation of pure iron (1392 oC)
Tstartδ / γ starting temperature of δ/γ transformation (oC)
t time (sec)
tf local solidification time (sec)
X length scale of the microsegregation domain
x width of the nodal area
α Fourier number, Eq. (5)
α+ Fourier number accounts for coarsening
αC extra back-diffusion from coarsening = 0.1
β back-diffusion parameter
λSDAS secondary dendrite arm spacing (µm)
33
REFERENCES
1. M. C. Flemings and G. E. Nereo : Macrosegregation; Part1, Trans. Met. Soc. AIME, 1967,
vol. 239, pp. 1449-61.
2. R. Mehrabian, M. Keane and M. C. Flemings : Interdendritic fluid flow and
macrosegregation; Influence of gravity, Metall. Trans., 1970, vol. 1, pp. 1209-20.
3. T. Fuji, D. R. Poirier and M. C. Flemings : Macrosegregation in a multicomponent low alloy
steel, Metall. Trans. B, 1979, vol. 12B, pp. 331-39.
4. H. Mizukami, M. Komatsu, T. Kitagawa and K. Kawakami : Trans. Iron Steel Ins. Japan,
1984, vol. 24, pp. 940-49.
5. K. S. Oh, I. R. Lee, Y. K. Shin, Y. S. Koo, I. J. Lee and D. Y. Lee : Proc. 6th Int. Iron Steel
Cong., Nagoya, ISIJ, 1990, pp. 256-63.
6. K. Ayata, S. Koyama, H. Nakata, S. Kawasaki, K. Ebina and T. Hata : Proc. 6th Int. Iron
Steel Cong., Nagoya, ISIJ, 1990, pp. 279-84.
7. M. El-Bealy : On the mechanism of halfway cracks and macro-segregation in continuously
cast steel slabs, Scand. J. Metall., 1995, vol. 24, pp. 63-80.
8. V. R. Voller and C. Beckermann : A unified model of microsegregation and coarsening,
Metall. Trans. A, 1999, vol. 30A, pp. 2183-89.
9. J. Miettinen : Mathematical simulation of interdendritic solidification of low-alloyed and
stainless steels, Metall. Trans. A, 1992, vol. 23A, pp. 1155-70.
10. C. Y. Wang and C. Beckermann : A unified solute diffusion-model for columnar and
equiaxed dendritic alloy solidification, Mater. Sci. Eng., 1993, vol. 171, pp. 199-211.
11. J. F. MCCarthy : Phase diagram effects in phase field models of dendritic growth in binary
alloys, Acta Mater., 1997, vol. 45, pp. 4077-91.

34
12. A. Karma and W. J. Rappel : Quantitative phase-field modeling of dendritic growth in two
and three dimensions, Physical Review D, vol. 57, pp. 4323-49.
13. J. Tiaden : Phase field simulations of the peritectic solidification of Fe-C, J. of Crystal
Growth, 1999, vol. 199, pp. 1275-80.
14. J. S. Lee, S. G. Kim, W. T. Kim and T. Suzuki : Numerical simulation of peritectic reaction
using a multi-phase-field model, ISIJ International, 1999, vol. 39, pp. 730-36.
15. B. Nestler and A. A. Wheeler : A multi-phase-field model of eutectic and peritectic alloys:
Numerical simulation of growth structures, Physica D, 2000, vol. 138, pp. 114-33.
16. J. Rappaz and J. F. Scheid : Existence of solutions to a phase-field model for the isothermal
solidification process of a binary alloy, Math. Methods Appl. Sci., 2000, vol. 23, pp. 491-513.
17. T. Matsumiya, H. Kajioka, S. Mizoguchi, Y. Ueshima and H. Esaka : Mathematical analysis
of segregations in continuously-cast slabs, Trans. ISIJ, 1984, vol. 24, pp. 873-82.
18. Y. Ueshima, S. Mizoguchi, T. Matsumiya and H. Kajioka : Analysis of solute distribution in
dendrites of carbon steel with δ/γ transformation during solidification, Metall. Trans. B, 1986,
vol. 17B, pp. 845-59.
19. K. Kim, T. Yeo, K. H. Oh and D. N. Lee : Effect of carbon and sulfur in continuously cast
strand on longitudinal surface crack, ISIJ International, 1996, vol. 36, pp. 284-89.
20. Y. M. Won, K. H. Kim, T. Yeo and K. H. Oh : Effect of cooling rate on ZST, LIT and ZDT
of carbon steels near melting point, ISIJ International, vol. 38, 1998, pp. 1093-99.
21. J. A. Sarreal and G. J. Abbaschian : The effect of solidification rate on microsegregation,
Metall. Trans. A, 1986, vol. 17A, pp. 2063-73.
22. G. Shin, T. Kajitani, T. Suzuki and T. Umeda : Mechanical properties of carbon steels
during solidification, Tetsu-to- Hagané, 1992, vol. 78, pp. 587-93.

35
23. D. J. Seol, Y. M. Won, K. H. Oh, Y. C. Shin and C. H. Yim : Mechanical behavior of carbon
steels in the temperature range of mushy zone, ISIJ International, vol. 40, 2000, pp. 356-63.
24. E. Schmidtmann and F. Rakoski : Influence of the carbon content of 0.015 to 1% and of the
structure on the high-temperature strength and toughness behavior of structural steels after
solidification from the melt, Arch. Eisenhüttenwes., 1983, vol. 54, pp. 357-62.
25. H. G. Suzuki, S. Nishimura and Y. Nakamura : Improvement of hot ductility of continuously
cast carbon steels, Trans. ISIJ, 1984, vol. 24, pp. 54-59.
26. T. Nakagawa, T. Umeda, J. Murata, Y. Kamimura and N. Niwa : Deformation behavior
during solidification of steels, ISIJ International, 1995, vol. 35, pp. 723-29.
27. A Guide to the Solidification of Steels, Jernkontoret, Stockholm, 1977.
28. L. Ericson : Cracking in low alloy aluminum grain refined steels, Scand. J. Metall., 1977,
vol. 6, pp. 116-24.
29. S. Kobayashi : A mathematical model for solute redistribution during dendritic
solidification, Trans. Iron Steel Inst. Jpn., 1988, vol. 28, pp. 535-42.
30. Y. C. Shin, J. Choi and C. H. Yim : Technical Report, Iron & Steel Making Research Team,
Technical Research Labs., POSCO, Korea, 1998.
31. E. Scheil : Bemerkungen zur Schichtkristallbildung, Z. Metallkd., 1942, vol. 34, pp. 70-72.
32. H. D. Brody and M. C. Flemings : Solute redistribution in dendritic solidification, Trans.
Metall. Soc. AIME, 1966, vol. 236, pp. 615-24.
33. I. Ohnaka : Mathematical analysis of solute redistribution during solidification with
diffusion in solid phase, Trans. ISIJ, 1986, vol. 26, pp. 1045-51.
34. T. W. Clyne and W. Kurz : Solute redistribution during solidification with rapid solid state
diffusion, Metall. Trans. A, 1981, vol. 12A, pp. 965-71.

36
35. S. Kobayashi : Solute redistribution during solidification with diffusion in solid phase; A
theoretical analysis, J. Crystal Growth, 1988, vol. 88, pp.87-96.
36. T. P. Battle and R. D. Pehlke : Mathematical modeling of microsegregation in binary
metallic alloys, Metall. Trans. B, 1990, vol. 21B, pp. 357-75.
37. J. Miettinen : Simple semiempirical model for prediction of austenite decomposition and
related heat release during cooling of low alloyed steels, Ironmaking and Steelmaking, 1996,
vol. 23, pp. 346-56.
38. J. Miettinen : Calculation of solidification-related thermophysical properties for steels,
Metall. Trans. B, 1997, vol. 28B, pp. 281-97.
39. T. Kawawa : Tekko-no-Gyoko (Solidification of Steel), ed. by Solidification Comm. of ISIJ,
ISIJ, Tokyo, 1977, Appendix, 13.
40. Y. Nakamura and H. Esaka : Tetsu-to- Hagané, 1981, vol. 67, p. S140.
41. Tekko-no-Gyoko (Solidification of Steel), supplement, Solidification Comm. of ISIJ, ISIJ,
Tokyo, 1977, pp. S32-S50.
42. Metal Handbook, ed. By T. Lyman, H. E. Boyer, W. J. Carnes and M. W. Chevalier, 8th ed.,
ASM, Metal Park, OH, 1973.
43. Tekko-Binran (Handbook for Steel), by ISIJ, rd ed., Maruzen, Tokyo, 1981, vol. 1, pp. 193-
94.
44. W. Kurz and D. J. Fisher: Fundamentals of Solidification, Trans. Tech., Aedermannsdorf,
1989.
45. B. Sundman, B. Jansson and J. –O. Andersson : CALPHAD, 1985, vol. 9, pp. 153-90.
46. E. Flender : MAGMASOFT, Magma Gmbh, Aachen, Germany, 2000.
47. H. Jacobi and K. Wünnenberg : Solidification structure and micro-segregation of
unidirectionally solidified steels, Steel Research, 1999, vol. 70, pp. 362-67.

37
48. B. Weisgerber, M. Hecht and K. Harste : Investigations of the solidification structure of
continuously cast slabs, Steel Research, 1999, vol. 70, pp. 403-11.
49. M. Imagumbai and T. Takeda : Influence of calcium-treatment of sulfide- and oxide-
inclusions in continuous-cast slab of clean steel – dendrite structure and inclusions, ISIJ
International, 1994, vol. 34, pp. 574-83.
50. D. Senk, B. Engl, O. Siemon and G. Stebner : Investigation of solidification and
microsegregation of near-net-shape cast carbon steel, Steel Research, 1999, vol. 70, pp. 368-72.
51. A. Suzuki, T. Suzuki, Y. Nagaoka and Y. Iwata : On secondary dendrite arm spacing in
commercial carbon steels with different carbon content, Nippon Kinzoku Gakkaishi, 1968, vol.
32, pp. 1301-05.
52. M. El-Bealy and B. G. Thomas : Prediction of dendrite arm spacing for low alloy steel
casting processes, Metall. Trans. B, 1996, vol. 27B, pp. 689-93.
53. D. J. Hurtuk and A. A. Tzavaras : Aberrations observed in the relationship of dendrite size-
alloying elements for low-alloy steel, Proc. Inter. Conf. on Solidification, Solidification and
Casting of Metals, Univ. of Sheffield, 1977, pp. 21-28.
54. T. B. Massalski : Binary Alloy Phase Diagrams, vol. 1, ASM, Materials Park, 1986, p. 842.
55. V. R. Voller and S. Sundarraj : Modeling of microsegregation, Mater. Sci. Technol., 1993,
vol. 9, pp. 478-81.
56. A. A. Howe : Estimation of liquidus temperatures for steels, Ironmaking and Steelmaking,
1988, vol. 15, pp. 134-42.
57. T. W. Clyne, M. Wolf and W. Kurz : The effect of melt composition on solidification
cracking of steel, with particular reference to continuous casting, Metall. Trans. B, 1982, vol.
13B, pp. 259-66.

38
58. Y. M. Won, T. Yeo, D. J. Seol and K. H. Oh : A new criterion for internal crack formation in
continuously cast steels, Metall. Trans. B, 2000, vol. 31B, pp. 779-94.

39
TABLE LIST Table I. Equilibrium partition coefficients, diffusion coefficients and liquidus line slopes of the solute elements[39-43]. Table II. Data for Al-4.9%Cu alloy experiments[21]. Table III. Chemical compositions of carbon steels (wt%) and cooling rates (oC/sec). Table IV. Different microsegregation equation predictions of β for two sets of conditions (α values). Table V. Variation of parameter tf / X2 at conditions for steel M1 (Table III). Table VI. Calculated solidus temperature using the Lever rule and simple model for steels S1, S2 and S3 (Table III). Table VII. Calculated secondary dendrite arm spacings from Eq. (12) for steel S3 (Table III). Table VIII. Calculated solidus temperatures using the simple model for steel S3 (Table III).

40
Table I. Equilibrium partition coefficients, diffusion coefficients and liquidus line slopes of the solute elements[39-43].
Element kδ/L kγ/L Dδ (cm2/sec) Dγ (cm2/sec) m (oC/%) n (oC/%)
C 0.19 0.34 0.0127exp(-19450/RT) 0.0761exp(-32160/RT) 78.0 -1122
Si 0.77 0.52 8.0exp(-59500/RT) 0.3exp(-60100/RT) 7.6 60
Mn 0.76 0.78 0.76exp(-53640/RT) 0.055exp(-59600/RT) 4.9 -12
P 0.23 0.13 2.9exp(-55000/RT) 0.01exp(-43700/RT) 34.4 140
S 0.05 0.035 4.56exp(-51300/RT) 2.4exp(-53400/RT) 38.0 160
Notes : R is gas constant in cal/mol and T is temperature in K. Table II. Data for Al-4.9%Cu alloy experiments[21].
CR (oC/sec) tf (sec) λSDAS (µm) Eutectic fraction (%)
0.1 980 91 5.54
1.05 93.3 46 6.52
11.25 8.72 23 6.84
65 1.51 14 7.16
187 0.52 10 7.50 Table III. Chemical compositions of carbon steels (wt%) and cooling rates (oC/sec).
Sample C Si Mn P S CR Ref.
M1 0.13 0.35 1.52 0.016 0.002 0.045, 0.25 [17]
S1 0.06-0.6 0.015 1.05 0.0009 0.0008 0.17 [22]
S2 0.12-0.81 0.24 0.61 0.015 0.009 1 [23]
S3 0.015-1.0 0.34 1.52 0.012 0.015 10 [24]

41
Table IV. Different microsegregation equation predictions of β for two sets of conditions (α values).
β α
Eq. (1) Eq. (2) Eq. (4) Eq. (7) Eq. (8) Eq. (9) Eq. (11)
0.3738 1 0 0.7476 0.4278 0.5992 0.4336 0.6455
3.773 1 0 7.546 0.8830 0.9376 0.8810 0.9388 Table V. Variation of parameter tf / X2 at conditions for steel M1 (Table III).
Assumed DAS λSDAS in Eq. (12)
CR (oC/sec) 0.045 0.25 0.045 0.25
X (µm) 180 50 174 74.5
tf (sec) 879.2 143.9 835.5 150.6
tf / X2 (×10-2 sec/µm2) 2.714 5.756 2.760 2.713
Table VI. Calculated solidus temperature using the Lever rule and simple model for steels S1, S2 and S3 (Table III conditions).
0.044wt%C 0.18wt%C 0.8wt%C Sample
Lever rule Simple model Lever rule Simple model Lever rule Simple model
S1 1510.28 (oC) 1509.04 1486.78 1484.88 1344.55 1340.31
S2 1502.55 1499.90 1473.63 1465.28 1331.39 1314.14
S3 1491.59 1487.86 1460.73 1447.13 1318.49 1287.40
42
Table VII. Calculated secondary dendrite arm spacings from Eq. (12) for steel S3 (Table III).
λSDAS (µm) CR (oC/sec)
0.044wt%C 0.18wt%C 0.8wt%C
1 137.4 103.7 182.0
10 44.1 45.1 79.0
100 14.2 19.6 34.4 Table VIII. Calculated solidus temperatures using the simple model for steel S3 (Table III).
0.044wt%C 0.18wt%C 0.8wt%C CR (oC/sec)
λSDAS (µm) Tsol (oC) λSDAS Tsol λSDAS Tsol
1. Constant secondary dendrite arm spacing
1 44.1 1491.00 45.1 1455.64 79.0 1308.44
10 44.1 1487.86 45.1 1447.13 79.0 1287.40
100 44.1 1478.39 45.1 1428.13 79.0 1234.14
2. Constant cooling rate
10 137.4 1478.55 130.7 1434.06 182.0 1254.72
10 44.1 1487.86 45.1 1447.13 79.0 1287.40
10 14.2 1490.99 19.6 1454.00 34.4 1304.75
3. Combined effects of cooling rate and secondary dendrite arm spacing
1 137.4 1487.93 130.7 1450.38 182.0 1295.43
10 44.1 1487.86 45.1 1447.13 79.0 1287.40
100 14.2 1487.78 19.6 1442.83 34.4 1277.52
43
FIGURE LIST Figure 1 Comparison of the predicted and measured secondary dendrite arm spacings[47-51] as a function of carbon content at various cooling rates. Figure 2 (a) Schematic of the dendrite array morphology and (b) the corresponding transverse cross section assumed in the finite difference simulation. Figure 3 Numerical discretization of dendrite section for finite difference model domain. Figure 4 Eutectic fraction (Al-4.9%Cu alloy in Table 2) predicted with the simple model compared with experimental measurements[21] and the numerical prediction by Voller et al.[8]. Figure 5 Comparison of manganese concentration in the liquid calculated by various simple equations with the present finite difference model results (0.13%C steel M1 in Table 3). Figure 6 Comparison of carbon concentration in the liquid calculated by various simple equations with the present finite difference model results (0.13%C steel M1 in Table 3). Figure 7 Comparison of the calculated (a) manganese and (b) phosphorus concentration in the liquid phase and experimental measurements[17] (0.13%C steel M1 in Table 3). Figure 8 Non-equilibrium pseudo-binary Fe-C phase diagram of 0.015Si-1.05Mn-0.0009P-0.0008S carbon steels at a cooling rate of 0.17 oC/sec, compared with ZST and ZDT measurements[22]. Figure 9 Non-equilibrium pseudo-binary Fe-C phase diagram of 0.24Si-0.61Mn-0.015P-0.009S carbon steels at a cooling rate of 1 oC/sec, compared with ZST and ZDT measurements[23]. Figure 10 Non-equilibrium pseudo-binary Fe-C phase diagram of 0.34Si-1.52Mn-0.012P-0.015S carbon steels at a cooling rate of 10 oC/sec, compared with ZST and ZDT measurements[24]. Figure 11 Calculated vs experimental liquidus[27-30], solidus[27-30], peritectic temperatures [27-29], ZST[22-24,26] and ZDT[22-26] in plain carbon steels. Figure 12 Effect of cooling rate on phase fraction evolution for three different steels calculated with simple model. Figure 13 Effect of secondary dendrite arm spacing on phase fraction evolution for three different steels calculated with simple model. Figure 14 Evolution of phase fractions with temperature during solidification for conditions in Table 6 calculated with (a) simple model and (b) finite difference model. Figure 15 Combined effects of cooling rate and secondary dendrite arm spacing (Eq. 12) on Tliq (fS=0.0), ZST (fS=0.75), LIT (fS=0.9) and ZDT (fS=1.0) of steel S3 (in Table 3) calculated with simple microsegregation model.
44
0.0 0.2 0.4 0.6 0.8 1.00
200
400
600
800
1000
[51]
[47]
[47]
[48]
[48]
[49]
[48][48]
[50]
0.1
0.2
0.5
2.05.0
0.03 oC/sec
Measured data 0.03~0.1 oC/sec ~0.2 ~0.5 ~2.0 ~5.0 ~1200
λ SDAS
, µm
Carbon Content, wt%
Figure 1 Comparison of the predicted and measured secondary dendrite arm spacings[47-51] as a function of carbon content at various cooling rates.

45
local equilibrium
complete mixing
Solute diffusion calculation with FDM
liquid δ γ
domain
(a) (b)
Figure 2 (a) Schematic of the dendrite array morphology and (b) the corresponding transverse cross section assumed in the finite difference simulation.

46
2
Aj
Lj
∆xj
L
δδδδγγγγ
Figure 3 Numerical discretization of dendrite section for finite difference model domain.
j = 1 j = N = 100

47
0.01 0.1 1 10 100 10000
2
4
6
8
10
Solidification time, sec
measured data[21]
simple model
Eute
ctic
Fra
ctio
n, %
Cooling Rate, oC/sec
1000 100 10 1 0.1
numerical prediciton[8]
Figure 4 Eutectic fraction (Al-4.9%Cu alloy in Table 2) predicted with the simple model compared with experimental measurements[21] and the numerical prediction by Voller et al.[8].

48
0.5 0.6 0.7 0.8 0.9 1.01.5
1.8
2.1
2.4
2.7
3.0
α = 0.3738k = 0.77Co = 1.52
Scheil Clyne-Kurz & Ohnaka(2α) Ohnaka(4α) simple model present FDM Brody-Flemings Lever rule
Mn
in L
iqui
d Ph
ase,
wt%
Solid Fraction
Figure 5 Comparison of manganese concentration in the liquid calculated by various simple equations with the present finite difference model results (0.13%C steel M1 in Table 3).

49
0.5 0.6 0.7 0.8 0.9 1.00.0
0.2
0.4
0.6
0.8
1.0
α = 3.773k = 0.19Co = 0.13
Scheil Clyne-Kurz & Ohnaka(2α) Ohnaka(4α) & simple model present FDM Lever rule Brody-Flemings
C in
Liq
uid
Phas
e, w
t%
Solid Fraction
Figure 6 Comparison of carbon concentration in the liquid calculated by various simple equations with the present finite difference model results (0.13%C steel M1 in Table 3).

50
0.0 0.2 0.4 0.6 0.8 1.01.4
1.6
1.8
2.0
2.2
2.4
0.045 0.25 cooling rate (oC/sec) measured data[17](360) (100) present FDM (assumed DAS)(360) (100) simple model (assumed DAS)(348) (149) simple model (SDAS in Eq.12)
Mn
in L
iqui
d Ph
ase,
wt%
Solid Fraction
(a)
Figure 7 Comparison of the calculated (a) manganese and (b) phosphorus concentration in the liquid phase and experimental measurements[17] (0.13%C steel M1 in Table 3).

51
0.0 0.2 0.4 0.6 0.8 1.00.00
0.02
0.04
0.06
0.08
0.10
0.045 0.25 cooling rate (oC/sec) measured data[17](360) (100) present FDM (assumed DAS)(360) (100) simple model (assumed DAS)(348) (149) simple model (SDAS in Eq.12)
P in
Liq
uid
Phas
e, w
t%
Solid Fraction
(b)
Figure 7 Comparison of the calculated (a) manganese and (b) phosphorus concentration in the liquid phase and experimental measurements[17] (0.13%C steel M1 in Table 3).

52
0.0 0.2 0.4 0.6 0.8 1.01300
1350
1400
1450
1500
1550
ZST(exp.) ZDT(exp.) Fe-C equilibrium diagram present FDM simple model
δ
Liquid
δ+γ
δ+γ+L δ+L
γ+L
γ
fS=0.0
fS=0.75
fS=1.0
Tem
pera
ture
, o C
Carbon Content, wt%
Figure 8 Non-equilibrium pseudo-binary Fe-C phase diagram of 0.015Si-1.05Mn-0.0009P-0.0008S carbon steels at a cooling rate of 0.17 oC/sec, compared with ZST and ZDT measurements[22].
53
0.0 0.2 0.4 0.6 0.8 1.01300
1350
1400
1450
1500
1550
Liquid
δ+γ
δ+γ+L δ+L
γ+L
γ
δ fS=0.0
fS=0.75
fS=1.0
ZST(exp.) ZDT(exp.) Fe-C equilibrium diagram present FDM simple model
Tem
pera
ture
, o C
Carbon Content, wt%
Figure 9 Non-equilibrium pseudo-binary Fe-C phase diagram of 0.24Si-0.61Mn-0.015P-0.009S carbon steels at a cooling rate of 1 oC/sec, compared with ZST and ZDT measurements[23].

54
0.0 0.2 0.4 0.6 0.8 1.01300
1350
1400
1450
1500
1550
Liquid
δ+γ
δ+γ+L
δ+L
γ+L
γ
δ
fS=0.0
fS=0.75
fS=1.0
ZST(exp.) ZDT(exp.) Fe-C equilibrium diagram present FDM simple model
Tem
pera
ture
, o C
Carbon Content, wt%
Figure 10 Non-equilibrium pseudo-binary Fe-C phase diagram of 0.34Si-1.52Mn-0.012P-0.015S carbon steels at a cooling rate of 10 oC/sec, compared with ZST and ZDT measurements[24].

55
1250 1300 1350 1400 1450 1500 15501250
1300
1350
1400
1450
1500
1550
ZST (55 points) ZDT (56 points) Liquidus (48 points) δ/γ transformation (30 points) Solidus (47 points)
Cal
cula
ted
Tem
pera
ture
, o C
Experimental Temperature, oC
Figure 11 Calculated vs experimental liquidus[27-30], solidus[27-30], peritectic temperatures[27-29], ZST[22-24,26] and ZDT[22-26] in plain carbon steels.

56
Figure 12 Effect of cooling rate on phase fraction evolution for three different steels calculated with simple model.
1200 1250 1300 1350 1400 1450 1500 1550
0.0
0.2
0.4
0.6
0.8
1.00.044C (44.1)
0.18C(45.1)
0.8C(λSDAS=79.0)
L
L
L
γ
γ δ
δ
constant λSDAS, (µm) CR, (oC/sec)
1 10 100
Phas
e Fr
actio
n
Temperature, oC

57
Figure 13 Effect of secondary dendrite arm spacing on phase fraction evolution for three different steels calculated with simple model.
1200 1250 1300 1350 1400 1450 1500 1550
0.0
0.2
0.4
0.6
0.8
1.0 0.044C
0.18C
0.8C
L
L
L
γ
γ δ
δ
constant CR=10 oC/sec λSDAS, (µm) 0.044C 0.18C 0.8C
137.4 103.7 182.0 44.1 45.1 79.0 14.2 19.6 34.4
Phas
e Fr
actio
n
Temperature, oC

58
(a)
Figure 14 Evolution of phase fractions with temperature during solidification for conditions in Table 6 calculated with (a) simple model and (b) finite difference model.
1200 1250 1300 1350 1400 1450 1500 1550
0.0
0.2
0.4
0.6
0.8
1.0 0.044C
0.18C
0.8C
LL
L
γ
γ δ
δ
using λSDAS in Eq. (12) CR, (oC/sec)
1 10 100
Phas
e Fr
actio
n
Temperature, oC

59
(b)
Figure 14 Evolution of phase fractions with temperature during solidification for conditions in Table 6 calculated with (a) simple model and (b) finite difference model.
1200 1250 1300 1350 1400 1450 1500 1550
0.0
0.2
0.4
0.6
0.8
1.0 0.044C
0.18C
0.8C
LL
L
γ
γ δ
δ
using λSDAS in Eq. (12) CR, (oC/sec)
1 10 100
Phas
e Fr
actio
n
Temperature, oC

60
0.0 0.2 0.4 0.6 0.8
1300
1350
1400
1450
1500
1550
δ+L δ+γ+L
γ
δ γ+L
Liquid
fS=0.0
fS=0.75
fS=0.9
fS=1.0
cooling rate (oC/sec) 1 10 100
Tem
pera
ture
, o C
Carbon Content, wt%
Figure 15 Combined effects of cooling rate and secondary dendrite arm spacing (Eq. 12) on Tliq (fS=0.0), ZST (fS=0.75), LIT (fS=0.9) and ZDT (fS=1.0) of steel S3 (in Table 3) calculated with simple microsegregation model.