WELDING RESEARCH The Solidification Cracking of Ferritic ... · solidification cracking. Mechanisms...
15
WELDING RESEARCH SUPPLEMENT TO THE WELDING JOURNAL, AUGUST 1978 Sponsored by the American Welding Society and the Welding Research Council l l I) I The Solidification Cracking of Ferritic Steel During Submerged Arc Welding Measures to minimize solidification cracking include gap filling techniques, the use of filler metals with low Q S and ?, and the proper use of multipower techniques to maintain or increase deposition rates BY N. BAILEY AND S. B. JONES Introduction Although solidification cracking is not usually regarded as a serious prob- lem when welding ferritic steels, improvements in the submerged arc welding process, using higher deposi- tion rates and faster welding speeds, have led to welding conditions more likely to give cracking. Furthermore, the need to weld stronger tougher steels, where the inspection require- ments are more stringent, has led to a realization that such cracks can fre- quently be sub-surface and difficult to detect. The present paper describes briefly the work carried out at The Welding Institute, for a Sponsor Group having a wide range of interests in arc welding, to examine solidification cracking be- havior during the submerged arc weld- ing of C and C-Mn steels. It discusses in more detail the results of tests made to examine: 1. The effects of weld shape varia- tions on cracking behavior during test- ing with the Transvarestraint test. 2. Correlations between structural welds and results of Transvarestraint testing. 3. Practical measures to alleviate Fig. 1—Subsurface solidification crack in the first submerged arc pass of a weld in 17 mm (0.43 in.) thick mild steel etched in modi- fied FeQ 3 to reveal solidification structure solidification cracking. Mechanisms and Nature of Solidification Cracking Solidification cracking is a form of hot cracking which occurs during the later stages of solidification if the weld Paper presented at the AWS 59th Annual Meeting held in New Orleans, Louisiana, during April 3-7, 1978. N. BAILEY is Principal Research Metallurgist and S. B. /ONES is Principal Research Engi- neer, The Welding Institute, Abington Hall, Abington, Cambridge, England. metal is unable to accommodate the contractional strains of solidification and cooling. During solidification, col- umnar crystals grow epitaxially into the weld from the coarsened grains of the heat-affected zone (HAZ). Con- traction on solidification, frequently accentuated by welding distortion, tends to open up gaps containing low melting point liquid between these crystals. These potential cracks are normally filled by liquid moving from the weld pool against the direction of crystal growth. Cracks will form if sufficient liquid cannot flow in to compensate for the contraction, as the liquid films will not support apprecia- ble contraction strains. Insufficient liquid flow is either the result of the weld metal having a long freezing range or because the solidification pattern is such as to give long columnar crystals. Susceptible compo- sitions and long crystals are both likely in submerged arc welding. Although solidification cracking is usually thought of as open centerline cracking, readily visible to the eye, such cracks may be subsurface (Fig. 1) and can exist in other forms which are less readily visible. These include flare or butterfly cracking, whose origin is WELDING RESEARCH SUPPLEMENT I 217-s
Transcript of WELDING RESEARCH The Solidification Cracking of Ferritic ... · solidification cracking. Mechanisms...
WELDING RESEARCH
SUPPLEMENT T O THE W E L D I N G J O U R N A L , A U G U S T 1978
Sponsored by the American Welding Society and the Welding Research Council l l I) I
The Solidification Cracking of Ferritic Steel
During Submerged Arc Welding
Measures to minimize solidification cracking include gap filling techniques, the use of filler metals with low Q S and ?,
and the proper use of multipower techniques to maintain or increase deposition rates
BY N. BAILEY AND S. B. JONES
Introduction
Although solidification cracking is not usually regarded as a serious problem when welding ferritic steels, improvements in the submerged arc welding process, using higher deposition rates and faster welding speeds, have led to welding conditions more likely to give cracking. Furthermore, the need to weld stronger tougher steels, where the inspection requirements are more stringent, has led to a realization that such cracks can frequently be sub-surface and difficult to detect.
The present paper describes briefly the work carried out at The Welding Institute, for a Sponsor Group having a wide range of interests in arc welding, to examine solidification cracking behavior during the submerged arc welding of C and C-Mn steels. It discusses in more detail the results of tests made to examine:
1. The effects of weld shape variations on cracking behavior during testing wi th the Transvarestraint test.
2. Correlations between structural welds and results of Transvarestraint testing.
3. Practical measures to alleviate
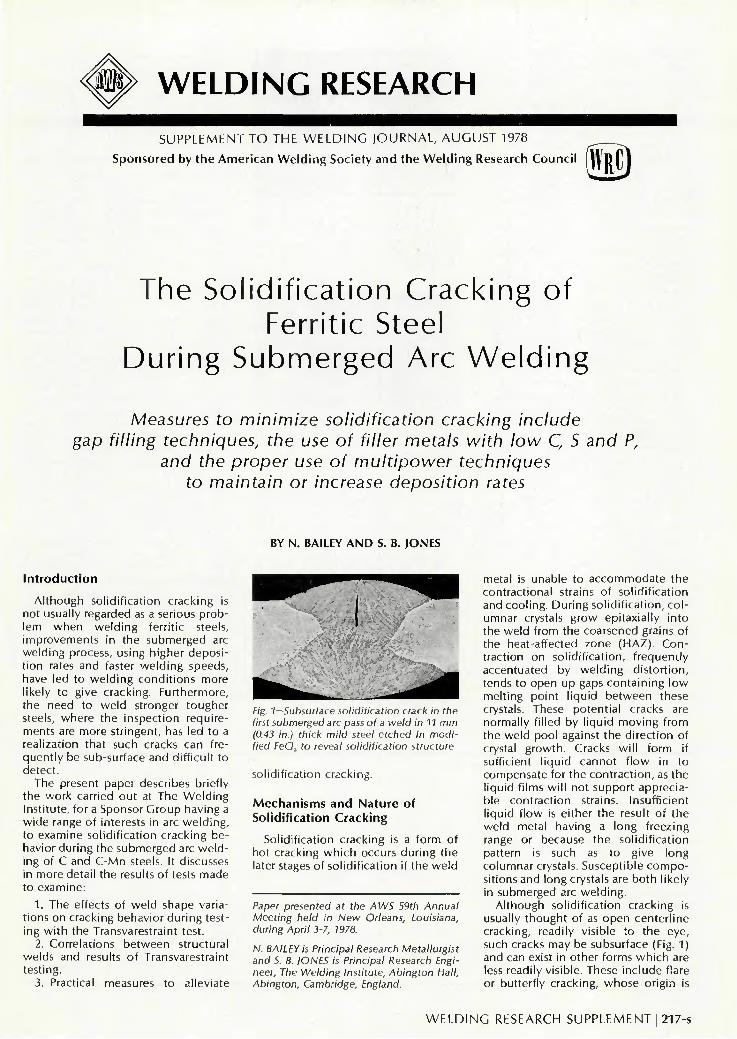
Fig. 1—Subsurface solidification crack in the first submerged arc pass of a weld in 17 mm (0.43 in.) thick mild steel etched in modified FeQ3 to reveal solidification structure
solidification cracking.
Mechanisms and Nature of Solidification Cracking
Solidification cracking is a form of hot cracking which occurs during the later stages of solidification if the weld
Paper presented at the AWS 59th Annual Meeting held in New Orleans, Louisiana, during April 3-7, 1978.
N. BAILEY is Principal Research Metallurgist and S. B. /ONES is Principal Research Engineer, The Welding Institute, Abington Hall, Abington, Cambridge, England.
metal is unable to accommodate the contractional strains of solidification and cooling. During solidif ication, columnar crystals grow epitaxially into the weld from the coarsened grains of the heat-affected zone (HAZ). Contraction on solidification, frequently accentuated by welding distort ion, tends to open up gaps containing low melting point l iquid between these crystals. These potential cracks are normally filled by liquid moving from the weld pool against the direction of crystal growth. Cracks wi l l form if sufficient liquid cannot f low in to compensate for the contraction, as the liquid films wi l l not support appreciable contraction strains. Insufficient liquid f low is either the result of the weld metal having a long freezing range or because the solidification pattern is such as to give long columnar crystals. Susceptible compositions and long crystals are both likely in submerged arc welding.
Although solidification cracking is usually thought of as open centerline cracking, readily visible to the eye, such cracks may be subsurface (Fig. 1) and can exist in other forms which are less readily visible. These include flare or butterfly cracking, whose origin is
W E L D I N G RESEARCH SUPPLEMENT I 217-s
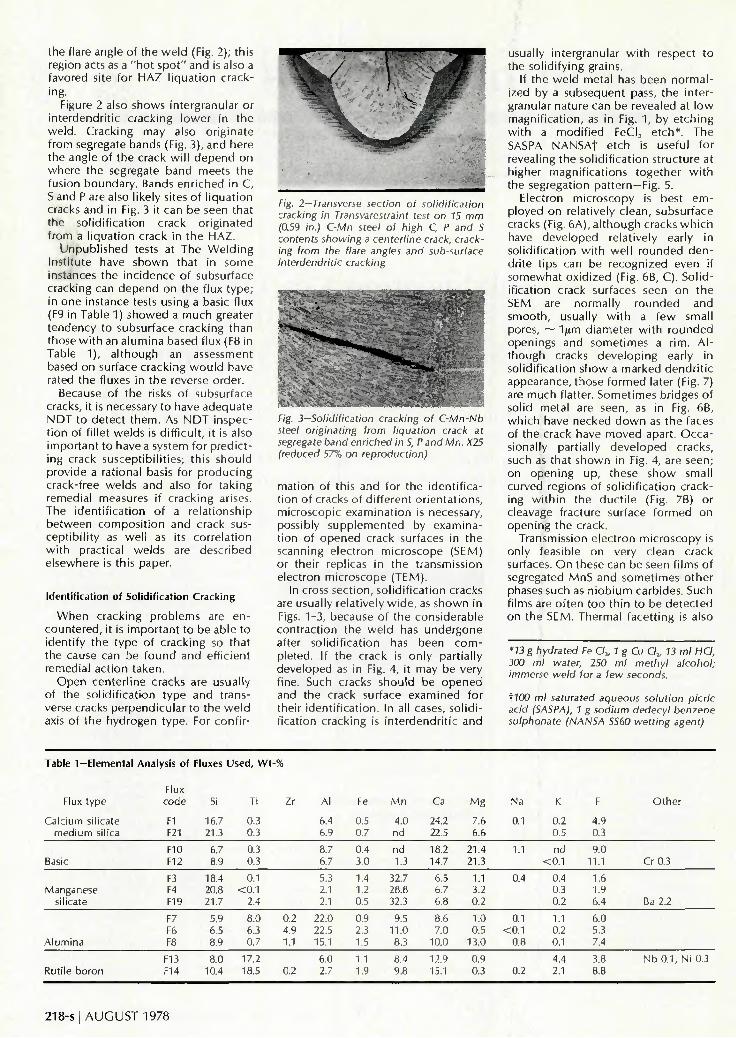
t he f lare angle o f t h e w e l d (Fig. 2); th is reg ion acts as a " h o t s p o t " and is also a favored site fo r H A Z l i q u a t i o n c racking.
Figure 2 also shows in te rg ranu la r or i n te rdend r i t i c c rack ing l o w e r in t h e w e l d . Crack ing may also o r i g i na te f r o m segregate bands (Fig. 3) , and here t he ang le o f t he crack w i l l d e p e n d o n w h e r e t he segregate b a n d meets t h e fus ion b o u n d a r y . Bands e n r i c h e d in C, S and P are also l ike ly sites o f l i q u a t i o n cracks and in Fig. 3 it can be seen that t he so l i d i f i ca t i on crack o r i g i n a t e d f r o m a l i q u a t i o n crack in t he H A Z .
U n p u b l i s h e d tests at The W e l d i n g Ins t i tu te have s h o w n that in some instances the i n c i d e n c e of subsur face c rack ing can d e p e n d o n the f lux t ype ; in o n e ins tance tests us ing a basic f lux (F9 in Table 1) s h o w e d a m u c h greater t endency to subsur face c rack ing than those w i t h an a l u m i n a based f lux (F8 in Table 1), a l t h o u g h an assessment based o n surface c rack ing w o u l d have rated the f luxes in t h e reverse order .
Because o f the risks o f subsur face cracks, it is necessary t o have adequa te N D T to de tec t t h e m . As N D T inspect i o n of f i l le t w e l d s is d i f f i cu l t , it is also i m p o r t a n t t o have a system fo r p red i c t ing crack suscep t ib i l i t i es ; th is s h o u l d p rov ide a ra t iona l basis fo r p r o d u c i n g c rack- f ree w e l d s and also fo r t ak i ng remed ia l measures if c rack ing arises. The i d e n t i f i c a t i o n o f a re l a t i onsh ip b e t w e e n c o m p o s i t i o n and crack suscep t i b i l i t y as w e l l as its c o r r e l a t i o n w i t h pract ica l we lds are desc r ibed e lsewhere is th is paper.
Identification of Solidification Cracking
W h e n c rack ing p r o b l e m s are e n c o u n t e r e d , it is i m p o r t a n t to be ab le t o iden t i f y t he t ype o f c rack ing so tha t t he cause can be f o u n d a n d e f f i c ien t remed ia l ac t i on t aken .
O p e n cen te r l i ne cracks are usua l ly o f the so l i d i f i ca t i on t ype a n d t ransverse cracks p e r p e n d i c u l a r t o t he w e l d axis o f t h e hyd rogen type . For con f i r -
Fig. 2—Transverse section of solidification cracking in Transvarestraint test on 15 mm (0.59 in.) C-Mn steel of high C, P and S contents showing a centerline crack, cracking from the flare angles and sub-surface interdendritic cracking
Fig. 3—Solidification cracking of C-Mn-Nb steel originating from liquation crack at segregate band enriched in S, P and Mn. X25 (reduced 57% on reproduction)
m a t i o n o f th is and fo r t h e i d e n t i f i c a t i on o f cracks o f d i f f e ren t o r i e n t a t i o n s , m ic roscop ic e x a m i n a t i o n is necessary, possib ly s u p p l e m e n t e d by e x a m i n a t i on of o p e n e d crack surfaces in t h e scann ing e lec t ron m i c r o s c o p e (SEM) or the i r repl icas in t he t ransmiss ion e lec t ron m i c r o s c o p e (TEM) .
In cross sec t ion , so l i d i f i ca t i on cracks are usual ly re la t ive ly w i d e , as s h o w n in Figs. 1-3, because o f t he cons ide rab le c o n t r a c t i o n t he w e l d has u n d e r g o n e after so l i d i f i ca t i on has been c o m p le ted . If t h e crack is o n l y par t ia l l y d e v e l o p e d as in Fig. 4, it may be very f ine. Such cracks s h o u l d be o p e n e d and the crack sur face e x a m i n e d fo r the i r i d e n t i f i c a t i o n . In all cases, s o l i d i f i ca t ion c rack ing is i n t e r d e n d r i t i c and
usual ly in te rgranu la r w i t h respect t o the so l i d i f y i ng grains.
If t he w e l d meta l has been n o r m a l ized by a subsequen t pass, t he in te r granular na tu re can be revealed at l o w m a g n i f i c a t i o n , as in Fig. 1 , by e t c h i n g w i t h a m o d i f i e d FeCI3 e t c h * . The SASPA N A N S A f e tch is usefu l fo r reveal ing the so l i d i f i ca t i on s t ruc tu re at h igher magn i f i ca t i ons t o g e t h e r w i t h t he segregat ion pat tern—Fig. 5.
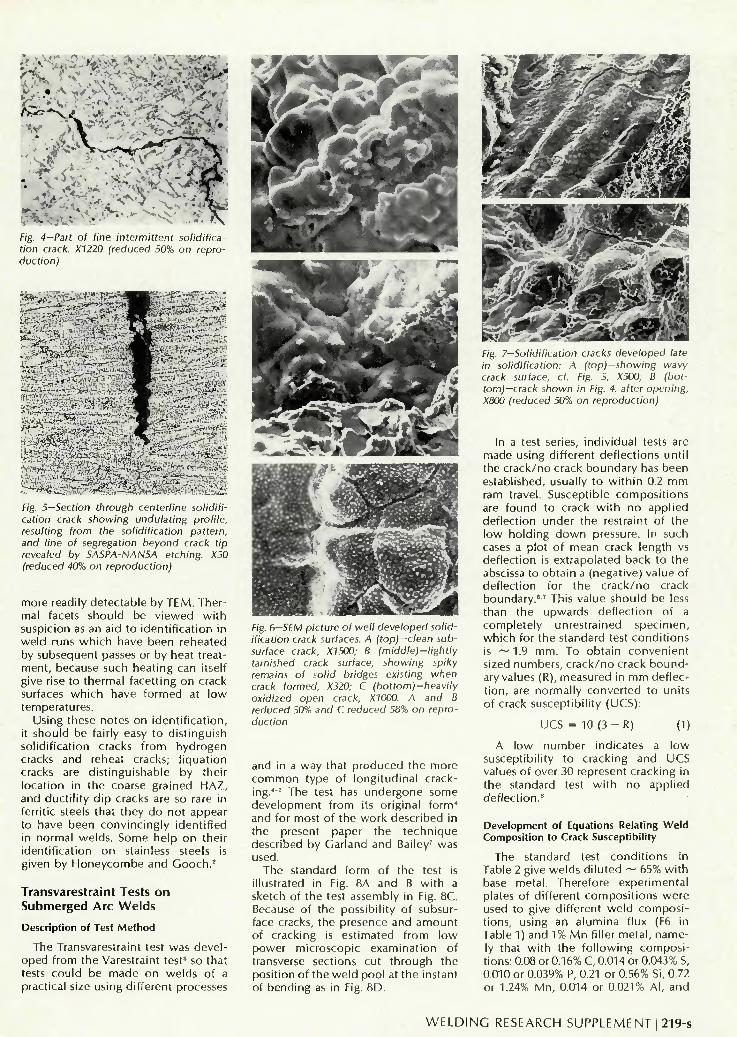
E lect ron m i c r o s c o p y is best e m p loyed o n re la t ive ly c l e a n , subsur face cracks (Fig. 6 A ) , a l t h o u g h cracks w h i c h have d e v e l o p e d re la t ive ly ear ly in so l i d i f i ca t ion w i t h w e l l r o u n d e d d e n -dr i te t ips can be r ecogn i zed even if s o m e w h a t o x i d i z e d (Fig. 6B, C). S o l i d i f i ca t ion crack surfaces seen o n t h e SEM are no rma l l y r o u n d e d a n d s m o o t h , usual ly w i t h a f e w smal l pores, ~ 1/irn d i a m e t e r w i t h r o u n d e d open ings and s o m e t i m e s a r i m . A l t h o u g h cracks d e v e l o p i n g early in so l i d i f i ca t i on s h o w a m a r k e d d e n d r i t i c appearance, those f o r m e d later (Fig. 7) are m u c h f latter. S o m e t i m e s br idges o f so l id meta l are seen, as in Fig. 6B, w h i c h have necked d o w n as t h e faces of t he crack have m o v e d apart . O c c a s ional ly par t ia l ly d e v e l o p e d cracks, such as tha t s h o w n in Fig. 4, are seen; on o p e n i n g up , these s h o w smal l cu rved reg ions o f so l i d i f i ca t i on c racking w i t h i n the d u c t i l e (Fig. 7B) or c leavage f rac tu re sur face f o r m e d o n o p e n i n g the crack.
Transmiss ion e l e c t r o n m i c r o s c o p y is on l y feas ib le o n very c lean crack surfaces. O n these can be seen f i lms o f segregated M n S a n d s o m e t i m e s o t h e r phases such as n i o b i u m carb ides. Such f i lms are o f t e n t o o t h i n t o be d e t e c t e d on the SEM. The rma l f ace t t i ng is also
*13 g hydrated Fe Cl3, 1 g Cu Cl,, 13 ml HCI, 300 ml water, 250 ml methyl alcohol; immerse weld for a few seconds.
flOO ml saturated aqueous solution picric acid (SASPA), 1 g sodium dedecyl benzene sulphonate (NANSA SS60 wetting agent)
Table 1—Elemental Analysis of Fluxes Used, Wt-%
Flux type
Calcium silicate medium silica
Flux code
F1 F21
Zr
16.7 21.3
0.3 0.3
Al
6.4 6.9
Fe
0.5 0.7
Mn
4.0 nd
Ca
24.2 22.5
Mg
7.6
Na
0.1 0.2 0.5
4.9 0.3
Other
Basic
Manganese silicate
Alumina
Rutile boron
F10 F12
F3 F4 F19
F7 F6 F8
F13 F14
6.7 8.9
18.4 20.8 21.7
5.9 6.5 8.9
8.0 10.4
0.3 0.3
0.1 <0.1
2.4
8.0 6.3 0.7
17.2 18.5
0.2 4.9 1.1
0.2
8.7 6.7
5.3 2.1 2.1
22.0 22.5 15.1
6.0 2.7
0.4 3.0
1.4 1.2 0.5
0.9 2.3 1.5
1.1 1.9
nd 1.3
32.7 28.8 32.3
9.5 11.0 8.3
8.4 9.8
18.2 14.7
6.5 6.7 6.8
8.6 7.0
10.0
12.9 15.1
21.4 21.3
1.1 3.2 0.2
1.0 0.5
13.0
0.9 0.3
1.1
0.4
0.1 <0.1
0.8
0.2
nd <0.1
0.4 0.3 0.2
1.1 0.2 0.1
4.4 2.1
9.0 11.1
1.6 1.9 6.4
6.0 5.3 7.4
3.8 8.8
Cr 0.3
Ba 2.2
Nb 0.1, Ni 0.3
218 -s I A U G U S T 1 9 7 8
i
F/g. 4—Part of fine intermittent solidification crack. X1220 (reduced 50% on reproduction)
Fig. 5—Section through centerline solidification crack showing undulating profile, resulting from the solidification pattern, and line of segregation beyond crack tip revealed by SASPA-NANSA etching. X50 (reduced 40% on reproduction)
more readily detectable by TEM. Thermal facets should be viewed wi th suspicion as an aid to identif ication in weld runs which have been reheated by subsequent passes or by heat treatment, because such heating can itself give rise to thermal facetting on crack surfaces which have formed at low temperatures.
Using these notes on identif ication, it should be fairly easy to distinguish solidification cracks from hydrogen cracks and reheat cracks; l iquation cracks are distinguishable by their location in the coarse grained HAZ, and ducti l i ty dip cracks are so rare in ferritic steels that they do not appear to have been convincingly identified in normal welds. Some help on their identification on stainless steels is given by Honeycombe and Gooch.-'
Transvarestraint Tests on Submerged Arc Welds
Description of Test Method
The Transvarestraint test was developed from the Varestraint test3 so that tests could be made on welds of a practical size using different processes
Fig. 6-SEM picture of well developed solidification crack surfaces. A (top)-clean subsurface crack, X1500; B (middle)-lightly tarnished crack surface, showing spiky remains ot solid bridges existing when crack termed, X320; C (bottom)—heavily oxidized open crack, X1000. A and B reduced 50% and C reduced 58% on reproduction
and in a way that produced the more common type of longitudinal cracking.4'7 The test has undergone some development from its original form4
and for most of the work described in the present paper the technique described by Garland and Bailey7 was used.
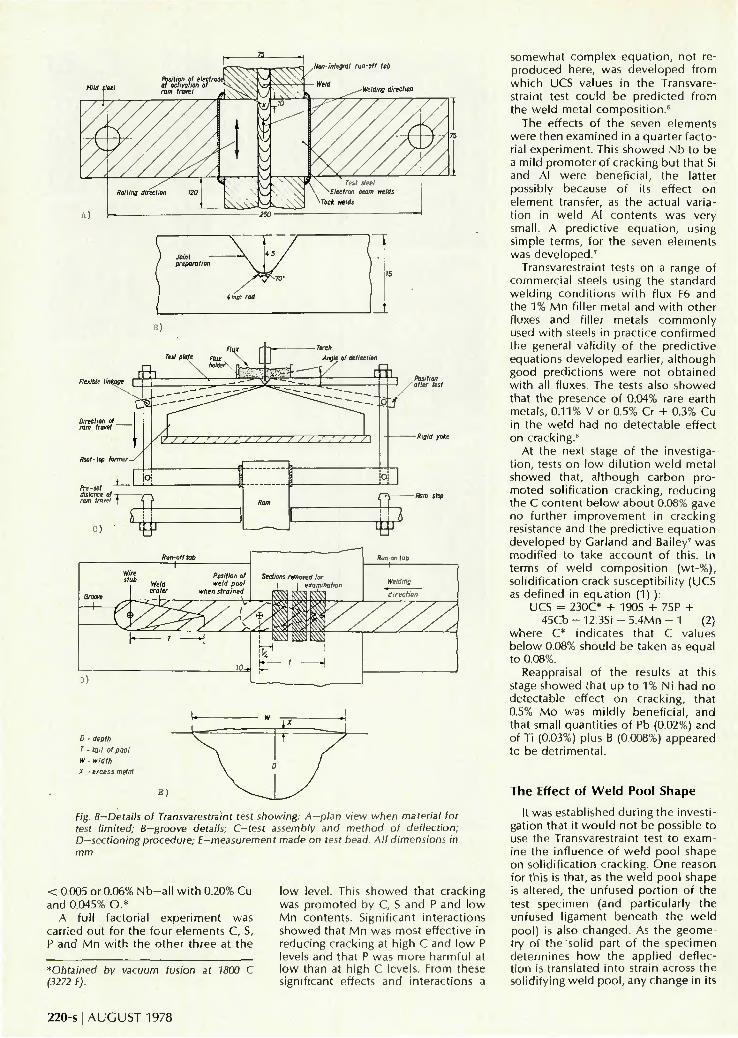
The standard form of the test is illustrated in Fig. 8A and B with a sketch of the test assembly in Fig. 8C. Because of the possibility of subsurface cracks, the presence and amount of cracking is estimated from low power microscopic examination of transverse sections cut through the position of the weld pool at the instant of bending as in Fig. 8D.
Fig. 7—Solidification cracks developed late in solidification: A (top)—showing wavy crack surface, cf. Fig. 5, X500; B (bottom)—crack shown in Fig. 4. after opening, X800 (reduced 50% on reproduction)
In a test series, individual tests are made using different deflections until the crack/no crack boundary has been established, usually to wi th in 0.2 mm ram travel. Susceptible compositions are found to crack wi th no applied deflection under the restraint of the low holding down pressure. In such cases a plot of mean crack length vs deflection is extrapolated back to the abscissa to obtain a (negative) value of deflection for the crack/no crack boundary.*•' This value should be less than the upwards deflection of a completely unrestrained specimen, which for the standard test conditions is ~ 1 . 9 mm. To obtain convenient sized numbers, crack/no crack boundary values (R), measured in mm deflect ion, are normally converted to units of crack susceptibility (UCS):
UCS = 10 ( 3 - R) 0) A low number indicates a low
susceptibility to cracking and UCS values of over 30 represent cracking in the standard test wi th no applied deflection."
Development of Equations Relating Weld Composition to Crack Susceptibility
The standard test conditions in Table 2 give welds diluted — 65% with base metal. Therefore experimental plates of different compositions were used to give different weld compositions, using an alumina flux (F6 in Table 1) and 1% Mn filler metal, namely that with the fol lowing compositions: 0.08 or 0.16% C, 0.014 or 0.043% S, 0.010 or 0.039% P, 0.21 or 0.56% Si, 0.72 or 1.24% Mn, 0.014 or 0.021% Al, and
W E L D I N G RESEARCH SUPPLEME NT I 219-s
Non-integral run-oft tab
Direction of _ ram travel
ftott Test plate Flux \
X holder' i tX
— Torch Angle of deflection
rft \~j$$^rY ft 3 •" -> / a\
Position tier lest
- Rigid yoke
Ram stop
0 - depth
T - fait of pool w - width X - excess metal
Fig. 8-Details of Transvarestraint test showing: A—plan view when material for test limited; B-groove details; C-test assembly and method of deflection; D—sectioning procedure; E—measurement made on test bead. All dimensions in mm
< 0.005 or 0.06% Nb-a l l wi th 0.20% Cu and 0.045% O.*
A full factorial experiment was carried out for the four elements C, S, P and Mn wi th the other three at the
*Ohtained by vacuum fusion at 1800 C (3272 F).
low level. This showed that cracking was promoted by C, S and P and low Mn contents. Significant interactions showed that Mn was most effective in reducing cracking at high C and low P levels and that P was more harmful at low than at high C levels. From these significant effects and interactions a
somewhat complex equation, not reproduced here, was developed from which UCS values in the Transvarestraint test could be predicted from the weld metal composition.6
The effects of the seven elements were then examined in a quarter factorial experiment. This showed Nb to be a mild promoter of cracking but that Si and Al were beneficial, the latter possibly because of its effect on element transfer, as the actual variation in weld Al contents was very small. A predictive equation, using simple terms, for the seven elements was developed.7
Transvarestraint tests on a range of commercial steels using the standard welding conditions wi th flux F6 and the 1% Mn filler metal and wi th other fluxes and filler metals commonly used wi th steels in practice confirmed the general validity of the predictive equations developed earlier, although good predictions were not obtained with all fluxes. The tests also showed that the presence of 0.04% rare earth metals, 0.11% V or 0.5% Cr + 0.3% Cu in the weld had no detectable effect on cracking."
At the next stage of the investigat ion, tests on low di lut ion weld metal showed that, although carbon promoted solification cracking, reducing the C content below about 0.08% gave no further improvement in cracking resistance and the predictive equation developed by Garland and Bailey7 was modified to take account of this. In terms of weld composit ion (wt-%), solidification crack susceptibility (UCS as defined in equation (1) ):
UCS = 230C* + 190S + 75P + 4 5 C b - 1 2 . 3 S i - 5 . 4 M n - 1 (2)
where C* indicates that C values below 0.08% should be taken as equal to 0.08%.
Reappraisal of the results at this stage showed that up to 1% Ni had no detectable effect on cracking, that 0.5% Mo was mildly beneficial, and that small quantities of Pb (0.02%) and of Ti (0.03%) plus B (0.008%) appeared to be detrimental.
The Effect of We ld Pool Shape
It was established during the investigation that it would not be possible to use the Transvarestraint test to examine the influence of weld pool shape on solidification cracking. One reason for this is that, as the weld pool shape is altered, the unfused portion of the test specimen (and particularly the unfused ligament beneath the weld pool) is also changed. As the geometry of the solid part of the specimen determines how the applied deflection is translated into strain across the solidifying weld pool, any change in its
220-sl AUGUST 1978
geometry alters the test conditions. A further effect is that as the w id th of the weld pool is altered, the width of the mushy solidifying zone which has to accommodate the deflection is changed.
It is, nevertheless, important to know the influence of varying weld shape on Transvarestraint test cracking behavior because it may not always be possible or convenient to duplicate the standard test conditions given in Table 2. Tests may be required using a electrode wire on filler metal not available in the 3.2 mm (% in.) diameter size, and the standard welding conditions may give a non-standard weld shape with the actual flux used or plate may not be available at 15 mm (0.59 in.) thickness. In the last case, however, it is possible to machine the thickness over the central 75 mm (2.9 in.) only down to 15 mm (0.59 in.). Thin plate can be locally thickened underneath by welding, provided the buttering or surfacing remains wi th in the unfused ligament. In addit ion, a knowledge of the effects of weld pool shape would be needed to enable Transvarestraint test results obtained by different welding processes to be compared.
The influence of weld pool shape on Transvarestraint behavior was examined with both high and low di lut ion deposits. The latter were examined by using oversized grooves and buttering runs (i.e., surfacing passes), as shown in Fig. 9. The range of welding conditions is given in Table 3, flux types and compositions in Table 1.
All welds were made on carbon or C-Mn-Cb steel plate using electrodes with nominal Mn contents of 0.5, 1.0, 1.5 or 2%. Weld analyses are summarized in Table 4, together wi th the predicted crack susceptibility values calculated using equation (2). The results of the Transvarestraint tests are included in Table 5.
In the earlier weld deposits (the lettered series in Tables 3-5), variations in composition were successfully minimized by surfacing as can be seen from Table 4 where the UCS values of all deposits made with the alumina flux F6 were either 15 or 16. A large number of measurements were made on these welds including width (W), depth (D), unfused ligament (U), pool length (from the crater length), length behind the arc, overfil l, w id th and depth of the finger and fused metal area. Of these parameters the depth-to-width ratio appeared to be the most significant. For shallow welds w i th D/ W < 0.6, it appeared that the cracking susceptibility in the Transvarestraint test increased as the D / W ratio was increased (the critical UCS being inversely proportional to D /W) .
This relationship could not be
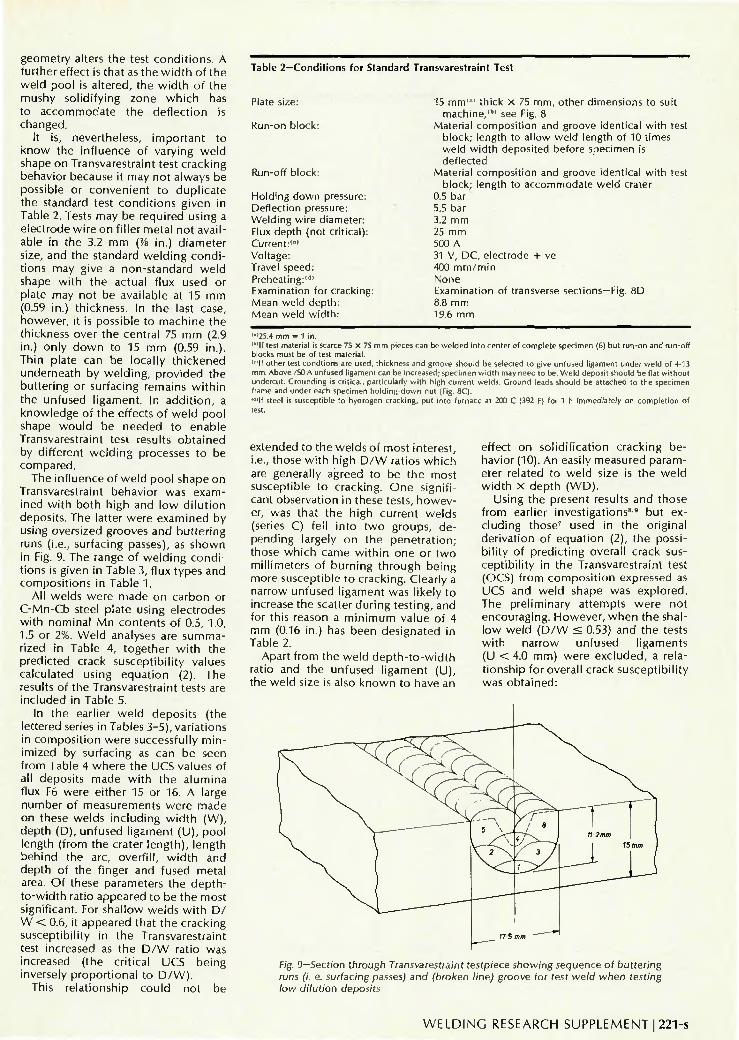
Table 2—Conditions for Standard Transvarestraint Test
Plate size:
Run-on block:
Run-off block:
Holding down pressure: Deflection pressure: Welding wire diameter: Flux depth (not critical): Current:"'1
Voltage: Travel speed: Preheating:"" Examination for cracking Mean weld depth: Mean weld width:
15 mm'" thick X 75 mm, other dimensions to suit machine,"" see Fig. 8
Material composition and groove identical with test block; length to allow weld length of 10 times weld width deposited before specimen is deflected
Material composition and groove identical with test block; length to accommodate weld crater
0.5 bar 5.5 bar 3.2 mm 25 mm 500 A 31 V, DC, electrode + ve 400 mm/min None Examination of transverse sections-Fig. 8D 8.8 mm 19.6 mm
'•'25.4 mm = 1 in. lb,lf test material is scarce 75 x 75 mm pieces can be welded into center of complete specimen (6) but run-on and run-off blocks must be of test material. u , l f other test condtions are used, thickness and groove should be selected to give unfused ligament under weld of 4-13 mm. Above 750 A unfused ligament can be increased; specimen width may need to be. Weld deposit should be flat without undercut. Grounding is critical, particularly with high current welds. Ground leads should be attached to the specimen frame and under each specimen holding-down nut (Fig. 8C). ldllf steel is susceptible to hydrogen cracking, put into furnace at 200 C (392 F) for 1 h immediately on completion of test.
extended to the welds of most interest, i.e., those with high D /W ratios which are generally agreed to be the most susceptible to cracking. One significant observation in these tests, however, was that the high current welds (series C) fell into two groups, depending largely on the penetration; those which came wi th in one or two millimeters of burning through being more susceptible to cracking. Clearly a narrow unfused ligament was likely to increase the scatter during testing, and for this reason a minimum value of 4 mm (0.16 in.) has been designated in Table 2.
Apart from the weld depth- to-width ratio and the unfused ligament (U), the weld size is also known to have an
effect on solidification cracking behavior (10). An easily measured parameter related to weld size is the weld width x depth (WD).
Using the present results and those from earlier investigations8'9 but excluding those7 used in the original derivation of equation (2), the possibility of predicting overall crack susceptibility in the Transvarestraint test (OCS) from composit ion expressed as UCS and weld shape was explored. The preliminary attempts were not encouraging. However, when the shallow weld ( D / W < 0.53) and the tests with narrow unfused ligaments (U < 4.0 mm) were excluded, a relationship for overall crack susceptibility was obtained:
Fig. 9—Section through Transvarestraint testpiece showing sequence of buttering runs (i. e. surfacing passes) and (broken line) groove for test weld when testing low dilution deposits
W E L D I N G RESEARCH SUPPLEMENT I 221-s
OCS = UCS + 0.4 W D
U
W
D 15.5
(3) The results of this analysis for all
welds are included in Table 5. The valid results show a standard deviation of measured minus estimated overall crack susceptibility of 4.0; whi le many of the invalid results give good predictions, others do not. Nevertheless, this was regarded as a reasonably satisfactory prediction—particularly since the precision with which carbon analyses of 0.01% are reported is equivalent to 2.3 UCS when using equation (2) so that a much greater degree of accuracy cannot be expected.
Correlation of Transvarestraint Results With Behavior in Normal Welding Situations
Although the Transvarestraint test appears to provide a valuable guide to the factors control l ing crack susceptibility, the test conditions are unlike those encountered in normal welding. It is therefore necessary to obtain correlations between Transvarestraint
test results and the performance of practical welds.
The processes determining the extent of solidification cracking during Transvarestraint testing and normal welding are closely related. In the Transvarestraint test, cracking occurs in response to a sudden externally applied strain; thus the test gives a measure of the ease w i th which cracks are initiated. In normal welds made with standard welding conditions but using materials of increasing crack susceptibility, the response ranges from no cracking, through isolated short centerline cracks, to mult iple extensive centerline cracks and finally continuous centerline cracks along virtually the entire weld seam. In normal welds, crack init iation is clearly important, but the ease of crack propagation is also significant. For this reason, the percentage of centerline cracking in a given normal weld test panel enables comparison of relative crack susceptibility, even if the crack-no crack boundary has been passed.
The problem of correlation between the results of Transvarestraint tests and normal welds was approached by
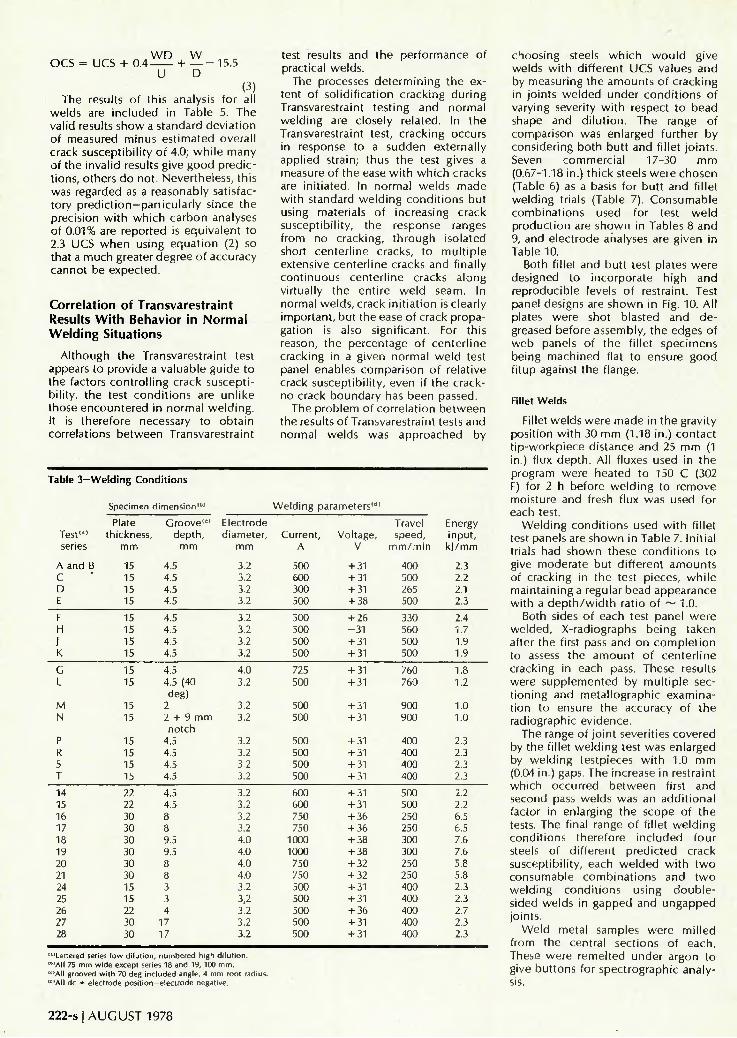
Table 3—Welding Conditions
Specimen dimension" Welding parameters"
Test1" series
A and B C D E
F H
I K
C L
M N
P R S T
14 15 16 17 18 19 20 21 24 25 26 27 28
Plate thickness,
mm
15 15 15 15
15 15 15 15
15 15
15 15
15 15 15 15
22 22 30 30 30 30 30 30 15 15 22 30 30
Groove101
depth, mm
4.5 4.5 4.5 4.5
4.5 4.5 4.5 4.5
4.5 4.5 (40 deg)
2 2 + 9 mm notch
4.5 4.5 4.5 4.5
4.5 4.5 8 8 9.5 9.5 8 8 3 3 4
17 17
Electrode diameter,
mm
3.2 3.2 3.2 3.2
3.2 3.2 3.2 3.2
4.0 3.2
3.2 3.2
3.2 3.2 3.2 3.1
3.2 3.2 3.2 3.2 4.0 4.0 4.0 4.0 3.2 3,2 3.2 3.2 3.2
Current, A
500 600 300 500
500 500 500 500
725 500
500 500
500 500 500 500
600 600 750 750
1000 1000 750 750 500 500 500 500 500
Voltage, V
+ 31 + 31 + 31 + 38
+ 26 - 3 1 + 31 + 31
+ 31 + 31
+ 31 + 31
+ 31 + 31 + 31 + 31
+ 31 + 31 + 36 + 36 + 38 + 38 + 32 + 32 + 31 + 31 + 36 + 31 + 31
Travel speed,
m m / m i n
400 500 265 500
330 560 500 500
760 760
900 900
400 400 400 400
500 500 250 250 300 300 250 250 400 400 400 400 400
Energy input, k | /mm
2.3 2.2 2.1 2.3
2.4 1.7 1.9 1.9
1.8 1.2
1.0 1.0
2.3 2.3 2.3 2.3
2.2 2.2 6.5 6.5 7.6 7.6 5.8 5.8 2.3 2.3 2.7 2.3 2.3
"Lettered series low dilution, numbered high dilution. b'AII 75 mm wide except series 18 and 19, 100 mm. C'AII grooved with 70 deg included angle, 4 mm root radius. *'AII dc + electrode position—electrode negative.
choosing steels which would give welds wi th different UCS values and by measuring the amounts of cracking in joints welded under conditions of varying severity wi th respect to bead shape and di lut ion. The range of comparison was enlarged further by considering both butt and fillet joints. Seven commercial 17-30 mm (0.67-1.18 in.) thick steels were chosen (Table 6) as a basis for butt and fillet welding trials (Table 7). Consumable combinations used for test weld production are shown in Tables 8 and 9, and electrode analyses are given in Table 10.
Both fillet and butt test plates were designed to incorporate high and reproducible levels of restraint. Test panel designs are shown in Fig. 10. All plates were shot blasted and de-greased before assembly, the edges of web panels of the fillet specimens being machined flat to ensure good fitup against the flange.
Fillet Welds
Fillet welds were made in the gravity position wi th 30 mm (1.18 in.) contact tip-workpiece distance and 25 mm (1 in.) flux depth. All fluxes used in the program were heated to 150 C (302 F) for 2 h before welding to remove moisture and fresh flux was used for each test.
Welding conditions used wi th fillet test panels are shown in Table 7. Initial trials had shown these conditions to give moderate but different amounts of cracking in the test pieces, whi le maintaining a regular bead appearance with a depth /w id th ratio of ~ 1.0.
Both sides of each test panel were welded, X-radiographs being taken after the first pass and on completion to assess the amount of centerline cracking in each pass. These results were supplemented by mult iple sectioning and metallographic examination to ensure the accuracy of the radiographic evidence.
The range of joint severities covered by the fillet welding test was enlarged by welding testpieces wi th 1.0 mm (0.04 in.) gaps. The increase in restraint which occurred between first and second pass welds was an additional factor in enlarging the scope of the tests. The final range of fillet welding conditions therefore included four steels of different predicted crack susceptibility, each welded wi th two consumable combinations and two welding conditions using double-sided welds in gapped and ungapped joints.
Weld metal samples were milled from the central sections of each. These were remelted under argon to give buttons for spectrographic analysis.
222-s I AUGUST 1978
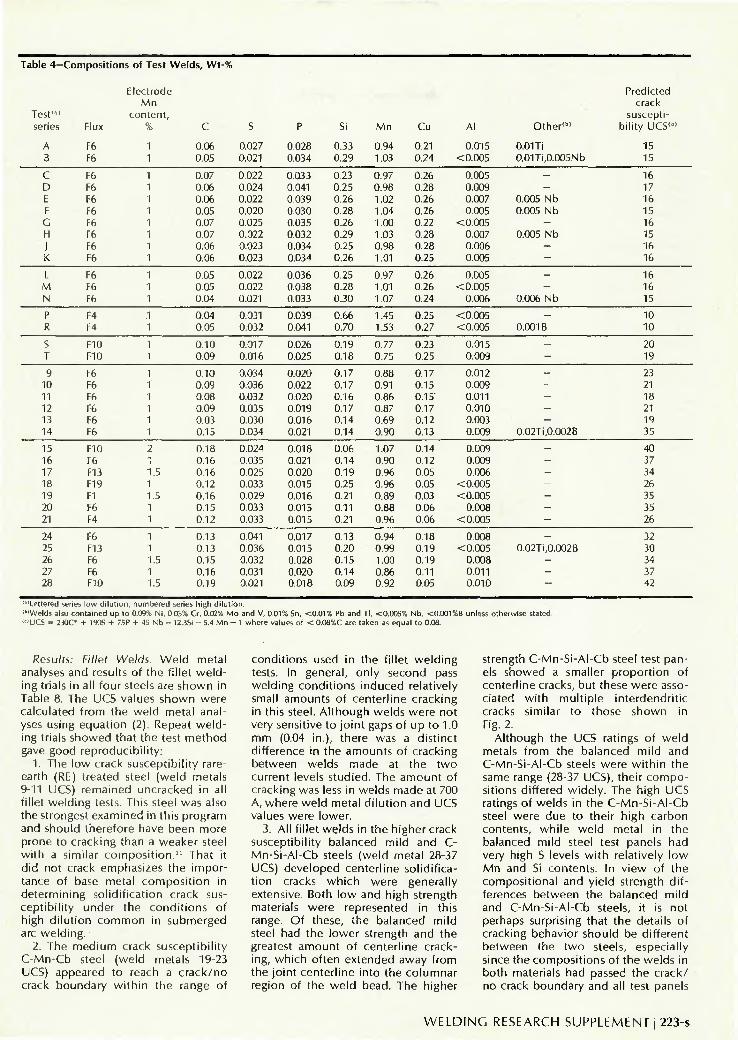
Table 4-
Test"" series
A B
C D E F G H 1 K
L M N
P R
S T
9 10 11 12 13 14
15 16 17 18 19 20 21
24 25 26 27 28
-Compositions of Test Welds, Wt
Flux
F6 F6
F6 F6 F6 F6 F6 F6 F6 F6
F6 F6 F6
F4 F4
F10 F10
F6 F6 F6 F6 F6 F6
F10 F6 F13 F19 F1 F6 F4
F6 F13 F6 F6 F10
Electrode Mn
content, 0/
1.5
1.5
1.5
1.5
C
0.06 0.05
0.07 0.06 0.06 0.05 0.07 0.07 0.06 0.06
0.05 0.05 0.04
0.04 0.05
0.10 0.09
0.10 0.09 0.08 0.09 0.03 0.15
0.18 0.16 0.16 0.12 0.16 0.15 0.12
0.13 0.13 0.15 0.16 0.19
%
S
0.027 0.021
0.022 0.024 0.022 0.020 0.025 0.022 0.023 0.023
0.022 0.022 0.021
0.031 0.032
0.017 0.016
0.034 0.036 0.032 0.035 0.030 0.034
0.024 0.035 0.025 0.033 0.029 0.033 0.033
0.041 0.036 0.032 0.031 0.021
P
0.028 0.034
0.033 0.041 0.039 0.030 0.035 0.032 0.034 0.034
0.036 0.038 0.033
0.039 0.041
0.026 0.025
0.020 0.022 0.020 0.019 0.016 0.021
0.018 0.021 0.020 0.015 0.016 0.015 0.015
0.017 0.015 0.028 0.020 0.018
Si
0.33 0.29
0.23 0.25 0.26 0.28 0.26 0.29 0.25 0.26
0.25 0.28 0.30
0.66 0.70
0.19 0.18
0.17 0.17 0.16 0.17 0.14 0.14
0.06 0.14 0.19 0.25 0.21 0.11 0.21
0.13 0.20 0.15 0.14 0.09
M n
0.94 1.03
0.97 0.98 1.02 1.04 1.00 1.03 0.98 1.01
0.97 1.01 1.07
1.45 1.53
0.77 0.75
0.88 0.91 0.86 0.87 0.69 0.90
1.07 0.90 0.96 0.96 0.89 0.88 0.96
0.94 0.99 1.00 0.86 0.92
Cu
0.21 0.24
0.26 0.28 0.26 0.26 0.22 0.28 0.28 0.25
0.26 0.26 0.24
0.25 0.27
0.23 0.25
0.17 0.15 0.15 0.17 0.12 0.13
0.14 0.12 0.05 0.05 0.03 0.06 0.06
0.18 0.19 0.19 0.11 0.05
Al
0.015 <0.005
0.005 0.009 0.007 0.005
< 0.005 0.007 0.006 0.005
0.005 <0.005
0.006
<0.005 <0.005
0.015 0.009
0.012 0.009 0.011 0.010 0.003 0.009
0.009 0.009 0.006
<0.005 <0.005
0.008 < 0.005
0.008 < 0.005
0.008 0.011 0.010
Other" "
0.01 Ti 0.01Ti,0.005Nb
--
0.005 Nb 0.005 Nb
-0.005 Nb
--— -
0.006 Nb
-0.001 B
-------
0.02Ti,0.002B
--------
0.02Ti,0.002B
--—
Predicted crack
susceptibil i ty UCS" '
15 15
16 17 16 15 16 15 16 16
16 16 15
10 10
20 19
23 21 18 21 19 35
40 37 34 26 35 35 26
32 30 34 37 42
"Let tered series low d i l u t i on , numbered series h igh d i l u t i on . " W e l d s also conta ined up to 0.09% N i , 0.05% Cr, 0.02% M o and V, 0.01% Sn, < 0 . 0 1 % Pb and Ti, <0.005% N b , <0.001%B unless otherwise stated. "UCS = 230C* + 190S + 75P + 45 Nb - 12.3Si - 5.4 M n - 1 where values of < 0.08%C are taken as equal to 0.08.
Results: Fillet Welds. Weld metal analyses and results of the fillet welding trials in all four steels are shown in Table 8. The UCS values shown were calculated from the weld metal analyses using equation (2). Repeat welding trials showed that the test method gave good reproducibil ity:
1. The low crack susceptibility rare-earth (RE) treated steel (weld metals 9-11 UCS) remained uncracked in all fillet welding tests. This steel was also the strongest examined in this program and should therefore have been more prone to cracking than a weaker steel with a similar composi t ion." That it did not crack emphasizes the importance of base metal composit ion in determining solidification crack susceptibility under the condit ions of high di lut ion common in submerged arc welding.
2. The medium crack susceptibility C-Mn-Cb steel (weld metals 19-23 UCS) appeared to reach a crack/no crack boundary wi th in the range of
conditions used in the fillet welding tests. In general, only second pass welding conditions induced relatively small amounts of centerline cracking in this steel. Although welds were not very sensitive to joint gaps of up to 1.0 mm (0.04 in.), there was a distinct difference in the amounts of cracking between welds made at the two current levels studied. The amount of cracking was less in welds made at 700 A, where weld metal di lut ion and UCS values were lower.
3. All fillet welds in the higher crack susceptibility balanced mild and C-Mn-Si-AI-Cb steels (weld metal 28-37 UCS) developed centerline solidification cracks which were generally extensive. Both low and high strength materials were represented in this range. Of these, the balanced mild steel had the lower strength and the greatest amount of centerline cracking, which often extended away from the joint centerline into the columnar region of the weld bead. The higher
strength C-Mn-Si-AI-Cb steel test panels showed a smaller proportion of centerline cracks, but these were associated with mult iple interdendritic cracks similar to those shown in Fig. 2.
Although the UCS ratings of weld metals from the balanced mild and C-Mn-Si-AI-Cb steels were wi th in the same range (28-37 UCS), their compositions differed widely. The high UCS ratings of welds in the C-Mn-Si-AI-Cb steel were due to their high carbon contents, whi le weld metal in the balanced mild steel test panels had very high S levels wi th relatively low Mn and Si contents. In view of the compositional and yield strength differences between the balanced mild and C-Mn-Si-AI-Cb steels, it is not perhaps surprising that the details of cracking behavior should be different between the two steels, especially since the compositions of the welds in both materials had passed the crack/ no crack boundary and all test panels
W E L D I N G RESEARCH SUPPLEMENT I 223-s
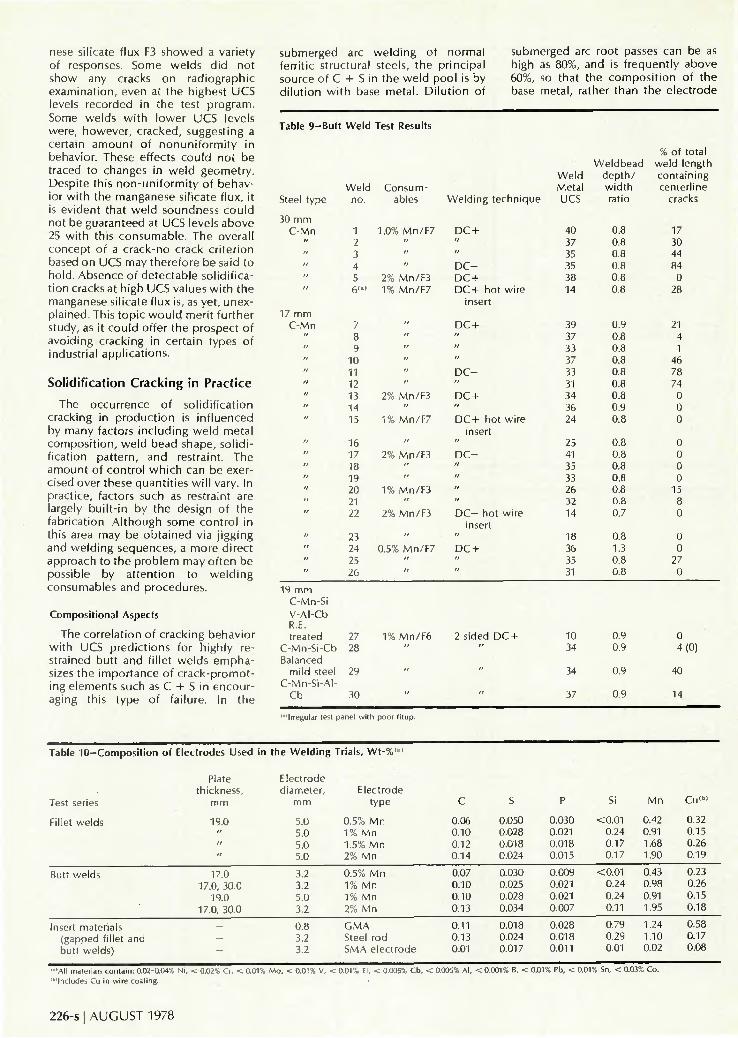
contained solidification cracks. A plot of weld metal UCS rating
against percentage centerline cracking for fillet welds (Fig. 11) shows that weld metal centerline cracking did not occur under the welding conditions in question until the weld metal reached 19 UCS. The general conformity between results at 700 and 800 A suggests that the reduction in welding current to 700 A affected weld metal cracking by changing di lut ion levels and hence UCS values.
Commercial Fillet Welds
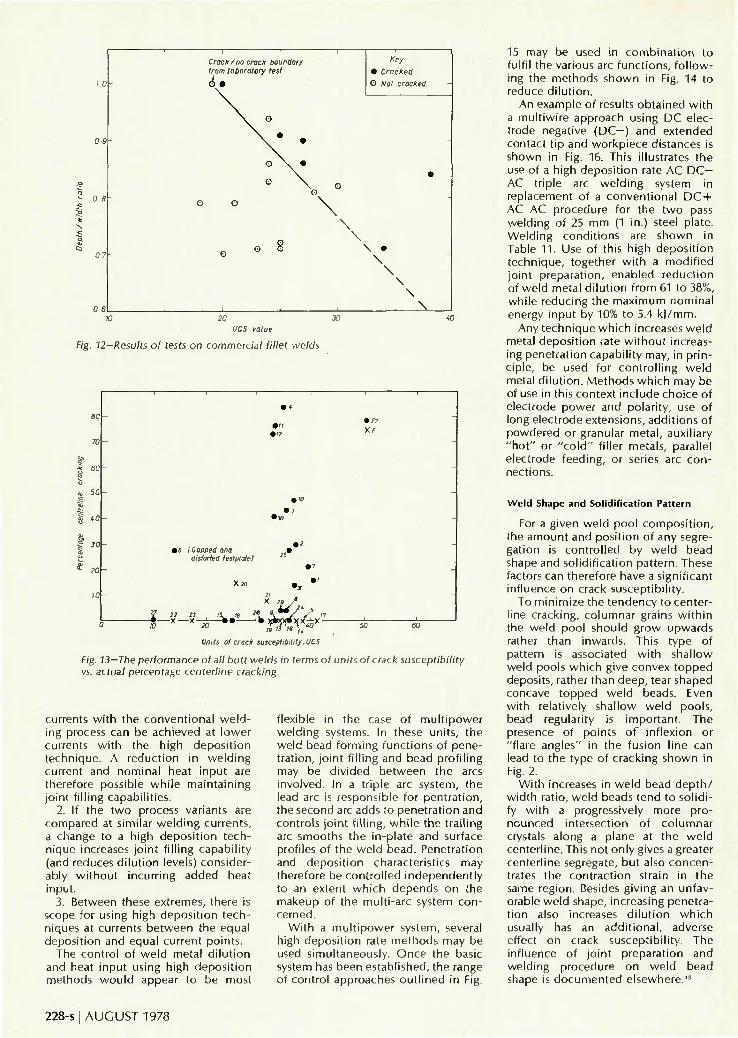
An opportunity to extend the correlation between Transvarestraint testing and actual welds was afforded when we were allowed to examine some procedural tests made commercially on 12 mm (0.47 in.) thick mild steel plate wi th a range of welding conditions, fluxes and electrodes. The compositions of most of the welds was re-checked and their dep th /w id th ratio estimated, the depth being measured from the line joining the weld toes as described in the literature10 to take account of weld convexity or concavity.
The results of these tests, plotted in terms of UCS crack susceptibility values against depth /w id th ratio, are compared in Fig. 12 wi th the well established crack-no crack boundary of 19 UCS from 19 mm plate determined in the last section. Figure 12 demonstrates that, as expected, decreasing the depth /w id th ratio increases the UCS level at which cracking starts. The critical data are insufficient for an accurate estimation of the size of the effect. However, by placing the crack-no crack boundary as a straight line in a conservative manner, it appears that reducing the depth / width ratio from 1.0 to 0.8 allows the weld metal UCS to be increased by 9 UCS. It would not be prudent to extrapolate the results further, particularly when it is realized that, in Transvarestraint tests on 15 mm (0.6 in.) plate with depth/width ratios of 0.5-0.6, cracking occurs wi th no imposed deflection when the UCS values exceed 30 UCS.
Butt Welds
All butt weld test-panels were made from plates 800 X 100 mm in size (3172 x 3.9 in.). Machined joint preparations used in the various plate thicknesses are shown in Fig. 10B and 10C. As in the case of the fillet welds, the objective in selecting welding procedures was to find conditions which combined medium joint severity in terms of bead shape and di lut ion wi th a regular weld surface. Welding procedures used in the butt weld test
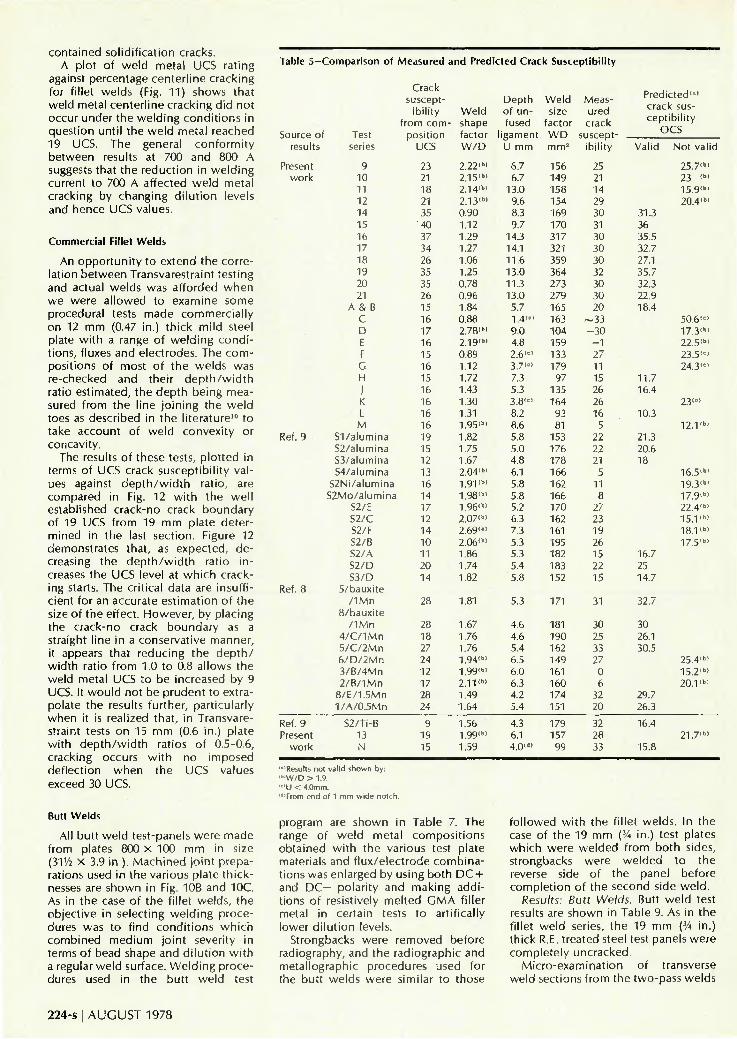
Table 5 -
Source o results
Present work
Ref. 9
Ref. 8
Ref. 9 Present
work
Comparison of Measured and Predicted Crac
f Test series
9 10 11 12 14 15 16 17 18 19 20 21
A & B C D E F G H
I K L
M S1/alumina S2/alumina S3/alumina S4/alumina
S2Ni/alumina S2Mo/alumina
S2/E S2/C S2/F S2/B S2/A S2/D S3/D
5/bauxite /1Mn
8/bauxite /1Mn
4 /C /1Mn 5 /C /2Mn 6 / D / 2 M n 3/B/4Mn 2 /B /1Mn
8/E/1.5Mn 1/A/0.5Mn
S2/TFB 13 N
Crack suscept
ibil i ty from com
position UCS
23 21 18 21 35 40 37 34 26 35 35 26 15 16 17 16 15 16 15 16 16 16 16 19 15 12 13 16 14 17 12 14 10 11 20 14
28
28 18 27 24 12 17 28 24
9 19 15
Weld shape factor W / D
2.22"" 2.15(b> 2.14"" 2.13"" 0.90 1.12 1.29 1.27 1.06 1.25 0.78 0.96 1.84 0.88 2.78"" 2.19"" 0.89 1.12 1.72 1.43 1.30 1.31 1.95"" 1.82 1.75 1.67 2.04"" 1.91"" 1.98"" -I 9 6 <M
2.07"" 2.69"" 2.06"" 1.86 1.74 1.82
1.81
1.67 1.76 1.76 1.94"" 1.99"" 2.11"" 1.49 1.64
1.56 1.99"" 1.59
Depth of unfused
ligament U mm
6.7 6.7
13.0 9.6 8.3 9.7
14.3 14.1 11.6 13.0 11.3 13.0
5.7 1,4"' 9.0 4.8 2.6"" 3.7"» 7,3 5.3 3.8"" 8,2 8.6 5,8 5.0 4.8 6.1 5.8 5.8 5.2 6.3 7,3 5,3 5,3 5.4 5.8
5.3
4.6 4.6 5.4 6.5 6.0 6.3 4.2 5.4
4.3 6.1 4.0""
k Susceptibility
Weld size
factor W D mm2
156 149 158 154 169 170 317 321 359 364 273 279 165 163 104 159 133 179 97
135 164 93 81
153 176 178 166 162 166 170 162 161 195 182 183 152
171
181 190 162 149 161 160 174 151
179 157 99
Measured crack
susceptibi l i ty
25 21 14 29 30 31 30 30 30 32 30 30 20
~ 3 3 - 3 0
- 1 27 11 15 26 26 16
5 22 22 21
5 11 8
27 23 19 26 15 22 15
31
30 25 33 27 0 6
32 20
32 28 33
Predicted"" crack susceptibi l i ty
OCS
Valid
31.3 36 35.5 32.7 27.1 35.7 32.3 22.9 18.4
11.7 16.4
10.3
21.3 20.6 18
16.7 25 14.7
32.7
30 26.1 30.5
29.7 26.3
16.4
15.8
Not valid
25.7"" 23 " " 15.9"" 20.4""
50.6"" 17.3"" 22.5"" 23.5'«» 24.3""
23 " '
12 .1 " "
16.5"" 19.3"" 17.9"" 22.4"" 15 .1" " 18 .1" " 17.5""
25.4"" 15.2"" 20.1" "
21.7""
'"Results not valid shown by: ' "W/D > 1.9. l "U < 4.0mm. '"From end of 1 mm wide notch.
program are shown in Table 7. The range of weld metal compositions obtained wi th the various test plate materials and f lux/electrode combinations was enlarged by using both DC + and DC— polarity and making additions of resistively melted GMA filler metal in certain tests to artifically lower di lut ion levels.
Strongbacks were removed before radiography, and the radiographic and metallographic procedures used for the butt welds were similar to those
fol lowed with the fillet welds. In the case of the 19 mm (V* in.) test plates which were welded from both sides, strongbacks were welded to the reverse side of the panel before completion of the second side weld.
Results: Butt Welds. Butt weld test results are shown in Table 9. As in the fillet weld series, the 19 mm (lA in.) thick R.E. treated steel test panels were completely uncracked.
Micro-examination of transverse weld sections from the two-pass welds
224-sl AUGUST 1978
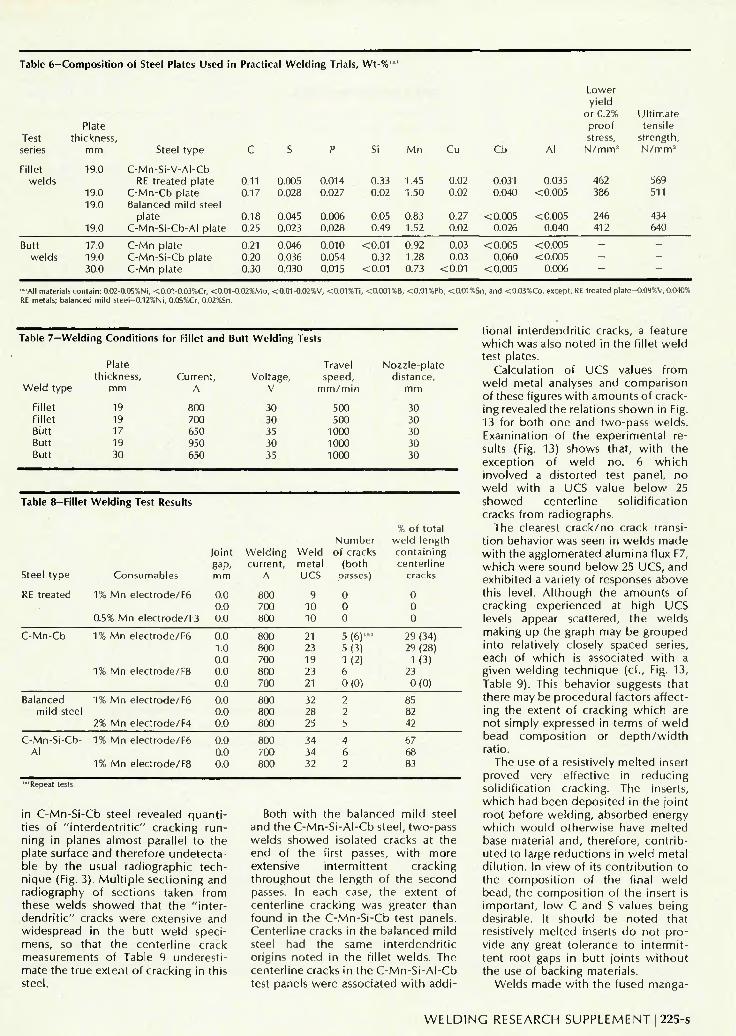
Table 6-Composi t ion of Steel Plates Used in Practical Weld ing Trials, W t - % "
Test series
Fillet welds
Plate thickness,
mm
19.0
19.0 19.0
19.0
Steel type
C-Mn-Si-V-AI-Cb RE treated plate
C-Mn-Cb plate Balanced mild steel
plate C-Mn-Si-Cb-AI plate
C
0.11 0.17
0.18 0.25
S
0.005 0.028
0.045 0.023
P
0.014 0.027
0.006 0.028
Si
0.33 0.02
0.05 0.49
Mn
1.45 1.50
0.83 1.52
Cu Cb Al
0.02 0.031 0.035 0.02 0.040 <0.005
0.27 <0.005 <0.005 0.02 0.026 0.040
Lower yield
or 0.2% proof stress, N/mm'J
462 386
246 412
Ult imate tensile
strength, N /mm 2
569 511
434 640
Butt welds
17.0 19.0 30,0
C-Mn plate C-Mn-Si-Cb plate C-Mn plate
0.21 0.20 0.30
0.046 0.036 0.030
0.010 0.054 0.015
<0.01 0.32
<0.01
0.92 1.28 0.73
0.03 0.03
<0.01
< 0.005 0.060
< 0.005
< 0.005 < 0.005
0.006
--—
' "All materials contain: 0.02-0.05%Ni, <0.01-0.03%Cr, <0.01-0.02%Mo, <0.01-0.02%V, <0.01%Ti RE metals; balanced mild steel-0.12%Ni, 0.05%Cr, 0.02%Sn.
< 0.001 %B, <0.01%Pb, <0.01%Sn, and <0.03%Co, except: RE treated plate-0.09%V, 0.040°/i
Table 7--Weldi
Weld type
Fillet Fillet Butt Butt Butt
ing
th
Condit ions for Fillet an
Plate ickness, mm
19 19 17 19 30
Current, A
800 700 650 950 650
id Butt Weld ing
Voltage, V
30 30 35 30 35
Tests
Travel speed,
m m / m i n
500 500
1000 1000 1000
Nozzle-plate distance,
mm
30 30 30 30 30
Table 8—Fillet Weld ing Test Results
Steel type Consumables
RE treated 1% Mn electrode/F6
0.5% Mn electrode/F3
C-Mn-Cb 1% Mn electrode/F6
1% Mn electrode/F8
Joint gap, mm
0.0 0.0 0.0
0.0 1.0 0.0 0.0 0.0
Weld ing current,
A
800 700 800
800 800 700 800 700
We ld metal UCS
9 10 10
21 23 19 23 21
Number of cracks
(both passes)
0 0 0
5 ( 6 ) " " 5(3) 1 (2) 6 0(0)
% of total weld length containing centerline
cracks
0 0 0
29 (34) 29 (28)
1 (3) 23 0(0)
Balanced mild steel
1% Mn electrode/F6
2% Mn electrode/F4
0.0 0.0 0.0
800 800 800
32 28 25
2 2 5
85 82 42
C-Mn Al
-Si -Cb- 1%
1%
Mn
Mn
electrode/F6
electrode/F8
0.0 0.0 0.0
800 700 800
34 34 32
4 6 2
67 68 83
""Repeat tests.
in C - M n - S i - C b steel revealed q u a n t i t ies o f " i n t e r d e n t r i t i c " c rack i ng r u n n ing in p lanes a lmos t para l le l t o the p la te surface and t he re fo re u n d e t e c t a -b le by the usual r ad iog raph i c t e c h n ique (Fig. 3). M u l t i p l e s e c t i o n i n g and rad iography of sec t ions taken f r o m these we lds s h o w e d tha t t he " i n t e r d e n d r i t i c " cracks w e r e ex tens ive and w idesp read in t he bu t t w e l d spec i mens, so tha t the c e n t e r l i n e crack measurements of Table 9 unde res t i mate t he t rue ex ten t o f c rack i ng in th is steel.
Both w i t h t he ba lanced m i l d steel and the C - M n - S i - A I - C b steel , two -pass we lds s h o w e d iso la ted cracks at t h e end o f t h e f irst passes, w i t h m o r e extensive i n t e r m i t t e n t c rack ing t h r o u g h o u t the l eng th o f t he second passes. In each case, t h e ex ten t o f cen te r l i ne c rack ing was greater t h a n f o u n d in t he C - M n - S i - C b test panels . Cen te r l i ne cracks in t he b a l a n c e d m i l d steel had the same i n t e r d e n d r i t i c or ig ins n o t e d in t h e f i l le t w e l d s . The cen te r l i ne cracks in t he C - M n - S i - A I - C b test panels w e r e associated w i t h a d d i
t i ona l i n t e r d e n d r i t i c cracks, a fea tu re w h i c h was also n o t e d in t he f i l le t w e l d test plates.
Ca lcu la t i on o f UCS va lues f r o m w e l d meta l analyses and c o m p a r i s o n of these f igures w i t h a m o u n t s o f c racking revealed the re la t ions s h o w n in Fig. 13 for b o t h o n e and two -pass w e l d s . Examina t ion o f t he e x p e r i m e n t a l results (Fig. 13) shows tha t , w i t h t he excep t i on of w e l d no . 6 w h i c h i nvo l ved a d i s t o r t ed test pane l , no w e l d w i t h a UCS va lue b e l o w 25 s h o w e d cen te r l i ne s o l i d i f i c a t i o n cracks f r o m rad iographs .
The clearest c r a c k / n o crack t rans i t i o n behav io r was seen in w e l d s m a d e w i t h t he agg lomera ted a l u m i n a f lux F7, w h i c h w e r e s o u n d b e l o w 25 UCS, and exh ib i t ed a var ie ty o f responses above th is leve l . A l t h o u g h t h e a m o u n t s o f c rack ing expe r ienced at h i gh UCS levels appear sca t te red , t h e w e l d s mak ing up the graph may be g r o u p e d in to re la t ive ly c lose ly spaced series, each of w h i c h is associated w i t h a g iven w e l d i n g t e c h n i q u e (cf., Fig. 13, Table 9). This behav io r suggests t ha t there may be p rocedu ra l fac tors a f fec t ing the extent o f c rack ing w h i c h are no t s imp ly expressed in te rms of w e l d bead c o m p o s i t i o n or d e p t h / w i d t h rat io.
The use of a resist ively m e l t e d insert p roved very e f fec t i ve in r e d u c i n g so l i d i f i ca t i on c rack ing . The inserts, w h i c h had been d e p o s i t e d in t h e j o i n t root be fo re w e l d i n g , abso rbed energy w h i c h w o u l d o t h e r w i s e have m e l t e d base mater ia l a n d , t he re fo re , c o n t r i b u ted to large r e d u c t i o n s in w e l d meta l d i l u t i o n . In v i e w of its c o n t r i b u t i o n to the c o m p o s i t i o n of t he f ina l w e l d bead, the c o m p o s i t i o n o f t he insert is i m p o r t a n t , l o w C and S va lues b e i n g desi rable. It s h o u l d be n o t e d tha t resist ively m e l t e d inserts d o n o t p r o v ide any great t o le rance to i n t e r m i t t en t roo t gaps in bu t t j o in ts w i t h o u t t he use o f b a c k i n g mater ia ls .
W e l d s m a d e w i t h t h e fused manga -
W E L D I N G R E S E A R C H S U P P L E M E N T I 225 -s
nese silicate flux F3 showed a variety of responses. Some welds did not show any cracks on radiographic examination, even at the highest UCS levels recorded in the test program. Some welds wi th lower UCS levels were, however, cracked, suggesting a certain amount of nonuniformity in behavior. These effects could not be traced to changes in weld geometry. Despite this non-uniformity of behavior with the manganese silicate flux, it is evident that weld soundness could not be guaranteed at UCS levels above 25 with this consumable. The overall concept of a crack-no crack criterion based on UCS may therefore be said to hold. Absence of detectable solidification cracks at high UCS values wi th the manganese silicate flux is, as yet, unexplained. This topic wou ld merit further study, as it could offer the prospect of avoiding cracking in certain types of industrial applications.
S o l i d i f i c a t i o n C r a c k i n g in P r a c t i c e
The occu r rence o f s o l i d i f i c a t i o n c rack ing in p r o d u c t i o n is i n f l u e n c e d by many fac tors i n c l u d i n g w e l d meta l c o m p o s i t i o n , w e l d bead shape, s o l i d i f i ca t ion p a t t e r n , a n d restra int . The a m o u n t o f c o n t r o l w h i c h can be exerc ised over these quan t i t i e s w i l l vary. In prac t ice , fac tors such as restra int are largely b u i l t - i n by t he des ign o f t h e fab r i ca t i on . A l t h o u g h some c o n t r o l in th is area may be o b t a i n e d v ia j i gg ing and w e l d i n g sequences , a m o r e d i rec t app roach to t h e p r o b l e m may o f t e n be possib le by a t t e n t i o n t o w e l d i n g consumab les a n d p rocedu res .
Compositional Aspects
The co r re la t i on o f c rack ing behav io r w i t h UCS p r e d i c t i o n s fo r h i gh l y restra ined bu t t and f i l le t w e l d s e m p h a sizes t he i m p o r t a n c e o f c r a c k - p r o m o t ing e lemen ts such as C + S in e n c o u r aging th is t ype o f fa i lu re . In t he
submerged arc w e l d i n g o t n o r m a l fer r i t ic s t ruc tu ra l steels, t h e p r i nc ipa l source of C + S in t he w e l d p o o l is by d i l u t i o n w i t h base me ta l . D i l u t i o n of
submerged arc roo t passes can be as h igh as 80%, and is f r e q u e n t l y above 60%, so tha t the c o m p o s i t i o n of t h e base me ta l , rather t h a n t h e e l ec t r ode
Table 9-But t Weld Test Results
Steel type
30 mm C-Mn
17 mm C-Mn
Weld no.
1 2 3 4 5 6'"
9 10 11 12 13 14 15
16 17 18 19 20 21 22
23 24 25 26
Consumables
1.0% Mn/F7
2% Mn/F3 1% Mn/F7
2% Mn/F3
1% Mn/F7
2% Mn/F3
1% Mn/F3
2% Mn/F3
Welding technique
DC +
D C -DC + D C + hot wire
insert
DC +
D C -
DC +
D C + hot wire insert
D C -
D C - hot wire insert
% of total Weldbead weld length
Weld dep th / containing Metal w id th centerline UCS ratio cracks
0.5% Mn/F7 DC +
40 37 35 35 38 14
39 37 33 37 33 31 34 36 24
25 41 35 33 26 32 14
18 36 35 31
19 mm C-Mn-Si V-AI-Cb R.E. treated
C-Mn-Si-Cb Balanced
mild steel C-Mn-Si-AI-
Cb
27 28
29
30
1% Mn/F6 2 sided DC + 10 34
34
37
"'Irregular test panel with poor fitup.
0.9 0.8 0.8 0.8 0.8 0.8 0.8 0.9 0.8
0.8 0.8 0.8 0.8 0.8 0.8 0.7
0.8 1.3 0.8 0.8
0.9 0.9
0.9
0.9
17 30 44 84
0 28
21 4 1
46 78 74 0 0 0
0 0 0 0
15
0 0
27 0
0 4(0)
40
14
Table 10-Composi t ion of Electrodes Used in the Welding Trials, Wt-%'
Test series
Fillet welds
Butt welds
Insert materials (gapped fillet and butt welds)
Plate thickness,
mm
19.0
17.0 17.0, 30.0
19.0 17.0, 30.0
Electrode diameter,
mm
5.0 5.0 5.0 5.0
Electrode type
0.5% Mn 1% Mn 1.5% Mn 2% Mn
0.06 0.10 0.12 0.14
0.050 0.028 0.018 0.024
0.030 0.021 0.018 0.015
Si
<0.01 0.24 0.17 0.17
3.2 3.2 5.0 3.2
0.5% Mn 1% Mn 1% M n 2% M n
0.07 0.10 0.10 0.13
0.030 0.025 0.028 0.034
0.009 <0.01 0.021 0.24 0.021 0.24 0.007 0.11
Mn
0.42 0.91 1.68 1.90
0.43 0.98 0.91 1.95
0.8 3.2 3.2
GMA Steel rod SMA electrode
0.11 0.13 0.01
0.018 0.024 0.017
0.028 0.79 0.018 0.29 0.011 0.01
1.24 1.10 0.02
"All materials contain: 002-0.04% Ni, < 0.02% Cr, < 0.01% Mo, < 0.01% V, < 0.01% Ti, < 0.005% Cb, < 0.005% Al, < 0.001% B. < 0,01% Pb, < 0.01% Sn, < 0.03% Co. '"Includes Cu in wire coating.
C u " "
0.32 0.15 0.26 0.19
0.23 0.26 0.15 0.18
0.58 0.17 0.08
2 2 6 - s l A U G U S T 1978
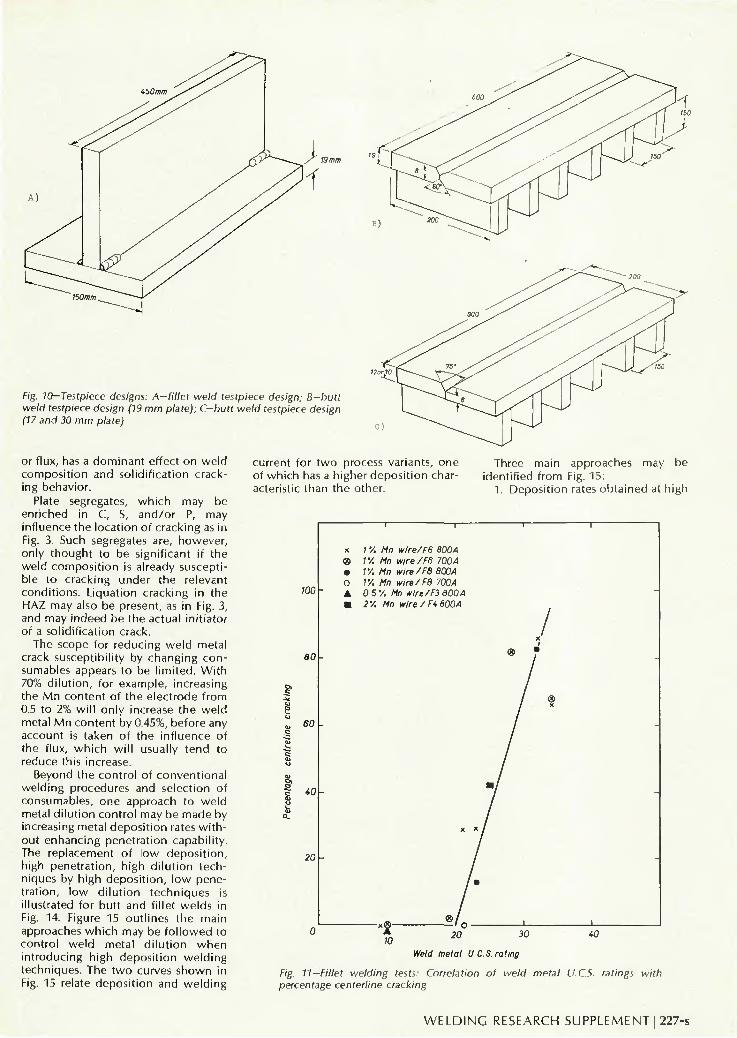
Fig. 10-Testpiece designs: A—fillet weld testpiece design; B-butt weld testpiece design (19 mm plate); C-butt weld testpiece design (17 and 30 mm plate)
or f lux , has a d o m i n a n t e f fect o n w e l d c o m p o s i t i o n and s o l i d i f i c a t i o n cracking behav ior .
Plate segregates, w h i c h may be en r i ched in C, S, a n d / o r P, may i n f l uence t h e l o c a t i o n o f c rack i ng as in Fig. 3. Such segregates are, h o w e v e r , o n l y t h o u g h t t o be s ign i f i can t if the w e l d c o m p o s i t i o n is a l ready suscep t i b le t o c rack ing unde r t he re levant c o n d i t i o n s . L i q u a t i o n c rack i ng in t he H A Z may also be present , as in Fig. 3, and may i n d e e d be t h e ac tua l i n i t i a t o r o f a so l i d i f i ca t i on crack.
The scope fo r r e d u c i n g w e l d meta l crack suscep t ib i l i t y by c h a n g i n g c o n sumables appears t o be l i m i t e d . W i t h 70% d i l u t i o n , fo r e x a m p l e , inc reas ing the M n c o n t e n t o f t he e l e c t r o d e f r o m 0.5 to 2% w i l l o n l y increase t h e w e l d meta l M n c o n t e n t by 0.45%, b e f o r e any accoun t is taken o f t he i n f l u e n c e o f the f lux, w h i c h w i l l usual ly t e n d to reduce this increase.
Beyond t h e c o n t r o l o f c o n v e n t i o n a l w e l d i n g p rocedures and se lec t i on of consumab les , o n e a p p r o a c h to w e l d meta l d i l u t i o n c o n t r o l may be m a d e by increasing meta l d e p o s i t i o n rates w i t h o u t e n h a n c i n g p e n e t r a t i o n capab i l i t y . The rep lacemen t o f l o w d e p o s i t i o n , h igh p e n e t r a t i o n , h igh d i l u t i o n t e c h n iques by h i gh d e p o s i t i o n , l o w p e n e t r a t i on , l o w d i l u t i o n t e c h n i q u e s is i l lus t ra ted fo r b u t t and f i l le t w e l d s in Fig. 14. Figure 15 o u t l i n e s t he ma in approaches w h i c h may be f o l l o w e d to c o n t r o l w e l d meta l d i l u t i o n w h e n i n t r o d u c i n g h igh d e p o s i t i o n w e l d i n g techn iques . T h e t w o curves s h o w n in Fig. 15 relate d e p o s i t i o n and w e l d i n g
cur rent fo r t w o process var ian ts , o n e of w h i c h has a h igher d e p o s i t i o n char acter ist ic t han t h e o ther .
Three ma in approaches may be i den t i f i ed f r o m Fig. 15:
1. D e p o s i t i o n rates o b t a i n e d at h i g h
100
ao
so
c 40
20 -
1 •/. Mn wire/F6 800A IV. Mn wire/Fe 700A IV. Mn wlre/FB 800A IV. Mn wire/F8 700 A 0 5V. Mn wire/F3 800A 2 V. Mn wire / F4 800'A
I
20 30
Weld metal UCS. rating
40
Fig. 11—Fillet welding tests: Correlation of weld metal U.C.S. ratings with percentage centerline cracking
WELDING RESEARCH SUPPLEMENT I 227-s
10
0-9
o a
07
0 f>
Crack /no crack boundary tram laboratory test
O *
\ o
\ •
o \
o
o o
o • §
•
•
1
o o
\
Key
• Cracked
O Not cracked
-
•
\ \
\ • \
\ N
N \
10 20 30 UCS value
Fig. 12—Results of tests on commercial fillet welds
• n xr
• '0
• 3
96 (Gapped and distorted testplate)
2_W * !L/\
Units of crack susceptibility. UCS
Fig. 13—The performance of all butt welds in terms of units of crack susceptibility vs. actual percentage centerline cracking
currents with the conventional welding process can be achieved at lower currents with the high deposition technique. A reduction in welding current and nominal heat input are therefore possible whi le maintaining joint fi l l ing capabilities.
2. If the two process variants are compared at similar welding currents, a change to a high deposition technique increases joint f i l l ing capability (and reduces di lut ion levels) considerably without incurring added heat input.
3. Between these extremes, there is scope for using high deposition techniques at currents between the equal deposition and equal current points.
The control of weld metal di lut ion and heat input using high deposition methods would appear to be most
flexible in the case of mult ipower welding systems. In these units, the weld bead forming functions of penetration, joint f i l l ing and bead profi l ing may be divided between the arcs involved. In a triple arc system, the lead arc is responsible for pentration, the second arc adds to penetration and controls joint f i l l ing, whi le the trail ing arc smooths the in-plate and surface profiles of the weld bead. Penetration and deposition characteristics may therefore be controlled independently to an extent which depends on the makeup of the multi-arc system concerned.
With a mult ipower system, several high deposition rate methods may be used simultaneously. Once the basic system has been established, the range of control approaches outl ined in Fig.
15 may be used in combination to fulfil the various arc functions, fo l lowing the methods shown in Fig. 14 to reduce di lut ion.
An example of results obtained wi th a multiwire approach using DC electrode negative ( D C - ) and extended contact t ip and workpiece distances is shown in Fig. 16. This illustrates the use of a high deposition rate AC D C -AC triple arc welding system in replacement of a conventional DC + AC AC procedure for the two pass welding of 25 mm (1 in.) steel plate. Welding conditions are shown in Table 11. Use of this high deposition technique, together wi th a modif ied joint preparation, enabled reduction of weld metal di lut ion from 61 to 38%, while reducing the maximum nominal energy input by 10% to 5.4 k ) /mm.
Any technique which increases weld metal deposition rate wi thout increasing penetration capability may, in principle, be used for control l ing weld metal di lut ion. Methods which may be of use in this context include choice of electrode power and polarity, use of long electrode extensions, additions of powdered or granular metal, auxiliary "ho t " or " c o l d " filler metals, parallel electrode feeding, or series arc connections.
Weld Shape and Solidification Pattern
For a given weld pool composit ion, the amount and position of any segregation is controlled by weld bead shape and solidification pattern. These factors can therefore have a significant influence on crack susceptibility.
To minimize the tendency to center-line cracking, columnar grains wi th in the weld pool should grow upwards rather than inwards. This type of pattern is associated wi th shallow weld pools which give convex topped deposits, rather than deep, tear shaped concave topped weld beads. Even with relatively shallow weld pools, bead regularity is important. The presence of points of inflexion or "flare angles" in the fusion line can lead to the type of cracking shown in Fig. 2.
With increases in weld bead dep th / width ratio, weld beads tend to solidify with a progressively more pronounced intersection of columnar crystals along a plane at the weld centerline. This not only gives a greater centerline segregate, but also concentrates the contraction strain in the same region. Besides giving an unfavorable weld shape, increasing penetration also increases di lut ion which usually has an additional, adverse effect on crack susceptibility. The influence of joint preparation and welding procedure on weld bead shape is documented elsewhere.13
228-s I AUGUST 1978
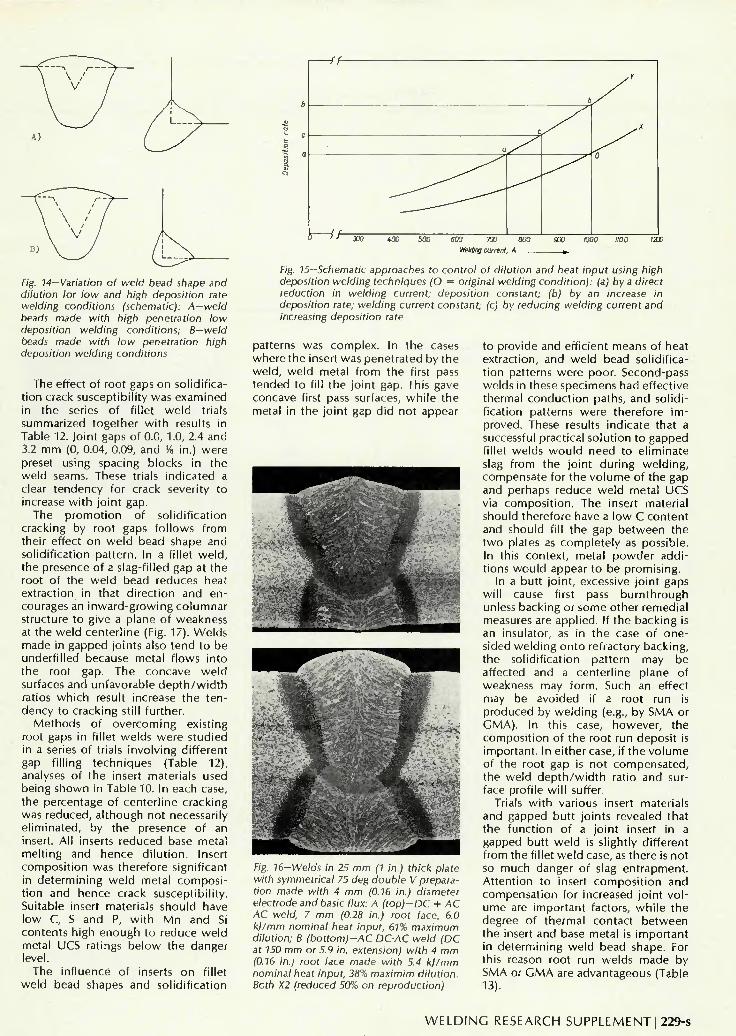
Fig. 14-Variation of weld bead shape and dilution for low and high deposition rate welding conditions (schematic): A—weld beads made with high penetration low deposition welding conditions; B—weld beads made with low penetration high deposition welding conditions
The effect of root gaps on solidification crack susceptibility was examined in the series of fillet weld trials summarized together wi th results in Table 12. Joint gaps of 0.0, 1.0, 2.4 and 3.2 mm (0, 0.04, 0.09, and Va in.) were preset using spacing blocks in the weld seams. These trials indicated a clear tendency for crack severity to increase wi th joint gap.
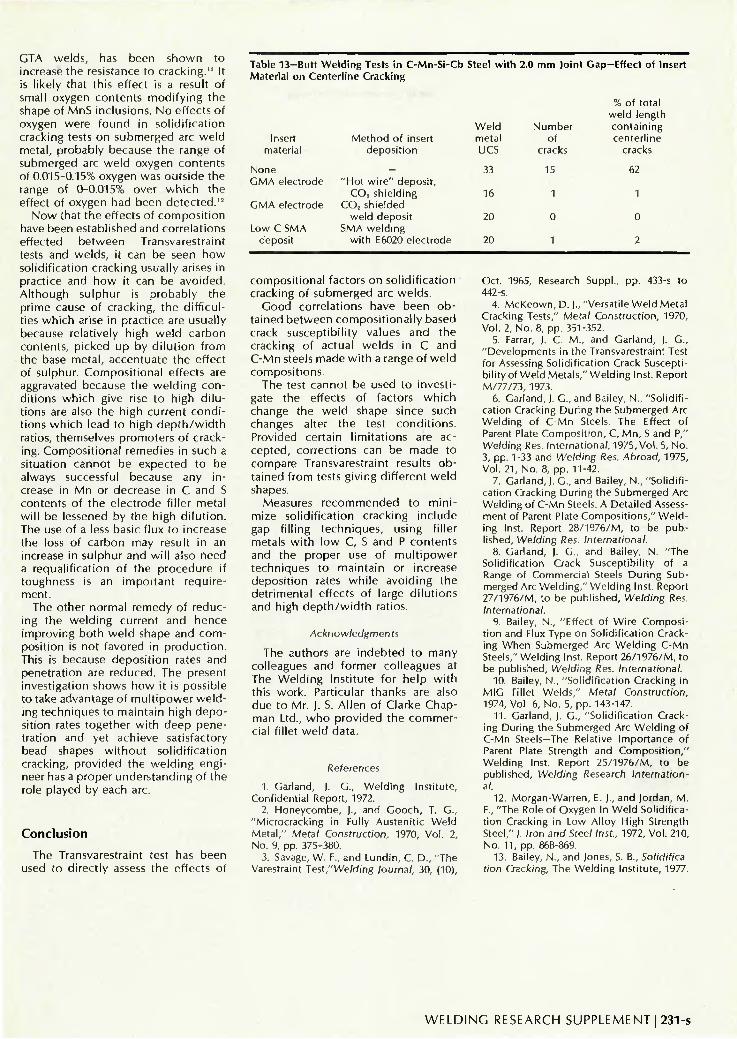
The promotion of solidification cracking by root gaps fol lows from their effect on weld bead shape and solidification pattern. In a fillet weld, the presence of a slag-filled gap at the root of the weld bead reduces heat extraction in that direction and encourages an inward-growing columnar structure to give a plane of weakness at the weld centerline (Fig. 17). Welds made in gapped joints also tend to be underfilled because metal flows into the root gap. The concave weld surfaces and unfavorable dep th /w id th ratios which result increase the tendency to cracking still further.
Methods of overcoming existing root gaps in fillet welds were studied in a series of trials involving different gap fill ing techniques (Table 12), analyses of the insert materials used being shown in Table 10. In each case, the percentage of centerline cracking was reduced, although not necessarily eliminated, by the presence of an insert. All inserts reduced base metal melting and hence di lut ion. Insert composition was therefore significant in determining weld metal composition and hence crack susceptibility. Suitable insert materials should have low C, S and P, wi th Mn and Si contents high enough to reduce weld metal UCS ratings below the danger level.
The influence of inserts on fillet weld bead shapes and solidification
600 TOO 800
Welding current, A —
Fig. 15—Schematic approaches to control of dilution and heat input using high deposition welding techniques (O = original welding condition): (a) by a direct reduction in welding current; deposition constant; (b) by an increase in deposition rate; welding current constant; (c) by reducing welding current and increasing deposition rate
patterns was complex. In the cases where the insert was penetrated by the weld, weld metal from the first pass tended to fill the joint gap. This gave concave first pass surfaces, whi le the metal in the joint gap did not appear
Fig. 16-Welds in 25 mm (1 in.) thick plate with symmetrical 75 deg double V preparation made with 4 mm (0.16 in.) diameter electrode and basic flux: A (top)-DC + AC AC weld, 7 mm (0.28 in.) root face, 6.0 k)/mm nominal heat input, 67% maximum dilution; B (bottom)-AC DC-AC weld (DC at 150 mm or 5.9 in. extension) with 4 mm (0.16 in.) root face made with 5.4 k)/mm nominal heat input, 38% maximim dilution. Both X2 (reduced 50% on reproduction)
to provide and efficient means of heat extraction, and weld bead solidification patterns were poor. Second-pass welds in these specimens had effective thermal conduction paths, and solidification patterns were therefore improved. These results indicate that a successful practical solution to gapped fillet welds would need to eliminate slag from the joint during welding, compensate for the volume of the gap and perhaps reduce weld metal UCS via composition. The insert material should therefore have a low C content and should fill the gap between the two plates as completely as possible. In this context, metal powder additions would appear to be promising.
In a butt joint, excessive joint gaps wil l cause first pass burnthrough unless backing or some other remedial measures are applied. If the backing is an insulator, as in the case of onesided welding onto refractory backing, the solidification pattern may be affected and a centerline plane of weakness may form. Such an effect may be avoided if a root run is produced by welding (e.g., by SMA or GMA). In this case, however, the composition of the root run deposit is important. In either case, if the volume of the root gap is not compensated, the weld depth /w id th ratio and surface profile wi l l suffer.
Trials wi th various insert materials and gapped butt joints revealed that the function of a joint insert in a gapped butt weld is slightly different from the fillet weld case, as there is not so much danger of slag entrapment. Attention to insert composit ion and compensation for increased joint vol ume are important factors, whi le the degree of thermal contact between the insert and base metal is important in determining weld bead shape. For this reason root run welds made by SMA or GMA are advantageous (Table 13).
W E L D I N G RESEARCH SUPPLEMENT I 229-s
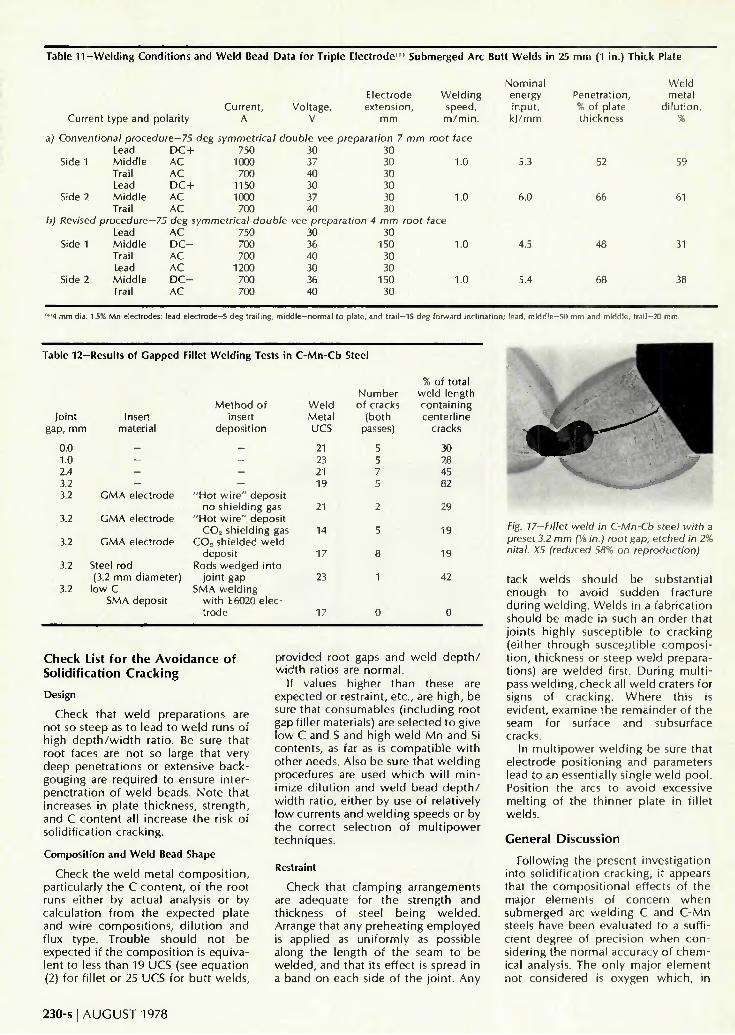
Table 11-Welding Conditions and Weld Bead Data for Triple Electrode ' Submerged Arc Butt Welds in 25 mm (1 in.) Thick Plate
Current, A
Voltage, V
Electrode extension,
mm
Welding speed, m/min .
Nominal energy input, k | /mm
Penetration, % of plate thickness
Weld metal
d i lut ion /o Current type and polarity
a) Conventional procedure-75 deg symmetrical double vee preparation 7 mm root face Lead DC+ 750 30 30
Side 1 Middle AC 1000 37 30 1.0 5.3 Trail AC 700 40 30 Lead DC+ 1150 30 30
Side 2 Middle AC 1000 37 30 1.0 6.0 Trail AC 700 40 30
h) Revised procedure—75 deg symmetrical double vee preparation 4 mm root face Lead AC 750 30 30
Side 1 Middle DC- 700 36 150 1.0 4.5 Trail AC 700 40 30 Lead AC 1200 30 30
Side 2 Middle DC- 700 36 150 1.0 5.4 Trail AC 700 40 30
52
66
48
68
59
61
31
38
"4 mm dia. 1.5% Mn electrodes: lead electrode-5 deg trailing, middle—normal to plate, and trail—15 deg forward inclination; lead, middle—50 mm and middle, trail—20 mm.
Table 12-
loint gap, mm
0.0 1.0 2.4 3.2 3.2
3.2
3.2
3.2
3.2
-Results of Gapped
Insert material
— ---
GMA electrode
GMA electrode
GMA electrode
Steel rod (3.2 mm diameter)
low C SMA deposit
Fillet Welding Tests in
Method of insert
deposit ion
— ---
"Ho t w i re " deposit no shielding gas
"Ho t w i re " deposit CO» shielding gas
C 0 2 shielded weld deposit
Rods wedged into joint gap
SMA welding with E6020 electrode
C-Mn-Cb Steel
Weld Metal UCS
21 23 21 19
21
14
17
23
17
Number of cracks
(both passes)
5 5 7 5
2
5
8
1
0
% of total weld length containing centerline
cracks
30 28 45 82
29
19
19
42
0
Check List for the Avoidance of Solidification Cracking
Design
Check that weld preparations are not so steep as to lead to weld runs of high depth /wid th ratio. Be sure that root faces are not so large that very deep penetrations or extensive back-gouging are required to ensure inter-penetration of weld beads. Note that increases in plate thickness, strength, and C content all increase the risk of solidification cracking.
Composition and Weld Bead Shape
Check the weld metal composit ion, particularly the C content, of the root runs either by actual analysis or by calculation from the expected plate and wire compositions, di lut ion and flux type. Trouble should not be expected if the composit ion is equivalent to less than 19 UCS (see equation (2) for fillet or 25 UCS for butt welds,
provided root gaps and weld dep th / width ratios are normal.
If values higher than these are expected or restraint, etc., are high, be sure that consumables (including root gap filler materials) are selected to give low C and S and high weld Mn and Si contents, as far as is compatible wi th other needs. Also be sure that welding procedures are used which wi l l minimize di lut ion and weld bead dep th / width ratio, either by use of relatively low currents and welding speeds or by the correct selection of mult ipower techniques.
Restraint
Check that clamping arrangements are adequate for the strength and thickness of steel being welded. Arrange that any preheating employed is applied as uniformly as possible along the length of the seam to be welded, and that its effect is spread in a band on each side of the joint. Any
Fig. 17—Fillet weld in C-Mn-Cb steel with a preset 3.2 mm (Va in.) root gap, etched in 2% nital. X5 (reduced 58% on reproduction)
tack welds should be substantial enough to avoid sudden fracture during welding. Welds in a fabrication should be made in such an order that joints highly susceptible to cracking (either through susceptible composit ion, thickness or steep weld preparations) are welded first. During mul t i pass welding, check all weld craters for signs of cracking. Where this is evident, examine the remainder of the seam for surface and subsurface cracks.
In mult ipower welding be sure that electrode positioning and parameters lead to an essentially single weld pool. Position the arcs to avoid excessive melting of the thinner plate in fillet welds.
General Discussion
Following the present investigation into solidification cracking, it appears that the compositional effects of the major elements of concern when submerged arc welding C and C-Mn steels have been evaluated to a sufficient degree of precision when considering the normal accuracy of chemical analysis. The only major element not considered is oxygen which, in
230-s I AUGUST 1978
GTA welds, has been shown to increase the resistance to cracking.12 It is likely that this effect is a result of small oxygen contents modifying the shape of MnS inclusions. No effects of oxygen were found in solidification cracking tests on submerged arc weld metal, probably because the range of submerged arc weld oxygen contents of 0.015-0.15% oxygen was outside the range of 0-0.015% over which the effect of oxygen had been detected.12
Now that the effects of composit ion have been established and correlations effected between Transvarestraint tests and welds, it can be seen how solidification cracking usually arises in practice and how it can be avoided. Although sulphur is probably the prime cause of cracking, the diff iculties which arise in practice are usually because relatively high weld carbon contents, picked up by di lut ion from the base metal, accentuate the effect of sulphur. Compositional effects are aggravated because the welding conditions which give rise to high di lutions are also the high current conditions which lead to high depth /w id th ratios, themselves promoters of cracking. Compositional remedies in such a situation cannot be expected to be always successful because any increase in Mn or decrease in C and S contents of the electrode filler metal will be lessened by the high di lut ion. The use of a less basic flux to increase the loss of carbon may result in an increase in sulphur and wi l l also need a requalification of the procedure if toughness is an important requirement.
The other normal remedy of reducing the welding current and hence improving both weld shape and composition is not favored in production. This is because deposition rates and penetration are reduced. The present investigation shows how it is possible to take advantage of mult ipower welding techniques to maintain high deposition rates together wi th deep penetration and yet achieve satisfactory bead shapes wi thout solidification cracking, provided the welding engineer has a proper understanding of the role played by each arc.
Conclusion
The Transvarestraint test has been used to directly assess the effects of
Table 13-Butt Welding Tests in C-Mn-Si-Cb Steel with 2.0 mm Joint Gap-Effect of Insert Material on Centerline Cracking
% of total weld length containing centerline
cracks Insert
material
None GMA electrode
GMA electrode
Low C SMA deposit
Method of insert deposition
"Hot wire" deposit, C02 shielding
CO, shielded weld deposit
SMA welding with E6020 electrode
Weld metal UCS
33
16
20
20
Number of
cracks
15
1
0
1
62
1
0
2
compositional factors on solidification cracking of submerged arc welds.
Good correlations have been obtained between compositionally based crack susceptibility values and the cracking of actual welds in C and C-Mn steels made with a range of weld compositions.
The test cannot be used to investigate the effects of factors which change the weld shape since such changes alter the test conditions. Provided certain limitations are accepted, corrections can be made to compare Transvarestraint results obtained from tests giving different weld shapes.
Measures recommended to minimize solidification cracking include gap fil l ing techniques, using filler metals wi th low C, S and P contents and the proper use of mult ipower techniques to maintain or increase deposition rates whi le avoiding the detrimental effects of large dilutions and high depth /w id th ratios.
Acknowledgments
The authors are indebted to many colleagues and former colleagues at The Welding Institute for help wi th this work. Particular thanks are also due to Mr. J. S. Allen of Clarke Chapman Ltd., who provided the commercial fillet weld data.
References
1. Garland, |. G., Welding Institute, Confidential Report, 1972,
2. Honeycombe, )., and Gooch, T. G., "Microcracking in Fully Austenitic Weld Metal," Metal Construction, 1970, Vol. 2, No. 9, pp. 375-380.
3. Savage, W. F., and Lundin, C. D., "The Varestraint Test,"We/ding lournal, 30, (10),
Oct. 1965, Research SuppL, pp. 433-s to 442-s.
4. McKeown, D. J., "Versatile Weld Metal Cracking Tests," Metal Construction, 1970, Vol. 2, No. 8, pp. 351-352.
5. Farrar, |. C. M., and Garland, ). G., "Developments in the Transvarestraint Test for Assessing Solidification Crack Susceptibility of Weld Metals," Welding Inst. Report M/77/73, 1973.
6. Garland, J. G., and Bailey, N., "Solidification Cracking During the Submerged Arc Welding of C-Mn Steels. The Effect of Parent Plate Composition, C, Mn, S and P," Welding Res. International, 1975, Vol. 5, No. 3, pp. 1-33 and Welding Res. Abroad, 1975, Vol. 21, No. 8, pp. 11-42.
7. Garland, |. G., and Bailey, N., "Solidification Cracking During the Submerged Arc Welding of C-Mn Steels. A Detailed Assessment of Parent Plate Compositions," Welding Inst. Report 28/1976/M, to be published, Welding Res. International.
8. Garland, J. G., and Bailey, N, "The Solidification Crack Susceptibility of a Range of Commercial Steels During Submerged Arc Welding," Welding Inst. Report 27/1976/M, to be published, Welding Res. International.
9. Bailey, N., "Effect of Wire Composition and Flux Type on Solidification Cracking When Submerged Arc Welding C-Mn Steels," Welding Inst. Report 26/1976/M, to be published, Welding Res. International.
10. Bailey, N., "Solidification Cracking in MIG Fillet Welds," Metal Construction, 1974, Vol. 6, No. 5, pp. 143-147.
11. Garland, J. G., "Solidification Cracking During the Submerged Arc Welding of C-Mn Steels—The Relative Importance of Parent Plate Strength and Composition," Welding Inst. Report 25/1976/M, to be published, Welding Research International.
12. Morgan-Warren, E. J., and )ordan, M. F., "The Role of Oxygen In Weld Solidification Cracking in Low Alloy High Strength Steel," /. Iron and Steel Inst., 1972, Vol. 210, No. 11, pp. 868-869.
13. Bailey, N., and |ones, S. B., Solidification Cracking, The Welding Institute, 1977.
W E L D I N G RESEARCH SUPPLEMENT I 231-s