Sime Darby Plantation Sdn Bhd - Bursa Malaysia Natural Resources / Malaysia Sime Darby Plantation...
18
Corporates Natural Resources / Malaysia Sime Darby Plantation Sdn Bhd 28 April 2017 1 Sime Darby Plantation Sdn Bhd Rating Type Rating Outlook Last Rating Action Long-Term Issuer Default Rating BBB+(EXP) Stable Assigned on 18 April 2017 Click here for full list of ratings Financial Summary (MYRm) Jun 2015 Jun 2016 Jun 2017F Jun 2018F Gross Revenue 10,322 11,913 15,393 16,851 Operating EBITDAR Margin (%) 20.6 17.8 21.9 26.1 FFO Margin (%) 11.3 10.5 14.2 17.5 FFO Fixed-Charge Coverage (x) 2.9 2.6 3.9 5.5 FFO-Adjusted Net Leverage (x) 8.0 7.3 3.5 2.5 Source: Fitch Key Rating Drivers Lower Debt Post-Restructuring: Sime Darby Plantation Sdn Bhd (SDP) is undergoing a debt restructuring as part of a plan by parent Sime Darby Berhad (Sime Darby, BBB+/Rating Watch Negative) to split into three listed pure-play entities. Fitch Ratings has assumed that SDP, which had about MYR8.3 billion of intercompany loans as at June 2016, will receive USD600 million of debt (including outstanding issuance under a USD1.5 billion sukuk programme) and MYR2.2 billion of perpetual subordinated sukuk (issued under a MYR3 billion programme) from Sime Darby. Fitch estimates the total debt to be transferred to SDP will be MYR4.9 billion by June 2017, when we expect the transfer to be completed. Large Scale, Well-Diversified: SDP is the world's largest palm oil company by planted area and production of fresh fruit bunches (FFB), with planted area of over 600,000 hectares in Malaysia, Indonesia, Papua New Guinea (PNG), Liberia and Solomon Islands. Around 70% of its revenue in the financial year to June 2016 (FY16) was derived from downstream palm products, such as cooking oil, produced from refineries in eight countries. SDP's scale and diversification reduces risks from weather-related events and changes in regulatory regimes, and gives the company better funding access. Its downstream manufacturing footprint also gives the company easier access to key markets in Asia and Europe. Upstream Metrics to Improve: SDP's upstream operating metrics of FFB yield and oil extraction rate (OER) are in line with the industry average. Old trees form around 30% of SDP's planted acreage. SDP is focusing on improving its operating metrics and age profile through accelerated replanting at a rate of 5%-7% in Indonesia and 5% in Malaysia in the next few years, compared with an average replanting rate of around 4% over FY14 to FY16. The company also plans to use its own high-yielding seed varieties and more mechanisation. Several estates in South Sumatra and Kalimantan in Indonesia have already shown an improvement in yield of around 20% since FY08. Sustainability Drives Long-Term Benefits: SDP is the world's largest producer of palm oil certified by the Roundtable on Sustainable Palm Oil. SDP makes up around 20% of the global certified sustainable palm oil (CSPO) production. The company has been focusing on deriving more value from its CSPO output through higher sales of physical oil, which could garner price premiums of up to USD15 a tonne on average over uncertified oil. We estimate that higher price realisations for certified sustainable products more than offset certification and implementation costs currently. The net benefit to SDP should improve with better access and more volumes to higher-margin markets in Europe and the US.
Transcript of Sime Darby Plantation Sdn Bhd - Bursa Malaysia Natural Resources / Malaysia Sime Darby Plantation...

Corporates
Natural Resources / Malaysia
Sime Darby Plantation Sdn Bhd
28 April 2017 1
Sime Darby Plantation Sdn Bhd
Rating Type Rating Outlook Last Rating Action
Long-Term Issuer Default Rating BBB+(EXP) Stable Assigned on 18 April 2017
Click here for full list of ratings
Financial Summary
(MYRm) Jun 2015 Jun 2016 Jun 2017F Jun 2018F
Gross Revenue 10,322 11,913 15,393 16,851
Operating EBITDAR Margin (%) 20.6 17.8 21.9 26.1
FFO Margin (%) 11.3 10.5 14.2 17.5
FFO Fixed-Charge Coverage (x) 2.9 2.6 3.9 5.5
FFO-Adjusted Net Leverage (x) 8.0 7.3 3.5 2.5
Source: Fitch
Key Rating Drivers
Lower Debt Post-Restructuring: Sime Darby Plantation Sdn Bhd (SDP) is undergoing a debt restructuring as part of a
plan by parent Sime Darby Berhad (Sime Darby, BBB+/Rating Watch Negative) to split into three listed pure-play entities.
Fitch Ratings has assumed that SDP, which had about MYR8.3 billion of intercompany loans as at June 2016, will receive
USD600 million of debt (including outstanding issuance under a USD1.5 billion sukuk programme) and MYR2.2 billion of
perpetual subordinated sukuk (issued under a MYR3 billion programme) from Sime Darby. Fitch estimates the total debt
to be transferred to SDP will be MYR4.9 billion by June 2017, when we expect the transfer to be completed.
Large Scale, Well-Diversified: SDP is the world's largest palm oil company by planted area and production of fresh fruit
bunches (FFB), with planted area of over 600,000 hectares in Malaysia, Indonesia, Papua New Guinea (PNG), Liberia
and Solomon Islands. Around 70% of its revenue in the financial year to June 2016 (FY16) was derived from downstream
palm products, such as cooking oil, produced from refineries in eight countries. SDP's scale and diversification reduces
risks from weather-related events and changes in regulatory regimes, and gives the company better funding access. Its
downstream manufacturing footprint also gives the company easier access to key markets in Asia and Europe.
Upstream Metrics to Improve: SDP's upstream operating metrics of FFB yield and oil extraction rate (OER) are in line
with the industry average. Old trees form around 30% of SDP's planted acreage. SDP is focusing on improving its
operating metrics and age profile through accelerated replanting at a rate of 5%-7% in Indonesia and 5% in Malaysia in
the next few years, compared with an average replanting rate of around 4% over FY14 to FY16. The company also plans
to use its own high-yielding seed varieties and more mechanisation. Several estates in South Sumatra and Kalimantan in
Indonesia have already shown an improvement in yield of around 20% since FY08.
Sustainability Drives Long-Term Benefits: SDP is the world's largest producer of palm oil certified by the Roundtable
on Sustainable Palm Oil. SDP makes up around 20% of the global certified sustainable palm oil (CSPO) production. The
company has been focusing on deriving more value from its CSPO output through higher sales of physical oil, which
could garner price premiums of up to USD15 a tonne on average over uncertified oil. We estimate that higher price
realisations for certified sustainable products more than offset certification and implementation costs currently. The net
benefit to SDP should improve with better access and more volumes to higher-margin markets in Europe and the US.
Corporates
Natural Resources / Malaysia
Sime Darby Plantation Sdn Bhd
28 April 2017 2
Healthy CPO Price Outlook: Malaysian free-on-board (FOB) spot prices for crude palm oil (CPO) have improved over
the last year to an average of around USD700 a tonne so far in 2017 from around USD500 at end-2015. The increase
was due to severely reduced output due to El-Nino related dry weather conditions and robust demand. As a result, palm
oil inventories contracted, with Malaysian inventories in February 2017 at their lowest in 10 years. Fitch expects CPO
prices to be sustained at around USD675 a tonne over the longer term given pressure from the price of substitutes. Palm
oil’s use as a feedstock in biodiesel production has resulted into a high positive correlation with crude oil price.
Moderate Leverage Expected: We expect SDP's FFO-adjusted net leverage to reduce to 2.5x by FY18, from 3.5x in
FY17. In addition to the proposed debt restructuring, SDP should benefit from better CPO prices from FY17. We have
also assumed cash proceeds from land sales in Malaysia for our forecasts.
Rating Derivation Relative to Peers
Rating Derivation versus Peers
Peer Comparison SDP's rating is at the same level as Sime Darby's. The plantation business, mainly oil palm cultivation and processing, was a key driver of Sime Darby's cash flows and earnings, and accounted for 27% and 44% of Sime Darby's consolidated FY16 revenue and EBITDA, respectively. The plantation business was considered Sime Darby's strongest division. As a standalone entity, SDP will have lower leverage than Sime Darby.
SDP's rating can be compared with that of Bunge Limited (BBB/Stable), which is a leading oilseed processing and logistics company with considerable geographical diversification that covers all major export and import markets. Like Bunge, SDP benefits from a large scale and geographical diversification. However, SDP has better profitability and lower leverage, which justifies a higher rating.
Parent/Subsidiary Linkage No Parent/Subsidiary Linkage is applicable.
Country Ceiling No Country Ceiling constraint was in effect for these ratings.
Operating Environment No Operating Environment influence was in effect for these ratings.
Other Factors Not applicable
Source: Fitch
Rating Sensitivities
We do not expect a positive rating action over the next 24 months, based on our forecast that the company's leverage
profile will remain consistent with its rating until FY19-FY20
Future Developments That May, Individually or Collectively, Lead to Negative Rating Action
Inability to improve FFO-adjusted net leverage to below 2.5x by FY20
Negative FCF generation on a sustained basis
Liquidity and Debt Structure
Adequate Liquidity: We estimate SDP to have around MYR500 million of unrestricted cash and MYR1.7 billion of
undrawn banking facilities at end-FY17. By comparison, debt due in FY18 is estimated at MYR2.7 billion, assuming
USD400 million of novated sukuk under the USD1.5 billion sukuk programme becoming due in January 2018. Despite our
forecast of free cash flow being inadequate to address debt maturities in FY18, we believe that SDP will be able to
address its debt maturities through refinancing, given its good funding access.

Corporates
Natural Resources / Malaysia
Sime Darby Plantation Sdn Bhd
28 April 2017 3
Debt Maturities and Liquidity at FYE17
Debt Maturities (MYRm)
FY18 2,725
FY19 760
FY20 620
FY21 620
After FY21 5,543
Total debt (excluding 50% equity credit to perpetual sukuk) 10,268
Liquidity Analysis (MYRm)
Unrestricted cash 511
Committed banking facilities 8,069
Available undrawn portion 1,667
Total Liquidity 2,178
Fitch Forecasted FY18 FCF (post dividend) 126
Short-term debt 2,725
Liquidity score [x] 0.8
Source: Fitch
Corporates
Natural Resources / Malaysia
Sime Darby Plantation Sdn Bhd
28 April 2017 4
Key Rating Issues
Lower Debt Post Restructuring
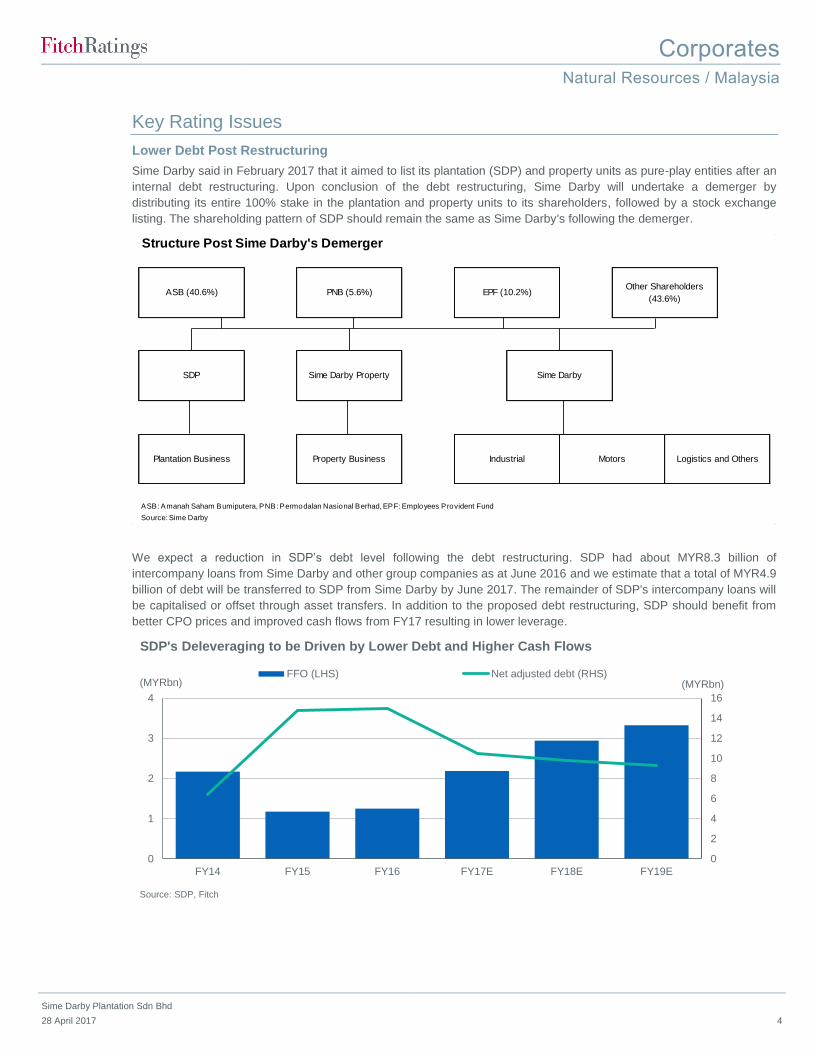
Sime Darby said in February 2017 that it aimed to list its plantation (SDP) and property units as pure-play entities after an
internal debt restructuring. Upon conclusion of the debt restructuring, Sime Darby will undertake a demerger by
distributing its entire 100% stake in the plantation and property units to its shareholders, followed by a stock exchange
listing. The shareholding pattern of SDP should remain the same as Sime Darby's following the demerger.
We expect a reduction in SDP’s debt level following the debt restructuring. SDP had about MYR8.3 billion of
intercompany loans from Sime Darby and other group companies as at June 2016 and we estimate that a total of MYR4.9
billion of debt will be transferred to SDP from Sime Darby by June 2017. The remainder of SDP's intercompany loans will
be capitalised or offset through asset transfers. In addition to the proposed debt restructuring, SDP should benefit from
better CPO prices and improved cash flows from FY17 resulting in lower leverage.
Structure Post Sime Darby's Demerger
ASB: Amanah Saham Bumiputera, PNB: Permodalan Nasional Berhad, EPF: Employees Provident Fund
Source: Sime Darby
ASB (40.6%) PNB (5.6%) EPF (10.2%)Other Shareholders
(43.6%)
SDP Sime Darby Property Sime Darby
Plantation Business Property Business Industrial Motors Logistics and Others
0
2
4
6
8
10
12
14
16
0
1
2
3
4
FY14 FY15 FY16 FY17E FY18E FY19E
SDP's Deleveraging to be Driven by Lower Debt and Higher Cash Flows
FFO (LHS) Net adjusted debt (RHS)
Source: SDP, Fitch
(MYRbn) (MYRbn)

Corporates
Natural Resources / Malaysia
Sime Darby Plantation Sdn Bhd
28 April 2017 5
Leading Palm Oil Company
SDP is the world's largest palm oil company by planted area and production of FFB, with plantation acreage in Malaysia,
Indonesia, PNG, Liberia and Solomon Islands. Relatively high yielding acreage in PNG and Solomon Islands was gained
through the acquisition of New Britain Palm Oil Limited (NBPOL) in March 2015.
603
483
349
246 240209 208
179135
0
100
200
300
400
500
600
700
SD
P
GA
R
Feld
a
Indoagri
Wilm
ar
KL
K
FR
IOI
Genting
Note: Data is as of June 2016Source: SDP
Comparison of Palm Oil Companies' Planted Area
(000 Ha)
9,621
6,967
4,336
4,0513,642
3,1753,145
2,3571,614
0
2,000
4,000
6,000
8,000
10,000
12,000
SD
P
GA
R
Feld
a
Wilm
ar
KL
K
Indoagri
IOI
FR
Genting
Note: Data is for FY16Source: SDP
Comparison of Palm Oil Companies' FFB Output
(000 tons)
50.9%
34.0%
0.3%
14.8%
Malaysia Indonesia Liberia NBPOL (PNG/SI)
Source: SDP
Share of Mature Acreage (FY16)
17%
14%
39%
29%
Immature 04 - 08 years
09 - 18 years Above 19 years
Source: SDP
Breakdown of Acreage by Age (FY16)
Corporates
Natural Resources / Malaysia
Sime Darby Plantation Sdn Bhd
28 April 2017 6
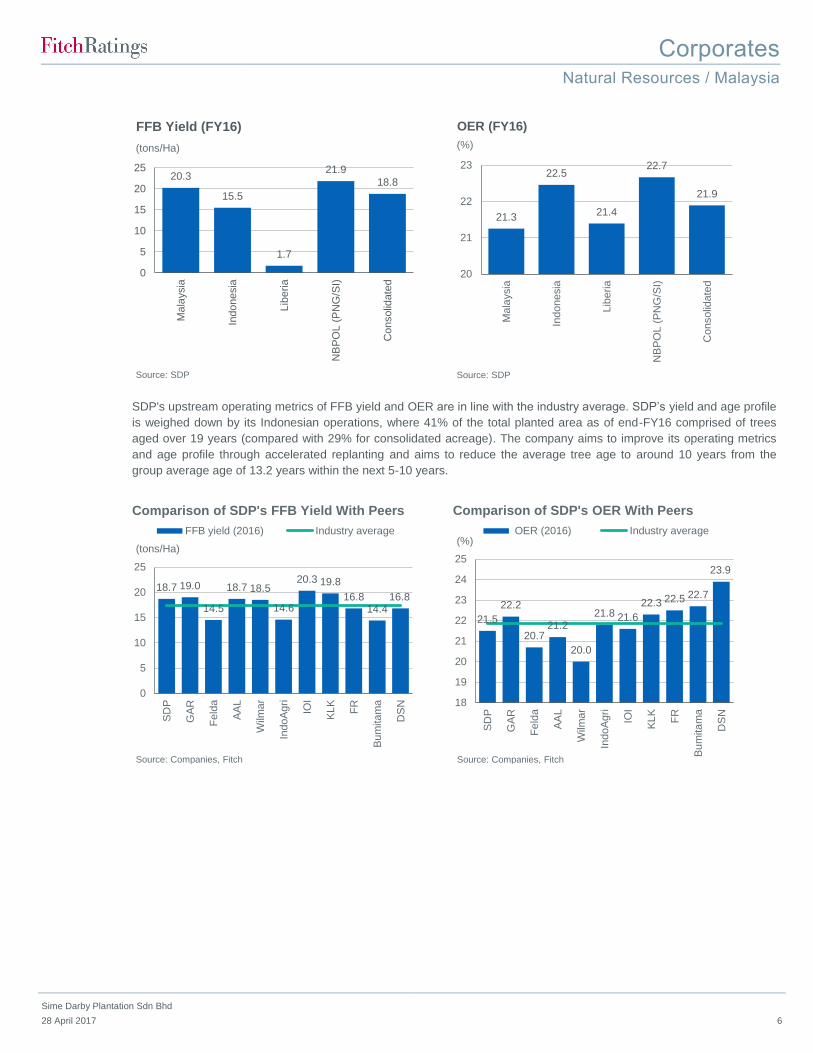
SDP's upstream operating metrics of FFB yield and OER are in line with the industry average. SDP’s yield and age profile
is weighed down by its Indonesian operations, where 41% of the total planted area as of end-FY16 comprised of trees
aged over 19 years (compared with 29% for consolidated acreage). The company aims to improve its operating metrics
and age profile through accelerated replanting and aims to reduce the average tree age to around 10 years from the
group average age of 13.2 years within the next 5-10 years.
20.3
15.5
1.7
21.9
18.8
0
5
10
15
20
25
Mala
ysia
Indonesia
Lib
eria
NB
PO
L (
PN
G/S
I)
Consolid
ate
d
FFB Yield (FY16)
Source: SDP
(tons/Ha)
21.3
22.5
21.4
22.7
21.9
20
21
22
23
Ma
laysia
Indonesia
Lib
eria
NB
PO
L (
PN
G/S
I)
Consolid
ate
d
OER (FY16)
Source: SDP
(%)
18.7 19.0
14.5
18.7 18.5
14.6
20.3 19.8
16.814.4
16.8
0
5
10
15
20
25
SD
P
GA
R
Feld
a
AA
L
Wilm
ar
IndoA
gri
IOI
KL
K
FR
Bu
mita
ma
DS
N
FFB yield (2016) Industry average
Source: Companies, Fitch
(tons/Ha)
Comparison of SDP's FFB Yield With Peers
21.5
22.2
20.721.2
20.0
21.8 21.6
22.3 22.5 22.7
23.9
18
19
20
21
22
23
24
25
SD
P
GA
R
Fe
lda
AA
L
Wilm
ar
IndoA
gri
IOI
KL
K
FR
Bu
mita
ma
DS
N
OER (2016) Industry average
Source: Companies, Fitch
(%)
Comparison of SDP's OER With Peers

Corporates
Natural Resources / Malaysia
Sime Darby Plantation Sdn Bhd
28 April 2017 7
10.9
13.314.5
11.2
16.517.2
0
4
8
12
16
20
Riau Selatan Sumatera Selatan Sanggau, Kalimantan
Indonesia Estates Yield Improvement
FY08 FY16
Source: SDP
(tons/Ha)

Corporates
Natural Resources / Malaysia
Sime Darby Plantation Sdn Bhd
28 April 2017 8
Trends and Forecasts
Sime Darby Plantation Sdn Bhd —— Emerging BBB Cat Median —— Natural Resources Median ——
Note: Including Fitch expectations, 2016 corresponds to FY16 and 2017F corresponds to FY17E for SDP. Source: Fitch
Definitions
FFO Interest Cover: FFO + Gross Interest paid minus interest received + Preferred Dividends paid divided by Gross Interest Paid + Preferred Dividends Paid. Revenue Growth: Percentage growth in revenues since previous reporting period. FFO Margin: FFO divided by Revenues. FFO Adjusted Net Leverage: Total Debt with Equity Credit + Lease equivalent Debt + Other off Balance Sheet Debt - Readily Available Cash & Equivalents divided by Funds From Operations [FFO] + Gross Interest (Paid) - Interest Received + Preferred Dividends (Paid) + Operating Lease Expense for Capitalised Leased Assets.

Corporates
Natural Resources / Malaysia
Sime Darby Plantation Sdn Bhd
28 April 2017 9
Key Assumptions
Fitch's key assumptions within our rating case for the issuer include:
Average benchmark CPO price at USD665 a tonne in FY17, USD670 in FY18 and USD675 thereafter.
Average US dollar-Malaysian ringgit exchange rate at 4.30 in FY17, weakening to 4.45 in FY18 and 4.75 in FY19.
FFB yield of 20 tonnes per hectare in FY17, improving to 23 by FY20.
OER of 21.5% in FY17, improving to 22.2% by FY20.
Capex at MYR1.7 billion in FY17 and around MYR2.0 billion annually thereafter.
SDP has MYR4.4 billion worth of land that can be disposed of in the period through to FY20 if required. We have
assumed cash proceeds from land sales of MYR1.1 billion in FY18 and MYR1.2 billion in FY19.
Dividend payout at 55% of net income. We have assumed a lower dividend payout compared with historical payout
ratio of 75% based on expectation of dividend reinvestment.
Financial Data
Historical Forecast
(MYRm) Jun 2015 Jun 2016 Jun 2017F Jun 2018F Jun 2019F
SUMMARY INCOME STATEMENT
Gross Revenues 10,322 11,913 15,393 16,851 19,024
Revenue Growth (%) -5.9 15.4 29.2 9.5 12.9
Operating EBITDA (before income from associates)
1,883 1,915 3,100 4,105 4,664
Operating EBITDA Margin (%) 18.2 16.1 20.1 24.4 24.5
Operating EBITDAR 2,124 2,125 3,372 4,403 5,000
Operating EBITDAR Margin (%) 20.6 17.8 21.9 26.1 26.3
Operating EBIT 1,119 828 1,940 3,104 3,672
Operating EBIT Margin (%) 10.8 7.0 12.6 18.4 19.3
Gross Interest Expense -307 -464 -469 -346 -326
Pretax Income (Including Associate Income/Loss) 1,161 865 1,501 2,789 3,375
SUMMARY BALANCE SHEET
Readily Available Cash & Equivalents 1,102 636 511 838 1,424
Total Debt with Equity Credit 13,527 13,936 9,153 8,253 7,654
Total Adjusted Debt with Equity Credit 14,732 14,987 10,511 9,741 9,333
Net Debt 12,424 13,300 8,641 7,415 6,230
SUMMARY CASH FLOW STATEMENT
Operating EBITDA 1,883 1,915 3,100 4,105 4,664
Cash Interest Paid -352 -542 -469 -346 -326
Cash Tax -411 -244 -375 -697 -844
Divs received less Divs paid to minorities (inflow / (out)flow)
-64 -174 -100 -150 -200
Other Items Before FFO 49 271 0 0 0
Funds Flow from Operations 1,171 1,248 2,186 2,943 3,324
Change in Working Capital 76 132 -57 -178 -266
Cash Flow from Operations (Fitch Defined) 1,248 1,380 2,129 2,764 3,058

Corporates
Natural Resources / Malaysia
Sime Darby Plantation Sdn Bhd
28 April 2017 10
Total Non-Operating/Non-Recurring Cash Flow 0 0
Capital Expenditure -1,157 -1,335
Capital Intensity (Capex/Revenues) 11.2 11.2
Common Dividends -600 -700
Net Acquisitions & Divestitures -5,675 245
Other Investing and Financing Cash Flow Items 203 25 0 0 0
Net Debt Proceeds 5,896 -82 -3,668 -899 -599
Net Equity Proceeds 0 0 0 0 0
Total Change in Cash -87 -466 -125 327 586
DETAIL CASH FLOW STATEMENT
FFO Margin (%) 11.3 10.5 14.2 17.5 17.5
Calculations for Forecast Publication
Capex, Dividends, Acquisitions & oth. Items before FCF
-7,384 -1,519 1,414 -1,538 -1,873
Free Cash Flow after Acquisitions & Divestitures -6,185 -409 3,543 1,226 1,185
Free Cash Flow Margin (after net acquisitions) margin (%)
-59.9 -3.4 23.0 7.3 6.2
COVERAGE RATIOS
FFO Interest Coverage (x) 4.1 3.3 5.6 9.4 11.1
FFO Fixed Charge Coverage (x) 2.9 2.6 3.9 5.5 6.0
Operating EBITDAR/Interest Paid + Rents (x) 3.5 2.6 4.4 6.6 7.3
Operating EBITDA/Interest Paid (x) 5.2 3.2 6.4 11.4 13.7
LEVERAGES RATIOS
Total Adjusted Debt/Operating EBITDAR (x) 7.2 7.7 3.2 2.3 1.9
Total Adjusted Net Debt/Operating EBITDAR (x) 6.6 7.4 3.1 2.1 1.6
Total Debt with Equity Credit/Operating EBITDA (x)
7.4 8.0 3.1 2.1 1.7
FFO Adjusted Leverage (x) 8.7 7.6 3.6 2.7 2.4
FFO Adjusted Net Leverage (x) 8.0 7.3 3.5 2.5 2.0
How to Interpret the Forecast Presented
The forecast presented is based on the agency’s internally produced, conservative rating case forecast. It does not represent the forecast of the rated issuer. The forecast set out above is only one component used by Fitch to assign a rating or determine a rating outlook, and the information in the forecast reflects material but not exhaustive elements of Fitch’s rating assumptions for the issuer’s financial performance. As such, it cannot be used to establish a rating, and it should not be relied on for that purpose. Fitch’s forecasts are constructed using a proprietary internal forecasting tool, which employs Fitch’s own assumptions on operating and financial performance that may not reflect the assumptions that you would make. Fitch’s own definitions of financial terms such as EBITDA, debt or free cash flow may differ from your own such definitions. Fitch may be granted access, from time to time, to confidential information on certain elements of the issuer’s forward planning. Certain elements of such information may be omitted from this forecast, even where they are included in Fitch’s own internal deliberations, where Fitch, at its sole discretion, considers the data may be potentially sensitive in a commercial, legal or regulatory context. The forecast (as with the entirety of this report) is produced strictly subject to the disclaimers set out at the end of this report. Fitch may update the forecast in future reports but assumes no responsibility to do so.
Corporates
Natural Resources / Malaysia
Sime Darby Plantation Sdn Bhd
28 April 2017 11
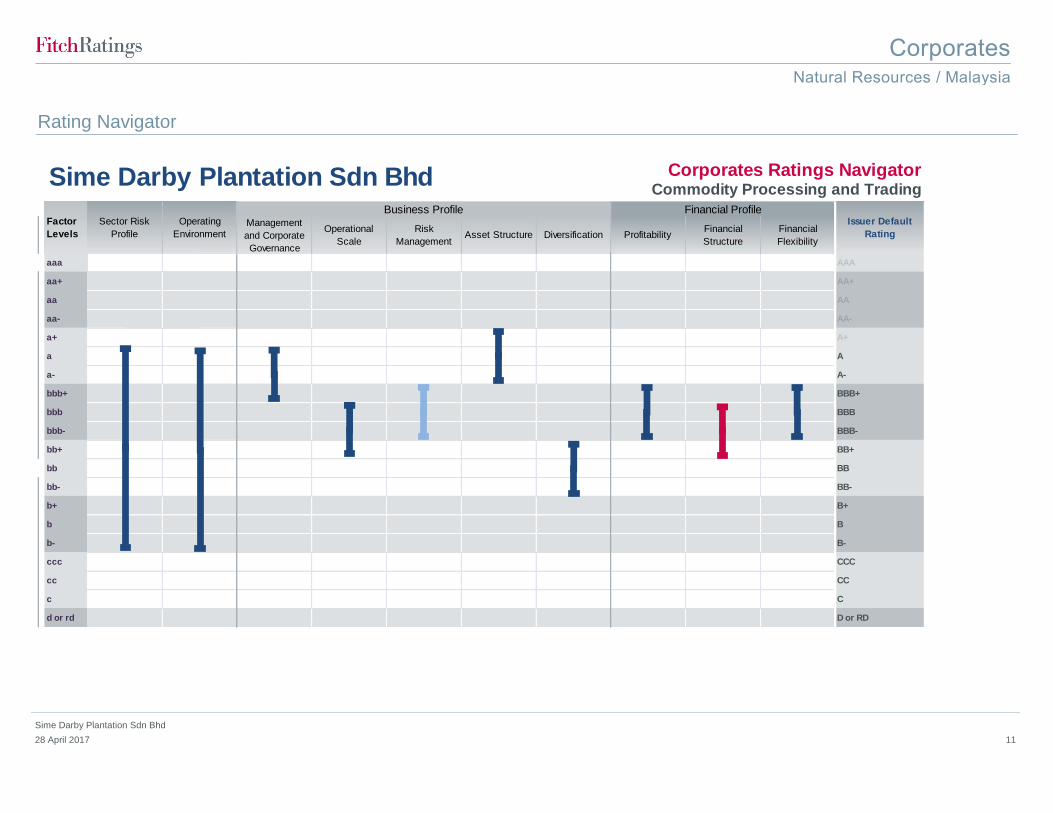
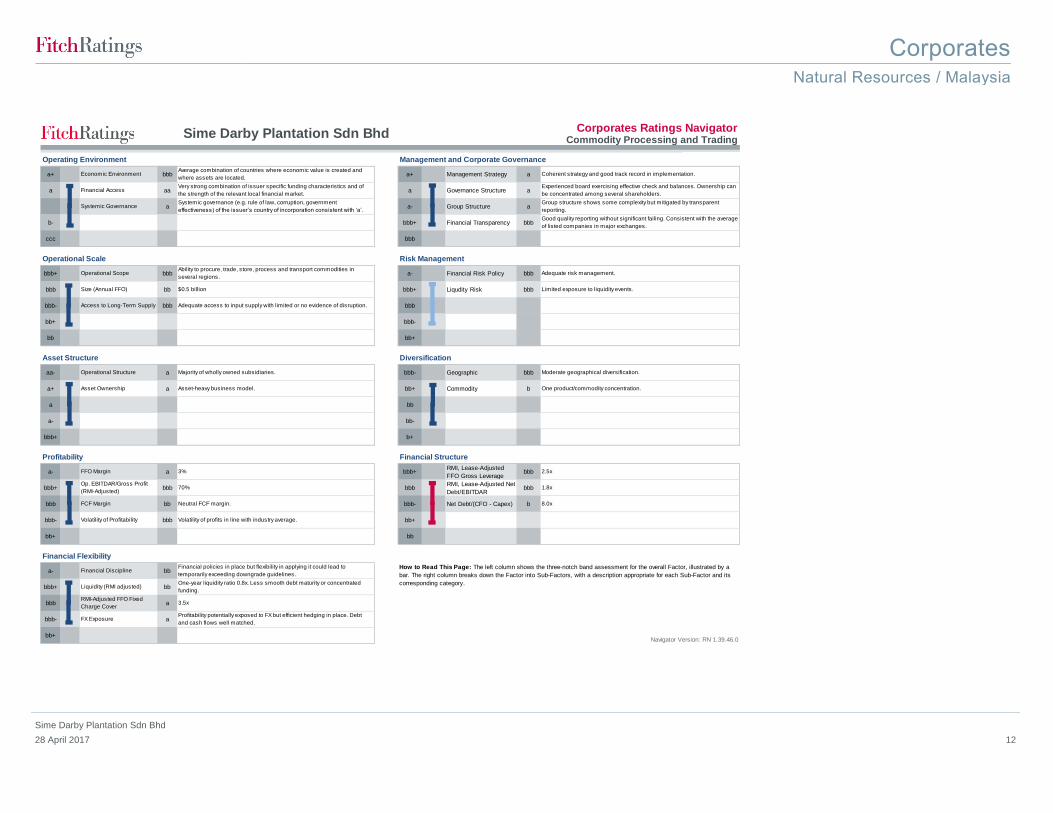
Rating Navigator
Corporates Ratings NavigatorCommodity Processing and Trading
aaa AAA
aa+ AA+
aa AA
aa- AA-
a+ A+
a A
a- A-
bbb+ BBB+
bbb BBB
bbb- BBB-
bb+ BB+
bb BB
bb- BB-
b+ B+
b B
b- B-
ccc CCC
cc CC
c C
d or rd D or RD
Issuer Default
Rating
Factor
Levels
Sector Risk
Profile
Operating
EnvironmentFinancial
Flexibility
Financial
StructureProfitabilityDiversificationAsset Structure
Risk
Management
Operational
Scale
Management
and Corporate
Governance
Business Profile Financial Profile
Sime Darby Plantation Sdn Bhd
Corporates
Natural Resources / Malaysia
Sime Darby Plantation Sdn Bhd
28 April 2017 12
Corporates Ratings NavigatorCommodity Processing and Trading
Operating Environment Management and Corporate Governance
a+ bbb a+ a
a aa a a
a a- a
b- bbb+ bbb
ccc bbb
Operational Scale Risk Management
bbb+ bbb a- bbb
bbb bb bbb+ bbb
bbb- bbb bbb
bb+ bbb-
bb bb+
Asset Structure Diversification
aa- a bbb- bbb
a+ a bb+ b
a bb
a- bb-
bbb+ b+
Profitability Financial Structure
a- a bbb+ bbb
bbb+ bbb bbb bbb
bbb bb bbb- b
bbb- bbb bb+
bb+ bb
Financial Flexibility
a- bb
bbb+ bb
bbb a
bbb- a
bb+Navigator Version: RN 1.39.46.0
FFO Margin 3%
Financial Transparency
Group Structure
Access to Long-Term Supply Adequate access to input supply with limited or no evidence of disruption.
Operational Scope
Size (Annual FFO)
Operational Structure
Asset Ownership
Majority of wholly owned subsidiaries.
Neutral FCF margin.
70%
How to Read This Page: The left column shows the three-notch band assessment for the overall Factor, illustrated by a
bar. The right column breaks down the Factor into Sub-Factors, with a description appropriate for each Sub-Factor and its
corresponding category.
FX Exposure
RMI-Adjusted FFO Fixed
Charge Cover
Liquidity (RMI adjusted)
Financial Discipline
Volatility of Profitability
FCF Margin
Op. EBITDAR/Gross Profit
(RMI-Adjusted)
CommodityAsset-heavy business model.
Financial Risk Policy
Governance Structure
Management Strategy
Financial Access
Economic Environment
Systemic Governance
Sime Darby Plantation Sdn Bhd
Coherent strategy and good track record in implementation.
Systemic governance (e.g. rule of law, corruption, government
effectiveness) of the issuer’s country of incorporation consistent with ‘a’.
Very strong combination of issuer specific funding characteristics and of
the strength of the relevant local financial market.
Average combination of countries where economic value is created and
where assets are located.
One product/commodity concentration.
Moderate geographical diversification.
Net Debt/(CFO - Capex) 8.0x
1.8x
2.5x
RMI, Lease-Adjusted Net
Debt/EBITDAR
RMI, Lease-Adjusted
FFO Gross Leverage
Profitability potentially exposed to FX but efficient hedging in place. Debt
and cash flows well matched.
3.5x
One-year liquidity ratio 0.8x. Less smooth debt maturity or concentrated
funding.
Financial policies in place but flexibility in applying it could lead to
temporarily exceeding downgrade guidelines.
Volatility of profits in line with industry average.
Geographic
Good quality reporting without significant failing. Consistent with the average
of listed companies in major exchanges.
Group structure shows some complexity but mitigated by transparent
reporting.
Experienced board exercising effective check and balances. Ownership can
be concentrated among several shareholders.
Limited exposure to liquidity events.
Adequate risk management.
$0.5 billion
Ability to procure, trade, store, process and transport commodities in
several regions.
Liqudity Risk
Corporates
Natural Resources / Malaysia
Sime Darby Plantation Sdn Bhd
28 April 2017 13
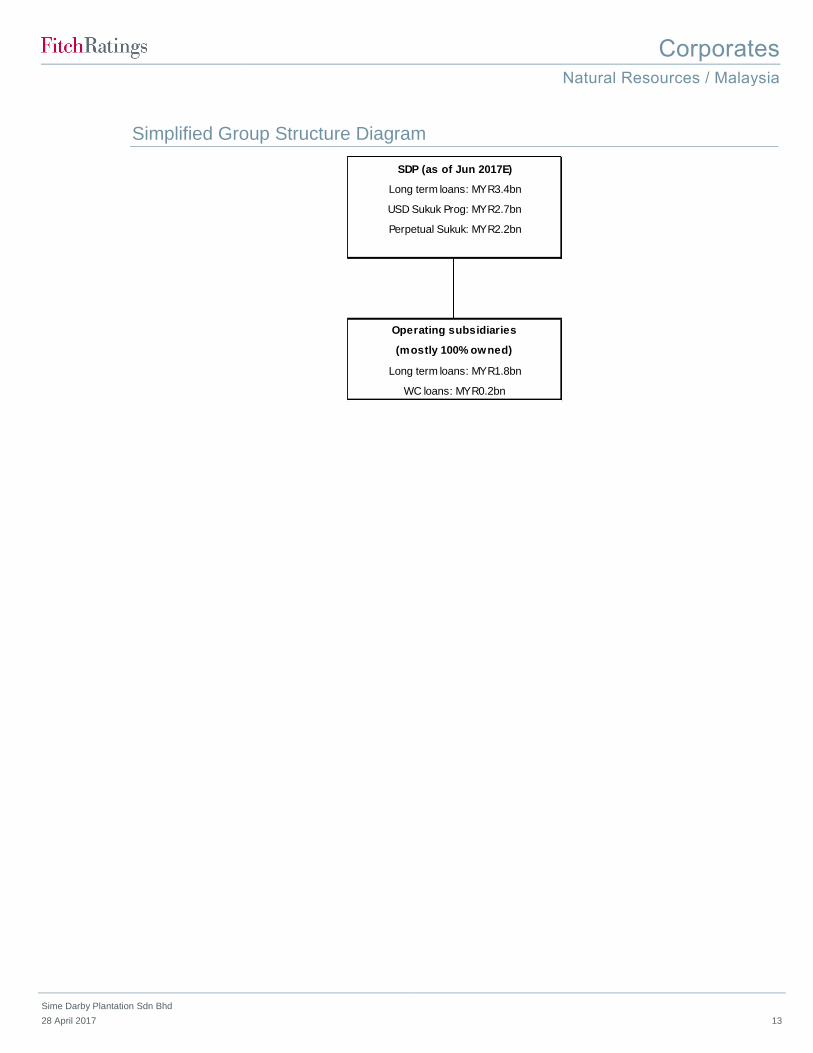
Simplified Group Structure Diagram
SDP (as of Jun 2017E)
Long term loans: MYR3.4bn
USD Sukuk Prog: MYR2.7bn
Perpetual Sukuk: MYR2.2bn
Operating subsidiaries
(mostly 100% owned)
Long term loans: MYR1.8bn
WC loans: MYR0.2bn

Corporates
Natural Resources / Malaysia
Sime Darby Plantation Sdn Bhd
28 April 2017 14
Peer Financial Summary
Company Date Rating
Operating EBITDAR
(USDm)
Operating EBITDAR
Margin (%) FFO Margin
(%)
FFO Fixed Charge
Coverage (x)
FFO Adjusted Net Leverage
(x)
Sime Darby Plantation Sdn Bhd Jun - 2019 BBB+(EXP) 1,129 26.3 17.5 6.0 2.0
2018 994 26.1 17.5 5.5 2.5
2017 761 21.9 14.2 3.9 3.5
2016 528 17.8 10.5 2.6 7.3
2015 561 20.6 11.3 2.9 8.0
Sime Darby Berhada Jun - 2019 BBB+ 1,709 12.9 8.8 5.1 2.7
2018 1,527 12.3 8.4 4.7 2.9
2017 1,448 12.2 8.2 4.4 3.0
2016 1,250 11.4 7.3 4.2 4.0
2015 1,373 11.9 7.4 4.6 4.3
Bunge Limited Dec - 2018 BBB 2,101 4.7 3.1 4.1 3.8
2017 2,075 4.7 3.2 4.2 3.8
2016 1,919 4.5 3.9 4.4 2.9
2015 2,025 4.7 1.0 2.0 7.4
Golden Agri-Resources Ltdb Dec - 2018 AA(idn) 709 10.8 8.6 6.8 3.5
2017 733 11.4 9.0 6.4 3.8
2016 512 8.0 7.6 5.3 4.6
2015 483 7.4 7.6 5.0 4.8 a Financial estimates presented for FY17, FY18 and FY19 are Fitch’s forecasts prior to the company’s announcement of corporate restructuring in
February 2017, which were the basis for its ‘BBB+’ rating. b The AA(idn) rating pertains to PT Sinar Mas Agro Resources and Technology Tbk, PT Ivo Mas Tunggal and PT Sawit Mas Sejahtera, which are three key
subsidiaries of Golden Agri-Resources (GAR) and their ratings are equalised with the consolidated credit profile of GAR. Source: Fitch
Corporates
Natural Resources / Malaysia
Sime Darby Plantation Sdn Bhd
28 April 2017 15
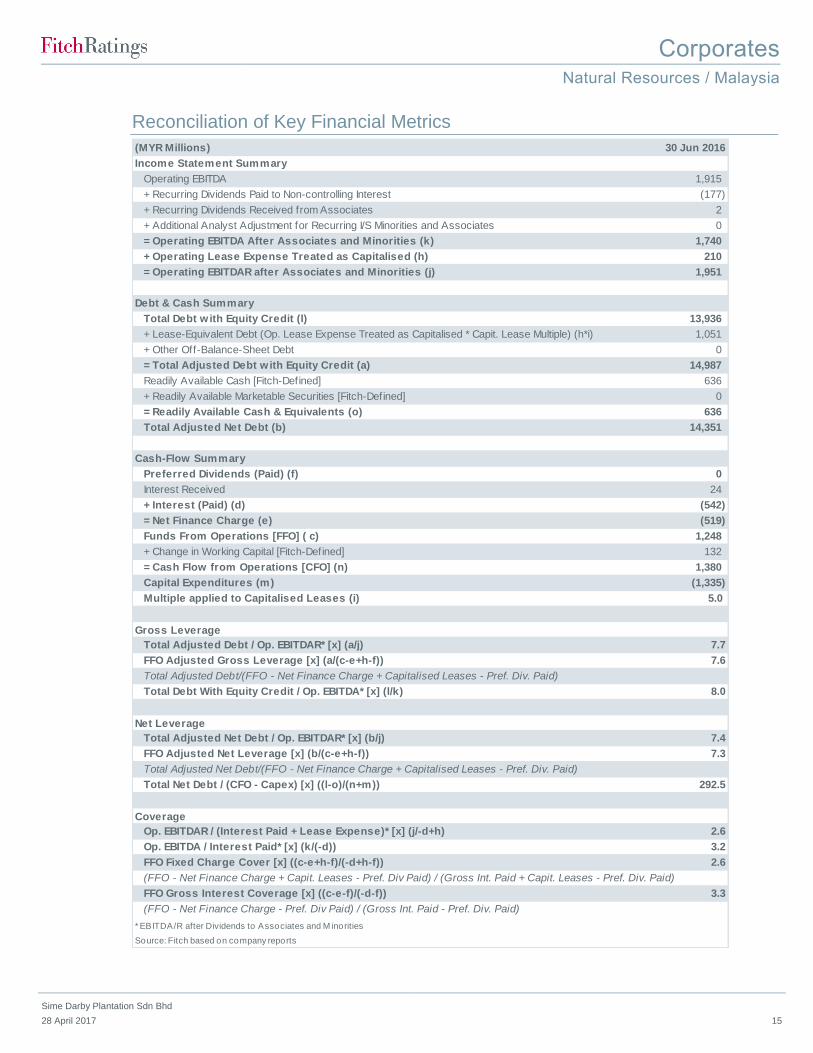
Reconciliation of Key Financial Metrics
(MYR Millions) 30 Jun 2016
Income Statement Summary
Operating EBITDA 1,915
+ Recurring Dividends Paid to Non-controlling Interest (177)
+ Recurring Dividends Received from Associates 2
+ Additional Analyst Adjustment for Recurring I/S Minorities and Associates 0
= Operating EBITDA After Associates and Minorities (k) 1,740
+ Operating Lease Expense Treated as Capitalised (h) 210
= Operating EBITDAR after Associates and Minorities (j) 1,951
Debt & Cash Summary
Total Debt w ith Equity Credit (l) 13,936
+ Lease-Equivalent Debt (Op. Lease Expense Treated as Capitalised * Capit. Lease Multiple) (h*i) 1,051
+ Other Off-Balance-Sheet Debt 0
= Total Adjusted Debt w ith Equity Credit (a) 14,987
Readily Available Cash [Fitch-Defined] 636
+ Readily Available Marketable Securities [Fitch-Defined] 0
= Readily Available Cash & Equivalents (o) 636
Total Adjusted Net Debt (b) 14,351
Cash-Flow Summary
Preferred Dividends (Paid) (f) 0
Interest Received 24
+ Interest (Paid) (d) (542)
= Net Finance Charge (e) (519)
Funds From Operations [FFO] ( c) 1,248
+ Change in Working Capital [Fitch-Defined] 132
= Cash Flow from Operations [CFO] (n) 1,380
Capital Expenditures (m) (1,335)
Multiple applied to Capitalised Leases (i) 5.0
Gross Leverage
Total Adjusted Debt / Op. EBITDAR* [x] (a/j) 7.7
FFO Adjusted Gross Leverage [x] (a/(c-e+h-f)) 7.6
Total Adjusted Debt/(FFO - Net Finance Charge + Capitalised Leases - Pref. Div. Paid)
Total Debt With Equity Credit / Op. EBITDA* [x] (l/k) 8.0
Net Leverage
Total Adjusted Net Debt / Op. EBITDAR* [x] (b/j) 7.4
FFO Adjusted Net Leverage [x] (b/(c-e+h-f)) 7.3
Total Adjusted Net Debt/(FFO - Net Finance Charge + Capitalised Leases - Pref. Div. Paid)
Total Net Debt / (CFO - Capex) [x] ((l-o)/(n+m)) 292.5
Coverage
Op. EBITDAR / (Interest Paid + Lease Expense)* [x] (j/-d+h) 2.6
Op. EBITDA / Interest Paid* [x] (k/(-d)) 3.2
FFO Fixed Charge Cover [x] ((c-e+h-f)/(-d+h-f)) 2.6
(FFO - Net Finance Charge + Capit. Leases - Pref. Div Paid) / (Gross Int. Paid + Capit. Leases - Pref. Div. Paid)
FFO Gross Interest Coverage [x] ((c-e-f)/(-d-f)) 3.3
(FFO - Net Finance Charge - Pref. Div Paid) / (Gross Int. Paid - Pref. Div. Paid)
* EBITDA/R after Dividends to Associates and M inorities
Source: Fitch based on company reports

Corporates
Natural Resources / Malaysia
Sime Darby Plantation Sdn Bhd
28 April 2017 16
Fitch Adjustment Reconciliation
(MYR Millions)
Reported
Values
Sum of Fitch
Adjustments
Preferred
Dividends,
Associates
and
Minorities
Cash
Adjustments
Lease
Adjustment
Other
Adjustment
Adjusted
Values
30 Jun 16
Income Statement Summary
Revenue 11,891 22 22 11,913
Operating EBITDAR 2,418 (293) 210 (504) 2,125
Operating EBITDAR after Associates and Minorities 2,410 (459) (174) 210 (495) 1,951
Operating Lease Expense 0 210 210 210
Operating EBITDA 2,418 (504) (504) 1,915
Operating EBITDA after Associates and Minorities 2,410 (669) (174) (495) 1,740
Operating EBIT 1,294 (466) (466) 828
Debt & Cash Summary
Total Debt With Equity Credit 5,651 8,285 8,285 13,936
Total Adjusted Debt With Equity Credit 5,651 9,336 1,051 8,285 14,987
Lease-Equivalent Debt 0 1,051 1,051 1,051
Other Off-Balance Sheet Debt 0 0 0
Readily Available Cash & Equivalents 636 0 636
Not Readily Available Cash & Equivalents 0 0 0
Cash-Flow Summary
Preferred Dividends (Paid) 0 0 0
Interest Received 24 0 24
Interest (Paid) (542) 0 (542)
Funds From Operations [FFO] 1,422 (174) (174) 1,248
Change in Working Capital [Fitch-Defined] 132 0 132
Cash Flow from Operations [CFO] 1,555 (174) (174) 0 1,380
Non-Operating/Non-Recurring Cash Flow 0 0 0
Capital (Expenditures) (1,335) 0 (1,335)
Common Dividends (Paid) (700) 0 (700)
Free Cash Flow [FCF] (480) (174) (174) (655)
Gross Leverage
Total Adjusted Debt / Op. EBITDAR* [x] 2.3 7.7
FFO Adjusted Leverage [x] 2.9 7.6
Total Debt With Equity Credit / Op. EBITDA* [x] 2.3 8.0
Net Leverage
Total Adjusted Net Debt / Op. EBITDAR* [x] 2.1 7.4
FFO Adjusted Net Leverage [x] 2.6 7.3
Total Net Debt / (CFO - Capex) [x] 22.8 292.5
Coverage
Op. EBITDAR / (Interest Paid + Lease Expense)* [x] 4.4 2.6
Op. EBITDA / Interest Paid* [x] 4.4 3.2
FFO Fixed Charge Coverage [x] 3.6 2.6
FFO Interest Coverage [x] 3.6 3.3
*EBITDA/R after Dividends to Associates and M inorities

Corporates
Natural Resources / Malaysia
Sime Darby Plantation Sdn Bhd
28 April 2017 17
Full List of Ratings
Rating Outlook Last Rating Action
Sime Darby Plantation Sdn Bhd
Long Term IDR BBB+(EXP) Stable Assigned on 18 April 2017
Senior unsecured BBB+(EXP) Assigned on 18 April 2017
USD1.5 billion sukuk programme and the outstanding issuance under the programme
BBB+(EXP) Assigned on 18 April 2017
Related Research & Criteria
Criteria for Rating Non-Financial Corporates (March 2017)
Criteria for Rating Sukuk (August 2016)
Treatment and Notching of Hybrids in Non-Financial Corporate and REIT Credit Analysis (February 2016)
Analysts
Akash Gupta
+65 6796 7242
Rufina Tam
+62 21 2988 6813
Corporates
Natural Resources / Malaysia
Sime Darby Plantation Sdn Bhd
28 April 2017 18
The ratings above were solicited by, or on behalf of, the issuer, and therefore, Fitch has been compensated for the
provision of the ratings.
ALL FITCH CREDIT RATINGS ARE SUBJECT TO CERTAIN LIMITATIONS AND DISCLAIMERS. PLEASE READ THESE LIMITATIONS AND
DISCLAIMERS BY FOLLOWING THIS LINK: HTTPS://FITCHRATINGS.COM/UNDERSTANDINGCREDITRATINGS. IN ADDITION,
RATING DEFINITIONS AND THE TERMS OF USE OF SUCH RATINGS ARE AVAILABLE ON THE AGENCY'S PUBLIC WEB SITE AT
WWW.FITCHRATINGS.COM. PUBLISHED RATINGS, CRITERIA, AND METHODOLOGIES ARE AVAILABLE FROM THIS SITE AT ALL TIMES.
FITCH'S CODE OF CONDUCT, CONFIDENTIALITY, CONFLICTS OF INTEREST, AFFILIATE FIREWALL, COMPLIANCE, AND OTHER
RELEVANT POLICIES AND PROCEDURES ARE ALSO AVAILABLE FROM THE CODE OF CONDUCT SECTION OF THIS SITE. FITCH MAY
HAVE PROVIDED ANOTHER PERMISSIBLE SERVICE TO THE RATED ENTITY OR ITS RELATED THIRD PARTIES. DETAILS OF THIS
SERVICE FOR RATINGS FOR WHICH THE LEAD ANALYST IS BASED IN AN EU-REGISTERED ENTITY CAN BE FOUND ON THE ENTITY
SUMMARY PAGE FOR THIS ISSUER ON THE FITCH WEBSITE.
Copyright © 2017 by Fitch, Inc., Fitch Ratings Ltd. and its subsidiaries. 33 Whitehall Street, New York, NY 10004. Telephone: 1-800-753-4824, (212) 908-0500. Fax: (212) 480-
4435. Reproduction or retransmission in whole or in part is prohibited except by permission. All rights reserved. In issuing and maintaining its ratings and in making other reports (including forecast information), Fitch relies on factual information it receives from issuers and underwriters and from other sources Fitch believes to be credible. Fitch conducts a reasonable investigation of the factual information relied upon by it in accordance with its ratings methodology, and obtains reasonable verification of that information from
independent sources, to the extent such sources are available for a given security or in a given jurisdiction. The manner of Fitch’s factual investigation and the scope of the third-party verification it obtains will vary depending on the nature of the rated security and its issuer, the requirements and practices in the jurisdiction in which the rated security is offered and sold and/or the issuer is located, the availability and nature of relevant public information, access to the management of the issuer and its advisers, the availability of pre-existing third-
party verifications such as audit reports, agreed-upon procedures letters, appraisals, actuarial reports, engineering reports, legal opinions and other reports provided by third parties, the availability of independent and competent third-party verification sources with respect to the particular security or in the particular jurisdiction of the issuer, and a variety of other factors. Users of Fitch’s ratings and reports should understand that neither an enhanced factual investigation nor any third-party verification can ensure that all of the information Fitch
relies on in connection with a rating or a report will be accurate and complete. Ultimately, the issuer and its advisers are responsible for the accuracy of the information they provide to Fitch and to the market in offering documents and other reports. In issuing its ratings and its reports, Fitch must rely on the work of experts, including independent auditors with respect to financial statements and attorneys with respect to legal and tax matters. Further, ratings and forecasts of financial and other information are inherently forward-looking and
embody assumptions and predictions about future events that by their nature cannot be verified as facts. As a result, despite any verification of current facts, ratings and forecasts can be affected by future events or conditions that were not anticipated at the time a rating or forecast was issued or affirmed.
The information in this report is provided “as is” without any representation or warranty of any kind. A Fitch rating is an opinion as to the creditworthiness of a security. This opinion is based on established criteria and methodologies that Fitch is continuously evaluating and updating. Therefore, ratings are the collective work product of Fitch and no individual, or group of individuals, is solely responsible for a rating. The rating does not address the risk of loss due to risks other than credit risk, unless such risk is specifically mentioned. Fitch
is not engaged in the offer or sale of any security. All Fitch reports have shared authorship. Individuals identified in a Fitch report were involved in, but are not solely responsible for, the opinions stated therein. The individuals are named for contact purposes only. A report providing a Fitch rating is neither a prospectus nor a substitute for the information assembled, verified and presented to investors by the issuer and its agents in connection with the sale of the securities. Ratings may be changed or withdrawn at anytime for any
reason in the sole discretion of Fitch. Fitch does not provide investment advice of any sort. Ratings are not a recommendation to buy, sell, or hold any security. Ratings do not comment on the adequacy of market price, the suitability of any security for a particular investor, or the tax-exempt nature or taxability of payments made in respect to any security. Fitch receives fees from issuers, insurers, guarantors, other obligors, and underwriters for rating securities. Such fees generally vary from US$1,000 to US$750,000 (or the applicable
currency equivalent) per issue. In certain cases, Fitch will rate all or a number of issues issued by a particular issuer, or insured or guaranteed by a particular insurer or guarantor, for a single annual fee. Such fees are expected to vary from US$10,000 to US$1,500,000 (or the applicable currency equivalent). The assignment, publication, or dissemination of a rating by Fitch shall not constitute a consent by Fitch to use its name as an expert in connection with any registration statement filed under the United States securities laws, the
Financial Services and Markets Act 2000 of the United Kingdom, or the securities laws of any particular jurisdiction. Due to the relative efficiency of electronic publishing and distribution, Fitch research may be available to electronic subscribers up to three days earlier than to print subscribers.
For Australia, New Zealand, Taiwan and South Korea only: Fitch Australia Pty Ltd holds an Australian financial services license (AFS license no. 337123) which authorizes it to provide credit ratings to wholesale clients only. Credit ratings information published by Fitch is not intended to be used by persons who are retail clients within the meaning of the Corporations Act 2001.