SIG3-700 Variable Gage Repeatability & Reproducibility ...
18
Title: Variable Gage Repeatability & Reproducibility (GR&R) Studies Document Level: 3 Document ID: SIG3-700 Author: Douglas Amato Approved: See Agile Page: 1 of 18 This is an ISO controlled document. Only the latest revision, which appears on the company database, may be used as a working document. Any printed copy is uncontrolled and is the responsibility of the user to verify validity prior to use. Revision Level 02 SIG4-1098 Page 1 of 18 Rev. 01 A. Purpose: The purpose of this document is to understand, quantify and control the error associated with variable/continuous data output gaging and measurement systems, in the environment where the gage is to be used, by the personnel using the gage. B. Scope: This document applies to All variable gages that determine fitness for use of product or components through direct measure of features specified by engineering requirements. Anyone who is conducting a Variable Gage Repeatability & Reproducibility (GR&R) studies, should have completed one or more of the following criteria before starting. 1. Completed the GR&R101 training course, 2. Have previous experience conducting GR&R in a controlled manufacturing environment, such as: a. Automotive b. Aerospace c. Military 3. Is working with a lead that has such experience. NOTE: THE SCOPE OF THE MEASUREMENT SYSTEM ANALYSIS, (MSA), GAGE REPEATABILITY & REPRODUCIBILITY, (GR&R), DESCRIBED HERE IS APPLICABLE TO FEATURES AND TOLERANCES THAT PRODUCE A NORMAL, (GAUSSIAN), DISTRIBUTION ONLY. THAT REQUIRES ENGINEERING TOLERANCES TO BE DEFINED AS A MEAN, (AVERAGE) AND A BI-LATERAL TOLERANCE ZONE, (X +/-Y). BOUNDED GD&T TOLERANCES SUCH AS CONCENTRICITY, PROFILE, RUNOUT, & ETC., WILL REQUIRE DIFFERENT ANALYSIS OR USE OF DISTRIBUTION TRANSFORMATIONS IN ANALYSIS SOFTWARE SUCH AS MINITAB. SOME GD&T FEATURES SUCH AS POSITION, (TRUE POSITION, T/P), CAN BE ANALYZED USING THE NORMAL GR&R MODEL BUT MUST BE DECOMPOSED TO THEIR BI-LATERAL COMPONENTS. EXAMPLE: 1. POSITION: A position feature may be toleranced as a location, “X, Y” with a positional tolerance of 0.2, which is really: a. X +/- 0.1 b. Y +/- 0.1 The GR&R analysis should be performed on the “X” & “Y” individually, and any “Bonus” tolerance ignored.
Transcript of SIG3-700 Variable Gage Repeatability & Reproducibility ...
A.1.a. Title: Variable Gage Repeatability &
Reproducibility (GR&R) Studies
Document Level: 3
Document ID: SIG3-700
Author: Douglas Amato
Approved: See Agile
Page: 1 of 18
This is an ISO controlled document. Only the latest revision, which appears on the company database, may be used as a working document. Any printed copy is uncontrolled and is the responsibility of the user to verify validity prior to use.
Revision Level
02
SIG4-1098 Page 1 of 18 Rev. 01
A. Purpose: The purpose of this document is to understand, quantify and control the error associated with variable/continuous data output gaging and measurement systems, in the environment where the gage is to be used, by the personnel using the gage. B. Scope: This document applies to All variable gages that determine fitness for use of product or components through direct measure of features specified by engineering requirements. Anyone who is conducting a Variable Gage Repeatability & Reproducibility (GR&R) studies, should have completed one or more of the following criteria before starting.
1. Completed the GR&R101 training course, 2. Have previous experience conducting GR&R in a controlled manufacturing
environment, such as: a. Automotive b. Aerospace c. Military
3. Is working with a lead that has such experience.
NOTE: THE SCOPE OF THE MEASUREMENT SYSTEM ANALYSIS, (MSA), GAGE REPEATABILITY & REPRODUCIBILITY, (GR&R), DESCRIBED HERE IS APPLICABLE TO FEATURES AND TOLERANCES THAT PRODUCE A NORMAL, (GAUSSIAN), DISTRIBUTION ONLY. THAT REQUIRES ENGINEERING TOLERANCES TO BE DEFINED AS A MEAN, (AVERAGE) AND A BI-LATERAL TOLERANCE ZONE, (X +/-Y). BOUNDED GD&T TOLERANCES SUCH AS CONCENTRICITY, PROFILE, RUNOUT, & ETC., WILL REQUIRE DIFFERENT ANALYSIS OR USE OF DISTRIBUTION TRANSFORMATIONS IN ANALYSIS SOFTWARE SUCH AS MINITAB. SOME GD&T FEATURES SUCH AS POSITION, (TRUE POSITION, T/P), CAN BE ANALYZED USING THE NORMAL GR&R MODEL BUT MUST BE DECOMPOSED TO THEIR BI-LATERAL COMPONENTS. EXAMPLE:
1. POSITION: A position feature may be toleranced as a location, “X, Y” with a positional tolerance of 0.2, which is really:
a. X +/- 0.1 b. Y +/- 0.1
The GR&R analysis should be performed on the “X” & “Y” individually, and any “Bonus” tolerance ignored.
A.1.a. Title: Variable Gage Repeatability &
Reproducibility (GR&R) Studies
Document Level: 3
Document ID: SIG3-700
Author: Douglas Amato
Approved: See Agile
Page: 2 of 18
This is an ISO controlled document. Only the latest revision, which appears on the company database, may be used as a working document. Any printed copy is uncontrolled and is the responsibility of the user to verify validity prior to use.
Revision Level
02
SIG4-1098 Page 2 of 18 Rev. 01
SEE SUBJECT MATTER EXPERT WHEN THESE TYPES OF FEATURES ARE ENCOUNTERED, AND THE FEATURE CAN NOT BE DECOMPOSED INTO ITS BI-LATERAL COMPONENTS. C. Definitions:
1. ANOVA, Analysis of Variance: A statistical method in which the variation in a set of observations is divided into distinct components.
2. Assignable Cause Variation. Variation cause by an assignable cause, i.e. there is a reason for the variation, and that reason has been identified. Examples:
a. Broken Tool b. Wrong Offset c. Any reason for out of tolerance condition other than process variation.
3. Attribute Data. (Also called count data, categorical data, or discrete data). A product or process characteristic which is measurable in terms of frequency of occurrence. A Go – No Go gage is an example of that.
4. Common Cause (Natural) Variation. Variation inherently part of process, cannot be eliminated only controlled, i.e. machine variation. The only way to reduce Common Cause Variation is to change the process, i.e. Grinding instead of Machining.
5. Continuous Data (Also called measurement data or variables data). Continuous Data or Variable data is just that, continuous, in that it can be sub divided into smaller and smaller units.
a. A product or process characteristic which is measurable in terms of magnitude, such as:
i. Dimensions measured on calipers, micrometers, height gages (Microhite).
ii. CMM data iii. Pressure, Temperature, Humidity
b. For a gage to produce continuous or variable data, for a given feature of interest, the gage resolution should be an order of magnitude smaller than the feature tolerance.
10 <FeatureTolerance
GageResolutionorProcessCapability
(Rule of thumb, in order to be variable, a minimum of 10 distinct categories should be discernable with in the features defined tolerance, i.e. 10 to 1)
A.1.a. Title: Variable Gage Repeatability &
Reproducibility (GR&R) Studies
Document Level: 3
Document ID: SIG3-700
Author: Douglas Amato
Approved: See Agile
Page: 3 of 18
This is an ISO controlled document. Only the latest revision, which appears on the company database, may be used as a working document. Any printed copy is uncontrolled and is the responsibility of the user to verify validity prior to use.
Revision Level
02
SIG4-1098 Page 3 of 18 Rev. 01
6. Cp, Process Capability. Also referred to as short term capability. Compares 6 standard deviations, (s) of the process sample, (also known as the Natural Tolerance, NT) to the engineering tolerance. The Cp uses the average Standard Deviation, SD, of all the subgroups measured. This is closely related to SPC, Statistical Process Control, in that the subgroup of each SPC data pull generates its own standard deviation, which can be estimated by the RANGE of each sub-group as part of a SPC chart.
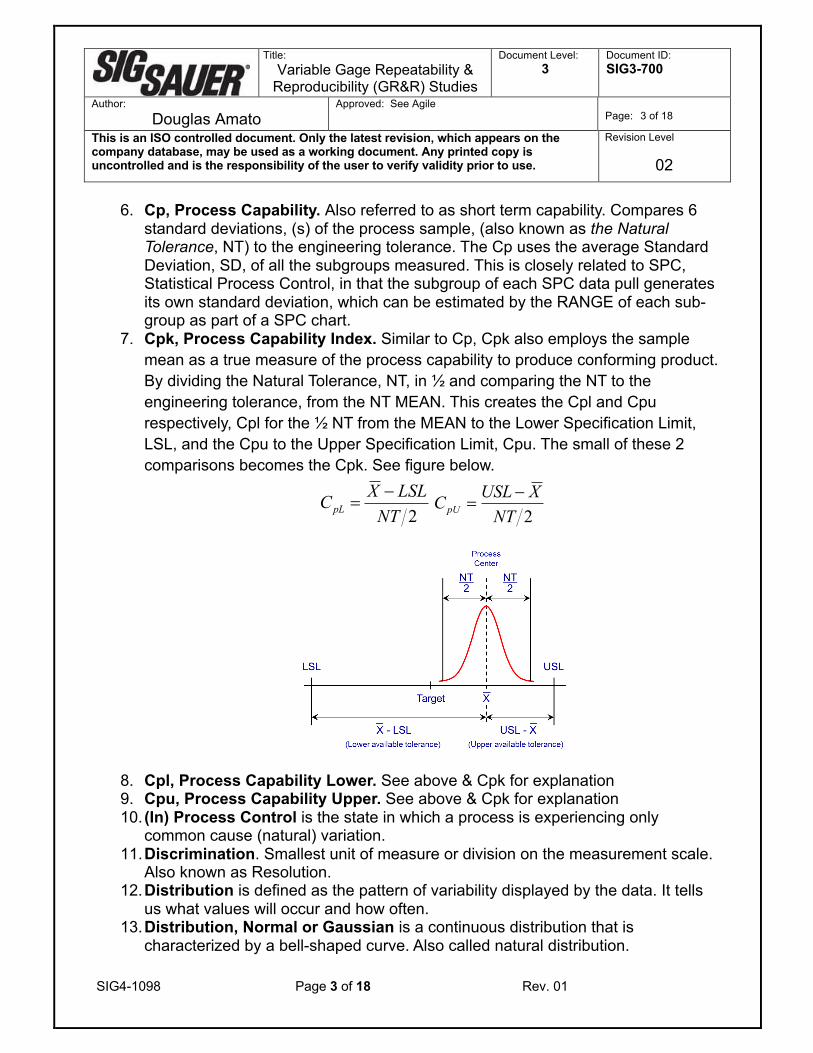
7. Cpk, Process Capability Index. Similar to Cp, Cpk also employs the sample mean as a true measure of the process capability to produce conforming product. By dividing the Natural Tolerance, NT, in ½ and comparing the NT to the engineering tolerance, from the NT MEAN. This creates the Cpl and Cpu respectively, Cpl for the ½ NT from the MEAN to the Lower Specification Limit, LSL, and the Cpu to the Upper Specification Limit, Cpu. The small of these 2 comparisons becomes the Cpk. See figure below.
8. Cpl, Process Capability Lower. See above & Cpk for explanation 9. Cpu, Process Capability Upper. See above & Cpk for explanation 10. (In) Process Control is the state in which a process is experiencing only
common cause (natural) variation. 11. Discrimination. Smallest unit of measure or division on the measurement scale.
Also known as Resolution. 12. Distribution is defined as the pattern of variability displayed by the data. It tells
us what values will occur and how often. 13. Distribution, Normal or Gaussian is a continuous distribution that is
characterized by a bell-shaped curve. Also called natural distribution.
2NTLSLXCpL
-=
2NTXUSLCpU
-=
A.1.a. Title: Variable Gage Repeatability &
Reproducibility (GR&R) Studies
Document Level: 3
Document ID: SIG3-700
Author: Douglas Amato
Approved: See Agile
Page: 4 of 18
This is an ISO controlled document. Only the latest revision, which appears on the company database, may be used as a working document. Any printed copy is uncontrolled and is the responsibility of the user to verify validity prior to use.
Revision Level
02
SIG4-1098 Page 4 of 18 Rev. 01
14. Effective Resolution. Smallest unit of measure or division that is statistically. valid. This is equivalent to +/- 3 SD of the sample/study data. This can also be calculated by subtracting the Upper and Lower control limits on the X-Bar chart of a GR&R.
15. Mean: The mathematical average of a set of continuous/variable data. Also known as Natural Tolerance, (NT)
𝑿; = =∑ (𝑋𝑖)!"#$𝑛
D
16. Median: The middle of the sorted data set, which is the value for which 50% of
the data set falls on each side. 17. Mode: The value that occurs most often. 18. NT, Natural Tolerance. This is the +/- 3 standard deviations of the process data. 19. Pp, Process Performance or Process Potential. Similar to Cp, except the
standard deviation of the process sample data is determined by a pooled data set. Whereas Cp is the average Standard Deviation of each sample subgroup, the Pp pools all the data as one set to determine the sample Standard Deviation.
20. Ppk, Process Performance or Process Potential Index. Calculated using the same method as Cpk, but the Standard Deviation of the sample data is calculated using a pooled data set. See Pp.
21. Ppl, Pp, Process Performance Lower. Same as Cpl, using the, using the SD calculated in Pp
22. Ppu, Pp, Process Performance Upper. Same as Cpu, using the, using the SD calculated in Pp
23. Resolution Smallest unit of measure or division on the measurement scale. Also known as Discrimination.
24. Statistics is the science of making decisions in the face of variation and uncertainty.
25. Statistic is a numerical characteristic of the sample. Used for predicting a characteristic in a population.
26. Parameter is a numerical characteristic of the population. 27. Range: The spread of observations.
𝑅 = 𝑋%&' − 𝑋%()
A.1.a. Title: Variable Gage Repeatability &
Reproducibility (GR&R) Studies
Document Level: 3
Document ID: SIG3-700
Author: Douglas Amato
Approved: See Agile
Page: 5 of 18
This is an ISO controlled document. Only the latest revision, which appears on the company database, may be used as a working document. Any printed copy is uncontrolled and is the responsibility of the user to verify validity prior to use.
Revision Level
02
SIG4-1098 Page 5 of 18 Rev. 01
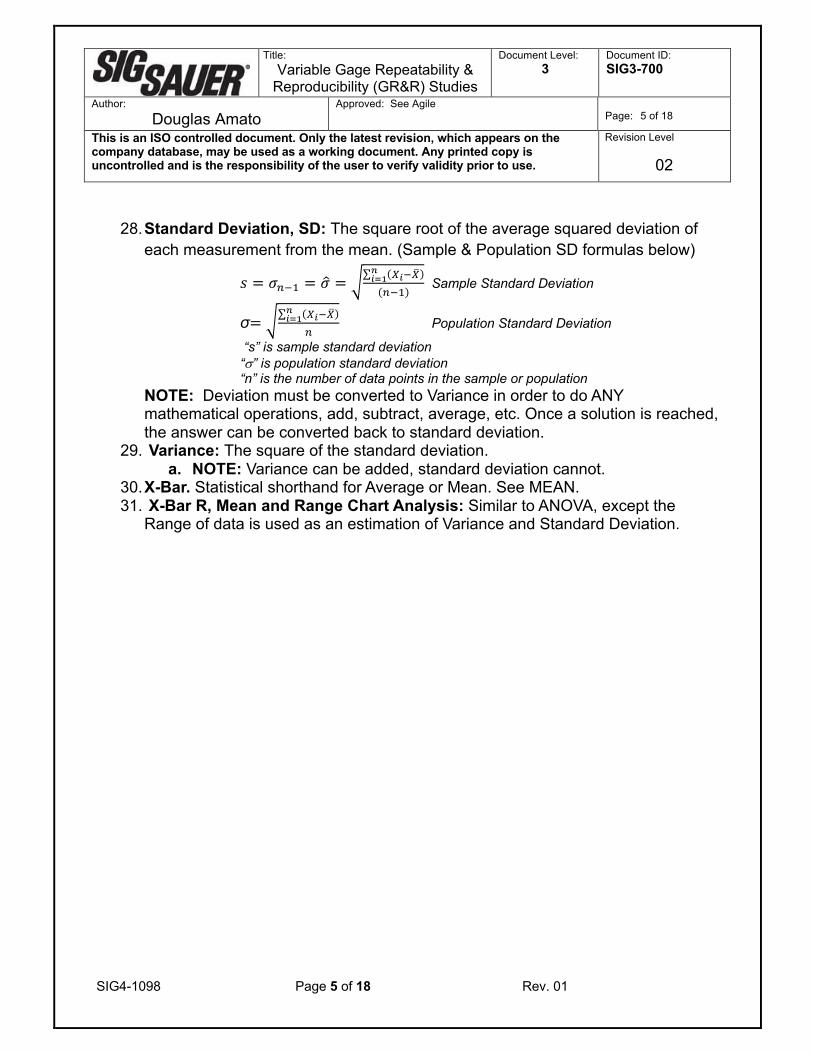
28. Standard Deviation, SD: The square root of the average squared deviation of
each measurement from the mean. (Sample & Population SD formulas below)
𝑠 = 𝜎!"# = 𝜎% = &∑ (&!"&')"!#$(!"#)
Sample Standard Deviation
σ= &∑ (&!"&')"!#$
! Population Standard Deviation
“s” is sample standard deviation “s” is population standard deviation “n” is the number of data points in the sample or population
NOTE: Deviation must be converted to Variance in order to do ANY mathematical operations, add, subtract, average, etc. Once a solution is reached, the answer can be converted back to standard deviation.
29. Variance: The square of the standard deviation. a. NOTE: Variance can be added, standard deviation cannot.
30. X-Bar. Statistical shorthand for Average or Mean. See MEAN. 31. X-Bar R, Mean and Range Chart Analysis: Similar to ANOVA, except the
Range of data is used as an estimation of Variance and Standard Deviation.
A.1.a. Title: Variable Gage Repeatability &
Reproducibility (GR&R) Studies
Document Level: 3
Document ID: SIG3-700
Author: Douglas Amato
Approved: See Agile
Page: 6 of 18
This is an ISO controlled document. Only the latest revision, which appears on the company database, may be used as a working document. Any printed copy is uncontrolled and is the responsibility of the user to verify validity prior to use.
Revision Level
02
SIG4-1098 Page 6 of 18 Rev. 01
D. References: 1. AIAG MSA: Automotive Industry Action Group, Measurement System Analysis 2. ASTM E2782-17, Standard Guide for Measurement System Analysis 3. GR&R101 Training Package - Not a controlled document, see G:\MSA, for
details. 4. SIG4-325 SIG Variable GR&R X_R Workbook
A.1.a. Title: Variable Gage Repeatability &
Reproducibility (GR&R) Studies
Document Level: 3
Document ID: SIG3-700
Author: Douglas Amato
Approved: See Agile
Page: 7 of 18
This is an ISO controlled document. Only the latest revision, which appears on the company database, may be used as a working document. Any printed copy is uncontrolled and is the responsibility of the user to verify validity prior to use.
Revision Level
02
SIG4-1098 Page 7 of 18 Rev. 01
E. PROCESS: GENERAL REQUIREMENTS NOTE: A GR&R study is performed to quantify the ACTUAL variation we would see in the measurement process as experienced in the manufacturing environment. Therefore, it is CRITICAL THAT ANY GR&R STUDY IS PERFORMED IN THE ENVIRONMENT WHERE THESE MEASUREMENTS ARE NORMALLY TAKEN, BY OPERATORS THAT NORMALLY PERFORM THESE MEASUREMENTS. This is NOT a lab study, but a REAL-WORLD study.
1. Identify the gage and associated specification to be analyzed. 2. Are gage(s) in calibration? If gage is not in calibration STOP analysis, gage
MUST be calibrated FIRST! 3. Select 5-10 sample parts to be measured for GR&R study.
a. NOTE: Parts for measurement should vary as much as possible; parts that range from non-conforming on low side to non-conforming on the high side of the specification are preferred. These parts should represent the normal LONG-TERM process variation. (Scrap parts are ok for this analysis).
4. Select 2-3 Operators who would normally measure these samples. This is in addition to the MSA Lead. The MSA lead can also be an “operator” if required.
The SIG SAUER Requirement is a GAGE R&R of 20% or LESS as compared to the Engineering Tolerance.
A GAGE R&R result greater than 20% but less than 30% it may be acceptable, depending on several factors:
1. Cost of improving the gaging method is cost prohibitive 2. The feature being analyzed is of minor criticality to the function or safety of
the finished product. 3. The engineering tolerance cannot be increased.
For all GR&R results that are greater than 20% but less than
30% need to be approved by the local ranking Quality Engineer.
A.1.a. Title: Variable Gage Repeatability &
Reproducibility (GR&R) Studies
Document Level: 3
Document ID: SIG3-700
Author: Douglas Amato
Approved: See Agile
Page: 8 of 18
This is an ISO controlled document. Only the latest revision, which appears on the company database, may be used as a working document. Any printed copy is uncontrolled and is the responsibility of the user to verify validity prior to use.
Revision Level
02
SIG4-1098 Page 8 of 18 Rev. 01
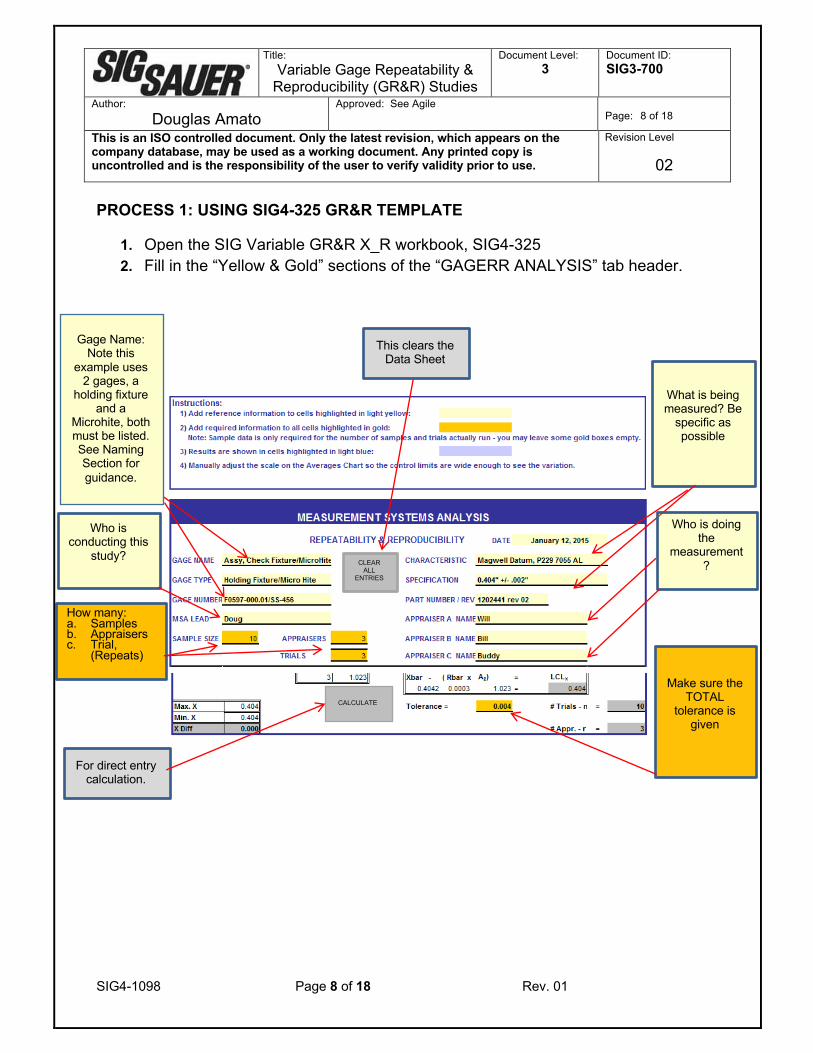
PROCESS 1: USING SIG4-325 GR&R TEMPLATE
1. Open the SIG Variable GR&R X_R workbook, SIG4-325 2. Fill in the “Yellow & Gold” sections of the “GAGERR ANALYSIS” tab header.
Gage Name: Note this
example uses 2 gages, a
holding fixture and a
Microhite, both must be listed. See Naming Section for guidance.
Who is conducting this
study?
What is being measured? Be
specific as possible
Who is doing the
measurement?
How many: a. Samples b. Appraisers c. Trial,
(Repeats)
Make sure the TOTAL
tolerance is given
CALCULATE
CLEAR ALL
ENTRIES
For direct entry calculation.
This clears the Data Sheet
A.1.a. Title: Variable Gage Repeatability &
Reproducibility (GR&R) Studies
Document Level: 3
Document ID: SIG3-700
Author: Douglas Amato
Approved: See Agile
Page: 9 of 18
This is an ISO controlled document. Only the latest revision, which appears on the company database, may be used as a working document. Any printed copy is uncontrolled and is the responsibility of the user to verify validity prior to use.
Revision Level
02
SIG4-1098 Page 9 of 18 Rev. 01
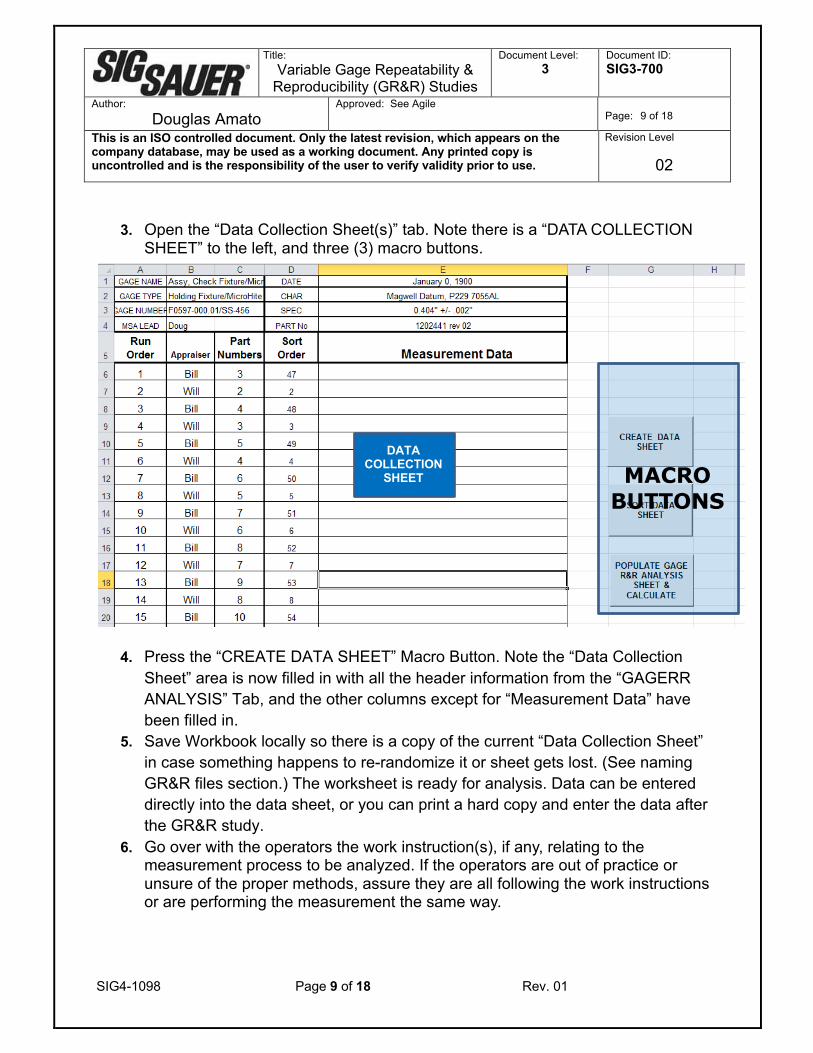
3. Open the “Data Collection Sheet(s)” tab. Note there is a “DATA COLLECTION
SHEET” to the left, and three (3) macro buttons.
4. Press the “CREATE DATA SHEET” Macro Button. Note the “Data Collection Sheet” area is now filled in with all the header information from the “GAGERR ANALYSIS” Tab, and the other columns except for “Measurement Data” have been filled in.
5. Save Workbook locally so there is a copy of the current “Data Collection Sheet” in case something happens to re-randomize it or sheet gets lost. (See naming GR&R files section.) The worksheet is ready for analysis. Data can be entered directly into the data sheet, or you can print a hard copy and enter the data after the GR&R study.
6. Go over with the operators the work instruction(s), if any, relating to the measurement process to be analyzed. If the operators are out of practice or unsure of the proper methods, assure they are all following the work instructions or are performing the measurement the same way.
DATA COLLECTION
SHEET MACRO BUTTONS
A.1.a. Title: Variable Gage Repeatability &
Reproducibility (GR&R) Studies
Document Level: 3
Document ID: SIG3-700
Author: Douglas Amato
Approved: See Agile
Page: 10 of 18
This is an ISO controlled document. Only the latest revision, which appears on the company database, may be used as a working document. Any printed copy is uncontrolled and is the responsibility of the user to verify validity prior to use.
Revision Level
02
SIG4-1098 Page 10 of 18 Rev. 01
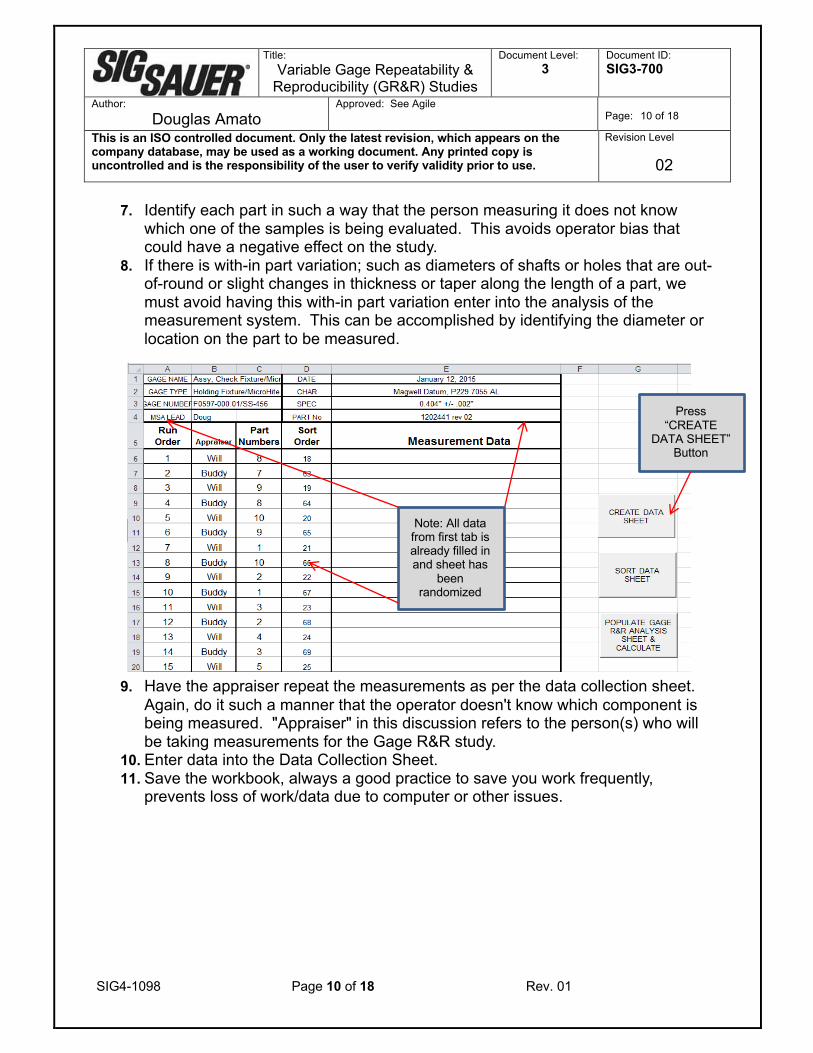
7. Identify each part in such a way that the person measuring it does not know which one of the samples is being evaluated. This avoids operator bias that could have a negative effect on the study.
8. If there is with-in part variation; such as diameters of shafts or holes that are out-of-round or slight changes in thickness or taper along the length of a part, we must avoid having this with-in part variation enter into the analysis of the measurement system. This can be accomplished by identifying the diameter or location on the part to be measured.
9. Have the appraiser repeat the measurements as per the data collection sheet.
Again, do it such a manner that the operator doesn't know which component is being measured. "Appraiser" in this discussion refers to the person(s) who will be taking measurements for the Gage R&R study.
10. Enter data into the Data Collection Sheet. 11. Save the workbook, always a good practice to save you work frequently,
prevents loss of work/data due to computer or other issues.
Note: All data from first tab is already filled in and sheet has
been randomized
Press “CREATE
DATA SHEET” Button
A.1.a. Title: Variable Gage Repeatability &
Reproducibility (GR&R) Studies
Document Level: 3
Document ID: SIG3-700
Author: Douglas Amato
Approved: See Agile
Page: 11 of 18
This is an ISO controlled document. Only the latest revision, which appears on the company database, may be used as a working document. Any printed copy is uncontrolled and is the responsibility of the user to verify validity prior to use.
Revision Level
02
SIG4-1098 Page 11 of 18 Rev. 01
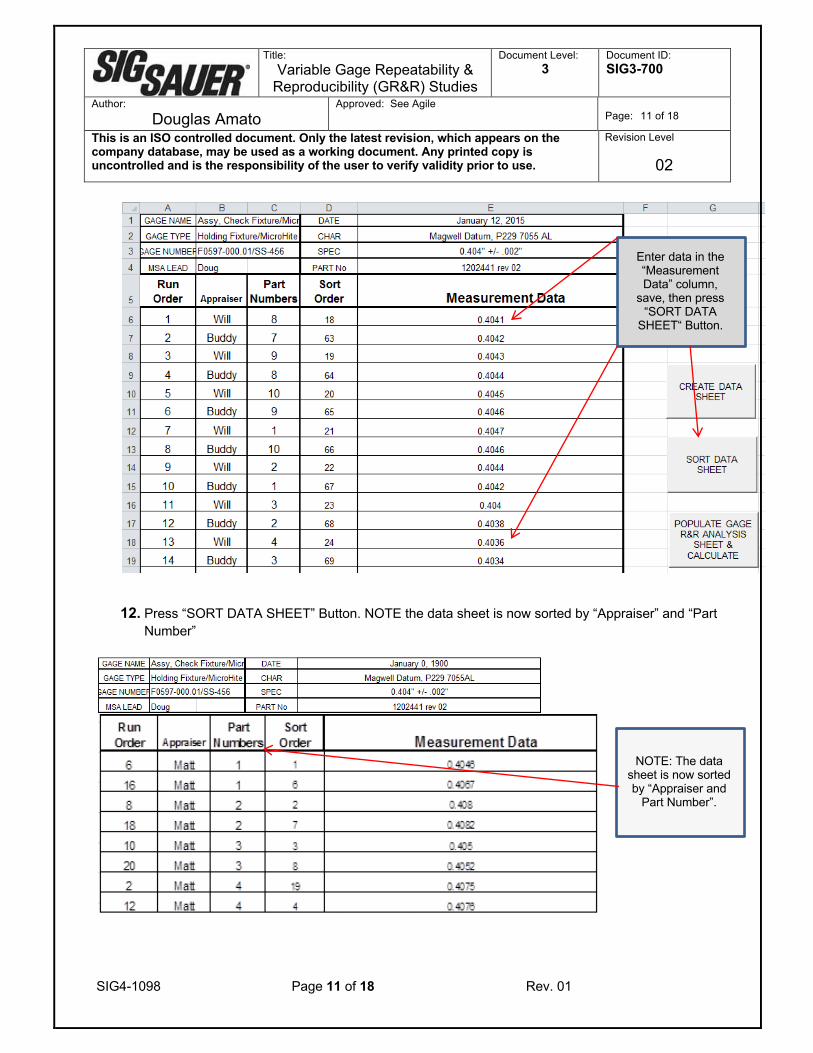
12. Press “SORT DATA SHEET” Button. NOTE the data sheet is now sorted by “Appraiser” and “Part
Number”
NOTE: The data sheet is now sorted by “Appraiser and
Part Number”.
Enter data in the “Measurement Data” column,
save, then press “SORT DATA
SHEET“ Button.
A.1.a. Title: Variable Gage Repeatability &
Reproducibility (GR&R) Studies
Document Level: 3
Document ID: SIG3-700
Author: Douglas Amato
Approved: See Agile
Page: 12 of 18
This is an ISO controlled document. Only the latest revision, which appears on the company database, may be used as a working document. Any printed copy is uncontrolled and is the responsibility of the user to verify validity prior to use.
Revision Level
02
SIG4-1098 Page 12 of 18 Rev. 01
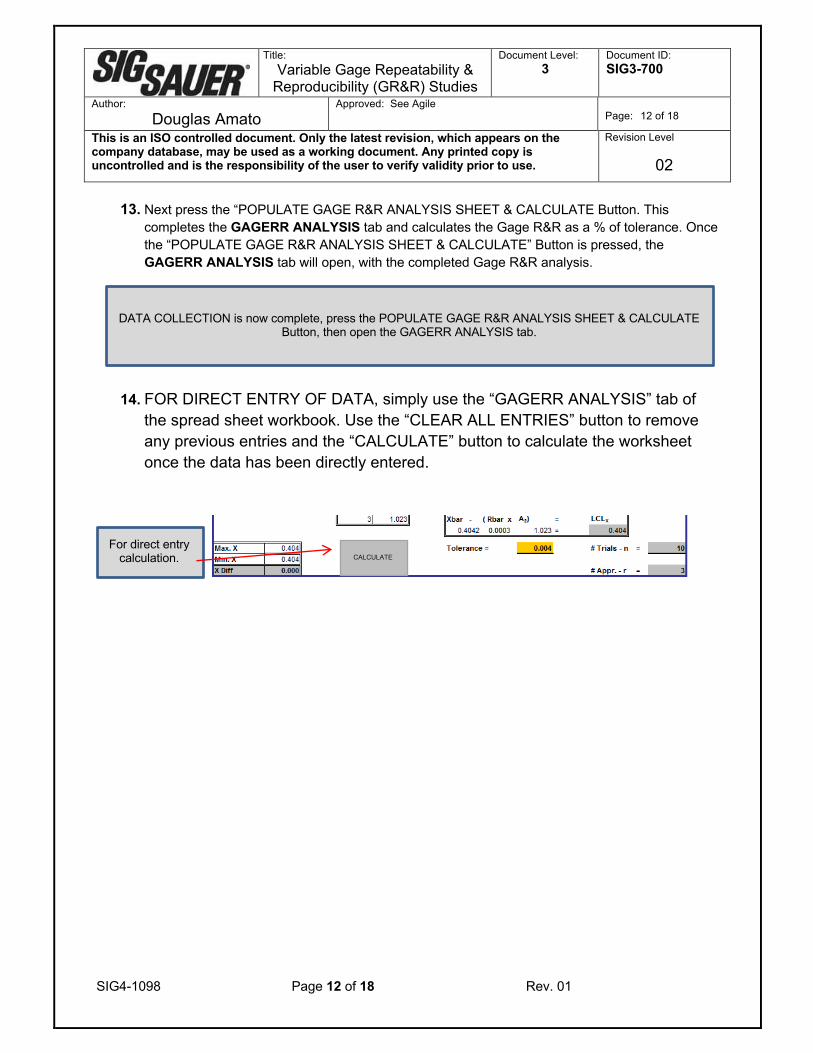
13. Next press the “POPULATE GAGE R&R ANALYSIS SHEET & CALCULATE Button. This completes the GAGERR ANALYSIS tab and calculates the Gage R&R as a % of tolerance. Once the “POPULATE GAGE R&R ANALYSIS SHEET & CALCULATE” Button is pressed, the GAGERR ANALYSIS tab will open, with the completed Gage R&R analysis.
14. FOR DIRECT ENTRY OF DATA, simply use the “GAGERR ANALYSIS” tab of the spread sheet workbook. Use the “CLEAR ALL ENTRIES” button to remove any previous entries and the “CALCULATE” button to calculate the worksheet once the data has been directly entered.
DATA COLLECTION is now complete, press the POPULATE GAGE R&R ANALYSIS SHEET & CALCULATE Button, then open the GAGERR ANALYSIS tab.
CALCULATE For direct entry
calculation.
A.1.a. Title: Variable Gage Repeatability &
Reproducibility (GR&R) Studies
Document Level: 3
Document ID: SIG3-700
Author: Douglas Amato
Approved: See Agile
Page: 13 of 18
This is an ISO controlled document. Only the latest revision, which appears on the company database, may be used as a working document. Any printed copy is uncontrolled and is the responsibility of the user to verify validity prior to use.
Revision Level
02
SIG4-1098 Page 13 of 18 Rev. 01
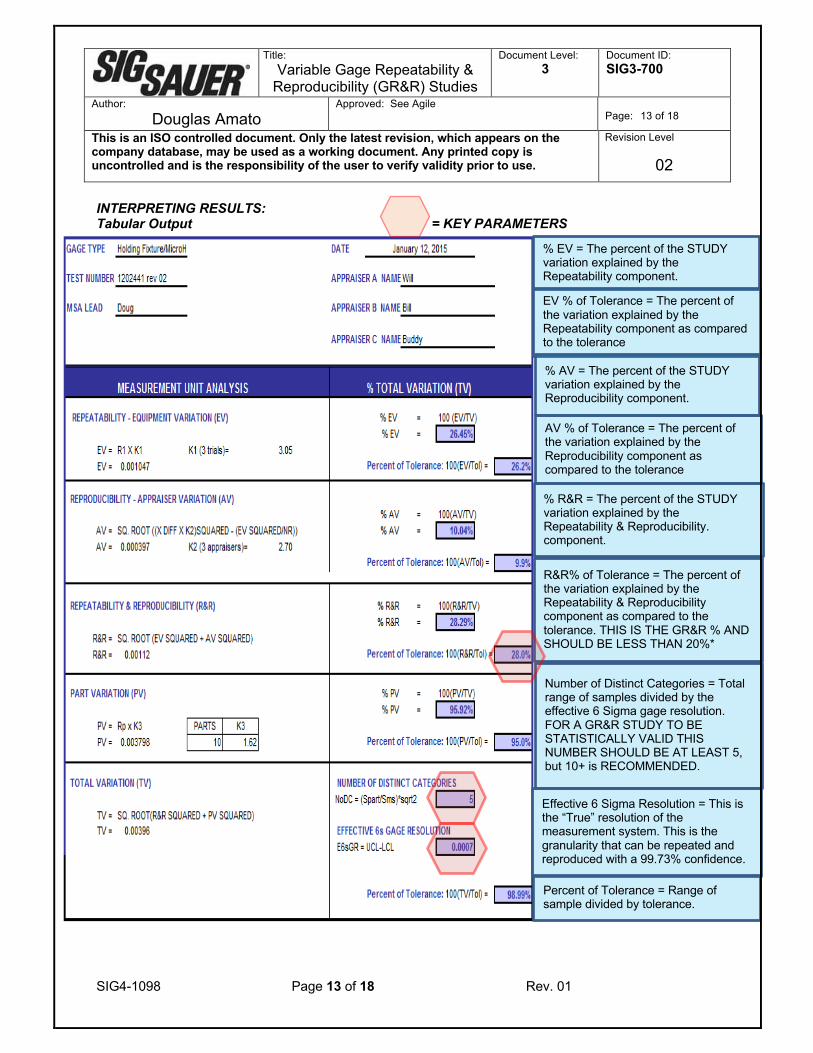
INTERPRETING RESULTS: Tabular Output = KEY PARAMETERS
% EV = The percent of the STUDY variation explained by the Repeatability component.
EV % of Tolerance = The percent of the variation explained by the Repeatability component as compared to the tolerance
AV % of Tolerance = The percent of the variation explained by the Reproducibility component as compared to the tolerance
% AV = The percent of the STUDY variation explained by the Reproducibility component.
% R&R = The percent of the STUDY variation explained by the Repeatability & Reproducibility. component.
R&R% of Tolerance = The percent of the variation explained by the Repeatability & Reproducibility component as compared to the tolerance. THIS IS THE GR&R % AND SHOULD BE LESS THAN 20%*
Number of Distinct Categories = Total range of samples divided by the effective 6 Sigma gage resolution. FOR A GR&R STUDY TO BE STATISTICALLY VALID THIS NUMBER SHOULD BE AT LEAST 5, but 10+ is RECOMMENDED.
Effective 6 Sigma Resolution = This is the “True” resolution of the measurement system. This is the granularity that can be repeated and reproduced with a 99.73% confidence.
Percent of Tolerance = Range of sample divided by tolerance.
A.1.a. Title: Variable Gage Repeatability &
Reproducibility (GR&R) Studies
Document Level: 3
Document ID: SIG3-700
Author: Douglas Amato
Approved: See Agile
Page: 14 of 18
This is an ISO controlled document. Only the latest revision, which appears on the company database, may be used as a working document. Any printed copy is uncontrolled and is the responsibility of the user to verify validity prior to use.
Revision Level
02
SIG4-1098 Page 14 of 18 Rev. 01
15. If the EV% is much greater than the AV%,(5X plus), there gage resolution is probably too small. To improve, try a measurement device with a greater resolution, i.e. have the ability to divide the measurements into smaller pieces.
16. In the AV% is much greater than the EV%, there is a distinct difference in the way each appraiser is measuring, training and/or more detailed work instructions might be required.
17. If the number of distinct categories is less than 5, the samples need more variation OR the resolution of the measurement instrument is too small.
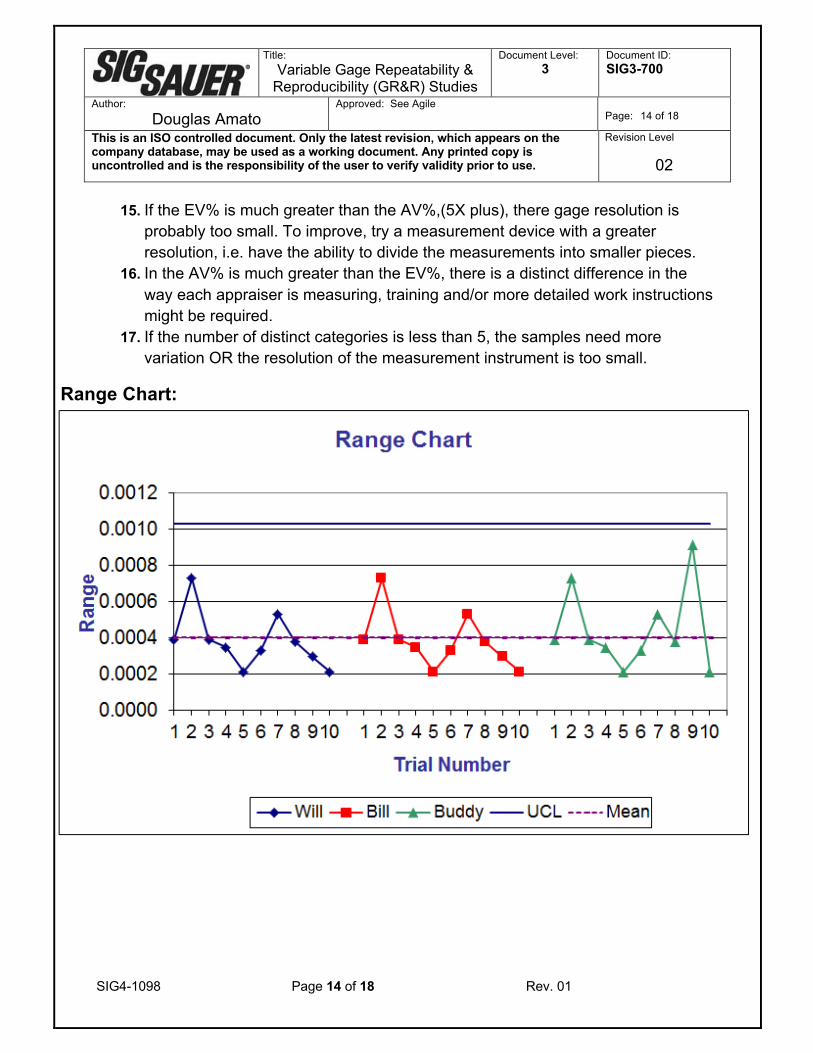
Range Chart:
A.1.a. Title: Variable Gage Repeatability &
Reproducibility (GR&R) Studies
Document Level: 3
Document ID: SIG3-700
Author: Douglas Amato
Approved: See Agile
Page: 15 of 18
This is an ISO controlled document. Only the latest revision, which appears on the company database, may be used as a working document. Any printed copy is uncontrolled and is the responsibility of the user to verify validity prior to use.
Revision Level
02
SIG4-1098 Page 15 of 18 Rev. 01
18. The range chart will help identify which sample number had the most variation
between readings. It is a good idea to look this over the range chart and identify those samples and runs with the highest value, as these had the most variation between measurements. For this example, examine the data for sample number “2” for all operators, number “7” for all operators and number “9” for operator “3”, “Buddy”. In all cases when there is a large difference in range for a few samples, check for:
a. Was there a typo, or a transposed number. b. Decimal point in the wrong place. c. Sample numbers mixed. d. Other data collection errors. e. Also go back and look at the sample parts, is there a reason 2, 7 & 9 have
a greater range between readings than the other samples? f. Are there burrs, flash or other debris causing variation? g. Was the measurement surface uneven, in that a different area was
measured each time? h. Was the sample moving or not stable? i. Did the environment suddenly change during the GR&R study? j. Was there a big temperature swing? k. Was there a major change in humidity, dust, etc.? l. The gage was dropped or adjusted? m. Was there a change in the operator’s technique? n. Other?
A.1.a. Title: Variable Gage Repeatability &
Reproducibility (GR&R) Studies
Document Level: 3
Document ID: SIG3-700
Author: Douglas Amato
Approved: See Agile
Page: 16 of 18
This is an ISO controlled document. Only the latest revision, which appears on the company database, may be used as a working document. Any printed copy is uncontrolled and is the responsibility of the user to verify validity prior to use.
Revision Level
02
SIG4-1098 Page 16 of 18 Rev. 01
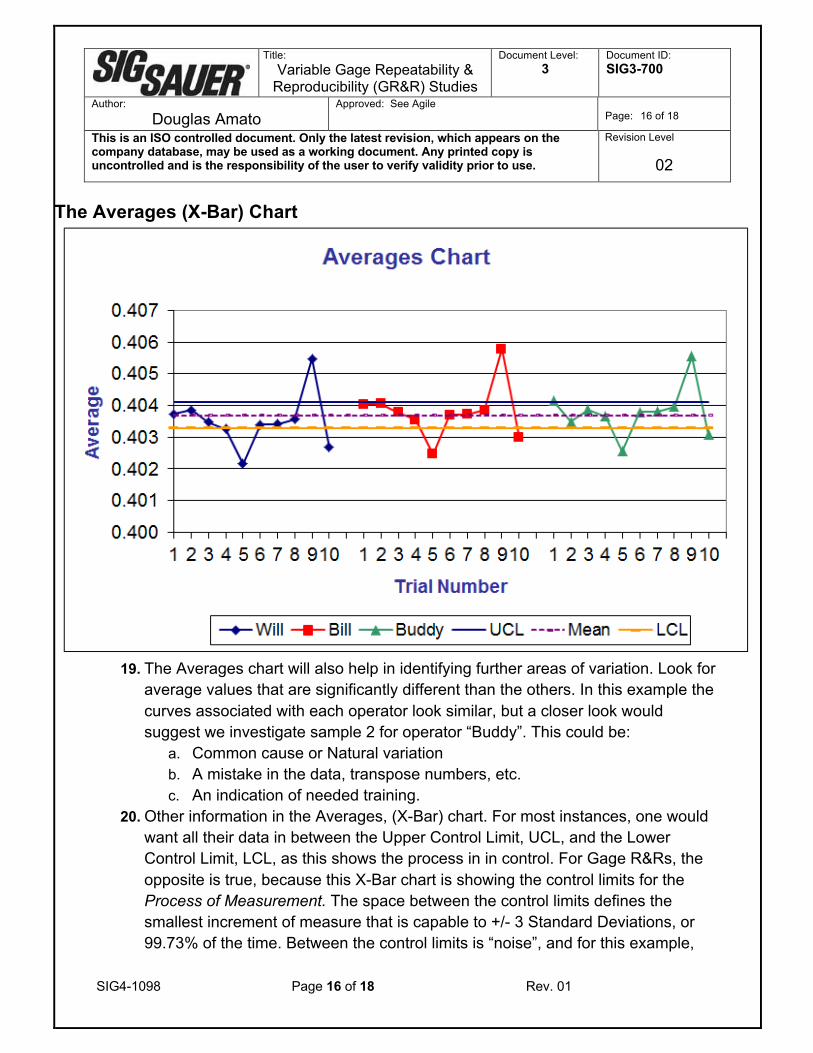
The Averages (X-Bar) Chart
19. The Averages chart will also help in identifying further areas of variation. Look for
average values that are significantly different than the others. In this example the curves associated with each operator look similar, but a closer look would suggest we investigate sample 2 for operator “Buddy”. This could be:
a. Common cause or Natural variation b. A mistake in the data, transpose numbers, etc. c. An indication of needed training.
20. Other information in the Averages, (X-Bar) chart. For most instances, one would want all their data in between the Upper Control Limit, UCL, and the Lower Control Limit, LCL, as this shows the process in in control. For Gage R&Rs, the opposite is true, because this X-Bar chart is showing the control limits for the Process of Measurement. The space between the control limits defines the smallest increment of measure that is capable to +/- 3 Standard Deviations, or 99.73% of the time. Between the control limits is “noise”, and for this example,
A.1.a. Title: Variable Gage Repeatability &
Reproducibility (GR&R) Studies
Document Level: 3
Document ID: SIG3-700
Author: Douglas Amato
Approved: See Agile
Page: 17 of 18
This is an ISO controlled document. Only the latest revision, which appears on the company database, may be used as a working document. Any printed copy is uncontrolled and is the responsibility of the user to verify validity prior to use.
Revision Level
02
SIG4-1098 Page 17 of 18 Rev. 01
data points 1, 2, 3, 4, 6, 7 & 8 would be statistically the same. A well-designed GR&R, utilizing samples with a great deal of variation, would have most of the data points outside the control limits. Remember the reason to perform a GR&R is to prove the measurement device is capable of determining conforming from non-conforming feature or specification, through the whole range of dimensions the feature or specification might exhibit.
SAVING A COMPLETED GAGE R&R 21. Open the current Gage R&R excel sheet to the GAGERR ANALYSIS tab. Go to:
file>print>printer>Adobe PDF and press print. A dialog box will appear asking where to save the file and under what name. Save file to:
a. G:\MSA Measurement System Analysis\GR&R, per the file name as per the NAMING GAGE REPEATABILITY AND REPRODUCIBILITY (GR&R) FILES section.
22. Once .PDF has been saved properly, send an email to the Calibration Engineer/Manager stating the following:
a. Gage name b. Fixture Number or Gage, (“F” or “G” number) with serial number is
applicable. c. Calibration number(s). Use the calibration number for the Fixture or Gage
first, then any off the shelf gage Calibration numbers. These are on a small sticker starting with SS-
d. Part name e. Part Number f. Balloon Number of feature(s) being analyzed.
NAMING GAGE REPEATABILITY AND REPRODUCIBILITY (GR&R) FILES:
23. Naming the GR&R files should follow the following convention, and order of precedence:
b. “F”-Fixture Number, Serial Number & Calibration Number c. “G”-Gage Number, Serial Number & Calibration Number d. Off the shelf or common gage/measuring device Calibration Number. e. Date in YYMMDD format.
24. The naming format will be in the format of: f. FIXTURE/GAGE#.SN-CALIBRATION#-YYMMDD
A.1.a. Title: Variable Gage Repeatability &
Reproducibility (GR&R) Studies
Document Level: 3
Document ID: SIG3-700
Author: Douglas Amato
Approved: See Agile
Page: 18 of 18
This is an ISO controlled document. Only the latest revision, which appears on the company database, may be used as a working document. Any printed copy is uncontrolled and is the responsibility of the user to verify validity prior to use.
Revision Level
02
SIG4-1098 Page 18 of 18 Rev. 01
25. Examples: g. Classic Pistol Lock face Gage, G277 serial number .01 with a Mitutoyo
Drop Indicator SS-1234. Part Number 1201086, Part name P226 barrel, op1, March 10, 2015.
h. File name would then be: G277-02_SS-1234_150310
F. Records: The records for this process shall be maintained in the “G:”, Shared drive in the MSA folder. See naming convention. G. Responsibility & Authority: The responsibility for compliance with this procedure resides with the Director of Quality and area Quality Engineers. H. Amendment Record:
Date Rev Details Initials
4/25/15 00 Initial Release Douglas Amato
6/15/15 01 Updated to the GRR Workbook for added automation Matt Menard
8/10/20 02 Added additional definitions, changed requirement on GR&R% that are between 20-30% Douglas Amato


![Gauge & R&R [Repeatability & Reproducibility] Analysis](https://static.fdocuments.net/doc/165x107/54becf3e4a7959a67f8b4696/gauge-rr-repeatability-reproducibility-analysis.jpg)