Short Range Air Defense (SHORAD) Engagement … · DECLASSIFICATION IDOWNGRADING SCHEDULE...
120
ARI Research Note 91-06 Short Range Air Defense (SHORAD) Engagement Performance Criteria Development and Validation CM Andrew V. Barber IN Science Applications International Corporation for Contracting Officer's Representative John M. Lockhart Field Unit at Fort Bliss, Texas Michael H. Strub, Chief Systems Research Laboratory Robin L. Keesee, Director OTIC . ELECTE October 1990 NOV15 199011 0.11 United States Army Research Institute for the Behavioral and Social Sciences Approved for public release: distribution is unlimited. 90
Transcript of Short Range Air Defense (SHORAD) Engagement … · DECLASSIFICATION IDOWNGRADING SCHEDULE...

ARI Research Note 91-06
Short Range Air Defense (SHORAD)Engagement Performance Criteria
Development and Validation
CM Andrew V. BarberINScience Applications International Corporation
for
Contracting Officer's RepresentativeJohn M. Lockhart
Field Unit at Fort Bliss, TexasMichael H. Strub, Chief
Systems Research LaboratoryRobin L. Keesee, Director OTIC
. ELECTEOctober 1990 NOV15 199011
0.11
United States ArmyResearch Institute for the Behavioral and Social Sciences
Approved for public release: distribution is unlimited.
9 0
U.S. ARMY RESEARCH INSTITUTEFOR THE BEHAVIORAL AND SOCIAL SCIENCES
A Field Operating Agency Under the Jurisdictionof the Deputy Chief of Staff for Personnel
EDGAR M. JOHNSON JON W. BLADESTechnical Director COL, IN
Commanding
Research accomplished under contractfor the Department of the Army _____-_.___n___r
.\31on For
Science Applications International Corporation ,-' GRA&I
-:,nouneed El
Technical review by :By
Michael W. Gero 1 -,1istribution/
I Availability CodesAvail and/or
iDist Special
fi
NOTICES
DISTRIBUTION: This report has been cleared for release to the Defense Technical InformationCenter (DTIC) to comply with regulatory requirements. It has been given no primary distributionother than to DTIC and will be available only through DTIC or the National TechnicalInformation Service (NTIS).
FINAL DISPOSITION: This report may be destroyed when it is no longer needed. Please do notreturn it to the U.S. Army Research Institute for the Behavioral and Social Sciences.
NOTE: The views, opinions, and findings in this report are those of the author(s) and should notbe construed as an official Department of the Army position, policy, or decision, unless sodesignated by other authorized documents.

UNCLASSIFIEDSECURITY CLASSIFICATION OF THIS PAGE
Form ApprovedREPORT DOCUMENTATION PAGE OMB No. 0704-0188
la. REPORT SECURITY CLASSIFICATION lb. RESTRICTIVE MARKINGS
-Unclassified --2a. SECURITY CLASSIFICATION AUTHORITY 3. DISTRIBUTION /AVAILABILITY OF REPORT--- __Approved for public release;2b. DECLASSIFICATION IDOWNGRADING SCHEDULE distribution is unlimited.
4. PERFORMING ORGANIZATION REPORT NUMBER(S) S. MONITORING ORGANIZATION REPORT NUMBER(S)
ARI Research Note 91-06
6a. NAME OF PERFORMING ORGANIZATION 6b. OFFICE SYMBOL 7a. NAME OF MONITORING ORGANIZATION
Science Applications1 (If applicable) U.S. Army Research Institute
International Corporation _- Fort Bliss Field Unit
6c. ADDRESS (City, State, and ZIP Code) 7b. ADDRESS (City, State, and ZIP Code)
5959 Gateway West, Suite 542 P.O. Box 6057El Paso, TX 79925 Fort Bliss, TX 79906-0057
8a. NAME OF FUNDING/SPONSORING 18b. OFFICE SYMBOL 9. PROCUREMENT INSTRUMENT IDENTIFICATION NUMBERORGANIZATION U.S. Army Research (If applicable) I 3I
Institute for the Behavioral MDA903-85-C-0460and Social Sciences PERI-S8c. ADDRESS (City, State, and ZIP Code) 10. SOURCE OF FUNDING NUMBERS
5001 Eisenhower Avenue PROGRAM PROJECT I TASK WORK UNIT
Alexandria, VA 22333-5600 ELEMENT NO. NO. NO. ACCESSION NO.63007A 793 I1201 C01
11. TITLE (include Security Classification)
Short Range Air Defense (SHORAD) Engagement Performance CriteriaDevelopment and Validation
12. PERSONAL AUTHOR(S)Barber, Andrew V. (SAIC)
13a. TYPE OF REPORT 13b. TIME COVERED 514. DATE OF REPORT (Year, Month,Day) -1S. PAGE COUNTFinal FROM 88/10 TO.90/02 I 1990, October 12116. SUPPLEMENTARY NOTATION
Contracting Officer's Representative, John M. Lockhart
17. COSATI CODES 18. SUBJECT TERMS (Continue on reverse if necessary and identify by block number)
FIELD GROUP SUB-GROUP Short Range Air Defense (SHORAD) Chaparral
05 08 Engagement simulation Vulcan
05 09 Stinger19. ABSTRACT (Continue on reverse if necessary and identify by block number)
SThe purpose of this research was to validate and calibrate performance criteria forShort Range Air Defense task and summary engagements for use in the training, evaluation,and qualification of Career Management Field 16 Series soldiers. In 1989, engagement per-formance criteria were subjected to multiple field test experiments using the Realistic Air
Defense Engagement System (RADES) and the Range Target System (RTS). Participants weresoldiers using the Stinger, Chaparral, and Vulcan air defense weapons. Engagement perfor-mance varied as a function of experience level, scenario difficulty level, and individualdifferences in ability and personality. These results enabled the fine tuning of performanceand scenario difficulty criteria. Performance standards are proposed.
SI •• , p o, ,p -. //
20. DISTRIBUTION /AVAILABILITY OF ABSTRACT 21. ABSTRACT SECURITY CLASSIFICATION[- UNCLASSIFIED/UNLIMITED C0 SAME AS RPT. D DTIC USERS Unclassified
22a. NAME OF RESPONSIBLE INDIVIDUAL 22b TELEPHONE (Include Area Code) 22c OFFICE SYMBOL
John M. Lockhart (915) 568-4491 .PE-IT-SB
DD Form 1473, JUN 86 Previous editions are obsolete. SFCURiTY CLASSIFICATION OF THIS PAGE
UNCLASSIFIED

SHORT RANGE AIR DEFENSE (SHORAD) ENGAGEMENT PERFORMANCE CRITERIA
DEVELOPMENT AND VALIDATION
EXECUTIVE SUMMARY
Requirement:
The requirement was to validate and calibrate Short RangeAir Defense (SHORAD) task and summary engagement performancecriteria for use in the training, evaluation, and qualificationof Career Management Field 16 Series soldiers. Validity wasassessed in terms of the sensitivity of the criteria for dis-criminating between qualified and unqualified personnel. Thecalibration of the criteria involved establishing cutoff valuesas a function of scenario difficulty level. Task and summaryperformance measures and cutoff values were determined forStinger, Chaparral, and Vulcan weapon systems personnel.
Procedure:
Engagement performance criteria were subjected to multiplefield test experiments employing the Realistic Air Defense En-gagement System (RADES) and the Range Target System (RTS) during1989. The tests were conducted by the U.S. Army Research Insti-tute for the Behavioral and Social Sciences (ARI) and ScienceApplications International Corporation (SAIC). The participantswere soldiers using the Stinger, Chaparral, or Vulcan weapons.Engagement simulation exercises were conducted to investigate thedegree to which Task Performance Measures (TPM) and Summary Per-formance Measures (SPM) varied as a function of soldier profi-ciency under varying levels of scenario difficulty and experi-ence. Further, TPM and SPM criterion performance cutoff scoreswere adjusted to reflect difficulty level.
Findings:
Given the results of prior experiments, it was predictedthat performance on TPM and SPM would be affected by experiencelevel, scenario difficulty level, and individual differences inability and personality. These findings were replicated. Therewere main effects of experience and scenario difficulty level.The interaction of the two was marginally significant. Further,a number of individual abilities were found to be significantlycorrelated with performance. All of the above results enabled
iii
the fine tuning of performance and scenario difficulty criteriaand their integration into the Army Air Defense Artillery train-ing and qualification process. Consequently, the TPM, SPM, andassociated cutoff scores could be used as diagnostic tools. Thisprovided an added capability of objective performance assessmentto the current system of training and qualification.
Utilization of Findings:
This research enabled the validation and calibration of taskand summary performance measure cutoff criteria. These criteriacan be used to identify qualified and unqualified soldiers.Additionally, predictors of performance were identified thatct;uld be used to screen personnel for certain air defense occu-pations, career paths, or accelerated training program.. Addi-tional research is recommended to adapt the developed and vali-dated standards for operators of the emerging Forward Area AirDefense System (FAADS) weapons and operators as these weapons arebrought into the inventory. The implementation of performancestandards will be promulgated by the Directorate of Training andDevelopment (DOTD), U.S. Army Air Defense Artillery School(USAADASCH), Fort Bliss, Texas.
iv

,!
SHORT RANGE AIR DEFENSE (SHORAD) ENGAGEMENT PERFORMANCE CRITERIADEVELOPMENT AND VALIDATION
CONTENTS
Page
INTRODUCTION .................... ....................... 1
Operational Problems and Potential Solutions ..... ...... 1Objectives ...................... ....................... 2Approach ....................... ........................ 3
PROCEDURES ................ ....... ........................ 7
Participants ..................... ...................... 10Performance Measures ............ .................. 11Scenarios and Presentation Schemes .... ........... .11Individual Differences Variables ..... ............ 20Data Analysis ................ ..................... 24
RESULTS AND DISCUSSION ............ .................. 25
Summary Statistics .............. ................... 25Experimental Effects ............ .................. 29Individual Difference Effects ...... ............. 33
CONCLUSIONS .................... ........................ 43
Scenario Difficulty ............ .................. 43Criteria Calibration .............. .................. 45Individual Differences .......... ................. 45
REFERENCES .................... ........................ 49
APPENDIX A. SUMMARY STATISTICS FOR SUMMER,1989 RADES TESTS .......... ............... A-I
B. SUMMARY STATISTICS FOR FALL,1989 RTS TESTS .......... ................ B-I
C. INDIVIDUAL DIFFERENCES STATISTICS ...... C-I
v

CONTENTS (Continued)
Page
LIST OF TABLES
Table 1. Candidate Task Performance Measures(TPM) .............. ..................... .. 12
2. Candidate Summary Performance Measures(SPM) .............. ..................... .. 13
3. Preliminary Task Performance Criteria(Drewfs & Barber, 1990) ..... ............. .. 14
4. Preliminary Summary Performance Criteria(Drewfs & Barber, 1990) .... ............ .. 15
5. Summer 1989 RADES test scenarios .......... .. 16
6. Summer 1989 RADES tests: Scenariopresentation scheme ...... .............. .. 17
7. Fall 1989 RTS test scenarios ............. .. 18
8. Fall 1989 RTS tests: Scenariopresentation scheme ...... .............. .. 19
9. Individual Differences Measures ......... .. 21
10. Aircraft familiarity, discriminability,and identification accuracy ... .......... .. 26
11. Air defense summary performance ascompared to recommended standards ....... .. 27
12. Air defense task performance as comparedto recommended standards .... ............ .. 28
13. Chaparral experimental effects(Summer, 1989 RADES Test) .... ........... .. 35
14. Vulcan experimental effects(Summer, 1989 RADES Test) .... ........... .. 36
15. Stinger experimental effects(Fall, 1989 RTS Test) ...... ............. .. 37
16. Vulcan experimental effects(Fall, 1989 RTS Test) ...... ............. .. 37
vi

CONTENTS (Continued)
Page
Table 17. Overall experimental effects ofsingle versus multiple targets ........... .. 38
18. Additional performance comparisons byskill level (1,2,3) for medium difficultyscenarios ............ ................... .. 39
19. Performance comparisons by weapon typefor low to medium difficulty scenarios(Summer, 1989 RADES Test) .... ........... .. 40
20. Summary of individual differencescorrelates ........... ................... .. 41
21. Scenario specifications by difficultylevel .............. ..................... .. 44
22. Recommended task performance criteria ..... 46
23. Recommended summary performance criteria. . . . 47
LIST OF FIGURES
Figure 1. Range layout ......... .................... 8
vii
SHORT RANGE AIR DEFENSE (SHORAD)ENGAGEMENT PERFORMANCE CRITERIA DEVELOPMENT AND VALIDATION
INTRODUCTION
Operational Problems and. Potential Solutions
The current method of training and qualifying Army AirDefense Artillery (ADA) personnel has a number of deficiencies.
"* Current training methods and strategies focus onindividual gunner tasks and gunner qualification(Headquarters, D.A., 1988). Consequently, squad leadertasks and collective crew tasks are neglecLed.
"* Current trainers (two-dimensional) do not provide therealism or flexibility to ensure attainment andsustainment of individual and collective knowledge andskills. Additionally, current training devices do notexercise collective crews or platoons (USAADASCH, 1989).
"* Live fire tests are inadequate for determiningqualification of personnel. Further, there areinsufficient resources to enable all ADA personnel tofire their weapons to qualify (Headquarters, D.A., 1988).
"* The threat has changed rapidly due to the emergence ofnew technologies and capabilities (Daskal, 1990).Performance standards typically do not reflect thecurrent threat, the presence of friendly and hostileaircraft, or associated doctrinal implications.
"• Visual Aircraft Recognition training is limited(Rotchford & Daruwalla, 1987). Training media presenttwo dimensional representations of aircraft, at closerange, with high contrast, and with little variability inorientation.
"* Thus, crew effectiveness cannot be accurately measured.Additionally, training effectiveness and cost-effectiveness cannot be determined.
Improving upon the current training and qualificationprocess is essential. A proficiency-based training system isneeded. The Directorate of Training and Development (DOTD) ofthe US Army Air Defense Artillery School (USAADASCH), incooperation with the US Army Research Institute (ARI) and the USArmy Missile Command (MICOM), Targets Management Office (TMO)contracted for the integration and demonstration of a RangeTarget System (RTS). The purpose of the RTS was to provideexcellence in ADA by eliminating the above deficiencies.
1

This would be accomplished by providing cost-effective,collective crew engagement training, proficiency evaluation,qualification testing, and skill sustainment training for allShort Range Air Defense (SHORAD) personnel. A valid, reliable,and realistic simulator and testbed such as the RTS wouldconstitute a proficiency-based training system that could beemployed Army-wide. RTS is also meant to support future ForwardArea Air Defense Systems (FAADS) with these same simulation andevaluation capabilities, once these weapons systems emerge intothe active inventory.
Training standards reflecting current doctrine, tactics, andthreat were needed. A critical component of the RTS was theSHORAD engagement task and summary performance measures andassociated pass-fail performance criteria (i.e., standards).These criteria needed to be validated and calibrated before beingused by the Army. Once approved, these criteria would beincorporated into range tables, to be integrated into the currentArmy training and qualification process.
Thus, by providing realistic and representative training,updated performance standards, and diaqnostic performanceevaluation tools, the current deficiencies in the training andqualification process could be eliminated, performance achievedcould be determined and compared to standards, and proficiencyand its sustainment could be enhanced. The engagementperformance and scenario difficulty criterion cutoff levels,defined by prior research efforts, were subjected to validitytesting and calibration within the present research effort.
Objectives
This program of research was coordinated between the US ArmyAir Defense Artillery School (USAADASCH) and the US Army ResearchInstitute (ARI). The primary objectives were to develop andvalidate realistic, scenario-driven engagement performancecriteria (draft standards) as a function of scenario difficulty.Secondary goals were to integrate state-of-the-art tarqetpresentation, crew performance measurement, and engagementsimulation capabilities into a Range Target System (RTS) for ADAengagement training and evaluation. The scope of the presentresearch was limited to validation and calibration of SHORAD crewand team engagement performance criteria in the RTS. This wouldbe done for Stinger, Chaparral, and Vulcan weapon systemspersonnel. There were known differences attributable to theweapons and associated mission requirements. Attaining the aboveobjectives would mean the following requirements were met:
2

* Discriminate ability level as a function of experience.
* Determine the level of performance necessary to declare asoldier qualified or unqualified.
* Test and evaluate crew, team, and operator performance toidentify and focus corrective and sustainment trainingneeds.
e Delineate the required operational and experimental testconditions for fair, accurate, and reliable applicationof the performance criteria.
* Establish (calibrate) the cutoff scores for varyinglevels of scenario difficulty (low, medium, and high),and determine the subsequent effect on the performancestandards for each difficulty level.
Approach
The process of developing standards of performance beganwith the validation of the Realistic Air Defense EngagementSystem (RADES). This research demonstrated the validity of usingscaled targets in a realistic three-dimensional battlesimulation, where performance could be scored in terms ofreaction time, aircraft range, and summary outcomes. Four yearsof research enabled the establishment of summary and taskperformance measures, baseline performance parameters for SHORADsoldiers, the identification of individual differences affectingperformance (especially vision and experience), and thedetermination of conditional effects (e.g., environment, commandand control, difficulty, doctrine, and tactics) on performance.
From this research, preliminary performance criteria andscenario difficulty scaling factors were derived. Factorsreflecting scenario difficulty included target visibility (e.g.,distance, contrast, aspect angle, etc.), workload (e.g., numberof active targets), and cuing (e.g., timeliness, accuracy, andsimplicity). The criteria development, validation, andcalibration process followed. The requirement addressed by thatresearch effort was to "Determine operator engagement task andsummary performance parameters, scenarios, scenario difficultyscaling factors, performance measures, performance scoring, draftperformance criteria, and test administrative procedures forapplying qualificaticn standards to Career Management Field 16S(Stinger), 16P (Chaparral), and 16R (Vulcan) soldiers." Criteriawere established according to scenario difficulty level and weresubjected to prevalidation experiments. The current effort wasto further validate and calibrate the cutoffs for performancecriteria and scenario difficulty levels.
3
Thus, this research subjected previously developed andtested engagement performance criteria to additional experimentaltests. These experiments were conducted using RADES and the RTSprototype configuration. The effort involved the design andadministration of field test experiments, reduction and analysisof field test data, interpretation of results, and subsequentvalidation and calibration of task and summary performancemeasures and scenario difficulty levels.
The outline which follows provides a synopsis of the airdefense research results generated to date by ARI and ScienceApplications International Corpo.ation (SAIC), and contributingto the development of the standards, difficulty indices, andperformance predictors. This research culminated in thevalidation and calibration of SHORAD engagement standards.
* Drewfs, Barber, Johnson, & Frederickson, 1988- Validation of RADES testbed- Validation of scaled targets
* Johnson, Barber & Lockhart, 1988- Target visibility (background contrast & aspect angle)
effects identified
"* Barber, 1987- Baseline performance parameters established- Validity of testbed and targets replicated- Early warning and cuing effects identified- Command, control, and communications (C3) effects
identified (e.g., timeliness, accuracy, and brevity)- Effects of different cuing techniques identified
(simple, two-dimensional graphics displays provided theminimum essential information required by the fire unit,thereby yielding the best performance)
- Effects of conflicting C3 inputs caused a degradation inperformance (also influenced by personality traitswhich typically emerge during uncertainty and confusion)
- Performance improved with practice in RADES- Performance influenced by individual differences (in
order of importance): experience (training level),visual sensation and perception, cognitive andpsychomotor skills, personality attributes
- Target visibility (size & aspect) effects on performance- Environmental conditions (temperature, wind, &
visibility) effects identified
"* Barber, Drewfs, & Lockhart, 1987- Validation of RADES testbed as training device- Visual ability effects on performance replicated
"* Barber, Drewfs, & Johnson, 1987- Validation of RADES testbed as training device replicated
4

* Drewfs & Barber, 1990- Optimum performance test measures and scoring
methods identified- Preliminary performance criteria established- Performance test cotiditions established- Scenario difficulty indices determined- Target type (fixed or rotary wing), size, and intent
(friend or hostile) effects on performance replicated- Multiple target effects on performance replicated- Target visibility (aspect, offset, speed, & elevation)
effects on performance replicated- Scenario difficulty effects on performance identified
* Drewfs & Barber, 1988- Cuing effects on performance replicaced- Weapon type effects on performance determined- Environmental conditions (wind, visibility, cloudiness,
& temperature) effects on performance replicated- Target visibility (range, aspect, speed, & terrain)
effects on performance replicated- Experience (training) level effects replicated- Preliminary calibration and validation of criteria
* Barber, 1990- Effects on performance of soldier vision, soldier
experience, cuing, weapon type, environmental conditions,and target characteristics (i.e., visibility) replicated
5
PROCEDURES
Performance in realistic air defense scenarios was evaluatedto determine the degree to which Task Performance Measures (TPM)and Summary Performance Measures (SPM) could be used to assessindividual operator and collective crew-team proficiency undervarying levels of scenario difficulty. Tactical and doctrinalrequirements (mission, procedures, and threat) were provided byARI and DOTD, USAADASCH.
The dependent variables were the TPM and SPM. Independentvariables were scenario difficulty level (low, medium, and high),and soldier experience level (low, medium, and high). Scenariodifficulty was counterbalanced during execution of testscenarios. Predictor variables cons 3ted of selected soldierindividual differences measures.
There were six experiments. Soldiers from three weapongroups (Stinger, Chaparral, and Vulcan) participated in RADESsimulations during Summer of 1989. Different soldiers from thesesame weapon groups participated in RTS simulations during Fall of1989. All tests were conducted at Condron Field, White SandsMissile Range, NM. This range provided rolling, desert terrainconsisting of vegetated sand dunes and mountains in the distance.Figure 1 illustrates the range layout employed in theexperiments. The range area was 3 kilometers (km) wide (x), by3-4 km long (y), by .5 km high (z). This mini-range layoutrealistically simulated a full scale maximum range of 20 km, anda full scale maximum ceiling (altitude) of 2.5 km.
Weapon teams received 12 scenario presentations, with eachscenario having a predesignated difficulty level. Two groups ofsubjects participated each day, one in the morning and one in theafternoon. While one group participated in the air defensesimulations, the other received individual differences testing.Two sets of different but equally difficult scenarios were usedso that the group participating in the morning could not help theafternoon group during their lunch break.
Before participating in the simulations, the 3oldiers werebriefed and given an operations order. Soldiers were assigned a90 degree search sector defined by a left and right search limit,and a primary target line (PTL) at 12 o'clock. All targets werepresented within this search sector and cued according to clockazimuth (e.g., 11:00, 12:00, or 1:00). A practice scenariocontaining one fixed wing (FW) and one rotary wing (RW) targetwas presented as a warm up trial.
7

11:00 FW Run 12:00 FW Run 1:00 FW Run
\ /4 \I iI
20
\I i2I /
0* ,^ 3, ez\I /
2 (1) / 10 • Launch
Sumer 1989 RADES Tests Fall 1989 RTS TestsHelicopter Locations Helico.ter LocationsSTNG 1 , , T, , ,6 7 2 ST NG : 3 ,4 ,5 6 ,7 ,9CHAP: 1,2,3,4,5,6,7,8,12 CH AP: 3,4,5,'6,7,9VULC: 5,6,7,8,9,10,11,12 Weapon(s) VULC: 6,7,8,9,10,12
Figure 1. Range Layout
8
FW scenarios were either ingressing or ingressing-crossing.RW targets popped-up within the search sector at predesignatedlocations and simulated a hover maneuver. RADES tests used 1/5scale RW and 1/7 scale FW targets. RTS tests used 1/5 scale RWand FW targets. RW targets were presented 1 to 3 simulated fullscale km from gun systems and 2 to 6.5 km from missile systems.FW targets flew within 1 simulated full scale km of gun systemsand 2 km of missile systems. This was done because missilesystems (i.e., Stinger and Chaparral) have a substantiallygreater range than gun systems (Vulcan with the simulated use ofProduct Improved Vulcan Air Defense System (PIVADS) ammunition).
Workload was kept at a moderate level to control for effectsof fatigue and vigilance decrements. To control for targetvisibility, the tests were conducted during daylight, skybackground, and clear weather conditions. To control for arousallevel and different search strategies, alerting and cuing wereemployed. For multiple targets, the target cued was always theone posing the greatest threat (i.e., the hostile target, theclosest hostile target, or the hostile target nearest the fireunit's PTL). To ensure all aircraft were visually identified,doctrinal controls were employed such as ADA Warning "Red",Weapons Control Status "Tight", and Identification Friend or Foe(IFF) interrogation "Unknown". These and other controlspecifications, which were necessary for fair application of thestandards, are listed below.
e Sky Background* Clear Day (20+ miles visibility)e Stationary Weapon Position* 90 Degree Search Sector* Unaided Detection* Aided Recognition (binoculars)* Clock Azimuth Cuing (+/- 15 degrees)o Early Warning Voice Message (20-60 seconds before
availability)* Air Defense Warning Red"* Weapons Control Status Tight"* IFF Return Unknowno One Practice Trial"* No Trial-by-Trial Feedback (end of day feedback only)"* Windspeed Less Than 25 MPH"* Randomized Scenario Order"* Standardized Scenario Sets"* Standard Target Coloration"* Matched Target Sizes"* FW Airspeed: 80 to 90 MPH"* FW Availability: 20 Kilometers (Km)"* RW Range: Stinger = 2 to 6.5 Km; Chaparral = 2 to 6.5 Km;
Vulcan = 1 to 3 Kmo 4-Hour Test Periods
9

Participants
Test participants were Stinger (16S), Chaparral (16P), andVulcan (16R) personnel from the following military organizations:
May-Jun 1989 (16R) -- 3rd Battalion (Bn), 56th ADA, 56th ADABrigade (Bde), US Army Training Center (ATC), Ft. Bliss,TX; 5th Bn, 62nd ADA, llth ADA Bde, Ft. Bliss, TX; 2ndBn, 6th ADA Regiment (Regt), 6th ADA Bde, Ft. Bliss, TX;and ist Bn, 188th ADA, North Dakota Army National Guard(ARNG).
Jun 1989 (16P) -- 3rd and 6th Bn, 200th ADA, 111th ADA Bde,New Mexico ARNG.
Jun 1989 (16S) -- 5th Bn, 62nd ADA, llth ADA Bde.
Sep 1989 (16R) -- 3rd Bn, 56th ADA, 56th Bde, US ATC; 5thBn, 62nd ADA, llth ADA Bde; and ADA Training Activity(ADATA), 200th ADA, New Mexico ARNG.
Oct 1989 (16P) -- 2nd Bn, 200th ADA, 111th ADA Bde, NewMexico ARNG; ADATA, 200th ADA, New Mexico ARNG.
Nov 1989 (16S) -- Stinger Platoon, Reqimental Headquarters(HQ), HQ Troop, 3rd Armored Cavalry Regt.
Soldiers varied in their degree of experience. There werethree experience groups. Teams in the high experience group werecomprised of a SSG or SFC Squad Leader and a SGT or SP4 SeniorGunner; teams in the moderate experience group were comprised ofa SGT or SP4 acting as Team-Squad Leader, and a PFC JuniorGunner. Teams in the low experience group were comprised of PVlto PV2 Advanced Individual Training (AIT) personnel.
During Summer 1989 RADES tests and Fall 1989 RTS tests,there were medium and high experience Chaparral troops from theNational Guard, and high experience Stinger and Vulcan troopsfrom Ft. Bliss, Texas. Vulcan AIT personnel (from USAADASCH, Ft.Bliss, TX) also participated during the 1989 RADES and RTS tests.Additional data from Stinger and Chaparral AIT personnel wereavailable from prior tests (Sprinq 1988 RADES tests). Thus, forChaparral, there were three experience qroups (low, medium, andhigh), and for Vulcan and Stinger there were two experiencegroups
The following sample sizes were obtained for each test
(indicates number of squad leader and gunner teams):
1988 RADES 1989 RADES 1989 RTS
Stinger 64 10 20Chaparral 21 24 8Vulcan -- 24 16
I ()

Performance Measures
Table 1 defines the Task Performance Measures (TPM), andTable 2 defines the Summary Performance Measures (SPM) identifiedin previous research and used in all subsequent experiments(including the current effort). TPM are given in elapsed time(in seconds) or aircraft range (in simulated full scalekilometers). SPM are given in percentages. TPM reflectindividual tasks. SPM usually reflect collective tasks, but canalso reflect single scenario task performance (i.e. TPM).Individual TPM can be used diagnostically to identify the sourcesof failure to meet collective SPM pass-fail qualificationcriteria (standards).
Table 3 provides preliminary engagement performance criteriacutoff scores for TPM, and Table 4 provides preliminary criteriacutoff values for SPM. These preliminary criteria are taken fromDrewfs & Barber (1990). As shown in these two tables, thecriteria were established according to type of aircraft (e.g.,rotary or fixed wing) and level of difficulty (high, medium, orlow). Not all TPM and SPM were reliable as performanceevaluation measures because they did not vary substantially, werehighly correlated with other measures, or did not providediagnostic information for evaluating performance. Therecommended TPM and SPM and associated criteria reflected thosemeasures determined to be most reliable and valid.
Scenarios and Presentation Schemes
Tables 5 and 6 describe the difficulty-indexed scenariosemployed in the summer RADES experiments and the scenariopresentation sequences, respectively. Tables 7 and 8 describethe scenarios employed during the fall RTS experiments and thescenario presentation sequences, respectively. Some of thescenarios and aircraft were the same and some were differentbetween the RADES and RTS tests. However, difficulty level,overall, was about the same between the two tests, within weapontype. Whenever possible, the sequencing of fixed and rotary wingaircraft trials, and the sequencing of single, double, and tripleaircraft trials, were counterbalanced within each of the samples.
II

Table 1
Candidate Task Performance Measures (TPM)
ICODE I EVENT I DESCRIPTION I DUTY I
IRDET IDetection IFW slant range at detection ISL & SGI
RACQ jAcquisition FWd slant range at weapon SGacquisition (infrared or radar)
,RIFF jInterrogation JFW slant range at interrogationj SG I
!RID lldentification JFW slant range at identify I SL
RENG ICommand Engage FW slant range at command SLor Cease Engage engage or cease engagement
IRLOCK ILock-on JFW slant range at lock-on I SG I
IRFIRE IFire JFW slant range at fire I SG ITDET IDetectiOn IRW time interval from line of SL & SGi
I±J1~eeto sight to detectionI
ITACQ IAcquisition RW time interval from detect SG
to acquire (infrared or radar)
TIFF Interrogation RW time interval from detect tof SG
I2R time interval from detect SL
V±J detiictin identifyII
TENG lCommand Engage RW time interval from identify SLor Cease to command engage or ceaseEngage engagement
~TLOCK Lc-nRW time interval from acquire SG
TFIRE IFire RW time interval from acquire S_
I Ito fire
ITHAND Hand-off RW or FW time interval from SL. & SGII l~identify to fireI
~TTOT ITotal RW or FW time interval from SL. & SGIIdetect to fireI
12
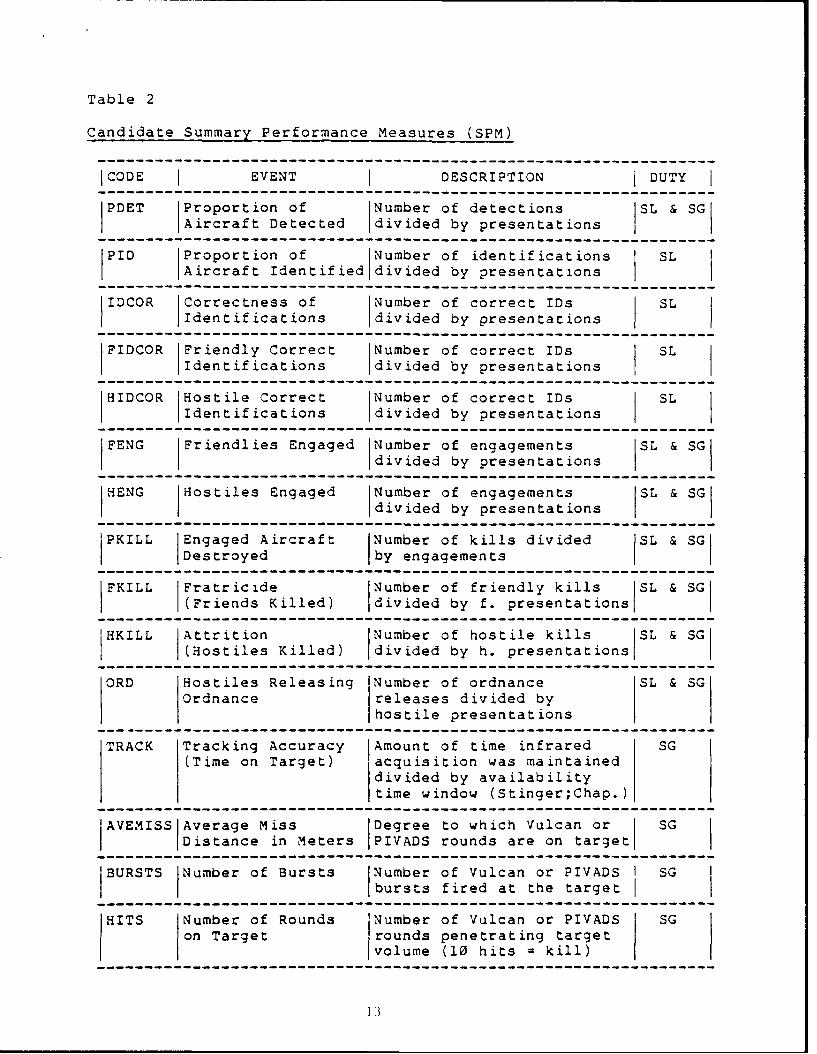
Table 2
Candidate Summary Performance Measures (SPM)
ICODE I EVENT I DESCRIPTION I DUTY
PDET Proportion of Number of detections SL & SGAircraft Detected divided by presentations
PID Proportion of Number of identifications SLAircraft Identified divided by presentations
IDCOR Correctness of Number of correct IDs SLIdentifications divided by presentations
FIDCOR Friendly Correct Number of correct IDs SLIdentifications divided by presentations
HIDCOR Hostile Correct Number of correct IDs SLIdentifications divided by presentations
FENG Friendlies Engaged Number of engagements SL & SGdivided by presentations
HENG Hostiles Engaged Number of engagements SL & SGdivided by presentations
PKILL Engaged Aircraft Number of kills divided SL & SG
Destroyed by engagements
FKILL Fratricide Number of friendly kills SL & SG(Friends Killed) divided by f. presentations
HKILL Attrition Number of hostile kills SL & SG(Hostiles Killed) divided by h. presentations
ORD Hostiles Releasing Number of ordnance SL & SGOrdnance releases divided by
hostile presentations
TRACK Tracking Accuracy Amount of time infrared SG(Time on Target) acquisition was maintained
divided by availabilitytime window (Stinger;Chap.)
AVEMISSIAverage Miss IDegree to which Vulcan or SGDistance in Meters PIVADS rounds are on target
BURSTS Number of Bursts Number of Vulcan or PIVADS I SG
I ibursts fired at the target
HITS Number of Rounds Number of Vulcan or PIVADS SGon Target rounds penetrating target
volume (10 hits = kill)
13
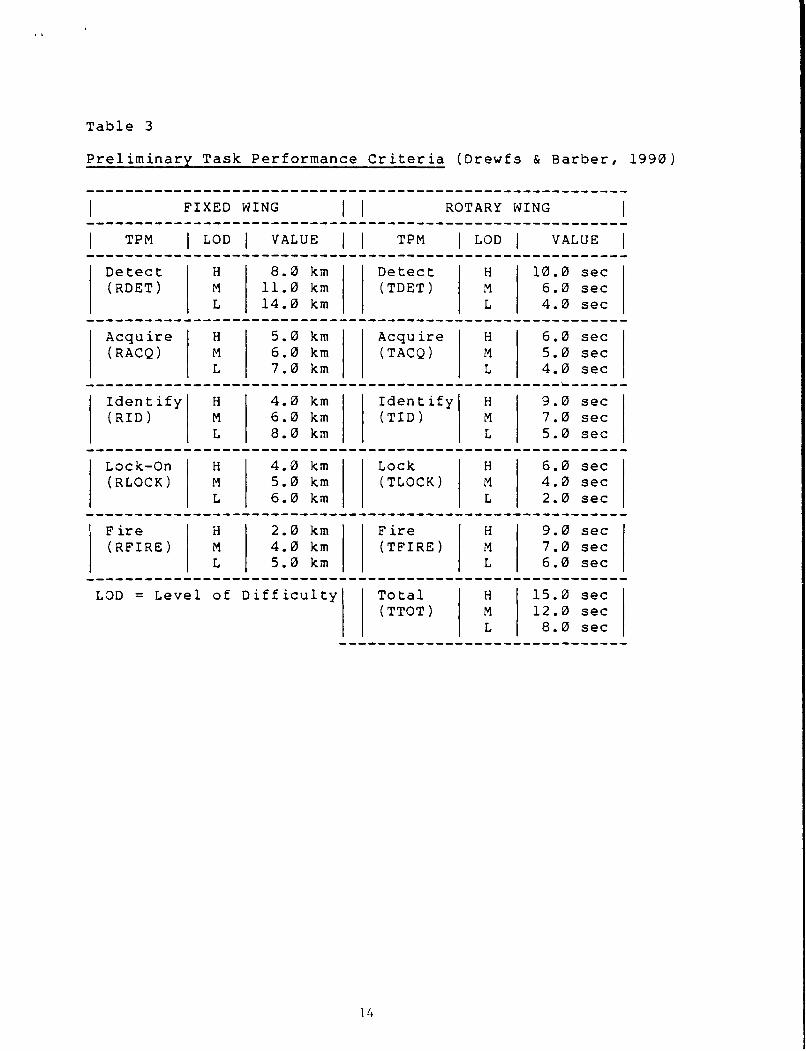
Table 3
Preliminary Task Performance Criteria (Drewfs & Barber, 1990)
FIXED WING I I ROTARY WING
TPM j LOD I VALUE I I TPM ILOD I VALUE
Detect H 8.0 km Detect H 10.0 sec(RDET) M 11.0 km (TDET) M 6.0 sec
L 14.0 km L 4.0 sec
Acquire H 5.0 km Acquire H 6.0 sec(RACQ) M 6.0 km (TACQ) M 5.0 sec
L 7.0 km L 4.0 sec
Identify H 4.0 km Identify H 9.0 sec(RID) M 6.0 km (TID) M 7.0 sec
L 8.0 km L 5.0 sec
Lock-On H 4.0 km Lock H 6.0 sec(RLOCK) M 5.0 km (TLOCK) M 4.0 sec
L 6.0 km L 2.0 sec
Fire H 2.0 km Fire I H 9.0 sec(RFIRE) M 4.0 km (TFIRE) M 7.0 sec
L 5.0 km L 6.0 sec
LOD = Level of Difficulty Total H 15.0 sec(TTOT) M 12.0 sec
L 8.0 sec
14

Table 4
Preliminary Summary Performance Criteria(Drewfs & Barber, 1990)
FIXED WING I I ROTARY WING
I LOD I VALUE I I SPM LOD I VALUE
Identity H 70% Identity H 70%Correctness M 75% Correctness M 75%
(IDCOR) L 80% (IDCOR) L 80%
Friendly H 70% Friendly H 70%IDCOR M 75% IDCOR M 75%(FIDCOR) L 80% (FIDCOR) L 80%
Hostile H 75% Hostile H 75%IDCOR M 80% IDCOR M 80%(HIDCOR) L 85% (HIDCOR) L 85%
Friends H 30% Friends H 30%Engaged M 25% Engaged M 25%(FENG) L 20% (FENG) L 20%
Hostiles H 75% 1 Hostiles H 75%Engaged M 80% Engaged M 80%(HENG) L 85% (HENG) L 85%
Friendly H 25% Friendly H 25%Kills M 20% Kills M 20%(FKILL) L 15% (FKILL) L 15%
Hostile H 45% Hostile H 55%Kills M 60% Kills M 70%(HKILL) L 75% (HKILL) L 80%
Engaged Air. H 60% Engaged Air. H 75%Destroyed M 75% Destroyed M 85%(PKILL) L 90% (PKILL) L 95%
ordnance H 95% Ordnance H 95%Released M 75% Released M 75%(ORD) L 30% (ORD) L 30%
LOD = Level of Difficulty
15

Table 5
Summer 1989 RADES Test Scenarios
STINGER AND CHAPARRAL SCENARIOS
ISZENINTARGITYPEIINTENTI ODEL I DUR IORDERIAZIUTH RANGE I ASPECT IFZ'I
0 1 FW H Su7 60 --- 1 20 45 4FW
1 1 FW H MiG27 60 --- 1 20 45 4FW2 1 FW H SU25 60 --- 12 20 0 4FW3 2 mIX F/H A7/Ka? 60/40 SEQ 11/12 20/5 315/315 4FW4 2 MIX H/H Su24/Mi8 60/40 SEQ 11/11 20/3 315/315 4FW5 1 RW H Mi28 20 -- 1 1 90 1RW6 1 RW H Mi24 20 --- 12 2 45 IRW7 2 RW F/H UHI/Mi24 25 SEQ 12/12 3/2 0/0 2RWa 1 RW F CH3 25 --- 1 4.5 45 2RW9 1 RW F AH64 25 --- 12 6.5 45 3RW
10 2 RW H/H Mi8/CH3 40 SIM 11/1 3/4.5 315/45 4RW11 3 RW H/H/F 4i8/Ka?/UH1 60 SIN 117T2/12 5/5/3 270/270/90 5RW12 3 RW H/H/H Mi8/Ni8/Mi28 60 SIN 11/IT/i 5/3/1 45/315/45 5RWI
VULCAN SCENARIOS
ISCENINTARGITYPEIINTENTI MODEL I OUR JORDERJAZIMUTH I RANGE I ASPECT IDIF1
*a 1 FW H SU7 60 -- 1 20 45 4FW
1 1 FW H MiG27 60 - 1 20 45 4FW2 1 FW H Su25 60 -- 12 20 0 4FW3 2 MIX F/H A7/Ka? 60/40 SEQ 11/12 20/2 315/315 4FW4 2 mIX H/H Su24/Mi28 60/40 SEQ 11/1 20/1 315/45 4FW5 1 RW H 4128 20 -- 1 1 90 IRW6 1 RW H Mi24 20 --- 12 1.3 45 1RW7 1 RW F CH3 20 --- 1 2 45 IRW8 2 RW F/H UHl/Mi24 25 SEQ 12/12 3/1.3 0/0 2RW9 2 RW H/F Mi8/CH3 40 SIN 11/1 2/2 315/45 4RW
10 2 RW H/F Mi8/AHI 40 SIm 11711 3/1.3 0/0 4RW11 3 RW H/H/F Mi8/Ka?/UHI 60 SIm 11712/12 2/2/3 270/270/90 5RW12 3 RW H/H/H Mi8/Mi24/Mi28 60 SIN 11/r2/1 2/1.3/1 315/45/45 SRW
"3 was a practice scenario that all participants received (no data were collected)
Aote. 1st target to appear was cued; for multiple targets, cue given is underlined.
16

Table 6
Summer 1989 RADES Tests: Scenario Presentation Scheme
......... .....s.......s.sas= n =en a .. ses..s. a. s s- s as .a s.....==aa.=nn e
STINGER AND CHAPARRAL SCENARIO SEQUENCES
DAY GROUP PRESENTATION ORDER
1 AM/PM 7 10 1 18 12 3 19 7 1=2 11 1 6 1 4
2 AM/PM 12 8 3 10 9 1 11 6 4 5 7 2••• ••• •• •• •• ••• •• •• ••• •• •• ••3 AM/PM 9 11 4 7 6 2 10 5 1 12 8 34 AM/PM 7 6 2 5 11 4 8 12 3 9 10 1
SEQUENCE 1 2 3 I 3 1 4 5 6 7 8 9 110 11 1121
VULCAN SCENARIO SEQUENCES
1 AM/PM 15 10 1 18 12 3 17 9 2 11 6 42 AM/PM 12 8 3 10 7 1 11 6 4 5 9 23 AMI/PM 7 11 4 9 6 2 10 5 1 12 8 34 AM/PM 9 6 2 5 11 4 8 1 2 3 7 1 0 1
SEQUtiiCE 1I1 21314 516 7 81 9 10 1l 11121
17

Table 7
Fall 1989 RTS Test Scenarios
STINGER, CHAPARRAL, AND VULCAN SCENARIOS13CENINTARGITYPEIINTENT- MODEL - DUR IORDERIAZIMUTH-- RANGE I ASPECT IDIFI
"3 2 MIX F/H FIll/Ka? 60/40 SEQ 12/1 20/2 0/45 4,W1 1 FW F F16 60 -- 11 20 315 4FW2 1 FW H MiG27 60 -- 1 20 45 4FW3 1 FW H Su25 60 12 20 a 4FW4 2 MIX F/H A7/Mi8 60/40 SEQ 1/11 20/2 45/315 4FW5 z mix H/H Sul7/Mi28 60/40 SEQ 11/1 20/2 315/0 4FW6 3 MIX F/H/H A1l/Mi8/Mi28 60/60 SQ/SM 12/11/1 20/2/2 0/270/45 4FW7 3 MIX H/F/H MiG27/AH64/Mi24 60/60 SQ/SM 11/12/1 20/3/4.5 315/45/90 4FW8 1 RW H Su24** 60 11 20 315 4FW9 1 RW H Mi28 20 1-- 1 1.3 315 IRW
10 1 RW H Mi24 20 -- 1 1 45 1RW11 1 RW F CH3 20 -- 12 2 315 IRW12 1 RW H Mis 20 - 11 2 45 IRW13 1 RW H mi28 20 1 2 315 IRW14 1 RW F CH3 20 - 12 3 45 2RW15 1 RW H mi28 20 -- 11 3 45 2RW16 1 RW H Mi24 20 -- 12 3 315 2RW17 1 RW H Mi24 20 12 5 45 JRW18 2 RW F/H/F AHI/MiS/UHI 20 SEQ 12/1/11 3/2/2 315/315/90 3RW19 2 RW H/F Mi24/UHI 40 SIm 12/1 2/1 315/0 4RW20 2 RW F/H UHl/Mi28 40 SIN IT/i 5/2 315/0 4RW21 2 RW H/H Mi8/Mi8 40 SIm 11/12 2/2 0/90 4RW22 2 RW H/H Mi24/Mi28 40 SIm i171 1.3/1 45/0 4RW23 2 RW H/H Mi24/Mi28 40 SIN I--/i 5/4.5 270/315 4RW24 2 RW H/H MiS/Mi24 40 SIm IT/i 3/4.5 0/315 4RW25 3 RW F/H/F AHl/Mi24/AH64 60 SIm u17T2/1 2/2/2 315/0/270 5RW26 3 RW F/H/H UHl/Mi24/Mi8 60 SIM il/I-2/i 2/2/2 315/45/45 5RW27 3 RW H/F/H MiS/AH64/Mi28 60 SIM 11/IT/i 3/3/4.5 315/90/270 5RW28 3 RW F/H/H CH3/Mi24/Mi28 60 SIN 7/12/i 3/3/4.5 315/45/90 5RW29 3 RW H/H/H Mi24/Mi24/Mi28 60 SIM 11/1-/1 1.3/2/1 270/0/315 5RW30 3 RW H/H/H Mi28/MiS/Mi24 60 SIM 11/12/f 1.3/2/1 45/45/0 5RW31 3 RW H/H/H Mi28/Ni24/Mi28 60 SIM 11/12/r 3/5/4.5 90/315/0 5RW32 3 RW H/H/H Mi28/Mi24/Mi8 60 SIN 11/12/1 3/5/2 0/0/0 5RW
3 0 was a practice scenario that all participants received (no data were collected)* Su24 (1/7 scale) was substituted; originally was to be a flying RW gyro (mi24)Note: Ist target to appear was cued; for multiple targets, cue given is underlined.
18

Table 3
Fall 1989 RTS Tests: Scenario Presentation Scheme
STINGER AN4D CHAPARRAL SCENARIO SEQUENCES
SET A: 1, 2, 4, 7, 8, 12, 13, 17, 20, 24, 27, 31SET B: 1, 3, 5, 6, 8, 12, 15, 16, 18, 23, 28, 32
DAY GROUP SET j SEQUENCE
1 1 AM I A 13, 8, 27, 4, 17, 12, 2, 31, 1, 20, 24, 7
1 2 PM B 16, 5, 28, 8, 15, 3, 12, 6, 32, 1, 18, 23
2 I 1 AM BI 23, 18, 1, 32, 6, 12, 3, 15, 8, 28, 5, b12 j2 PM A 20, 1, 31, 2, 27, 8, 13, 7, 12, 24, 4, 17
3 1 AM Al 17, 4, 24, 12, 7, 13, 8, 27, 2, 31, 1, 203 2 PM 3 18, 8, 12, 1, 32, 5, 15, 16, 6, 23, 3, 28
4 1 AN Bj 28, 3, 23, 6, 16, 15, 5, 32, 1, 12, 8, 184 2 PM A 7, 24, 20, 1, 31, 2, 12, 17, 4, 27, 8, 13
VULCAN SCENARIO SEQUENCES
SET A: 1, 2, 5, 6, 8, 9, 10, 14, 19, 21, 25, 30SET 8: 1, 3, 4, 5, 8, 11, 12, 13, 18, 22,.26, 29
DAY GROUP SET SEQUENCE
- ------------ --- -----------------------
I I 1AM A 14, 19, 1, 25, 2, 9, 30, 5, 21, 8, 10, 61 2 PM a 11, 3, 22, 18, 1, 26, 8, 12, 5, 29, 4, 13
2 1 AM B8 13, 4, 29, 5, 12, 8, 26, 1, 18, 22, 3: 112 2 PM A 30, 5, 21, 1, 10, 14, 6, 19, 8, 25, 2, 9
3 1 AN Al 9, 2, 25, 8. 19, 6, 14, 10, 1, 21., 5, 303 2 PM a 5, 12, 3, 11, 13, 29, 4, 22, 18, 8, 26, 1
------------------------4 11 AM aS 1, 26, 8, 18, 22, 4, 29, 13, 11, 3, 12, 54 2 PM A 6, 10, 8, 21, 5, 30, 9, 2, 25, 1, 19, 14
* Due to a system malfunction, the position-location systemfailed; thus, FW scenarios could not be presented to Vulcan
19

In the scenario tables (Tables 5 and 7), single and multipletarget scenario information is repeated for each target. "NTARG"refers to the number of targets presented in the scenario. Inthe "TYPE" column, "FW" refers to flying fixed wing and "RW"refers to pop-up rotary wing targets. "INTENT" refers either tohostile (H) or friendly (F) targets. "MODEL" refers to aircraftmodel type. "DUR" refers to the duration of time (in seconds)targets were available (unmasked) to the weapon position."ORDER" refers to multiple target scenario presentations whichwere either sequential (SEQ), simultaneous (SIM), or both(SQ/SM); both refers to a FW target followed sequentially by twosimultaneous RW targets. "AZIMUTH" refers to the o'clockposition of the target as referenced from the search sector. ThePTL was at 12:00, facing south, at 1800. "RANGE" values indicateranges at which the targets were first presented (RW targets didnot vary in range). "ASPECT" refers to the orientation angle atwhich the targets were presented, as observed from the weaponposition. For RW targets: 0 d'egrees is head-on, 45 degrees isan oblique left view, 90 degrees is a full left view, 270 is afull right view, and 315 is an oblique right view. For FW, alltargets began at 0 aspec: (head-on), but then may have crossed atidentification range, thereby becoming an oblique (450 or 3150)view. "LOD" or Level of Difficulty defines the scenarioperformance difficulty index (high=5, -- 4ium=3, low=l). FWscenarios were considered more diffiý,It than RW, so the LODindices were dealt with separa,>ely. The techniques employed todetermine scenario difficuluy level were described andempirically validated in Drewfs and Barber (1990).
Individual Difference Variables
Soldiers were administered a battery of tests andquestionnaires (see Table 9), either before or after engagementexercises (AM or PM). For 16S soldiers, teams exchanged roles atmidday during the fall test, for a different set of equallydifficult scenarios, and therefore did not recieve these tests.Variables represented the following domains: visual perception,psychomotor, personality (predispositions), and recent training.Armed Services Vocational Aptitude Battery (ASVAB) scale scoreswere also used as predictors: Armed Forces Qualification Test(AFQT), Electronics (EL), Mechanical Maintenance (MM), andOperator and Food Handling (OF). Individual differences werecorrelated with performance. It was anticipated that varianceunexplained by the independent variables (e.g., experience andscenario difficulty) would be largely explained by individualdifference variables.
2(

Table 9
Individual Differences Measures
VISUAL SENSATION
VARIABLE I DESCRIPTION CODE I UNIT OF MEASUREMENT
Foveal Visual Visual acuity measured FVA Scores range from 6Acuity with a Tumbling E chart to 30 with 20=20/20
presented at 20 feet
Contrast Sensitivity to sine CSI Lowest detectableSensitivity wave gratings varying contrast interval
in cycles per degree for 1.5 cpd(cpd) of spatial --frequency and contrast CS2 Lowest detectableratio (5 frequencies contrast for 3 cpdwith 8 contrast
intervals each; score C$3 Lowest detectablefor each frequency contrast for 6 cpdrecorded as 1 .... 8)
CS4 Lowest detectablecontr3st for 12 cpe
CS5 Lowest detectablecontrast for 18 cpd
CSL Mean of CS! and CS2
CSH Mean of C$4 and CS5
Resting Focus Focal point when eyes DF Dark focus measuredare at rest; also with a polarizedcorresponds to point of vernier optometer inclearest focus (i.e., dioptersfulcrum of focal ranoe)-----------------------------
CF Clear focus measuredin diopters using afocus stimulator
RF I Mean of DF and CF
Visual Accommodation range NP Nearest clear focalFlexibility of the eyes (lens) ooint measured in
diopters
FP Farthest clear focalpoint
FR Focal range (NP-FP)
21

Table 9 (Continued)
VISUAL SENSATIONVARIABLE j DESCRIPTION CODE UNIT OF MEASUREMENT
Blur Ability to interpret I BIl Identification ofInterpretation images presented with a a picture of a rose
slide projector whichare blurred using a B12 Identification offocus stimulator a picture of a jet(score is the distance---------------------in diopters from the BIP Identification ofresting focus when the letter Pthe image is -----------------discriminated) BIW Identification of
the letter W
BIZ Identification ofthe letter Z
BIA Mean of BIl and B12
BIB Mean of BIP, BIWand BIZ
PERCEPTION-------------------------------------------------------------------
VARIABLE DESCRIPTION CODE UNIT OF MEASUREMENT
Field Indepen- Tendency to view scene GEF Group Embeddeddent/Dependent in detail or as a whole Figures Test
Spatial Ability to interpret SV Space VisualizationAbility spatial relations Test
Visual Pursuit Ability to follow a VP Visual Pursuit Testschematic diagram
PSYCHOMOTOR
VARIABLE I DESCRIPTION CODE UNIT OF MEASUREMENT
Eye-Hand Speed and accuracy of MSA Manual Speed andCoordination tracking by placing Accuracy Test
pencil dots in shapesin specific order TSA Tracking Speed and
Accuracy Test
22
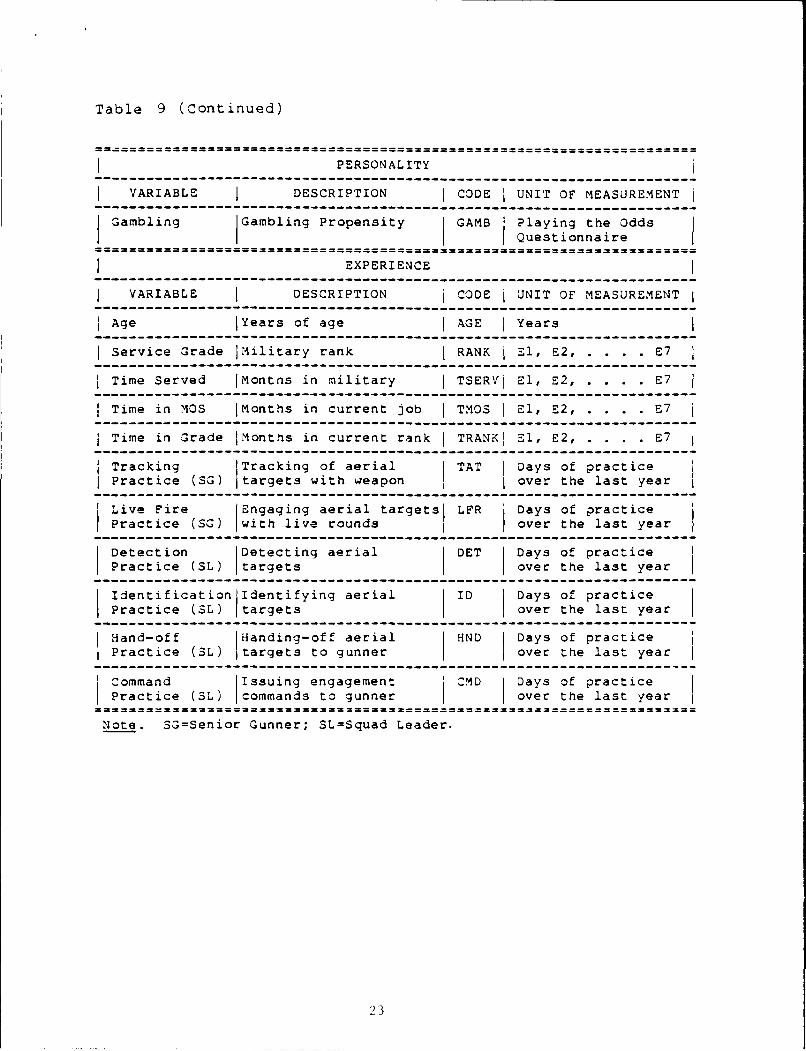
Table 9 (Continued)
PERSONALITYVARIABLE j DESCRIPTION CODE UNIT OF MEASUREMENT
Gambling Gambling Propensity GAMB Playing the OddsQuestionnaire
EXPERIENCE
VARIABLE I DESCRIPTION CODE j UNIT OF MEASUREMENT
Age Years of age AGE Years
Service Grade Military rank RANK El, E2, ...... .E7
Time Served IMonths in military TSERVI El, E2, . ..... E7
Time in MOS Months in current job TMOS El, E2, ........ E7
Time in Grade Months in current rank TRANKI El, E2, ...... .E7
Tracking Tracking of aerial TAT Days of practicePractice (SG) targets with weapon over the last year
Live Fire Engaging aerial targetsj LFR Days of practicePractice (SG) 1with live roundsI over the last year
Detection Detecting aerial DET Days of practicePractice (SL) targets over the last year
Identification Identifying aerial ID Days of practice
Practice (SL) targets over the last year
Hand-off Handing-off aerial HND Days of practice
IPractice (3L) targets to gunner over the last year
Command Issuing engagement CMD Days of practicePractice (3L) commands to gunner over the last year
Note. SG=Senior Gunner; SL=Squad Leader.
23

Data Analysis
The primary goal of this research was to generateperformance standards which differentiated qualified fromunqualified soldiers. Thus, validation reflected the degree towhich the performance criteria discriminated differences inperformance (i.e., level of ability). Differences due toexperience were the primary criteria. Three levels of experiencewere employed (see Participants section). These levels differedwith respect to recency and intensity of training. Performanceon the TPM and SPM was compared as a function of these variables.Significant differences in performance were predicted.
Another goal of this research was to determine criteriacutoff scores for different levels of scenario difficulty. Thus,the second principal validation criterion was the degree to whichperformance on the TPM and SPM differed as a function of scenariodifficulty. The three levels of difficulty were also to becalibrated (i.e., determine where to draw the line between levelsin terms of the effects on performance). It was necessary todetermine which TPM and SPM were affected by difficulty level, inwhat direction, and to what extent. The interaction ofdifficulty and experience level was also to be examined.
It was anticipated that the vast majority of variance notaccounted for by the independent variables of experience anddifficulty would be accounted for by the individual differencespredictor measures. It was expected that experienced soldiersnot meeting the performance standards would be those scoringlower on certain abilities. Validation of the performancecriteria (standards) included the examination of individualdifferences variables.
Analysis of variance and t-tests were used to identify mainand interaction effects of independent variables. However, ifsample sizes were very small, nonparametric tests were performed(Mann-Whitney, Sign, Fisher, or Cochran). Two-tailedprobabilities were employed while investigating main effectsbecause of uncertainty as to which performance variables would beaffected by the independent measures and the direction of theseeffects and because of small sample sizes and sampling bias.Correlation (Pearson and Spearman) analysis was used to identifyindividual difference predictors (one-tailed probabilities).Principal components and correlation analyses were employed todetermine the degree to which predictor variables clusteredtogether.
Analyses were performed according to weapon system becauseof differences in weapons, procedures, tactics, and performance.For example, while target detection and identificationperformance standards may be similar for all SHORAD personnel,range of engagement and probability of kill differ widely fordifferent weapons. Thus, range tables had to be generatedseparately for each of the three weapons being tested.
24

RESULTS AND DISCUSSION
Summary Statistics
The most noteworthy finding from the descriptive statisticswas the variability in aircraft identification accuracy. Thereare three possible reasons for this: aircraft familiarity (someaircraft are emphasized more in current training); aircraftdiscriminability (some aircraft have features in common withtheir hostile-friendly counterparts) (see FM 44-30, Headquarters,US Army, 1986); and a lack of current Visual Aircraft Recognition(VACR) training (Rotchford & Daruwalla, 1987). Overallidentification accuracy (high, medium, or low) across the samplesobtained for this research, and associated familiarity anddiscriminabilty of aircraft, are summarized in Table 10. Thereis an apparent relationship among familiarity, discriminability,and overall identification accuracy. Descriptive statistics onall TPM and SPM are provided in Appendices A and B. Appendix Aprovides performance data on Stinger, Chaparral, and Vulcanscenarios for the Summer 1989 RADES tests. Appendix B providesthese same data for the Fall 1989 RTS tests.
In general, the average identification performance for allsamples was below the recommended standards. This is reflectedin Tables 11 and 12 (note that data are compared to revisedstandards presented at the end of this report). Table 12demonstrates that the soldiers were not detecting and identifyingaircraft soon enough to complete the engagement in time tomaximize hostile kills and prevent hostile ordnance release.Table 11 demonstrates the deficiencies in accurately identifyingthe aircraft. These deficiencies resulted in fewer hostilesengaged, low hostile attrition and ordnance prevention, and morefriends engaged with accompanying higher fratricide.
These tables also illustrate large differences in TPM andSPM performance between weapon groups. These differences wereattributed to differences in training level and ability. Stingertroops performed slightly better than Vulcan. Both performedconsiderably better than Chaparral during the Summer RADES tests.During the Fall RTS tests, the Vulcan troops performed slightlybetter than Stinger. Again, both performed considerably betterthan Chaparral. This reflected the lack of training received bythe National Guard Chaparral personnel.
25

Table 10
Aircraft Familiarity, Discriminability, and IdentificationAccuracy
Aircraft Familiarityand Discriminability(Numerical order in soldier evaluation guide,
Headquarters, US Army, 1989)
Hostile Aircraft Friendly AircraftFixed Wing Rotary Wing Fixed Wing Rotary Wing
MiG27 (4)* Mi24 (2) A10 (3) AHI (1)Sul7 (8)* Mi8 (6)* A7 (12) UHI (5)Su25 (10)* Mi28 (41)* F16 (17)* CH3 (38)*Su24 (16)* Ka?? (N/A) AH64 (39)*
* Denotes aircraft having features in common with a counterpart
Overall Observed Identification Accuracy
Hostile Aircraft Friendly AircraftFixed Wing Rotary Wing Fixed Wing Rotary Wing
MiG27 (H) Mi24 (MH) A10 (H) rlHl (M)Sul7 (H) Mi8 (M) A7 (M) AHI (M)Su24 (MH) Mi28 (ML) F16 (ML) AH64 (L)Su25 (MH) Ka??** (L) CH3 (L)
** The Hokum aircraft has not been numerically designated
26

Table 11
Air Defense Summary Performance as Compared to RecommendedStandards
Average Observed Summary PerformanceS= := := = = = = = = = == = =-----------------==========
?W Scenarios Summer, 1989 RADES Tests Fall, 1989 RTS Tests----------------------------------- ----- --------------------------
Variaole [ Stndrd j STNG I CHAP J VULC ý STNG I CHAP I VULC--------------------------------------------------------------------------
IDCOR .70 .84 .73 .70 .82 .72 --
FIOCOR .70 43* 35* .26' .69* .62* --
AIDCOR .75 .98 83 .86 .95 .92 --
FENG .30 .50 .45" .78* .18 .43* --
HENG .75 .93 56* .78 .50* .64* --
PKILL .65/.20 .65 .78 04* .86 .87 --
FKILL .30 .29 .35 .04 .16 .29 --
4KILL .50/.i0 .77 41" .03 .34" .64 --
ORD 1.55/.00 .98' .92* N/A .34 .71' --- - -= = ========= ======= = = == == = ========= ....
Rd Scenarios Summer, 1989 RADES Tests Fall, 1989 RTS Tests----------------------------------------------
iVariable Stndrd I-STNG - CHAP 1 VULC i STNG i CHAP I VULC-- -----------------------------------------------------------------------
IDCOR .75 .70' .61' .66* .68' .64* .76FIDCOR .75 .47* .38* .51' .37* .50' .56'
HIDCOR .80 .84 .78' .75* .95 .92 .83
FENG .25 .39* .30* .34* .44* .20 .60*HENG .80 .75' .53' .73* .67' .50" .84PKILL .`5 .91 .59' .73* .99 .99 .30"FKILL .25 .37* .08 .25 .44' .25 .04HKILL .70 .68* .37* .63' .66" .50' .28"ORD .35 .54* .72* .42* .68* .67' .73*HITS 8.0 -- -- 7.2* -- -- 8.0
= ====== ====== ===== = = = ======== = = = = == = = = = = S-
' Indicates average performance falls below the recommended standard
Note. Results reflect first or single target performance.
Note. Standards for FW variables PKILL, HKILL and ORD are differentbetween STNG-CHAP and VULC.
Note. For Summer VULC, the average performance exceeded the criterion forthe following RW variables after eliminating low experiencesubjects: HIDCOR (.89), PKILL (.83), HITS (10.8).

Table 12
Air Defense Task Performance as Compared to Recommended Standards
Average Observed Task Performance (Percentage Exceeding the Criteria)
------------------- i------------------------- -------------------- ------
Variable I Stndrd I STNG I CHAP I VULC STNG j CHAP I VULC
RDET 8/6.5 km 9.4(.57) 5.4(.22) 6 3(.36) 9.5(.58) 3.3(.56)1 -
RID 4/2.5 km 3.8(.40) 2.9(.23) 2.5(.41) 3.8(.30) 4.4(.44) --
RACQ 5 km 14.7(.30) 3.4(.20) -- 6.3(.53) 2.9(.00) --
RFIRE 2/1.5 km 2.7(.64) 3.1(.45) l.8(.57) 4.0(.53) 3.7(.72)I --
R4 Scenarios Summer, 1989 PADES Tests Fall, 1989 RTS Tests
I Variable i Stndrd STNG i CHAP i VULC STNG I CHAP I VULC
TDET 6 sec 8.2(.52) 8.2(.52) 6.5(.62) 6.3('68) 6.3(.63) 6.5(.57)TID 7 sec 8.5(.62) 1;.6(.47 7.7(.61) 11.0(.46 9.8(.37) 6.7(.71)TACQ 5 sec 6.6(.60) 8.7(.82) -- 6.6(.69) 5.1(.50) --
TFIRE 7 sec 9.3(.52) 8.6(.61) -- 9.2(.49) 9.4(.47) --
TTOT 12 sec 11.3(.65114.2(.4918.4(.82) 14.5(.44 13.5(.60 8.8(.82)
Note. Results reflect first or single target performance.
Note. Standard for FW variables RDET, RID, and RFIRE are different betweenSTNG-CHAP and VULC.
Note. Standards represent medium (RW) to medium-high (FW) difficulty.

It was anticipated that Vulcan squad leaders would haveshorter FW identification ranges due to the range limits of theirweapon, and this was found. Vulcan FW identifications averagedabout 2.5 kilometers. The maximum range reach of the weapon isabout 2 kilometers. Thus, the squad leaders were waiting untilthe aircraft was closer to increase identification accuracy.Chaparral and Stinger systems are capable of engaging at hostileordnance delivery range. To realize this capability, commandersmust necessarily identify the target farther away. The missionrequirements are different because of the different ranges of theweapons, and this is the principal reason that the recommendedcriteria differ between gun and missile systems.
Past and current research indicate that experienced airdefense soldiers are capable of achieving the criteria. This isparticularly true for gunner performance. Research has shownlittle variation in gunner tasks and negligible deficiencies ingunner performance (Barber, 1990; Barber, et al., 1987). In thecurrent research, undesirable performance appeared to reflectinsufficient training rather than poorly selected criteria. Thisis likely because current training methods do not adequatelyaddress the observed performance deficiencies: identificationaccuracy, fratricide, hostile attrition and ordnance prevention,and collective crew-team interactions. Current training andtraining devices focus primarily on gunnery tasks, which isprobably why gunner performance met the criteria.
Experimental Effects
Effects of scenario difficulty factors and soldierexperience level are discussed in turn, followed by interactioneffects. Main and interaction effects are presented in Tables 13through 18 at the end of this section. In these tables, effectsof scenario difficulty are indicated as "DIF" and effects ofsoldier experience are indicated as "EXP".
Scenario Difficulty Level. Past research (Barber, 1987;Drewfs & Barber, 1990) suggested which factors made a scenarioeasier or harder. These factors were incorporated into thedifficulty indices ascribed to scenarios prior to the tests.These indices produced occasional main effects in the predicteddirection. In this research, the difficulty factors which seemedto contribute the most to variations in performance were targetvisibility, number of targets, and aircraft model type. Theinfluence of each of these factors will be discussed in turn.
Target visibility can be varied by changing any of thefollowing variables: target aspect angle, range, elevation(above mask), offset (from PTL or cued azimuth), size, velocity,contrast and coloration (background and camouflage), and weatherconditions (i.e., atmospheric transmissivity). Effects of thesevariables on air defense performance have been found on numerousoccasions (Barber, 1987; Barber, 1990; Drewfs & Barber, 1988;Drewfs & Barber, 1990, Johnson, Barber, & Lockhart, 1988). Thecurrent study was no exception.
29

For example, increases in aircraft range and decreases inaircraft size were associated with increases in RW detectiontimes (TDET) and RW identification times (TID). As shown inTable 15, it took longer to detect and identify the Mi28 when itwas more distant, resulting in more hostile ordnance releases(scenario 13 versus 15). It took longer to identify (TID) and tocomplete the engagement (TTOT) on the Mi24 when it was moredistant, resulting in more incorrect identifications and fewerhostile kills (scenario 16 versus 17).
Further, increases in offset affected detection time asshown in Table 14. This is evidenced by the fact that when thesecond target of a multiple target scenario appeared at the sameazimuth as the first target (as in scenario 10), detectionoccurred more quickly than when the second target appeared at theother side of the search sector (as in scenario 9).
Multiple targets appearing simultaneously can adverselyaffect performance in two distinct ways: hesitation or haste.The soldier may become confused about which target to engage, ormay hasten his responses in order to engage as many as possible.The more targets per uni' time to deal with, the more difficultthe scenario becomp-. producing a negative effect on performance.
In this re e _ch, first RW target detection times (TDET)were longer when there were multiple targets (Table 14, scenarios5, 6 versus i1, 12; and Table 15, scenario 12 versus 24, 27, 32).The more targets, the more delay in communicating detection.This was also true for second RW target detections (see Table 14,scenarios 9, 10 versus 11, 12). Perhaps confusion or distractionas to which target to engage first caused a delay in thedetection response.
Second and third RW target identifications (TID) weresignificantly faster than first target identifications, for allthree weapons, for both summer and fall tests, as shown in Table17. Total engagement times (TTOT) were also shorter forsubsequent targets (see Table 17). Apparently, subsequentidentification decisions and engagements were hastened due totime pressure. Consequently, performance in identifying aircraftand obtaining hostile kills decreased with second and thirdtargets (see Table 17).
Familiarity and discriminability of the aircraft was anotherprimary factor in determining the outcome of the engagement. Theparticipants were generally poorer at identifying friends thanhostiles. This result is consistent with the interpretation thatparticipants identified aircraft as hostile when they were indoubt. Some model types were more familiar than others and somewere easier to identify (i.e., had obvious features) making thosescenarios less difficult.
3,'

For example, the most familiar and salient RW model type wasthe hostile Mi24, so it was no surprise that this model yieldedthe highest identification accuracy. The Mi8 was also a familiartarget and yielded high identification accuracy. However, theaccuracy in identifying the hostile Mi28 (Havoc) and Ka? (Hokum)was much lower. While they have obvious features, they are newertargets and are less familiar. Further, with respect to friendlyRW aircraft, the AHI and UHI are the most familiar and oldest.These aircraft yielded better identification accuracy than theAH64 and CH3 models. Also, AH64 and CH3 features tend toresemble those of the hostile Mi28 and Mi8, respectively. For FWtargets, the familiar MiG27 (and hostile FW in general) yieldedhigh identification accuracy. The friendly A10 with its obviousfeatures (dual engines and dual tail) yielded betteridentification accuracy than the A7 and F16.
Support for these effects on aircraft identificationaccuracy is provided in Tables 13 and 14. The more familiar anddiscriminable the aircraft model, the more accurate theidentification. The less familiar and discriminable theaircraft, the more likely it was called a hostile. More familiarand discriminable aircraft also elicited faster identificationtimes and farther identification ranges. This consequentlyresulted in more hostile kills and fewer fratricides.
Soldier Experience Level. Experience, as measured in termsof service grade and time in service, was not a strong predictor.Experience, as measured in terms of extent and intensity ofrecent training or practice, was a strong predictor. While theformer produced some of the predicted effects, effects attributedto the latter prevailed. Soldiers receiving recent and intensetraining performed better than those with insufficient trainingand were therefore more apt to meet the performance standards(see Table 11). It was necessary to determine the extent of thisdifference in order to establish where the performance standardcutoffs should be placed.
Typically, large variations in single target detection timeand gunner tracking ability have not been found (Barber, 1990;Barber, et al., 1987). There are two likely reasons for this:(1) These tasks can be performed with basic or average skills (asevidenced by very little variance or effect of psychomotorability on gunner performance). (2) These tasks are currentlystressed in training, at the neglect of other important taskssuch as visual aircraft recognition, engagement of aircraft(simulated or live fire), and collective crew tasks.Consequently, there is usually more variance in these lattertasks. Identification, being the most critical task, tends toaffect all subsequent tasks and outcomes. The more experiencedand better trained soldiers tended to be faster and more accuratein identifying aircraft, and better at obtaining kills.

The expected effect of experience (EXP) on fast and accurateidentifications occurred for Vulcan (Table 14). ExperiencedVulcan troops also detected the second of multiple targets sooner(Table 14), completed the engagement sooner (Table 16), and weremore on target when firing the weapon (Table 14), therebyobtaining more kills (Table 14). Stinger experience comparisonsproduced mixed results (Table 18). The RADES high experiencegroup performed better than their AIT counterparts in identifyingand engaging aircraft. The RTS high experience group performedabout the same as their AIT counterparts with two exceptions:(1) Experienced troops were more accurate in identifying theMi24. (2) Inexperienced (AIT) troops detected FW targets fartherout and engaged more FW targets.
The reverse trend occurred for Chaparral. Higher rankingChaparral observers took longer to detect and identify aircraftthan lower ranking ones (see Tables 13 and 18) and engaged fewerhostile aircraft (Table 18). This may have occurred due to themore experienced group having recently transitioned to Chaparral.This may also have been a result of the less experienced soldierstaking less time, by defaulting to a decision of hostile.
The best performance was exhibited by the Summer 1989Stinger troops and the Fall 1989 Vulcan troops (for example, seeTables 11, 12, and 19). These soldiers were from active duty airdefense units. AIT troops performed at a level below them butcommensurate with the Summer Vulcan and Fall Stinger personnel.National Guard (i.e., Chaparral) troops performed the poorest.The above differences have been ascribed to the degree of recenttraining. All of these groups would benefit from more focusedand extensive sustainment training.
Interaction Effects. It was hypothesized that the effectsof experience and difficulty on engagement performance wouldinteract on those tasks with which experienced personnel receiveconcentrated training or inexperienced personnel receive littleor no training. The hypothesis was supported on the fire taskfor Vulcan gunners (see Table 14). Superior firing accuracy(AVEMISS) exhibited by experienced gunners was unaffected withincreased scenario difficulty. Average or poor firing accuracyexhibited by less experienced gunners worsened with increaseddifficulty.
32

Individual Differences Effects
Ability and attribute variables grouped into logical factorssuggested from previous research (Barber, 1987; 1990). Resultsof principal components analyses are provided in Appendix C(Table C2). The six primary domains are as follows: sensory,perceptual, cognitive, psychomotor, personality, and experience.It was anticipated that soldier differences would account forvariance in performance not accounted for by the independentvariables and could help explain the results when reverse effectsemerged. These predictions were supported. Significantrelationships found have been summarized in Table 20. Theimportance ascribed to the relationships in this table (L, M, orH) reflects the extent to which the relationship could bedemonstrated repeatedly and the magnitude of the correlation.Descriptive statistics on individual differences measures areprovided in Appendix C (Table Cl).
The variables demonstrating consistent and significantrelationships related to the following domains (in order ofimportance). Specific correlations are provided in Appendix C(Table C3).
"* Sensory (i.e., vision) -- resting focus (RF), nearestfocal point (NP), foveal visual acuity (FVA), contrastsensitivity (CS), blur interpretation (BIZ);
"* Experience -- age, time in service (TSERV), live firepractice (LFR);
* Perceptual -- field independence (GEF);
* Psychomotor -- manual speed and accuracy (MSA).
The best predictors related to the visual ability of thesoldier, thereby replicating previous research findings (Barber,1987; 1990). The resting focus was highly related to R1
detection. Those with an intermediate RF detected the targetfaster. Further, those with a higher near point (more flexiblefocal range) detected the RW target earlier. Foveal acuity wasan excellent predictor of performance. Better acuity wasassociated with more accurate FW and RW identifications, andfaster RW identification reaction time. Contrast sensitivity,which is correlated with acuity, was also associated with fartherFW engagement ranges (RFIRE), more accurate RW identifications,and shorter engagement times (TTOT). Good blur interpretationperformance was associated with slower RW detection times, andwith better RW identification accuracy, more hostile RW kills,and more hostile RW ordnance prevention.

In past research (Barber, 1987; 1990), field dependentpeople (GEF) and those low in blur interpretation ability (BIZ)tended to acquire static RW targets more quickly but were slowerin detecting and identifying dynamic FW targets. Fieldindependent people and those high in blur interpretation abilitytended to identify targets at a greater range and with betteraccuracy. These findings were somewhat supported in the currentresearch. Further, field independence and blur interpretationability have been found to be correlated (Barber, 1990).
Better eye-hand coordination (MSA) was associated withfaster RW detection times.
Older soldiers detected the FW target at a closer range andwere slower in detecting the RW target than the younger ones.However, the older and more experienced soldiers (AGE, TSERV)were more accurate in their RW identifications and obtained morehostile RW kills. Also those receiving more live fire practiceobtained more hostile kills. Therefore, realistic engagementpractice would appear to be beneficial.
Finally, ASVAB scale scores predicted performance. FartherFW detection ranges were associated with high scores on the AFQTscale (and somewhat with the EL, MM, and OF scales). Faster RWdetections were also associated with these ASVAB scales(especially the MM scale).
34

Table 13
Chaparral Experimental Effects (Summer, 1989 RADES Test)
FIXED WING SCENARIOS
Scens Effect Var F DF P Means SDs Ns
1,2 & 3,4 DIF RID 4.3 49,1 .04 3.2,2.5 1.9,1.2 51,511,2 & 3,4 DIF IDCOR 16.4 49,1 .001 .84,.49 .37,.53 51,51
ROTARY WING SCENARIOS (Target = 1)
Scens Effect Var F DF P Means SDs Ns
-------------------------------------------------------------------------
3 & 9 DIF TID 3.5 18,1 .08 10.2,12.5 2.9,4.0 20,2010 & 11 DIF* TDET 5.1 22,1 .03 8.9,13.0 7.2,8.0 24,2410 & 11 EXP* TID 4.3 20,1 .05 8.7,14.1 7.5,8.0 22,225,6 & 8,9 DIF TDET 27.6 44,1 .001 4.8,9.9 3.0,6.6 46,465,6 & 8,9 DIF IDCOR 23.5 48,1 .001 .69,.26 .46,.44 50,505,6 & 8,9 DIF TID 37.7 41,1 .000 7.6,11.4 4.5,3.5 43,435,6 & 8,9 EXP* TID 8.4 41,1 .006 8.1,10.9 3.1,4.2 42,44
5,6 & 3,9 DIF-EXP* TID 3.6 41,1 .07 5.5 9.5 Dl
10.6 12.2 D2
E2 E3------------------------------======-==========
DIF (1 = Low, 2 = High); EXP (2 = Medium, 3 = High)* Indicates Reverse Effect
3 5

Table 14
Vulcan Experimental Effects (Summer, 1989 RADES Test)
FIXED WING SCENARIOS
Scens Effect Var F DF P Means SOs Ns
1,2 & 3,4 DIF RID 3.1 40,1 .09 2.2,2.7 1.1,1 5 42,421,2 & 3,4 DIF RFIRE 7.5 41,1 .04 1.6,2.1 1.4,1 i 43,431,2 & 3,4 DIF IDCOR 2.0 41,1 .001 .84,.53 .37,.51 43,431,2 & 3,4 EXP IDCOR 4.5 41,1 .04 .57,.80 .47,.39 42,441,2 & 3,4 EXP PKILL 4.1 32,1 .05 .47,.75 .50,.42 36,321,2 & 3,4 EXP AVEMISS 6.5 41,1 .02 3.2,1.5 4.3,1.6 42,44
ROTARY WING SCENARIOS (Target = 1)
Scens Effect Var F DF P Means SDs Ns I
6 & 5 DIF TID 7.1 22,1 .01 6.2,9.1 4.1,5.5 24,246 & 5 EXP TID 4.4 22,1 .05 9.3,6.0 4.7,4.3 24,246 & 5 DIF IDCOR 7.5 23,1 .01 .83,.48 .37,.51 25,256 & 5 DIF HKILL 9.4 23,1 .005 .83,.48 .37,.51 25,256 & 7 EXP TID 11.6 22,1 .003 8.1,4.5 3.6,3.2 24,246 & 7 DIF IDCOR 6.0 22,1 .001 .83,.13 .38,.34 24,249 & 10 EXP HIDCOR 3.3 22,1 .08 .67,.87 .48,.34 24,245,6 & 11,12 DIF TDET 36.7 46,1 .001 3.3,6.0 2.0,3.0 48,485,6 & 11,12 EXP TID 3.0 45,1 .09 9.1,6.5 6.1,6.0 48,465,6 & 11,12 DIF* HIDCOR 5.7 47,1 .02 .65,.83 .48,.37 49,495,6 & 11,12 DIF AVEMISS 4.7 47,1 .03 .49,.68 .51,.74 49,495,6 & 11,12 EXP AVEMISS 7.8 47,1 .007 .79,.37 .61,.57 48,50
5,6 & 11,12 DIF-EXP AVEMISS 5.9 47,1 .02 .58 .40 Dl
1.01.38 D2
El E3
ROTARY WING SCENARIOS (Target = 2)
Scens Effect Var F OF P Means SDs Ns
10 & 9 DIF TDET 17.6 19,1 .001 16.8,23.4 4.3,5.0 21,219,10 & 11,12 DIF TDET 9.0 44,1 .004 19.7,24.2 5.3,10.6 46,469,10 & 11,12 EXP TDET 6.8 44,1 .01 24.3,19.6 8.1,7.1 46,46
9,10 & 11,12 DIF-EXP TDET 2.4 44,1 .13 21.0 13.5 Dl
27.7 20.7 D2
El E3= == == ......= = -z •= ...... - - - - - - - -== ---------
DIF' (1 = Low, 2 = High); EXP (1 = Low, 3 = High)* Indicates Reverse Effect
36

Table 15
Stinger Experimental Effects (Fall, 1989 RTS Test)
ROTARY WING SCENARIOS (Target=1)
Scens Effect Var Test Stats P Means Ns
13 & 15 DIF TDET M-W z=3.5 .001 4.1,7.5 11,1013 & 15 DIF TID M-W Z=2.9 .003 7.4,13.0 10,1013 & 15 DIF ORD Fisher Phi=.52 .06 .40,.90 10,1016 & 17 DIF TID M-W Z=2.1 .03 9.4,14.8 9,1016 & 17 DIF TTOT M-W Z=1.8 .07 13.1,17.0 8,416 & 17 DIF HIDCOR Fisher Phi=.57 .03 1.0,.50 9,1016 & 17 DIF HKILL Fisher Phi=.51 .06 .80,.40 9,10'12 & 24 DIF TDET Sign 0(-),10(+),0(=) .002 2.1,6.5 10
12 & 24 DIF TID Sign 1(-),8(+),(=) .04 5.3,8.4 1012 & 24 DIF TTOT Sign 0(-),7(+),2(=) .02 8.8,14.8 912 & 24 DIF ORD Cochran Q=6.0 .01 .10,.85 1016 & 23 DIF HIDCOR Cochran Q=5.0 .03 1.0,.40 1012 & 27 DIF TDET Sign 0(-),9(+),(=) .004 2.1,6.7 912 & 27 DIF TID Sign 1(-),8(+),0(=) .04 5.3,9.9 912 & 27 DIF ORD Cochran Q=5.0 .03 .10,.75 912 & 32 DIF TDET Sign 1(-),9(+),0(=) .02 2.1,3.9 1012 & 32 DIF TID Sign 1(-),9(+),0(=) .02 5.3,14.8 1013 & 31 DIF TDET Sign 0(-),9(+),1(=) .04 4.1,13.3 1013 & 31 DIF ORD Cochran Q=5.0 .03 .40,.97 1020 & 31 DIF TDET Sign 1(-),7(+),2(=) .07 4.2,13.3 10
DIF (1 = Low, 2 = High)
Table 16
Vulcan Experimental Effects (Fall, 1989 RTS Test)
ROTARY WING SCENARIOS (Target=l)
Scens Effect Var Test Stats P - leans -s
11 & 14 DIF TDET M-W Z=3.1 .002 5.0,10.0 8,812 & 21 DIF* TOET M-W Z=1.8 .07 7.9,5.8 8,4
9 & 13 EXP TTOT M-W Z=2.1 .03 10.7,4.3 3,4
10 & 19 DIF TDET Sign 0(-),5(+),3(=) .06 4.1,5.9 810 & 25 DIF TDET Sign 0(-),6(+),0(=) .03 4.1,7.0 6
-=- == - -= - = =• •= = = = =
DIF (1 = Low, 2 = High); EXP (1 = Low, 3 = High)
* Indicates Reverse Effect
37

Table 17
Overall Experimental Effects of Single Versus Multiple Targets
(Summer, 1989 RADES Tests)
ITargets Weapon Var T DF P Means SDs Ns
1 vs 2 STNG TID 2.7 146.5 .01 8.5,6.0 7.1,4.3 89,621 vs 3 STNG TID 2.5 36.4 .05 8.5,5.7 7.1,3.0 89,131 vs 2 CHAP TID 4.3 241.6 .001 10.6,6.9 8.2,5.5 163,901 vs 3 CHAP TID 3.0 12.8 .05 10.6,5.8 8.2,4.6 163,101 vs 2 VULC TID 2.6 309 .01 7.7,5.9 6.0,4.1 178,1331 vs 3 VULC TID 4.4 50.4 .001 7.7,4.3 6.0,3.1 178,241 vs 2 STNG TTOT 2.4 105 .05 11.3,8.o 6.2,5.2 60,471 vs 2 CHAP TTOT 2.2 126 .05 14.2,10.7 9.4,8.1 79,491 vs 2 CHAP HIDCOR 2.6 198 .01 .78,.61 .43,.49 111,892 vs 3 CHAP HIDCOR 4.6 123 .001 .61,.19 .49,.40 89,361 vs 3 CHAP HIDCOR 7.3 145 .001 .78,.19 .43,.40 111,362 vs 3 VULC HIDCOR 3.1 163 .01 .73,.47 .45,.50 124,411 vs 3 VULC HIDCOR 3.4 156 .001 .75,.47 .43,.50 117,412 vs 3 CHAP HKILL 2.6 98.1 .05 .25,.08 .43,.28 89,361 vs 3 CHAP HKILL 4.4 103.6 .001 .37,.08 .48,.28 111,362 vs 3 VULC HKILL 2.2 163 .05 .54,.34 .50,.48 124,411 vs 3 VULC HKILL 3.3 156 .001 .63,.34 .48,.48 117,412 vs 3 VULC AVEMISS* 2.6 140.2 .01 .48,.24 .82,.45 162,471 vs 3 VULC AVEMISS* 2.8 238 .01 .48,.24 .54,.45 193,47
II ll il 1l11 lI I I li l li ll liiili i l il ll ll I I~ I 11 1 l ll ilill
(Fall, 1989 RTS Tests)
ITargets Weapon Var T DF P Means SDs Ns 4
1 vs 2 STNG TID 3.4 222.9 .001 11.0,8.1 a.3,4.8 136,1061 vs 3 STNG TID 2.9 143.0 .01 11.0,8.2 8.3,4.5 136,471 vs 2 CHAP TID 2.6 83 .01 9.8,6.8 4.7,5.7 51,341 vs 3 CHAP TID 3.0 66 .01 9.8,5.8 4.7,5.0 51,171 vs 2 VULC TID 4.3 134.0 .001 6.7,2.9 6.4,2.9 94,421 vs 3 VULC TID 4.0 96.7 .001 6.7,3.2 6.4,2.9 94,271 vs 2 STNG TTOT 2.4 148.6 .05 14.5,11.8 8.1,5.8 92,601 vs 2 CHAP TTOT 2.8 40.7 .01 13.5,8.4 7.2,4.7 25,181 vs 2 VULC TTOT 3.5 102.9 .001 8.8,5.1 7.3,3.6 71,341 vs 3 STNG HIDCOR 2.5 158 .05 .7U,.47 .46,.51 128,322 vs 3 STNG HIDCOR 2.2 110 .05 .69,.47 .47,.51 80,321 vs 3 STNG HKILL 4.4 38.1 .001 .66,.31 .48,.47 130,492 vs 3 STNG HKILL 3.4 133 .001 .60,.31 .49,.47 86,491 vs 3 CHAP HKILL 2.8 66 .01 .50,.15 .51,.37 43,202 vs 3 CHAP HKILL 2.3 47 .05 .45,.15 .51,.37 29,201 vs 2 VULC HKILL* 2.1 116 .05 .28,.47 .45,.50 75,432 vs 3 VULC HKILL 2.2 62 .05 .47,.19 .50,.40 43,211 vs 2 VULC HITS* 2.1 151 .05 8.0,14.5 16.3,20.7 101,522 vs 3 VULC HITS 2.1 86 .05 14.5,5.7 20.7,16.8 52,36
* Indicates Reverse Effect
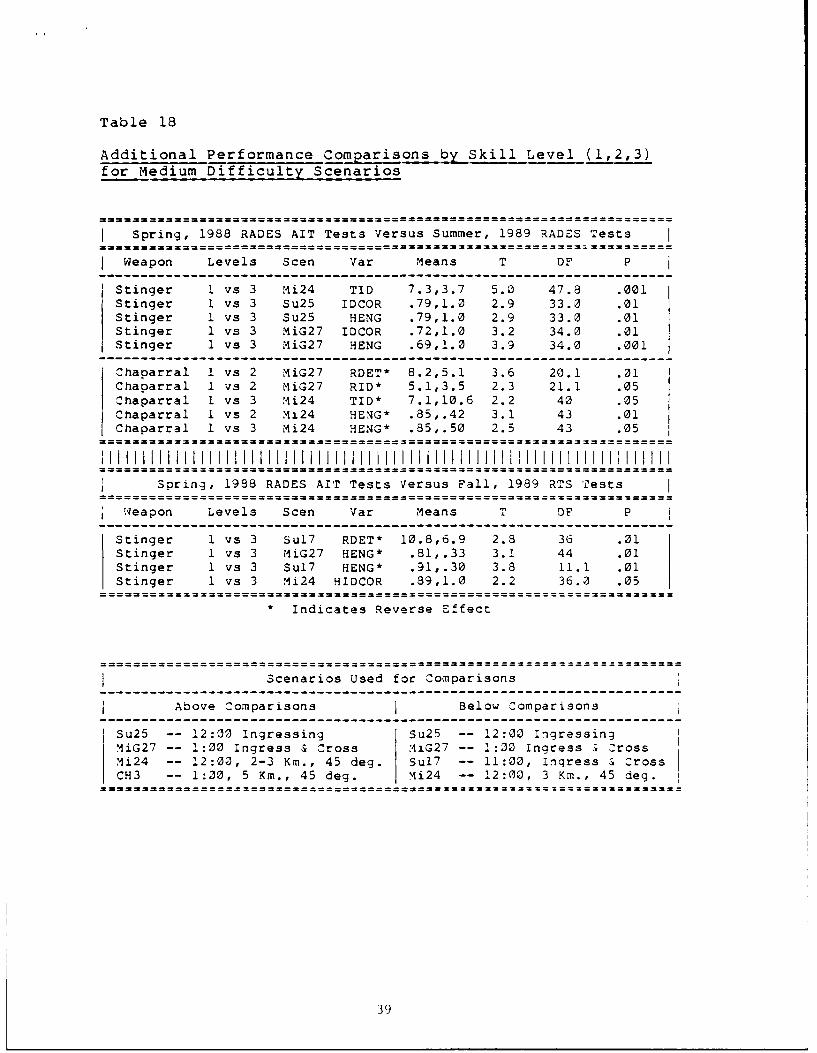
Table 18
Additional Performance Comparisons by Skill Level (1,2,3)for Medium Difficulty Scenarios
Spring, 1988 RADES AIT Tests Versus Summer, 1989 RADES Tests
Weapon Levels Scen Var Means T DF P
Stinger 1 vs 3 Mi24 TID 7.3,3.7 5.0 47.8 .001Stinger 1 vs 3 Su25 IDCOR .79,1.0 2.9 33.0 .01Stinger 1 vs 3 Su25 HENG .79,1.0 2.9 33.0 .01Stinger 1 vs 3 MiG27 IDCOR .72,1.0 3.2 34.0 .01Stinger 1 vs 3 MiG27 HENG .69,1.0 3.9 34.0 .001
Chaparral 1 vs 2 MiG27 RDET* 8.2,5.1 3.6 20.1 .01Chaparral I vs 2 MiG27 RID* 5.1,3.5 2.3 21.1 .05Chaparral 1 vs 3 Mi24 TID* 7.1,10.6 2.2 40 .05Chaparral i vs 2 M124 HENG* .85,.42 3.1 43 .01Chaparral 1 vs 3 Mi24 HENG* .85,.50 2.5 43 .05
liil IIi 1111111ll 111ll Iil li i l11 1111 1111ll l iii ll I lll ll l1
Spring, 1988 RADES AIT Tests Versus Fall, 1989 RTS Tests
weapon Levels Scen Var Means T DF P
Stinger 1 vs 3 Sul7 RDET* 10.8,6.9 2.8 36 .01Stinger 1 vs 3 MiG27 HENG* .81,.33 3.1 44 .01Stinger 1 vs 3 Su17 HENG* .91,.30 3.8 11.1 .01Stinger 1 vs 3 Mi24 HIDCOR .89,1.0 2.2 36.0 .05
* Indicates Reverse Effect
Scenarios Used for Comparisons
Above Comparisons I Below Comparisons
Su25 -- 12:00 Ingressing Su2 5 -- 12:00 IngressingMiG27 -- 1:00 Ingress & Cross MiG27 -- 1:00 ingress & CrossMi24 -- 12:00, 2-3 Km., 45 deg. Sul 7 -- 11:00, Ingress & CrossCH3 -- 1:00, 5 Km., 45 deg. Mi24 -- 12:00, 3 Km., 45 deg.
39

Table 19
Performance Comparisons By Weapon Type for Low to MediumDifficulty Scenarios (Summer 1989 RADES Test)
I WEAPONS TYPE TARG VAR MEANS t df P
STNG vs CHAP FW 1 RDET 9.4,5.4 6.9 148 .001STNG vs VULC FW 1 RDET 9.4,6.3 4.6 138 .001STNG vs CHAP FW 1 RID 3.8,2.9 2.5 88.8 .05STNG vs VULC FW 1 RID 3.8,2.5 3.8 80.8 .001STNG vs VULC FW ALL IDCOR .84,.70 2.0 135.7 .05STNG vs CHAP FW ALL HKILL .77,.41 4.0 116 .001
STNG vs CHAP RW 1 TID 8.5,10.6 2.0 250 .05STNG vs CHAP RW 1 TTOT 11.3,14.2 2.2 134.6 .05STNG vs CHAP RW ALL HIDCOR .79,.58 4.6 371.1 .001VULC vs CHAP RW ALL HIDCOR .70,.58 2.9 539 .01STNG vs CHAP RW ALL PKILL .86,.56 5.7 239.4 .001STNG vs CHAP RW ALL HKILL .64,.26 8.2 411 .001STNG vs CHAP RW ALL FKILL .33,.07 4.3 95.5 .001STNG vs CHAP RW ALL ORD .74,.85 2.6 262.8 .01
Il )

Table 20
Summry ofndivdualDi fferences Correlates
-------------------------------------------------------------------i Fixed WJing H otary wingI
IRE IRD IFR IDO KIL IOD JTE I T T IDCORIXILLSI ORD I
IRF I HaI I IH +
I NP I I I I I I !I I - II I I I
3IZFAI I L LI HM+II
I -S I I I II + 111 I I
I 311Z I I -I I I I= = ~~--- ==---------= = == = = == = == = == = - -===
-- ~~~~---------- - - - - - - - - - - -
TSERVI M + I I II 1L + I L +---------------------------------------------------------
I .FR I I I I I I H I I I I + I
I AFQT I Hs+ I I I I1 11L - I II I I I
I SL ..L.+ I I I 1 I1IL - I I I I I
OF IL + I I I I LI I L
Key: consistency and magnitude of relationship -- L =low; M moderate;H = high; Direction of relationship -- ~) positive; -)=negative
4 1

CONCLUSIONS
Scenario Difficulty
Difficulty indices identified in past research continued tobe employed successfully in defining scenario difficulty.Scenario difficulty was found to affect air defense engagementperformance in the current effort. Performance criteriarecommended for use have been based on three difficulty levels(e.g., low, medium, and high). The recommended scenariospecifications listed in Table 21 reflect these levels ofdifficulty. Significant deviation from these specificationscould render a scenario as higher or lower in difficulty and theperformance criteria should be applied accordingly.
The specific indices having the greatest effect on scenariodifficulty were as follows (in order of importance):
Target Visibility (decreases or increases in target aspect,range, elevation, offset, size, velocity, contrast)
0 Multiple Targets (introducing multiple, simultaneoustargets within engagement range increases load stress andtime stress)
* Model Type (while the soldier should be familiar with allmodern military aircraft, some models will be more familiaror discriminable than others and some are more oftenconfused with their counterparts)
While there are numerous other factors influencingdifficulty, it is recommended that they be controlled (i.e., heldconstant) when applying the criteria to evaluate and qualifysoldiers. These factors include command and control (e.g.,alerting and cuing), weather (e.g., clear weather, daylightconditions), fatigue level (i.e., moderate conditions ofvigilance, boredom, and saturation), and terrain (e.g., skybackground). The criteria are subject to drastic changes as newconditions are introduced. For example, the likelihood ofdetecting a target with a terrain background, at zero aspect, at5 kilometers, on a day with poor visibility, without cuing, isextremely low.
43

Table 21
ScenarioSpecifications byDifficulty Level
Fixed Wing---------------------------------------------------------------------------
LOW MEDIUM HIGH
Single, ingressing or Single, ingressing FW Ingressing FW (plus*)crossing FW (plus*) - available at 20 km - presented simultane-
- visible at maximum ioeyond v:isible range) ously with anotherrange (15-20 kim) - medium altitude FW or 1-2 RW
- medium-high alt. (1000 ft.) - closer range (avail.)- slow speed (400- - mach speed (bO0 mph) - lower than 1000 ft.
500 mph) - 3 to 45 deg. aspect - faster than mach- 90 deg. aspect - Cued to +/- 15 deg. (700+ mph)- Cued to +/- 15 aeg. - Familiar target with - Cuing exceeas +/- 30- Familiar target with unique features deg. accuracy
unique features - Low familiarity ordiscriminability
Rotary Wing
LOW MEDIUM HIGH
- Single, hovering RW Single, hovering or Single, hovering RW(plus*) multiple, sequential RW (plus*)
- 1-3 km range - 1-3 km range - presented simultane-- 5- deg. elevation - 3-5 deg. elevation ously with 1-2 RW- 45-90 deg. aspect (above mask) - 5-7 km range- Cued to +/- 15 deg. - 0-90 deg. aspect - 1-2 deg. elevation- Available 30 seconds - Cued to +/- 15 deg. - 0 deg. aspect- Familiar target with - Available 20 seconds - Cuing exceeds +/- 50
unique features - Familiar target with deg. accuracyunique features - Available 10 seconds
- Low familiarity ordiscriminability
Indicates some or all of the conditions which follow exist(variations from medium difficulty specifications)
-4
Of course, some conditions (such as weather) cannot becontrolled. Hence, the evaluator may need to take intoconsideration weather conditions, especially those affectingvisibility (wind, clouds, haze, etc.), when evaluating soldiers.Other factors such as the search sector, the flight path oftargets, the presence of multiple aircraft, and terrainvariations may also inhibit soldiers in detecting and identifyingaircraft at maximum visible range, thereby influencingperformance outcomes. There are several factors that influenceperformance during the execution of a field test exercise thatmust be considered to ensure fair application of the standards(i.e, selection of the correct tables). Thus, the standardsshould be interpreted with some flexibility due to theunpredictability of the field test environment.
Criteria Calibration
Based on the results from this research effort, a fewmodifications to the preliminary criteria have been recommended.Some of the criteria appeared to be unachievable due tolimitations of the weapons, the personnel, or the doctrine. Forexample, the probability of kill (Pk) and effective range of theVulcan and PIVADS weapon systems limit the ability of troops toobtain hostile kills and prevent ordnance release, particularlyfor FW aircraft. While the Pk for the weapon may be higher, itis unrealistic to expect this weapon system to achieve maximum Pkon FW aircraft.
The criteria provided in Tables 22 and 23 reflect the besttradeoff between what is humanly achievable and what is requiredin terms of the threat, the tactics, and the doctrine. Themedium difficulty criteria are based on the "average" scenario.Low difficulty criteria imply the scenario specifications havebecome less stringent, such as making the target easier to see(e.g., closer, slower, etc.) and identify (e.g., enhanced orunique features and familiarity). High difficulty criteria implymore stringent scenario specifications, such as making the targetharder to see (farther, faster, less aspect, less contrast,etc.), or by making the task more difficult (multiple targets,low discriminability or familiarity, etc.).
Individual Differences
A number of individual differences have repeatedly emergedas reliable correlates of air defense performance. The bestpredictors appear to be the vision measures. Visual acuity andcontrast sensitivity, resting focus, and blur interpretationpredicted visual tasks such as detection and identification quitewell.
45

Table 22
Recommended Task Performance Criteria
Fixed Wing (Ranges in Fallscale Kilometers)--- ----------------------------------------------------------
Stinger Chaparral VulcanTask
L I M I H L 1 4 H L M I H------------------------------------------------------------------
RDET 11 9 7 11 9 7 9 7 6RACQ 8 6 4 j 8 6 4 - - -
RID 7 5 3 7 5 3 4 3 2RFT RF S] I I 1 5 3 1 2 2 1
Rotary Wing (Elapsed Time in Seconds)
Stinger Chaparral VulcanTask
LI M I H L I M I H L
TDET 4 6 10 4 6 10 4 6 10TACQ 4 5 6 4 5 6 - - -
TID 5 7 9 5 7 9 5 7 9TFIRE 5 7 9 5 7 9 5 7 9TTOT 9 12 15 9 12 15 9 12 15
4(,

Table 23
Recommended Summary Performance Criteria
Fixed Wing (Percentages)
OutcomeL ----- HStinger 1 - Chaparral -- L Vulcan -Oucm------------------------------------ ----------
L M IH L IM IH LIM H------- 80--75 - 70-- 80-75--70-80--
IDCOR 80 75 70 80 75 70 80 75 70FIDCOR 80 75 75 85 75 75 80 75 70HIDCOR 85 80 75 85 80 75 85 80 75
FENG 20 25 30 20 25 30 20 25 30HENG 85 80 75 85 80 75 85 80 75PKILL 80 75 65 80 75 65 40 30 20FKILL 20 25 30 20 25 30 20 25 30HKILL 70 60 50 70 60 50 30 20 10ORD 55 35 15 55 35 15 - - -HITS* - - - - - - 5 4 3
Rotary Wing (Percentages)
Outcomel Stinger - Chaparral - VulcanOucm------------------------------------ ----------
L M I H L M H L M H
IDCOR 80 75 70 80 75 70 80 75 70E'IDCOR 80 75 70 80 75 70 80 75 70HIDCOR 85 80 75 85 80 75 85 80 75FENG 20 25 30 20 25 30 20 25 30HENG 85 80 75 85 80 75 85 80 75PKILL 80 75 65 80 75 65 so 75 65FUILL 20 25 30 20 25 30 20 25 30HKILL 70 60 50 70 60 50 70 60 50ORD 55 35 15 55 35 15 55 35 15HITS* - - - - - - 10 8 6
* Refers to Vulcan weapon (Number represents rounds on target)
47

REFERENCES
Barber, A. V. (1987). The Realistic Air Defense EnqanementSystem (RADES): Three Years of Research Results Paso,
TX: Science Applications International Corp.
Barber, A. V. (1990). Visual Mechanisms and Predictors of Far
Field Visual Task Performance Results (Doctoral ,i6sertation,
New Mexico State University, 1989). Dissert:Lion AbstractsInternational.
Barber, A. V., Drewfs, P. R., & Johnson, D. M. (1987).Performance of Stinger Teams Using the RADES Multiple WeaponConfiguration (ARI Working Paper FB 87-09). Alexandria, VA:U.S. Army Research Institute for the Behavioral and SocialSciences.
Barber, A. V., Drewfs, P. R., & Lockhart, J. M. (1987).Effective Stinger Training in RADES (ARI Working Paper FB 87-02). Alexandria, VA: U.S. Army Research Institute for theBehavioral and Social Sciences.
Daskal, S. E. (1990). Air defense against the evolving threat.Army Research, Development and Acquisition Bulletin, March-April 1990.
Drewfs, P. R., & Barber, A. V. (1990). Short Range Air Defense(SHORAD) Engagement Performance Criteria (ARI Research Note90-12). Alexandria, VA: U.S. Army Research Institute for theBehavioral and Social Sciences. (AD A221 020)
Drewfs, P. R., & Barber, A. V. (1988). Short Range Air Defense(SHORAD) Engagement Performance Criteria Partial ValidationReport. El Paso, TX: Science Applications International Corp.
Drewfs, P. R., Barber, A. V., Johnson, D. M., & Frederickson, E.W. (1988). Validation of the Realistic Air Defense EngagementSystem (RADES) (ARI Technical Report 789). Alexandria, VA:U. 9. Army Research Institute for the Behavioral and SocialSciences. (AD A198 289)
Headquarters, Department of the Army (1986). Visual AircraftRecognition (Field Manual 44-30). Washington, DC: Author.
Headquarters, Department of the Army (1988). Standards inWeapons Training (Department of the Army Pamphlet 350-38).Washington, DC: Author.
Headquarters, Department of the Army (1989). Chaparral CrewMember Soldier's Manual and Trainer's Guide STP 44-16P14-SM-TG). Washington, DC: Author.
A. 9

Johnson, D. M., Barber, A. V., & Lockhart, J. M. (1988). TheEffect of Target Background and Aspect Angle on Performance ofStinqer Teams in the Realistic Air Defense Engagement System(RADES) (ARI Technical Report 822). Alexandria, VA: U. S.Army Research Institute for the Behavioral and SocialSciences. (AD A207 283)
Rotchford, F. C., & Daruwalla, A. N. (1987). Visual AircraftRecognition: Volume I -- Summary Report (TRAC-WSMR-TEA-II-87). White Sands Missile Range, NM: US Army TRADOC AnalysisCommand.
U. S. Army Air Defense Artillery School (June, 1989). ADATraining Device Macro/Micro Strategy (Training Circula 44-50,Coordinating Draft). Ft. Bliss, TX: Author.
5()

APPENDIX A: SUMMARY STATISTICS FOR SUMMER, 1989 RADES TESTS
A-I

Table A-I
Identification Accuracy
WEAPON TYPE TARGET MODEL MEAN SD N---------------------------------------------------------------
STNG FW --- A7 .43 .51 14STNG FW --- MiG27 1.0 0 15STNG FW --- Su24 .93 .27 14STNG FW --- Su25 1.0 0 14CHAP FW --- A7 .35 .49 20CHAP FW --- MiG27 .89 .32 27CHAP FW --- Su24 .79 .41 24CHAP FW --- Su25 .79 .41 24VULC FW --- A7 .26 .45 23VULC FW --- MiG27 .89 .32 18VULC FW --- Su24 .90 .30 21VULC FW --- Su25 .79 .41 24
-----------------------------------------------------------
STNG RW1 AH64 .44 .51 16STNG RW 1 CH3 .44 .51 16STNG RW 2 CH3 .45 .52 11STNG RW 1 UHI .56 .53 9STNG RW 2 UHI .42 .51 12STNG RW 1 Mi8 .92 .28 13STNG RW 2 Mi8 .81 .40 32STNG RW 3 Mi8 .68 .48 25STNG RW 1 Mi24 .93 .27 14STNG RW 2 Mi24 .85 .38 13STNG RW 1 Mi28 .86 .36 28STNG RW 1 Ka? .64 .51 13STNG RW 2 Ka? .77 .44 13CHAP RW 1 AH64 .22 .42 27CHAP RW 1 CH3 .30 .47 23CHAP RW 2 CH3 .10 .30 21CHAP RW 1 UH1 .59 .50 27CHAP RW 2 UH1 .50 .52 12CHAP RW 3 UHI .33 .58 3CHAP RW 1 Mi8 .85 .34 24CHAP RW 2 Mi8 .66 .48 44CHAP RW 3 Mi8 .19 .40 36CHAP RW 1 Mi24 .71 .46 24CHAP RW 2 Mi24 .82 .39 22CHAP RW 1 Mi28 .73 .45 48CHAP RW 1 Ka? .80 .41 15CHAP RW 2 Ka? .30 .47 23
A-2

Table A-i (Continued)
I WEAPON TYPE TARGET MODEL MEAN SD N
VULC RW 1 AHI .87 .34 23VULC RW 1 CH3 .14 .35 29VULC RW 2 CH3 .11 .32 19VULC RW 1 UHI .62 .49 24VULC RW 2 UH1 .78 .43 18VULC RW 3 OH1 .50 .55 6VULC RW 1 Mi8 .81 .40 21VULC RW 2 MiB .84 .37 38VULC RW 3 Mi8 .49 .51 37VULC RW 1 Mi24 .83 .38 48VULC RW 2 Mi24 .96 .21 23VULC RW 1 Mi28 .52 .51 27VULC RW 2 Mi28 .52 .51 40VULC RW 3 Mi28 .00 0 3VULC RW 1 Ka? .81 .40 21VULC RW 2 Ka? .62 .49 24
A-3

Table A-2
Descriptive Statistics: Stinger FW Event Ranges
IVAR SCEN MEAN SD N I
RDET ALL 9.4 3.7 561 6.7 1.6 152 12.0 2.4 143 10.8 4.0 134 8.4 3.8 14
RIFF ALL 8.1 4.2 571 6.4 3.0 152 9.9 4.6 143 10.5 3.8 144 5.9 3.7 14
RID ALL 3.8 2.3 551 3.4 2.1 152 3.9 1.5 143 4.3 2.4 124 3.7 3.1 14
----- -------------------------------
RACQ ALL 4.7 3.0 40
1 3.6 2.3 102 5.0 3.6 123 6.3 2.8 84 4.2 2.8 10
RLOCK* ALL 2.9 1.7 511 3.2 2.1 152 3.3(1.8) 2.0(0.3) 11(3)3 2.7 1.7 94 2.5 0.8 13
----- -------------------------------
RFIRE* ALL 2.7 1.5 471 3.1(3.5) 2.1(0) 14(1)2 2.6(2.2) 1.3(0.4) 11(3)3 3.3 1.6 74 2.1 0.6 11
* Represents aircraft ranges which were
either ingressing or egressing
A-4

Table A-3
Descriptive Statistics: Chaparral FW EventRanges
VAR SCEN MEAN SD N I
RDET ALL 5.4 3.3 941 5.1 2.6 272 6.6 4.1 243 5.3 3.4 194 4.7 2.7 24
RIFF ALL 3.8 2.7 59
1 4.0 2.1 152 4.6 3.6 163 3.4 2.5 124 3.5 2.4 15
RID* ALL 2.9 1.7 941 3.4 2.1 272 3.3(2.4) 1.9(0.8) 17(7)3 2.7(4.8) 1.7(0) 18(1)4 2.3 1.0 24
RACQ ALL 3.4 2.2 49
1 3.8 2.2 132 3.8 2.9 153 2.5 1.5 94 3.0 1.4 11
RFIRE* ALL 3.1 2.2 511 3.5(3.9) 2.0(0) 16(1)2 3.7(2.0) 3.1(1.0) 13(3)3 2.6(4.0) 1.3(3.2) 7(2)4 1.8 0.7 9
Represents aircraft ranges which were
either ingressing or egressing
A-5
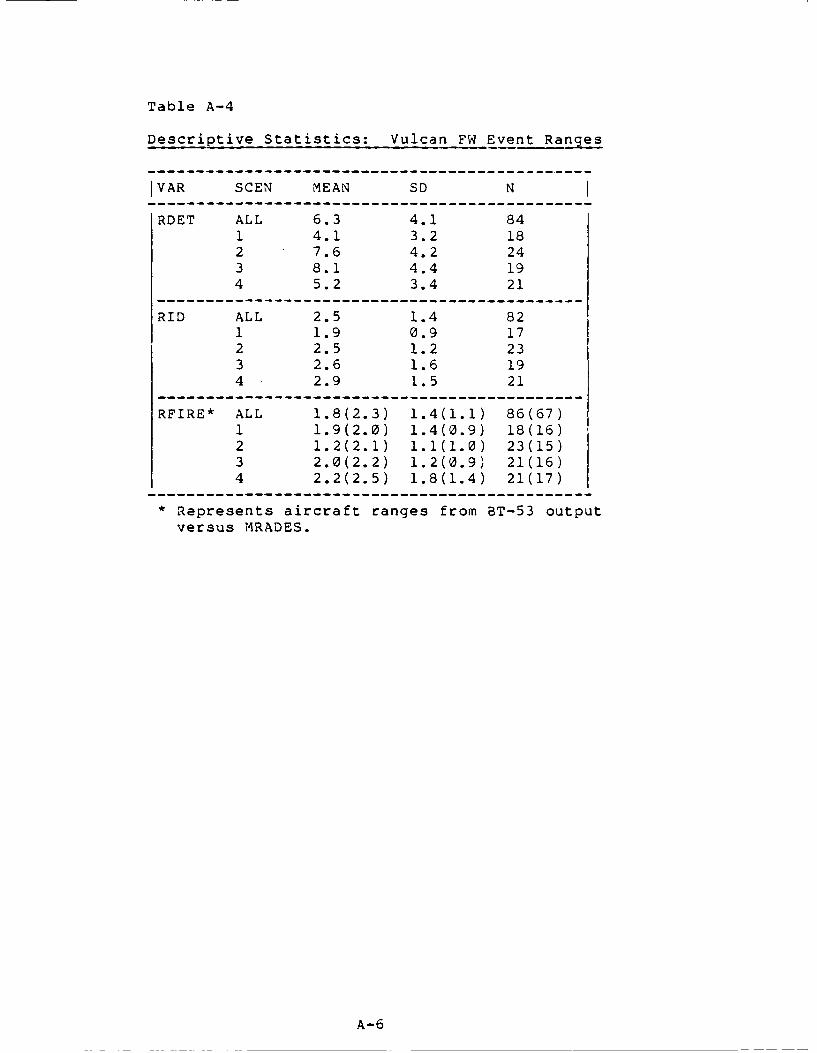
Table A-4
Descriptive Statistics: Vulcan FW Event Ranges
IVAR SCEN MEAN SD N I
RDET ALL 6.3 4.1 841 4.1 3.2 182 7.6 4.2 243 8.1 4.4 194 5.2 3.4 21
RID ALL 2.5 1.4 821 1.9 0.9 172 2.5 1.2 233 2.6 1.6 194 2.9 1.5 21
RFIRE* ALL 1.8(2.3) 1.4(1.1) 86(67)1 1.9(2.0) 1.4(0.9) 18(16)2 1.2(2.1) 1.1(1.0) 23(15)3 2.0(2.2) 1.2(0.9) 21(16)4 2.2(2.5) 1.8(1.4) 21(17)
* Represents aircraft ranges from BT-53 outputversus MRADES.
A-6

Table A-5
Descriptive Statistics: Stinger RW Event Times
jVAR SCEN TARGET MEAN SD N
TDET ALL 1 8.2 6.6 1035 1 5.2 3.4 136 1 5.6 5.1 137 1 11.4 6.5 88 1 7.5 6.9 139 1 5.8 2.0 1510 1 5.1 9.1 1411 1 10.8 6.5 1412 1 5.4 4.3 13ALL 2 39.5 15.5 713 2 60.7 7.4 124 2 53.6 7.1 127 2 29.1 7.6 1310 2 32.5 4.2 811 2 30.7 13.9 1312 2 30.5 8.3 13ALL 3 41.7 7.1 1511 3 41.8 6.2 612 3 41.6 8.0 9
TIFF ALL 1 5.0 6.4 735 1 3.2 3.4 106 1 3.7 4.8 107 1 5.2 4.4 68 1 5.7 8.1 99 1 4.2 4.7 1110 1 4.4 5.4 811 1 4.9 7.7 812 1 8.4 9.7 11ALL 2 4.5 5.1 563 2 7.5 6.1 114 2 4.6 5.1 107 2 2.6 4.0 810 2 1.6 1.8 711 2 4.6 6.6 912 2 4.8 4.1 11ALL 3 4.8 8.1 1311 3 1.6 1.5 512 3 6.9 10.0 8
A-7

Table A-5 (Continued)
IVAR SCEN TARGET MEAN SD N
TID ALL 1 8.5 7.1 895 1 5.8 4.0 136 1 3.7 1.4 137 1 8.4 6.1 58 1 11.2 6.1 119 1 17.3 8.7 1210 1 7.6 2.4 1311 1 9.5 11.5 1012 1 5.8 3.2 12ALL 2 6.0 4.3 623 2 8.9 5.7 104 2 5.0 2.6 117 2 3.5 1.8 1210 2 8.6 4.9 811 2 6.3 4.2 1212 2 4.6 3.6 9ALL 3 5.7 3.0 1311 3 6.3 2.1 612 3 5.1 3.6 7
TACQ ALL 1 6.6 5.3 355 1 7.2 5.1 56 1 3.6 1.7 57 1 2.0 0 18 1 6.4 6.8 79 1 8.4 7.6 510 1 7.1 4.9 911 1 13.0 0 112 1 5.5 3.5 2ALL 2 6.8 6.6 173 2 4.0 2.6 34 2 5.5 4.1 47 2 5.7 2.1 310 2 3.0 0 111 2 7.3 5.8 312 2 13.0 13.9 3
A-S

Table A-5 (Continued)
IVAR SCEN TARGET MEAN SD N
TLOCK ALL 1 5.7 3.4 315 1 7.8 6.9 56 1 5.0 1.5 67 1 4.0 0 18 1 6.8 3.0 49 1 6.8 3.8 410 1 4.7 1.0 811 1 4.0 0 212 1 3.0 0 1ALL 2 9.0 8.8 133 2 13.3 10.7 34 2 5.0 1.0 37 2 7.5 2.1 211 2 12.7 15.9 3
12 2 4.5 2.1 212 3 5.0 1.7 3
THAND ALL 1 5.3 3.8 605 1 5.3 4.4 96 1 6.1 4.4 137 1 3.0 0 18 1 5.7 3.3 69 1 5.5 4.1 410 1 6.4 4.8 1111 1 3.2 1.6 512 1 3.9 2.3 11ALL 2 4.9 3.8 443 2 6.3 4.4 74 2 3.6 2.1 117 2 5.0 4.7 910 2 2.0 0 111 2 7.4 4.9 712 2 3.6 2.2 9ALL 3 6.3 5.2 1211 3 5.0 2.8 612 3 7.7 6.8 6
A-9

Table A-5 (Continued)
IVAR SCEN TARGET MEAN SD N-----------------------------------------TFIRE ALL 1 9.3 5.6 27
5 1 8.0 2.6 56 1 8.5 4.2 67 1 5.0 0 18 1 8.5 0.7 29 1 8.3 4.0 310 1 10.0 4.8 711 1 19.5 16.3 212 1 5.0 0 1ALL 2 5.8 4.3 163 2 8.5 6.4 24 2 6.5 0.7 37 2 8.3 5.0 311 2 6.3 2.5 312 2 6.5 2.1 212 3 10.3 9.1 3
TTOT ALL 1 11.3 6.2 605 1 9.8 8.0 96 1 9.6 4.6 127 1 7.5 4.9 28 1 14.2 3.4 69 1 17.3 4.9 410 1 14.0 5.0 1111 1 9.3 9.8 712 1 9.9 4.2 9ALL 2 8.6 5.2 473 2 12.9 6.5 74 2 7.6 3.1 117 2 8.3 5.6 910 2 13.0 0 111 2 11.6 4.6 812 2 4.6 3.1 11ALL 3 10.5 5.8 1111 3 12.2 3.8 512 3 9.0 7.2 6
A-10
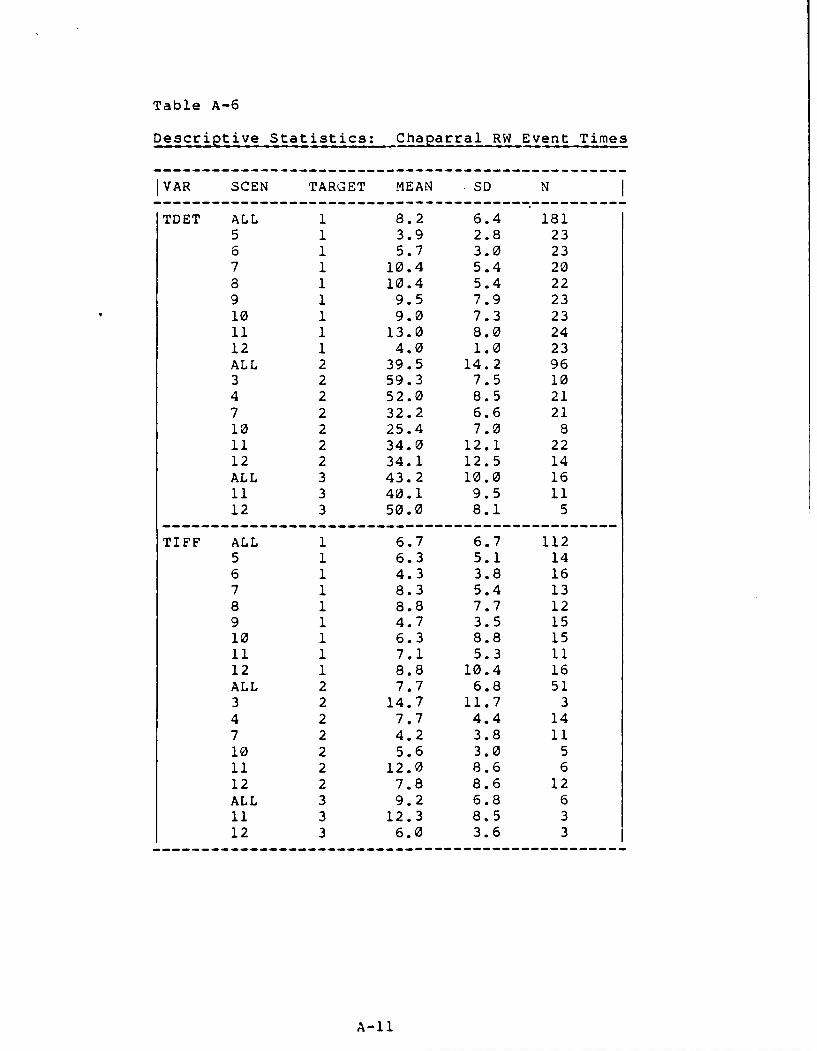
Table A-6
Descriptive Statistics: Chaparral RW Event Times
IVAR SCEN TARGET MEAN SD N I
TDET ALL 1 8.2 6.4 1815 1 3.9 2.8 236 1 5.7 3.0 237 1 10.4 5.4 208 1 10.4 5.4 229 1 9.5 7.9 2310 1 9.0 7.3 2311 1 13.0 8.0 2412 1 4.0 1.0 23ALL 2 39.5 14.2 963 2 59.3 7.5 104 2 52.0 8.5 217 2 32.2 6.6 2110 2 25.4 7.0 811 2 34.0 12.1 2212 2 34.1 12.5 14ALL 3 43.2 10.0 1611 3 40.1 9.5 1112 3 50.0 8.1 5
TIFF ALL 1 6.7 6.7 1125 1 6.3 5.1 146 1 4.3 3.8 167 1 8.3 5.4 138 1 8.8 7.7 129 1 4.7 3.5 1510 1 6.3 8.8 1511 1 7.1 5.3 1112 1 8.8 10.4 16ALL 2 7.7 6.8 513 2 14.7 11.7 34 2 7.7 4.4 147 2 4.2 3.8 1110 2 5.6 3.0 511 2 12.0 8.6 612 2 7.8 8.6 12ALL 3 9.2 6.8 611 3 12.3 8.5 312 3 6.0 3.6 3
A-11

Table A-6 (Continued)
IVAR SCEN TARGET MEAN SD N
TID ALL 1 10.6 8.2 1635 1 6.7 5.1 206 1 8.3 3.9 237 1 13.8 7.2 198 1 10.1 3.1 189 1 12.6 4.1 1910 1 10.0 7.0 2211 1 12.9 10.7 1912 1 11.2 14.9 23ALL 2 6.9 5.5 903 2 7.3 5.5 84 2 8.4 6.4 217 2 3.9 2.9 1910 2 7.1 1.4 811 2 8.9 7.3 2012 2 5.7 3.5 14ALL 3 5.8 4.6 1011 3 4.0 3.6 712 3 10.0 4.6 3
TACQ ALL 1 8.7 7.9 615 1 5.1 4.6 86 1 10.1 6.4 97 1 9.0 6.0 78 1 10.7 9.0 79 1 5.6 4.2 910 1 4.4 3.4 711 1 8.5 7.2 612 1 15.8 13.9 8ALL 2 11.9 7.6 293 2 14.7 11.7 34 2 11.0 5.8 87 2 9.0 6.7 510 2 5.0 3.0 311 2 16.0 9.0 312 2 15.0 8.4 7
A-12

Table A-6 (Continued)
IVAR SCEN TARGET MEAN SD N
THAND ALL 1 8.2 8.1 605 1 8.2 6.3 96 1 4.6 5.6 97 1 2.7 2.3 38 1 9.0 2.5 69 1 5.1 2.5 710 1 9.8 9.7 811 1 14.8 9.4 512 1 9.8 11.6 13ALL 2 6.2 6.2 373 2 1.0 1.4 24 2 8.8 10.3 67 2 5.7 4.9 1210 2 1.0 0 111 2 7.5 5.7 612 2 6.1 5.8 1011 3 5.3 0.6 3
TFIRE ALL 1 8.6 7.5 335 1 3.0 1.4 46 1 8.8 7.7 57 1 4.0 4.2 28 1 12.0 10.5 39 1 10.2 6.1 510 1 12.0 11.8 611 1 8.3 4.0 312 1 7.0 6.2 5ALL 2 6.9 5.7 133 2 9.0 0 14 2 5.0 1.4 27 2 6.8 5.3 410 2 3.5 4.9 211 2 7.7 9.9 312 2 14.0 0 1
TTOT ALL 1 14.2 9.4 795 1 11.5 6.4 146 1 10.8 8.0 117 1 9.5 4.5 68 1 19.3 3.9 69 1 16.3 4.9 810 1 18.1 12.3 1111 1 14.3 8.0 812 1 15.0 13.8 15ALL 2 10.7 8.1 493 2 5.0 4.3 54 2 11.6 8.2 107 2 9.0 5.9 1410 2 7.0 2.8 211 2 16.4 13.5 812 2 11.4 4.9 1011 3 7.5 3.7 4
A-13

Table A-7
Descriptive Statistics: Vulcan RW Event Times
IVAR SCEN TARGET MEAN SD N
TDET ALL 1 6.5 5.2 1885 1 3.9 2.5 246 1 2.8 1.0 247 1 6.1 2.6 218 1 12.8 8.3 249 1 9.0 6.5 2310 1 5.6 3.1 2411 1 7.8 2.8 2412 1 4.2 2.1 24ALL 2 33.4 17.8 1453 2 64.6 6.6 184 2 53.6 7.1 218 2 31.3 4.1 239 2 23.4 5.8 1610 2 16.8 4.3 2111 2 25.4 9.2 2312 2 23.0 11.8 23ALL 3 33.3 11.2 2611 3 35.9 9.5 1212 3 31.0 12.4 14
TID ALL 1 7.7 6.0 1785 1 9.1 5.6 236 1 6.2 4.1 247 1 6.2 3.8 218 1 11.6 6.7 199 1 6.5 4.6 2310 1 6.5 6.3 2211 1 10.0 9.2 2312 1 6.0 4.1 23ALL 2 5.9 5.9 1333 2 7.3 6.2 164 2 6.6 3.7 198 2 3.8 3.7 209 2 5.4 3.2 1610 2 8.0 8.1 2111 2 5.1 6.5 2012 2 5.4 6.8 21ALL 3 4.3 3.1 2411 3 4.4 2.7 1112 3 4.2 3.4 13
A-14

Table A-7 (Continued)
IVAR SCEN TARGET MEAN SD N
THAND ALL 1 3.7 3.5 815 1 3.8 3.3 106 1 3.7 2.8 197 1 4.8 5.0 108 1 0.3 0.6 39 1 4.1 3.2 1410 1 4.0 4.2 211 1 3.2 2.0 912 1 3.3 4.4 14ALL 2 5.5 4.9 683 2 4.6 4.4 114 2 8.3 4.9 78 2 5.5 5.2 149 2 3.5 2.8 1010 2 8.1 5.8 1411 2 3.5 5.0 612 2 3.0 2.5 6ALL 3 4.5 3.7 811 3 5.5 3.7 612 3 1.5 2.1 2
TFIRE ALL 1 9.0 5.5 405 1 11.3 5.6 76 1 6.9 3.5 97 1 7.3 3.8 79 1 12.0 5.7 711 1 4.0 5.7 212 1 9.3 7.2 8ALL 2 8.6 5.7 243 2 8.5 4.0 44 2 13.4 8.4 58 2 8.9 5.3 79 2 6.7 3.2 311 2 1.0 0 112 2 5.8 1.9 411 3 9.0 1.7 3
A-15
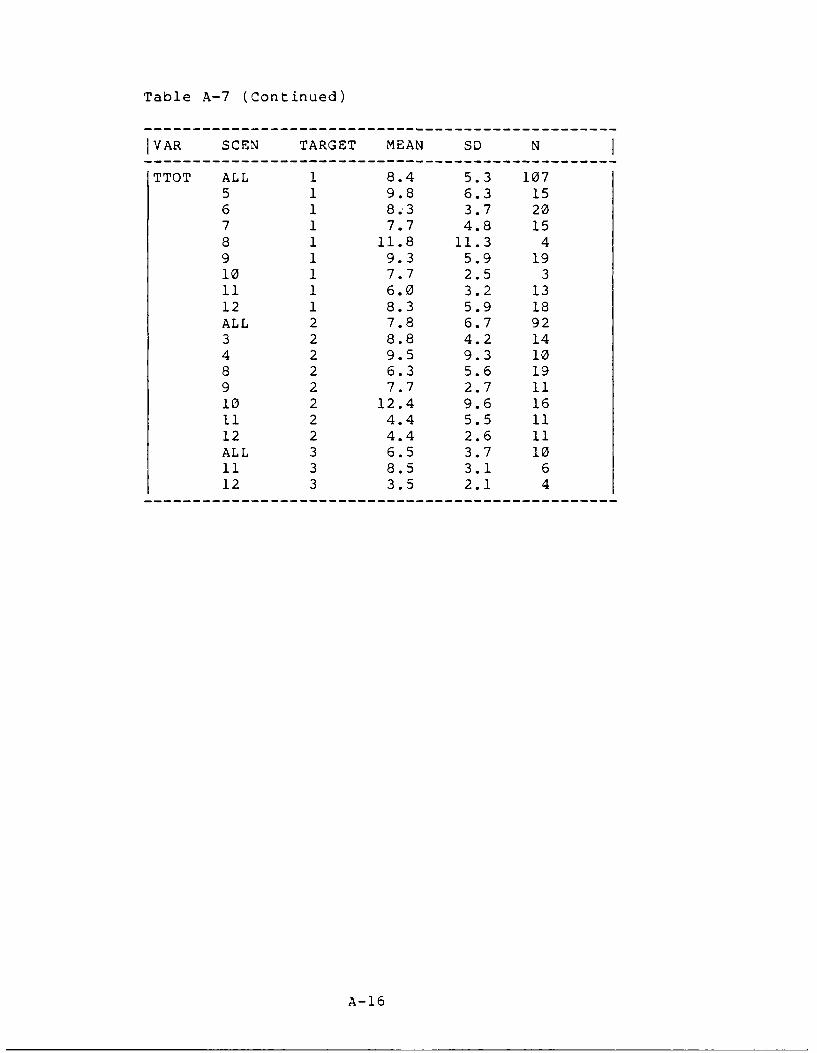
Table A-7 (Continued)
IVAR SCEN TARGET MEAN SD N
TTOT ALL 1 8.4 5.3 1075 1 9.8 6.3 156 1 8.3 3.7 207 1 7.7 4.8 15
8 1 11.8 11.3 49 1 9.3 5.9 1910 1 7.7 2.5 311 1 6.0 3.2 1312 1 8.3 5.9 18ALL 2 7.8 6.7 923 2 8.8 4.2 144 2 9.5 9.3 108 2 6.3 5.6 199 2 7.7 2.7 1110 2 12.4 9.6 1611 2 4.4 5.5 1112 2 4.4 2.6 11ALL 3 6.5 3.7 1011 3 8.5 3.1 612 3 3.5 2.1 4
A-16
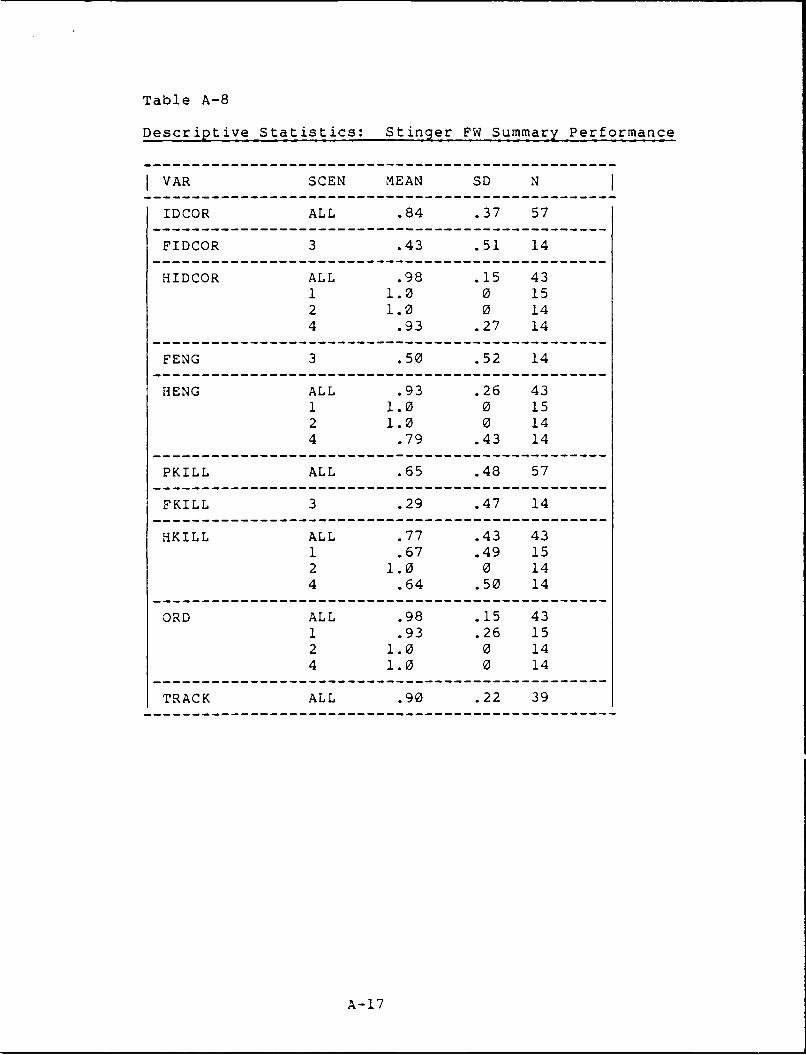
Table A-8
Descriptive Statistics: Stinger FW Summary Performance
I VAR SCEN MEAN SD N
IDCOR ALL .84 .37 57
FIDCOR 3 .43 .51 14
HIDCOR ALL .98 .15 431 1.0 0 152 1.0 0 144 .93 .27 14
FENG 3 .50 .52 14
HENG ALL .93 .26 431 1.0 0 152 1.0 0 144 .79 .43 14
PKILL ALL .65 .48 57
FKILL 3 .29 .47 14
HKILL ALL .77 .43 431 .67 .49 152 1.0 0 144 .64 .50 14
ORD ALL .98 .15 431 .93 .26 152 1.0 0 144 1.0 0 14
TRACK ALL .90 .22 39
A-17

Table A-9
Descriptive Statistics: Chaparral FW Summary Performance
I VAR SCEN MEAN SD N
IDCOR ALL .73 .45 95
FIDCOR 3 .35 .49 20
HIDCOR ALL .83 .38 751 .89 .32 272 .79 .41 244 .79 .41 24
FENG 3 .45 .51 20
HENG ALL .56 .50 751 .63 .49 27
*2 .67 .48 244 .38 .49 24
PKILL ALL .78 .42 49
FKILL 3 .35 .49 20
HKILL ALL .41 .50 751 .44 .51 272 .50 .51 244 .29 .47 24
ORD ALL .92 .27 751 .81 .40 272 .95 .20 244 1.0 0 24
TRACK ALL .86 .26 31
A-18
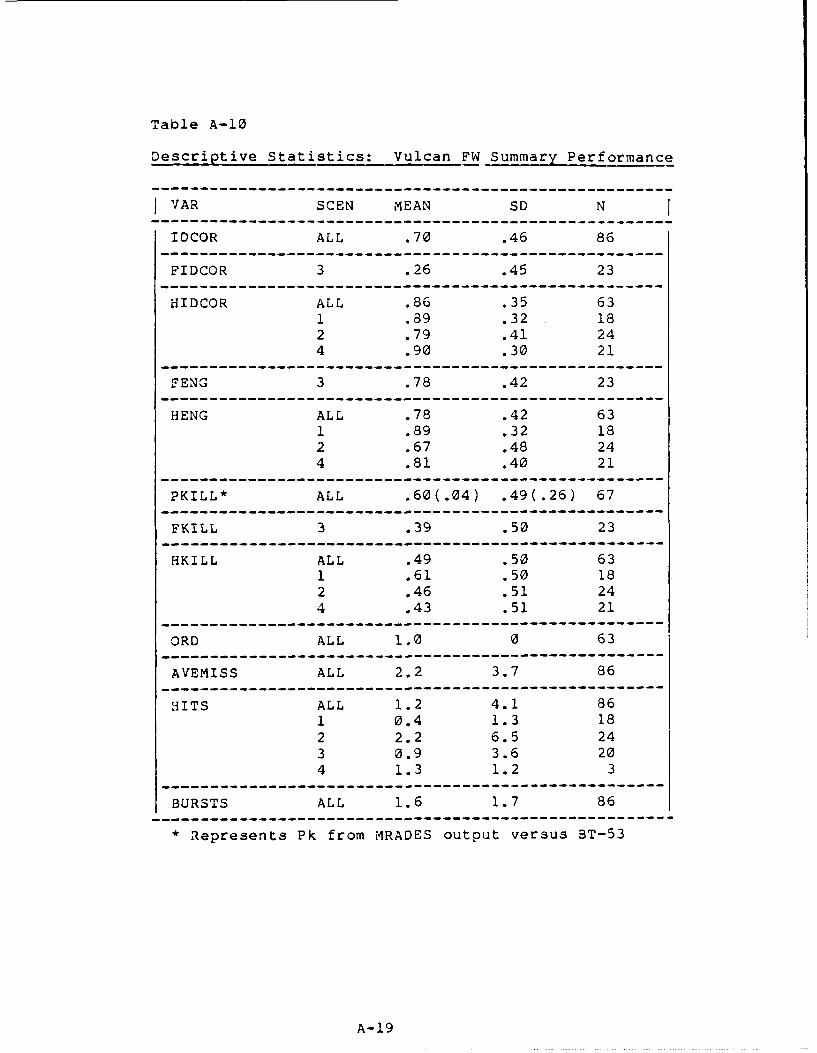
Table A-10
Descriptive Statistics: Vulcan FW Summary Performance
VAR SCEN MEAN SD N
IDCOR ALL .70 .46 86
FIDCOR 3 .26 .45 23
HIDCOR ALL .86 .35 631 .89 .32 182 .79 .41 244 .90 .30 21
FENG 3 .78 .42 23
HENG ALL .78 .42 631 .89 .32 182 .67 .48 244 .81 .40 21
PKILL* ALL .60(.04) .49(.26) 67
FKILL 3 .39 .50 23
HKILL ALL .49 .50 631 .61 .50 182 .46 .51 244 .43 .51 21
---- ---------------------------------- ---------
ORD ALL 1.0 0 63- -------------------------------------------
AVEMISS ALL 2.2 3.7 86----- -------------------------------------------
HITS ALL 1.2 4.1 861 0.4 1.3 182 2.2 6.5 243 0.9 3.6 204 1.3 1.2 3
----- -------------------------------------------BURSTS ALL 1.6 1.7 86
----- --------------------------------------------* Represents Pk from MRADES output versus BT-53
A-19

Table A-lI
Descriptive Statistics: Stinger RW Summary Performance
VAR SCE N TARGET MEAN SD N--- -----------------------------------------
IDCOR ALL ALL .68 .47 226ALL 1 .70 .46 109ALL 2 .70 .46 31ALL 3 .64 .49 29
F:C R ALL ALL .43 .5- 72ALL 1 .47 .50 41ALL 2 .43 .51 23ALL 3 .5Z .71 27 .36 .50 1.
3 -- .36 .50 14-- .44 .5i 16
*1 -- .57 .51 14*1 -- .43 .51 14
HIDCOR ALL 4LL .79 .41 154ALL 1 .34 .37 68ALL 2 .81 .40 58ALL 3 .65 .49 263 -- .79 .43 144 -- .93 .27 145 .79 .43 146 .93 .27 147 -- .79 .43 14
.. 36 .361i ALL .64 .49 2912 ALL .79 .42 42
---- ----------------------------------------
EENG ALL ALL .38 .49 72A L. L .39 .49 4iALL 2 .43 .51 23ALL 3 d 2 27 -- .29 .47 143 .50 .52 19 -- .31 .48 i6
-2 .21 .43 14S -. 57 .5-1
---- ----------------------------------------H NG ALL ,'LL .73 .44 154
ALL 1 .75 .44 68ALL 2 .76 .43 58ALL 3 .65 .49 263 .57 .51 44 .36 .365 .71 .47 146 .93 .27 147 .79 .43 1410 .71 .47 141I ALL .61 .50 2912 ALL .76 .43 42
------------------------------------------
A-20

Table A-Il (Continued)
VAR SCEN TARGET MEAN SD N
PKILL ALL ALL .86 .35 138ALL 1 .91 .29 67ALL 2 .83 .38 54ALL 3 .76 .44 17
FKILL ALL ALL .33 .47 72ALL 1 .37 .49 41ALL 2 .35 .49 23ALL 3 0 0 27 -- .29 .47 148 -- .43 .51 149 -- .31 .48 1610 -- .21 .43 1411 -- .43 .51 14
HKILL ALL ALL .64 .48 154ALL 1 .68 .47 68ALL 2 .64 .48 58ALL 3 .50 .51 263 -- .29 .47 144 -- .86 .36 145 -- .50 .52 146 -- .93 .27 147 -- .71 .47 14
10 -- .64 .50 1411 ALL .54 .51 2812 ALL .67 .48 42
ORD ALL ALL .74 .44 152ALL 1 .54 .50 68ALL 2 .84 .37 58ALL 3 1.0 0 263 -- 1.0 0 14
4 -- 1.0 0 145 -- .71 .47 146 -- .21 .43 147 -- .36 .50 1410 -- .36 .36 1411 ALL .82 .39 2812 ALL .79 .42 42
TRACK ALL ALL .98 .11 87
A-21

-able A-12
Descriptive Statistics: Chaparral RW Summary Performance
--- -------------------------------------------VAR SCEN TARGET MEAN 3D N
--- -------------------------------------------IDCOR ALL ALL .49 .50 379
ALL 1 .61 .49 188ALL 2 .51 .50 122ALL 3 .2-1 .41 39
F:DCOR AL ALL .32 .47 120ALL 1 .38 49 77ALL 2 .24 .44 33ALL 3 .33 .n87-- .52 .51 233 -- .32 .48 229 -- .22 .42 27
-- .09 .29 24ii -- .40 .5i 2
H:DCOR ALL ALL .X8 30 259ALL 1 .78 .43-ALL 2 .62 .49 39ALL 3 .19 .40 363 -- .25 .44 204 -- .71 .46 245 -- .67 .48 246 .71 .46 247 -- .78 .42 2310 -- .37 .34 2411 ALL .50 ..51 4812 ALL .43 .50 72
I ALL ALL .25 .43 '22ALL 1 .30 .46A 2 .2' .42ALL 3 1 a 37 -- .20 .47 233 -- .27 .46 229-- .30 .47 2710 -- .09 .23 24.1 -- .29 .46 24
EENG ALL ALL .43 .53 253
ALL 1 .53 .50 iIALL 2 .48 .50 39ALL 3 .17 .38 363 -- .35 .49 204 -- .46 .51. 245 -- .51 .50 24
S 9 .46 .51 247 -- .5i .53 2310 -- .50 .3 2411 ALL .29 .46 48
2 ALL .39 .49 72--------- ----------------------------------
A-22

Table A-12 (Continued)
VAR SCEN TARGET MEAN SD N
PKILL ALL ALL .56 .50 135ALL 1 .59 .49 79ALL 2 .50 .51 48ALL 3 .50 .55 6
FKILL ALL ALL .07 .25 120ALL 1 .08 .27 77ALL 2 .06 .24 33ALL 3 0 0 37 -- .17 .39 238 -- 0 0 229 -- 0 0 2710 -- 0 0 2411 -- .17 .38 24
HKILL ALL ALL .26 .44 259ALL 1 .37 .48 illALL 2 .25 .43 89ALL 3 .08 .28 363 -- .20 .41 204 -- .29 .46 245 -- .42 .51 246 -- .29 .46 247 -- .39 .50 2310 -- .25 .44 2411 ALL .15 .36 4812 ALL .25 .44 72
ORD ALL ALL .85 .35 259ALL 1 .72 .45 1ilALL 2 .93 .25 89ALL 3 1.0 0 363 -- 1.0 0 204 -- .96 .20 245 -- .58 .50 246 -- .71 .46 247 -- .74 .45 2310 -- .83 .38 2411 ALL 1.0 0 4812 ALL .86 .35 72
TRACK ALL ALL .92 .18 64
A-23

Table A-13
Descriptive Statistics: Vulcan RW summary Performance-------------------------------------------------
VAR SCEN TARGET. MEAN so N i------------------------------------------------
IOCOR ALL. ALL .63 .48 402ALL 1 .66 .48 193ALL 2 .65 .48 162ALL 3 .47 .50 47
-----------------------------------------------
FIDCOR A L ALL .48 .50 120ALL 1 .51 .50 76A L L 2 .42 .50 38ALL 3 .50 .557 -- .12 .34 243 .62 .49 24
.12 .34 24
.33 .38 24
.71 .46 24
-----------------------------------------------H OC Od R ALL ALL .70 .46 282
ALL 1 .75 .43 117ALL. 2 .73 .45 124ALL 3 .47 .40 413 -- .75 44 20
.58 .51 21
5 .48 .31 256 .33 .38 Z4a - .92 .23 249 .79 .41 2410 .33 .38 2411 ALL .62 .49 4812 ALL .63 .48 72
-----------------------------------------------ALL ALL .38 .49ALL 1 .34 .48 76ALL 2 .50 .51 38ALL 3 .17 .41 6
7 -- .67 243 .38 .23 Z49 .54 .51 2413 .17 .38 2411 -16 .51
If 24------------------ ----------------------------
3 VNG A LL .4 L .71 .45 232ALL -- .73 .45ALL .77 .42 1-24ALI" .49 .51 4i3 .80 .41 204 .57 .-Iva 2-1
2,z.50 .50 16 *31 *38 243 1.3 a 24
.79 .41 2413 ALI" .73A. .46 2411 .52 5 vi
ALL 4312 ALL .7-Aw. .46 '12
---------------------------------------------
A-24

Table A-13 (Continued)
I VAR SCEN TARGET MEAN SD N
PKILL* ALL ALL .73(.22) .46(.41) 247(402)ALL 1 .84(.21) .37(.41) 111(193)ALL 2 .63(.24) .48(.43) 115(162)ALL 3 .67(.15) .48(.36) 21(47)
FKILL ALL ALL .21 .41 120ALL 1 .25 .44 76ALL 2 .16 .37 38ALL 3 0 0 67 -- .54 .51 248 -- 0 0 249 -- .38 .49 2410 -- .13 .34 2411 -- 0 0 24
HKILL ALL ALL .55 .50 282ALL 1 .63 .48 117ALL 2 .54 .50 124ALL 3 .34 .48 413 -- .65 .49 204 -- .62 .50 215 -- .48 .51 256 -- .83 .38 248 -- 1.0 0 249 -- .50 .51 2410 -- 0 0 2411 ALL .35 .48 4812 ALL .61 .49 72
ORD ALL ALL .60 .49 282ALL 1 .42 .50 117ALL 2 .66 .48 124ALL 3 .95 .22 413 -- .90 .31 204 -- .48 .51 215 -- .52 .51 256 -- .17 .38 248 -- .04 .20 249 -- .79 .41 2410 -- 1.0 0 2411 ALL .75 .44 4812 ALL .63 .49 72
AVEMISS ALL ALL .45 .66 402ALL 1 .48 .54 193ALL 2 .48 .82 162ALL 3 .24 .45 47
* Represents Pk from MRADES output versus BT-53 Laser(BT-53 considered more accurate)
Note: HKILL & FKILL based on MRADES calculations
A-25

Table A-13 (Continued)
VAR SCEN TARGET MEAN SD N
HITS ALL ALL 7.6 16.0 402ALL 1 7.2 15.2 193ALL 2 8.8 17.3 162ALL 3 5.3 14.3 47
BURSTS ALL ALL 1.2 1.3 403ALL 1 1.3 1.3 193ALL 2 1.3 1.4 163ALL 3 0.7 1.2 47---------------------------------------------------
A-26

APPENDIX B: SUMMARY STATISTICS FOR FALL, 1989 RTS TESTS
B-i

Table B-I
Identification Accuracy
I WEAPON TYPE TARGET MODEL MEAN SD N
STNG FW --- A7 .37 .52 8STNG FW --- A10 .90 .32 10STNG FW --- F16 .72 .46 18STNG FW --- miG27 .97 .17 36STNG FW --- SU17 1.0 0 9STNG FW --- sU25 .82 .40 11CHAP FW --- A7 .67 .58 3CHAP FW A-l 1.0 0 3CHAP FW --- F16 .43 .53 7CHAP FW --- miG27 .85 .38 13CHAP w --- SU17 .67 .58 3CHAP FW --- su25 1.0 0 3
STNG RW 1 AHi .43 .53 7STNG RW 1 AH64 0 0 1STNG RW 2 AH64 .67 .50 9STNG R 3 AH64 .33 .58 3STNG RW 2 CH3 .20 .45 5STNG RW 3 CH3 .40 .55 5STNG RW 2 UHI .75 .45 12STNG RW 3 UH1 .86 .38 7STNG RW 1 m1i8 .88 .33 50.3TNG RW2 Mi8 1.0 0 20STNG RW 3 Ka8 .75 .50 4STNG RW 1 Mi24 .63 .49 38STNG RW 2 Mi24 .59 .50 22STNG RWJ 3 mi24 S83 .41 6STNG R1 mi28 .55 .50 iSTNG RW 2 mi28 .58 .50 38STNG RW 3 Mi28 .32 .48 22
3-2
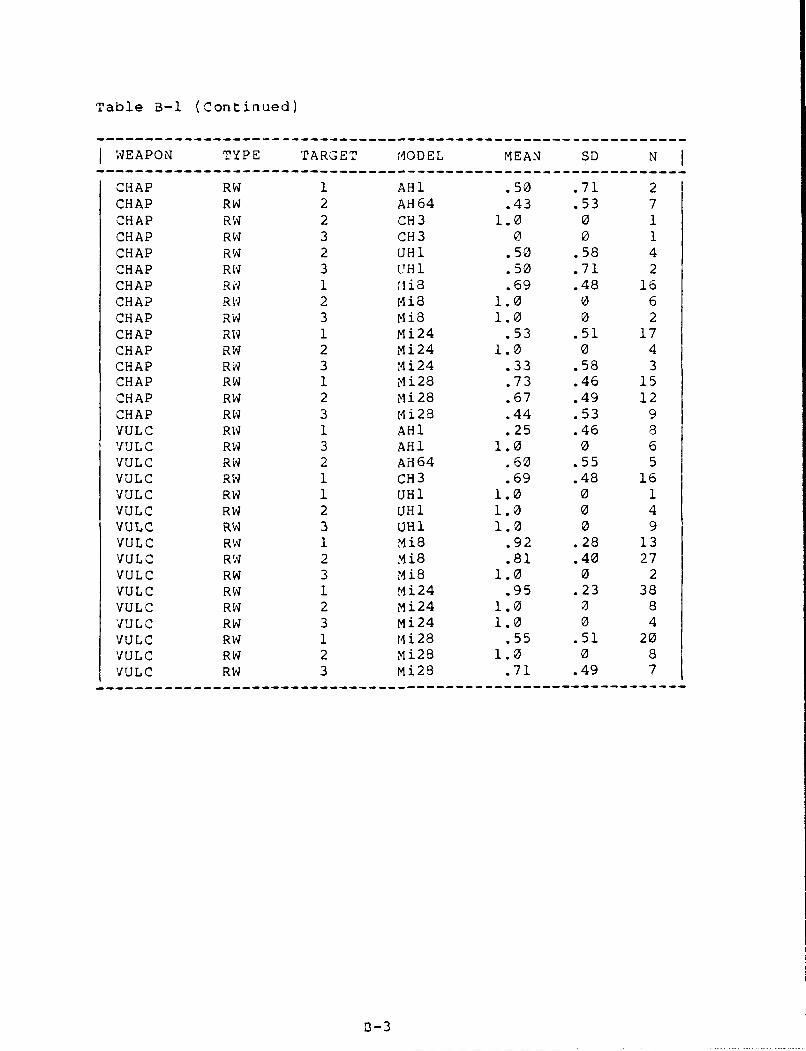
Table B-I (Continued)
I WEAPON TYPE TARGET MODEL MEAN SD N
CHAP RW 1 AHI .50 .71 2CHAP RW 2 AH64 .43 .53 7CHAP RW 2 CH3 1.0 0 1CHAP RW 3 CH3 0 0 1CHAP RW 2 UHI .50 .58 4CHAP RW 3 UH1 .50 .71 2CHAP RW 1 Ai8 .69 .48 16CHAP RW 2 Mi8 1.0 0 6CHAP RW 3 Mi8 1.0 0 2CHAP RW 1 Mi24 .53 .51 17CHAP RW 2 Mi24 1.0 0 4CHAP RW 3 Mi24 .33 .58 3CHAP RW 1 Mi28 .73 .46 15CHAP RW 2 Mi28 .67 .49 12CHAP RW 3 Mi28 .44 .53 9VULC RW 1 AHI .25 .46 8VULC RW 3 AHI 1.0 0 6VULC RW 2 AH64 .60 .55 5VULC RW 1 CH3 .69 .48 16VULC RW 1 UHI 1.0 0 1VULC RW 2 UH1 1.0 0 4VULC RW 3 UHl 1.0 0 9VULC RW 1 Mi8 .92 .28 13VULC RW 2 Mi8 .81 .40 27VULC RW 3 Mi8 1.0 0 2VULC RW 1 Mi24 .95 .23 38VULC RW 2 Mi24 1.0 0 8VULC RW 3 Mi24 1.0 0 4VULC RW 1 Mi28 .55 .51 20VULC RW 2 Mi28 1.0 0 8VULC RW 3 Mi28 .71 .49 7
-----------------------------------------------------------
:3-3

Table B-2
Descriptive Statistics: StingerFW Event Rnges
VAR SCEN MEAN SD N
RDET ALL 9.5 3.8 731 11.2 3.3 182 6.9 3.4 93 10.8 3.8 114 7.3 2.6 85 6.9 2.5 96 13.0 3.5 107 7.2 1.5 8
RIFF ALL 8.5 5.2 731 10.1 4.2 182 8.1 4.1 93 11.0 3.8 114 4.4 6.4 85 6.8 3.0 96 11.3 3.3 107 4.0 7.3 8
,3-4

Table B-2 (Continued)
VAR SCEN MEAN SD N
RID* ALL 3.8(3.4) 2.0(1.4) 55(18)1 3.8(3.3) 2.2(0.9) 10(8)2 2.5(2.3) 0.8(0) 8(1)3 4.8(5.3) 2.3(3.0) 9(2)4 3.8(4.3) 1.6(1.6) 6(2)5 3.3(2.5) 0.9(0.4) 7(2)6 5.5(2.5) 2.5(0.2) 8(2)7 2.9(2.7) 0.9(0) 7(1)
RACQ* ALL 6.3(2.7) 3.0(0.8) 47(4)1 7.4(2.0) 2.6(0) 14(1)2 5.1 3.4 73 7.5 2.4 74 3.6(2.6) 0.8(0.1) 3(2)5 4.1 1.3 66 9.0 3.1 67 3.3(3.8) 0.9(0) 4(1)
RLOCK* ALL 4.1(3.8) 2.0(2.1) 32(18)1 5.9(3.6) 3.2(0.8) 4(3)2 2.7(2.7) 0.8(0.6) 4(5)3 4.1 1.7 94 5.1(4.9) 1.2(0.6) 2(3)5 3.0(2.8) 0.9(1.1) 6(3)6 6.6 0.5 37 3.0(5.1) 0.9(4.1) 4(4)
RFIRE* ALL 4.0(3.6) 1.8(2.1) 22(27)1 6.3(3.7) 3.2(1.1) 3(4)2 2.6(2.9) 0.8(0.8) 3(6)3 4.2(2.3) 1.2(0.5) 6(3)4 4.8(5.4) 1.0(0.4) 2(3)5 2.8 0.7 36 5.2(2.8) 1.1(1.1) 2(6)7 2.6(5.1) 1.0(4.1) 3(5)
Represents aircraft ranges which were eitheringressing or egressing
B-5

Table B-3
Descriptive Statistics: ChaparralFW Event Ranges
VAR SCEN MEAN SD N
RDET ALL 8.3 3.0 271 9.2 3.3 72 6.6 2.5 43 8.0 2.9 34 10.1 0.4 45 3.5 0.9 36 10.2 0.8 37 8.9 3.7 3
RIFF ALL 5.2 4.0 261 6.8 3.1 72 1.2 7.2 33 6.7 1.9 34 6.0 2.1 45 2.5 1.2 36 8.6 1.6 37 4.5 1.5 3
RID* ALL 4.4(1.9) 2.4(0.6) 23(2)1 4.7 3.2 72 4.7(1.4) 2.0(0) 3(1)3 2.5 0.4 34 6.0 2.2 35 1.8(2.3) 0.4(0) 2(1)6 4.9 2.2 37 4.7 1.0 2
RACQ ALL 2.9 0.8 111 2.2 0.5 22 2.4 0.7 23 3.2 0.5 34 4.6 0 15 2.4 0.5 27 3.3 0 1
RFIRE* ALL 3.7(2.1) 2.2(0.9) 15(3)
1 5.0 2.9 42 3.5(1.4) 1.1(0) 3(1)3 2.2(1.8) 0.3(0) 2(1)4 5.4 4.2 25 1.7(3.1) 0(0) 1(1)7 3.0 0.8 3
Represents aircraft ranges which were either
ingressing or egressing
B-6
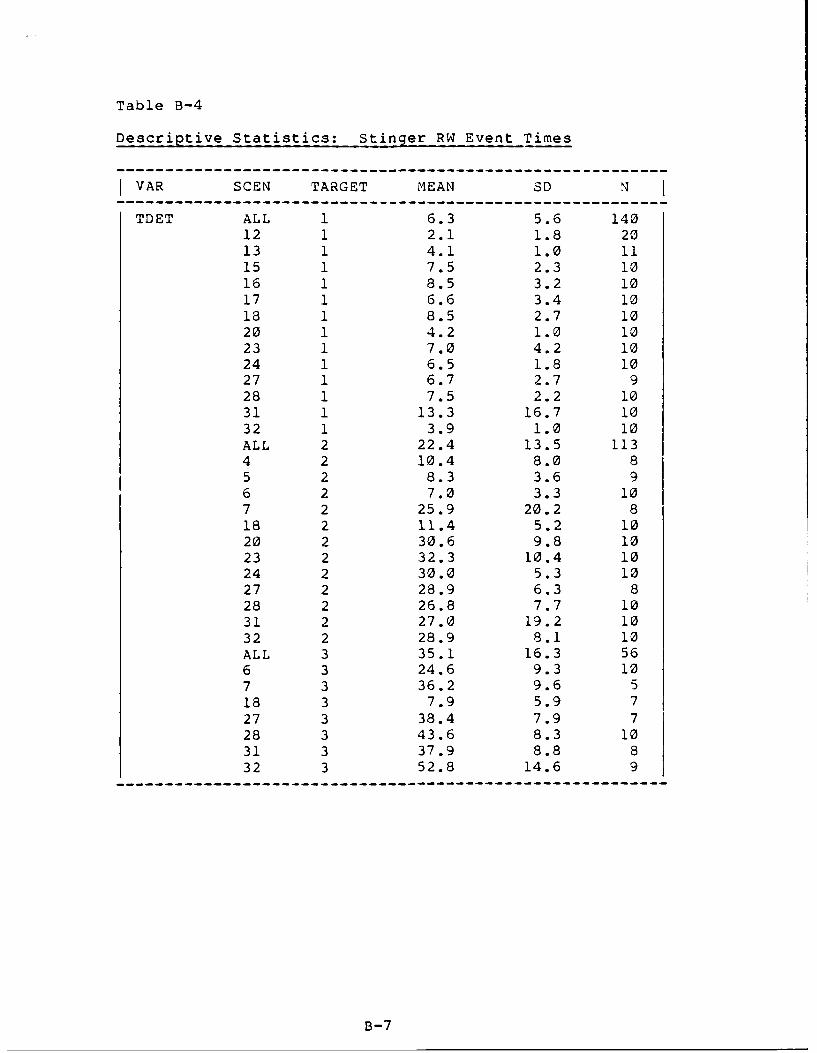
Table B-4
Descriptive Statistics: Stinger RW Event Times
I VAR SCEN TARGET MEAN SD N
TDET ALL 1 6.3 5.6 14012 1 2.1 1.8 2013 1 4.1 1.0 1115 1 7.5 2.3 1016 1 8.5 3.2 1017 1 6.6 3.4 1018 1 8.5 2.7 1020 1 4.2 1.0 1023 1 7.0 4.2 1024 1 6.5 1.8 1027 1 6.7 2.7 928 1 7.5 2.2 1031 1 13.3 16.7 1032 1 3.9 1.0 10ALL 2 22.4 13.5 1134 2 10.4 8.0 85 2 8.3 3.6 96 2 7.0 3.3 107 2 25.9 20.2 818 2 11.4 5.2 1020 2 30.6 9.8 1023 2 32.3 10.4 1024 2 30.0 5.3 1027 2 28.9 6.3 828 2 26.8 7.7 1031 2 27.0 19.2 1032 2 28.9 8.1 10ALL 3 35.1 16.3 566 3 24.6 9.3 107 3 36.2 9.6 518 3 7.9 5.9 727 3 38.4 7.9 728 3 43.6 8.3 1031 3 37.9 8.8 832 3 52.8 14.6 9
B-7
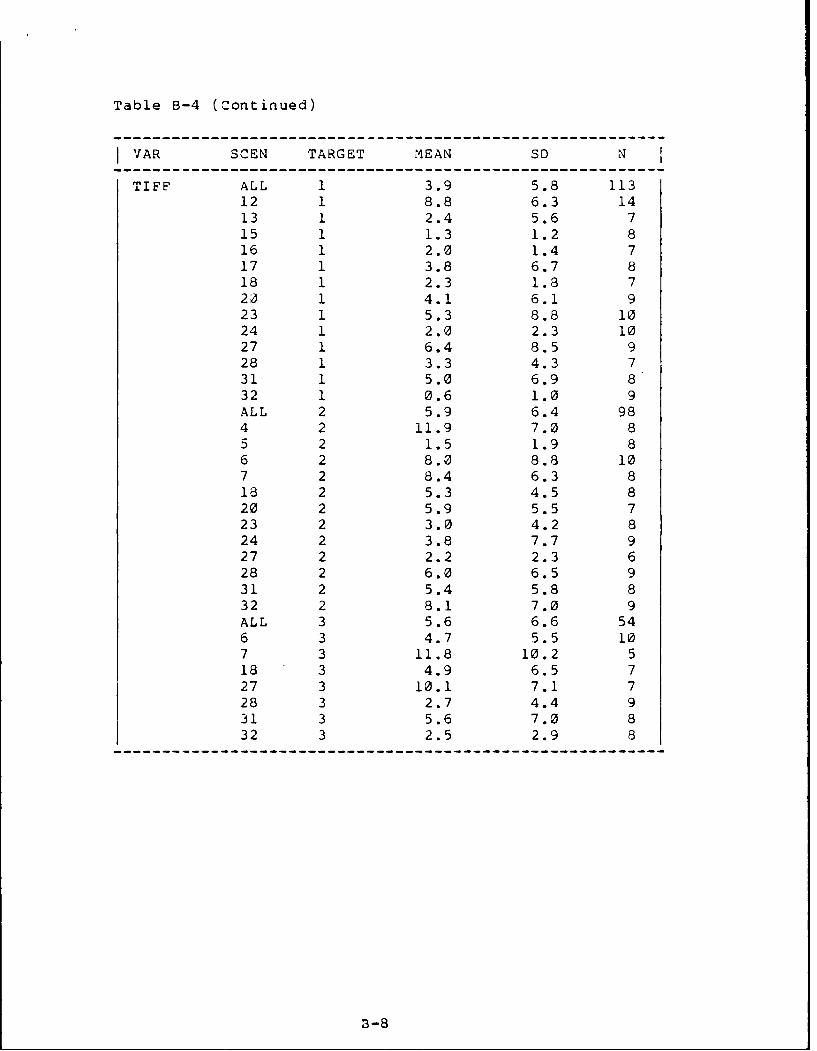
Table B-4 (Continued)
I VAR SCEN TARGET rMEAN SD N
TIFF ALL 1 3.9 5.8 11312 1 8.8 6.3 1413 1 2.4 5.6 715 1 1.3 1.2 816 1 2.0 1.4 717 1 3.8 6.7 818 1 2.3 1.8 720 1 4.1 6.1 923 1 5.3 8.8 1024 1 2.0 2.3 1027 1 6.4 8.5 928 1 3.3 4.3 731 1 5.0 6.9 832 1 0.6 1.0 9ALL 2 5.9 6.4 984 2 11.9 7.0 85 2 1.5 1.9 86 2 8.0 8.8 107 2 8.4 6.3 818 2 5.3 4.5 820 2 5.9 5.5 723 2 3.0 4.2 824 2 3.8 7.7 927 2 2.2 2.3 628 2 6.0 6.5 931 2 5.4 5.8 832 2 8.1 7.0 9ALL 3 5.6 6.6 546 3 4.7 5.5 107 3 11.8 10.2 518 3 4.9 6.5 727 3 10.1 7.1 728 3 2.7 4.4 931 3 5.6 7.0 832 3 2.5 2.9 8
3-8

Table 3-4 (Continued)
I VAR SCEN TARGET MEAN SD N
TID ALL 1 11.0 8.3 13612 1 5.3 2.8 2013 1 7.4 3.3 1015 1 13.0 4.0 1016 1 9.4 4.9 917 1 14.8 5.0 1018 1 10.6 3.4 920 1 10.4 4.9 1023 1 11.8 6.3 1024 1 8.4 4.0 1027 1 9.9 5.5 928 1 14.4 14.9 931 1 19.1 18.6 1032 1 14.8 7.7 10ALL 2 8.1 4.8 1064 2 5.6 2.4 85 2 6.9 2.6 96 2 7.3 7.7 107 2 7.3 3.0 718 2 7.0 4.2 920 2 9.7 3.6 1023 2 8.5 5.9 824 2 11.5 5.4 827 2 7.0 5.5 828 2 8.2 4.3 1031 2 7.6 3.0 932 2 10.3 6.0 10ALL 3 8.2 4.5 476 3 6.1 3.3 97 3 10.4 6.7 518 3 6.6 2.4 727 3 10.7 6.2 628 3 7.1 4.9 931 3 9.4 3.7 732 3 9.5 1.7 4
3-9

Table B-4 (Continued)
V VAR SCEN TARGET MEAN SD N
TACQ ALL 1 6.6 6.5 9012 1 4.3 2.3 813 1 7.3 5.5 715 1 5.9 5.1 1016 1 5.3 2.1 817 1 6.2 3.4 618 1 7.3 4.5 920 1 5.2 2.7 623 1 3.4 2.1 524 1 8.6 4.5 527 1 9.5 7.2 628 1 6.0 4.9 631 1 12.5 19.9 632 1 5.8 4.3 8ALL 2 5.1 3.6 504 2 2.6 1.3 55 2 6.5 2.1 26 2 6.3 4.6 47 2 4.5 1.7 418 2 8.8 6.0 520 2 4.8 3.9 623 2 3.0 2.2 424 2 6.8 2.5 428 2 5.0 2.0 331 2 5.6 4.1 732 2 3.7 2.8 6ALL 3 4.9 2.4 226 3 4.7 2.9 37 3 8.0 2.8 218 3 4.0 0 127 3 3.5 1.9 428 3 6.0 4.4 331 3 4.0 1.4 432 3 5.2 1.1 5
3-10

Table B-4 (Continued)
I VAR SCEN TARGET MEAN SD N
THAND ALL 1 5.2 5.3 9012 1 4.2 3.3 1813 1 7.4 6.6 715 1 5.0 3.8 516 1 3.0 2.8 817 1 2.0 0.8 418 1 1.8 1.3 420 1 6.2 6.1 523 1 8.3 4.0 424 1 6.4 4.7 1027 1 9.8 11.0 828 1 3.3 3.9 631 1 6.0 4.6 532 1 2.8 2.1 6ALL 2 4.8 4.1 584 2 4.0 2.9 75 2 3.2 3.9 66 2 8.3 6.5 97 2 3.3 1.3 418 2 2.3 2.5 620 2 6.5 3.5 223 2 5.6 3.6 524 2 5.0 1.0 327 2 2.0 0 128 2 4.0 4.2 631 2 5.8 4.0 532 2 4.8 2.5 4ALL 3 5.6 4.6 196 3 4.0 2.1 67 3 6.5 3.5 218 3 2.0 0 127 3 3.0 0 128 3 7.8 8.3 431 3 5.0 1.7 332 3 9.0 7.1 2
3-11
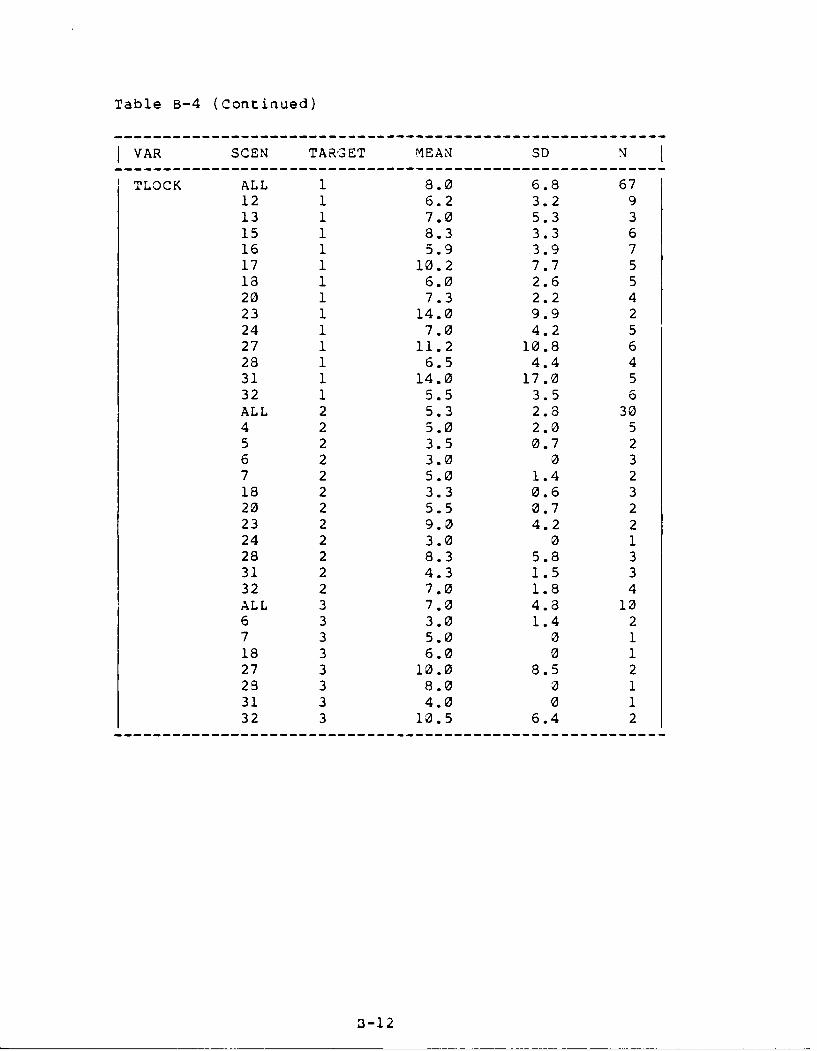
Table B-4 (Continued)
VAR SCEN TARGET MEAN SD N
TLOCK ALL 1 8.0 6.8 6712 1 6.2 3.2 913 1 7.0 5.3 315 1 8.3 3.3 616 1 5.9 3.9 717 1 10.2 7.7 513 1 6.0 2.6 520 1 7.3 2.2 423 1 14.0 9.9 224 1 7.0 4.2 527 1 11.2 10.8 628 1 6.5 4.4 431 1 14.0 17.0 532 1 5.5 3.5 6ALL 2 5.3 2.8 304 2 5.0 2.0 55 2 3.5 0.7 26 2 3.0 0 37 2 5.0 1.4 218 2 3.3 0.6 320 2 5.5 0.7 223 2 9.0 4.2 224 2 3.0 0 128 2 8.3 5.8 331 2 4.3 1.5 332 2 7.0 1.8 4ALL 3 7.0 4.8 106 3 3.0 1.4 27 3 5.0 0 118 3 6.0 0 127 3 10.0 8.5 22B 3 8.0 0 131 3 4.0 0 132 3 10.5 6.4 2
3-12

Table B-4 (Continued)
V VAR SCEN TARGET MEAN SD I
TFIRE ALL 1 9.2 5.0 6012 1 8.8 3.5 913 1 8.8 4.3 415 1 9.2 2.2 516 1 8.0 3.6 717 1 8.0 1.7 318 1 7.3 1.9 420 1 8.7 1.5 323 1 17.5 10.6 224 1 9.2 4.4 527 1 13.4 12.0 528 1 9.0 4.8 431 1 9.0 4.6 332 1 7.8 2.9 6ALL 2 7.6 2.5 284 2 7.4 3.0 55 2 5.0 0 26 2 5.3 1.2 37 2 7.5 0.7 218 2 6.0 1.0 320 2 9.0 0 223 2 11.5 3.5 228 2 8.0 1.4 231 2 7.0 1.0 332 2 10.0 2.4 4ALL 3 8.2 4.1 96 3 5.0 1.4 27 3 8.0 0 118 3 8.0 0 127 3 6.0 0 128 3 10.0 0 131 3 6.0 0 132 3 13.0 7.1 2
B-13

Table B-4 (Continued)
I VAR SCEN TARGET MEAN SD N
TTOT ALL 1 14.5 8.1 9212 1 8.8 4.2 1913 1 14.7 6.3 715 1 17.8 4.4 516 1 13.3 3.6 817 1 17.0 3.2 418 1 12.0 2.4 420 1 15.0 6.1 523 1 18.0 5.4 424 1 14.8 4.9 1027 1 19.1 15.3 828 1 19.6 16.7 731 1 15.6 5.1 532 1 14.5 5.6ALL 2 11.8 5.8 604 2 8.3 3.7 35 2 10.8 3.5 66 2 15.8 11.2 97 2 10.0 2.2 418 2 8.6 3.6 720 2 16.0 7.1 223 2 12.0 5.1 524 2 14.0 3.0 327 2 12.0 0 128 2 12.5 3.7 631 2 12.0 5.0 532 2 12.8 1.5 4ALL 3 11.9 5.0 216 3 10.4 2.3 77 3 11.7 6.8 318 3 12.0 0 127 3 9.0 0 128 3 12.0 6.6 431 3 12.0 5.2 332 3 18.5 9.2 2
3-14

Table B-5
Descriptive Statistics: Chaparral RW Event Times
IVAR SCEN TARGET MEAN SD N
TDET ALL 1 6.3 4.3 5212 1 2.6 1.5 813 1 3.0 1.6 415 1 12.3 6.1 316 1 6.5 2.9 417 1 6.0 2.2 418 1 11.8 6.2 420 3.0 0.8 423 1 6.7 1.2 324 1 6.0 2.8 227 1 9.3 5.1 428 1 8.5 2.1 431 1 8.5 3.7 432 1 3.3 0.5 4ALL 2 26.5 13.5 424 2 9.3 5.7 45 2 7.7 4.0 36 2 19.3 20.0 37 2 15.5 5.4 418 2 23.3 11.4 420 2 36.0 7.4 423 2 42.3 9.6 324 2 34.0 0 127 2 33.3 7.0 428 2 37.8 12.3 431 2 31.8 5.6 432 2 30.5 3.7 4ALL 3 41.9 16.6 186 3 33.7 17.6 37 3 31.0 2.8 218 3 20.0 7.i 227 3 45.0 15.7 328 3 42.5 3.6 231 3 48.0 11.3 232 3 59.0 15.3 4
3-15

Table B-5 (Continued)
VAR SCEN TARGET MEAN SD N------------------------------------------------------
TIFF ALL 1 4.7 3.1 4012 1 4.3 2.9 313 1 1.0 1.4 215 1 2.0 0 216 1 4.3 2.1 417 1 7.0 4.2 218 1 5.3 5.2 420 1 5.0 1.7 323 1 7.0 4.4 324 1 8.0 4.2 227 1 4.3 1.7 428 1 5.0 2.9 431 1 4.3 3.5 332 1 3.5 3.0 4ALL 2 6.5 8.9 214 2 3.0 0 25 2 5.0 5.7 26 2 0 0 27 2 37.0 0 118 2 4.0 0 120 2 10.0 5.7 223 2 4.5 3.5 224 2 18.0 0 127 2 3.0 0 128 2 4.5 8.3 431 2 3.5 4.9 232 2 5.0 0 1ALL 3 5.3 4.9 87 3 0.5 0.7 218 3 5.5 3.5 228 3 8.0 0 131 3 2.0 0 132 3 10.0 7.1 2
3-16

Table B-5 (Continued)
I VAR SCEN TARGET MEAN SD IN
TID ALL 1 9.8 4.7 5112 1 5.5 3.0 813 1 6.8 3.9 415 1 8.7 1.6 316 1 13.0 6.1 417 1 10.8 5.0 418 1 12.3 2.9 320 1 7.5 2.4 423 1 15.7 7.1 324 1 10.5 6.4 227 1 8.5 4.4 428 1 14.0 2.8 431 1 11.5 3.3 432 1 9.3 4.5 4ALL 2 6.8 5.7 344 2 4.0 2.0 35 2 9.3 7.8 36 2 3.0 1.7 37 2 7.8 10.3 418 2 8.0 5.7 220 2 6.5 5.7 423 2 7.0 0 124 2 11.0 0 127 2 5.3 5.8 328 2 9.0 9.6 331 2 8.3 5.0 432 2 5.3 3.1 3ALL 3 5.8 5.0 176 3 6.3 5.0 37 3 6.0 1.4 218 3 8.5 7.8 227 3 1.7 1.2 328 3 9.5 12.0 231 3 4.5 2.1 232 3 6.0 4.4 3
------------------------------------------------------
B-i17

Table B-5 (Continued)
IVAR SCEN TARGET MEAN SD N
TACQ ALL 1 5.1 3.3 2212 1 3.5 3.5 213 1 2.0 0 115 1 2.5 0.7 216 1 4.5 3.5 217 1 13.0 0 118 1 5.0 0 120 1 5.0 1.7 323 1 10.0 0 127 1 8.0 0 128 1 6.3 2.4 431 1 1.0 0 132 1 4.0 3.5 3ALL 2 9.7 11.9 94 2 3.0 0 25 2 5.0 5.7 26 2 1.0 0 17 2 37.0 0 118 2 4.0 0 128 2 14.5 7.8 2ALL 3 28.0 28.3 218 3 8.0 0 132 3 48.0 0 1
3-18

Table B-5 (Continued)
---------------------------------------------------------VAR SCEN TARGET MEAN SD N
-----------------------------------------------------THAND ALL 1 5.6 5.2 23
12 1 3.2 1.8 513 1 4.5 3.5 215 1 6.0 0 116 1 3.0 4.2 217 1 13.0 0 118 1 3.0 0 120 1 12.0 15.6 224 1 11.0 0 227 1 4.3 3.5 328 1 7.0 0 131 1 2.0 0 132 1 3.5 0.7 2ALL 2 3.3 2.7 174 2 2.3 1.5 35 2 1.0 0 16 2 2.0 1.4 27 2 5.0 5.7 218 2 2.5 0.7 220 2 5.0 0 127 2 5.0 0 128 2 8.0 0 131 2 3.0 3.6 332 2 2.0 0 1ALL 3 7.8 6.1 418 3 5.0 0 128 3 10.0 0 131 3 1.0 0 132 3 15.0 0 1
TFIRE ALL 1 9.4 4.2 1512 1 7.5 1.3 413 1 9.0 3.6 315 1 13.0 0 116 1 12.0 9.9 217 1 7.0 0 118 1 7.0 0 120 1 6.0 0 128 1 17.0 0 132 1 10.0 0 1ALL 2 3.0 2.1 64 2 3.0 2.8 25 2 3.0 0 16 2 6.0 0 118 2 2.0 0 128 2 1.0 0 118 3 11.0 0 1
3-19

Table B-5 (Continued)
VAR SCEN TARGET MEAN SD N
TTOT ALL 1 13.5 7.2 2512 1 9.0 2.3 513 1 8.3 6.4 315 1 16.0 0 116 1 16.5 13.4 217 1 14.5 7.8 218 1 12.0 0 120 1 21.0 12.7 224 1 21.5 6.4 227 1 11.0 6.1 328 1 25.0 0 131 1 14.0 0 132 1 10.0 2.8 2ALL 2 8.4 4.7 184 2 6.3 2.1 35 2 4.0 0 16 2 4.5 3.5 27 2 8.5 7.8 218 2 10.5 6.4 220 2 13.0 0 127 2 11.0 8.5 228 2 10.0 0 131 2 9.7 5.8 332 2 8.0 0 1ALL 3 12.5 6.6 418 3 19.0 0 128 3 11.0 0 131 3 4.0 0 132 3 16.0 0 1
3-20

Table B-6
Descriptive Statistics: Vulcan RW Event Times
I VAR SCEN TARGET MEAN SD N
TDET ALL 1 6.5 2.8 959 1 4.1 1.2 810 1 4.1 0.6 811 1 5.0 2.7 812 1 7.9 1.6 813 1 5.6 2.8 814 1 10.0 2.1 818 1 10.6 1.5 819 1 5.9 2.6 821 1 5.8 1.7 422 1 5.8 1.0 625 1 7.0 1.5 626 1 5.8 1.5 629 1 6.5 3.3 630 1 6.0 3.6 4ALL 2 23.0 9.4 526 2 11.0 0 118 2 11.4 6.0 719 2 23.0 2.9 421 2 25.7 8.0 722 2 22.4 6.1 525 2 33.0 7.1 526 2 23.5 8.2 829 2 25.7 9.6 730 2 25.4 12.1 8ALL 3 37.0 14.4 286 3 26.0 0 118 3 13.3 5.3 425 3 49.2 11.3 626 3 42.2 12.6 529 3 40.0 9.0 630 3 35.0 8.2 6
-----------------------------------------------------
B-21

Table B-6 (Continued)
I VAR SCEN TARGET MEAN SD N
TID ALL 1 6.7 6.4 949 1 9.4 6.0 810 1 5.0 4.8 811 1 6.9 4.2 812 1 4.0 2.0 813 1 4.3 2.6 814 1 14.8 13.4 818 1 9.9 7.2 819 1 5.6 4.0 821 1 4.5 3.9 422 1 4.7 4.2 625 1 5.5 1.3 426 1 6.8 7.6 629 1 5.3 4.8 630 1 3.0 2.4 4ALL 2 2.9 2.9 426 2 1.0 0 118 2 1.8 1.3 519 2 4.0 4.8 421 2 4.3 2.8 622 2 1.0 0 225 2 3.8 3.8 526 2 1.9 1.6 729 2 3.0 3.9 530 2 2.7 3.0 7ALL 3 3.2 2.9 276 3 1.0 0 118 3 4.0 1.4 425 3 3.8 3.8 626 3 3.8 2.8 529 3 1.0 0 630 3 4.2 4.1 5
3-22

Table B-6 (Continued)
--- ----------------------------------------------------VAR SCEN TARGET MEAN SD N
----------- -------- -----------------THAND ALL 1 3.8 4.4 62
9 1 4.0 2.0 310 1 5.0 6.4 711 1 1.5 0.7 212 1 3.3 2.7 613 1 3.7 2.5 314 1 2.0 0 118 1 5.8 7.4 619 1 2.5 1.6 621 1 3.7 2.3 322 1 3.0 1.4 525 1 2.8 1.5 526 1 3.7 5.6 629 1 6.0 8.7 530 1 2.0 1.4 4ALL 2 3.0 3.2 346 2 2.0 0 118 2 4.3 2.3 321 2 1.9 0.9 722 2 3.4 1.9 525 2 2.0 2.8 226 2 5.0 7.9 529 2 2.7 1.4 630 2 2.2 1.1 5ALL 3 5.7 5.7 106 3 1.0 0 129 3 5.6 5.9 530 3 7.0 6.5 4
TFIRE ALL 1 1.5 2.1 149 1 1.0 0 110 1 1.0 1.4 211 1 7.0 0 112 1 0 0 114 1 0 0 118 1 0 0 219 1 3.0 2.8 221 1 1.0 0 125 1 1.0 0 126 1 0.5 0.7 230 1 2.0 0 1ALL 2 1.5 1.7 86 2 0 0 118 2 1.0 0 121 2 1.0 0 226 2 0 0 129 2 3.0 2.8 230 2 3.0 0 129 3 2.0 2.8 2
3-23

Table B-6 (Continued)
I VAR SCEN TARGET MEAN SD N
TTOT ALL 1 8.8 7.3 719 1 7.8 4.9 410 1 10.3 6.9 711 1 8.0 5.7 212 1 6.0 4.0 713 1 6.0 3.6 314 1 24.3 17.8 318 1 12.0 9.7 719 1 7.3 3.4 821 1 6.5 6.5 422 1 6.2 2.6 525 1 5.3 3.4 626 1 10.5 7.6 629 1 12.0 8.5 530 1 5.0 1.6 4ALL 2 5.1 3.6 346 2 3.0 0 118 2 4.3 2.5 421 2 5.6 2.7 722 2 3.8 1.6 525 2 7.5 3.5 226 2 8.3 7.9 429 2 5.0 3.5 630 2 3.6 2.1 5ALL 3 7.0 6.0 106 3 2.0 0 129 3 6.6 5.9 530 3 8.8 6.8 4
8-24

Table B-7
Descriptive Statistics: Stinger FW Summary Performance
IVAR SCEN MEAN SD N I
IDCOR ALL .82 .39 73
FIDCOR ALL .69 .47 361 .72 .46 184 .37 .52 86 .90 .32 10
HIDCOR ALL .95 .23 372 1.0 0 93 .82 .40 115 1.0 0 97 1.0 0 8
FENG ALL .18 .39 381 .18 .37 194 .22 .44 96 .20 .42 10
HENG ALL .39 .50 382 .33 .50 93 .55 .52 115 .30 .48 107 .38 .52 8
PKILL ALL .86 .35 22
FKILL ALL .16 .37 381 .11 .32 194 .22 .44 96 .20 .42 10
----- -------------------------------HKILL ALL .34 .48 38
2 .22 .44 93 .55 .52 115 .30 .48 107 .25 .46 8
ORD ALL .34 .48 382 .44 .53 93 .27 .47 115 .40 .52 107 .25 .46 8--------------------------------
13-25

Table B-8
Descriptive Statistics: Chaparral FW Summary Performance
IVAR SCEN MEAN SD N I
IDCOR ALL .76 .44 25
FIDCOR ALL .62 .51 131 .43 .53 74 .67 .58 36 1.0 0 3
HIDCOR ALL .92 .29 122 1.0 0 43 1.0 0 35 .67 .58 37 1.0 0 2
FENG ALL .43 .51 141 .57 .53 74 .50 .58 46 0 0 3
HENG ALL .64 .50 14
2 .75 .50 4
3 .67 .58 35 .33 .58 37 .75 .50 4
PKILL ALL .87 .35 15
FKILL ALL .29 .47 141 .43 .53 74 .25 .50 46 0 0 3
HKILL ALL .64 .50 142 .75 .50 43 .67 .58 35 .33 .58 37 .75 .50 4
ORD ALL .71 .47 142 .50 .58 43 1.0 0 35 1.0 0 37 .50 .58 4
B-26

Table B-9
DescriptiveStatistics: Stinger RW Summary Performance
I VAR SCEN TARGET MEAN SD N
IDCOR ALL ALL .65 .48 2.89ALL 1 .68 .47 136ALL 2 .67 .47 106ALL 3 .51 .51 47
FIDCOR ALL ALL .57 .50 49ALL 1 .37 .52 8ALL 2 .62 .50 26ALL 3 .60 .51 157 --- .40 .55 518 ALL .69 .48 1620 --- .70 .48 1027 --- .62 .52 828 --- .30 .48 10
HIDCOR ALL ALL .67 .47 240ALL 1 .70 .46 128ALL 2 .69 .47 80ALL 3 .47 .51 324 --- 1.0 0 85 --- .67 .50 96 ALL .79 .42 197 --- .57 .53 712 --- .95 .22 2013 --- .60 .52 1015 --- .50 .53 1016 --- 1.0 0 917 .50 .53 1013 --- 1.0 0 920 --- .50 .53 1023 ALL .56 .51 1824 ALL .78 .43 1827 ALL .47 .52 1528 ALL .50 .51 1831 ALL .54 .51 2632 ALL .62 .49 24
FENG ALL ALL .35 . •8 57ALL 1 .44 .53 9ALL 2 .33 .48 27ALL 3 .33 .48 217 --- .50 .53 818 ALL .20 .41 2020 --- .20 .42 1027 .33 .50 928 .70 .48 10
B-27

Table B-9 (Continued)
IVAR SCEN TARGET MEAN SD N
HENS ALL ALL .58 .49 266ALL 1 .67 .47 131ALL 2 .60 .49 86ALL 3 .31 .47 494 --- .89 .33 95 .60 .52 106 ALL .80 .41 207 --- .50 .53 812 --- .95 .22 2013 .64 .50 1115 --- .50 .53 1016 .80 .42 1017 --- .40 .52 1018 --- .90 .32 1020 --- .50 .53 1023 ALL .45 .51 2024 ALL .65 .50 2027 ALL .39 .50 1828 ALL .50 .51 2031 ALL .43 .50 3032 ALL .40 .50 30
PKILL ALL ALL .99 .08 175ALL 1 .99 .10 92ALL 2 1.0 0 61ALL 3 1.0 0 22
FKILL ALL ALL .35 .48 57ALL 1 .44 .53 9ALL 2 .33 .48 27ALL 3 .33 .48 217 --- .50 .53 818 ALL .20 .41 2020 --- .20 .42 1027 --- .33 .50 928 .70 .48 10
3-28
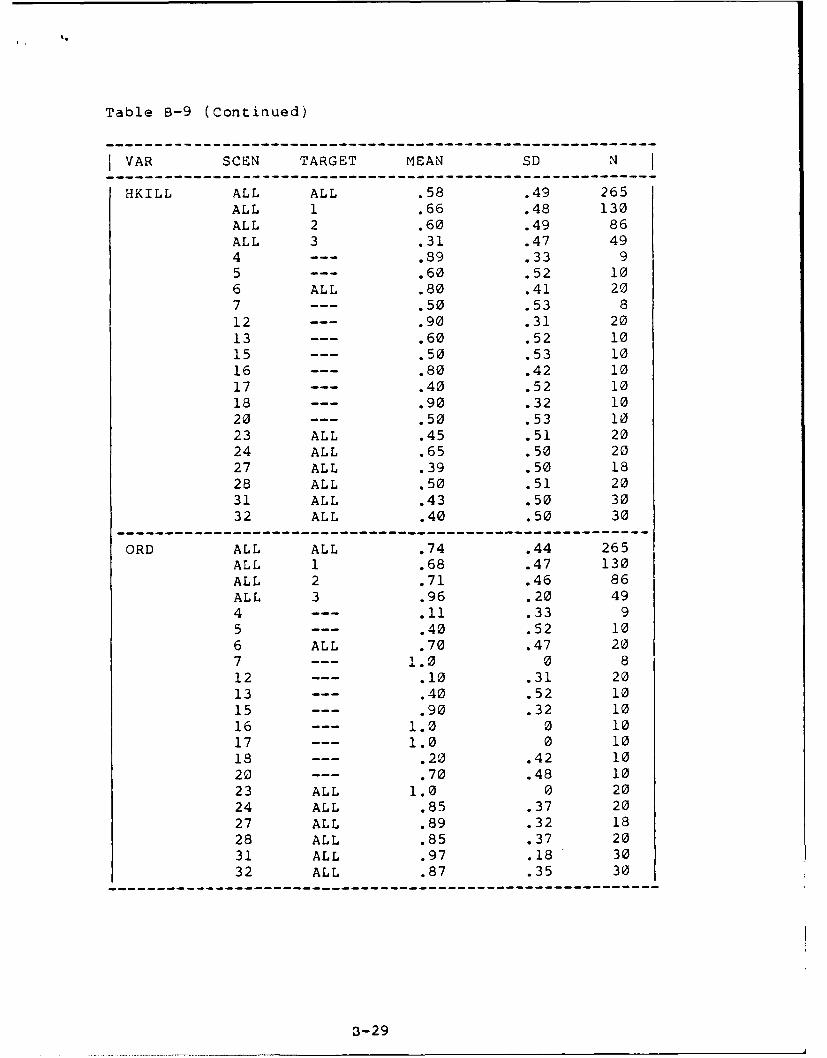
Table B-9 (Continued)
VAR SCEN TARGET MEAN SD N
HKILL ALL ALL .58 .49 265ALL 1 .66 .48 130ALL 2 .60 .49 86ALL 3 .31 .47 494 --- .89 .33 95 --- .60 .52 106 ALL .80 .41 207 .50 .53 812 .90 .31 2013 --- .60 .52 1015 --- .50 .53 1016 --- .80 .42 1017 --- .40 .52 1018 .90 .32 1020 --- .50 .53 1023 ALL .45 .51 2024 ALL .65 .50 2027 ALL .39 .50 1828 ALL .50 .51 2031 ALL .43 .50 3032 ALL .40 .50 30
ORD ALL ALL .74 .44 265ALL 1 .68 .47 130ALL 2 .71 .46 86ALL 3 .96 .20 494 --- .11 .33 95 --- .40 .52 106 ALL .70 .47 207 --- 1.0 812 --- .10 .31 2013 .40 .52 1015 --- .90 .32 1016 --- 1.0 0 1017 --- 1.0 0 1018 .20 .42 1020 .70 .48 1023 ALL 1.0 0 2024 ALL .85 .37 2027 ALL .89 .32 1828 ALL .85 .37 2031 ALL .97 .18 3032 ALL .87 .35 30
-----------------------------------------------------
3-29
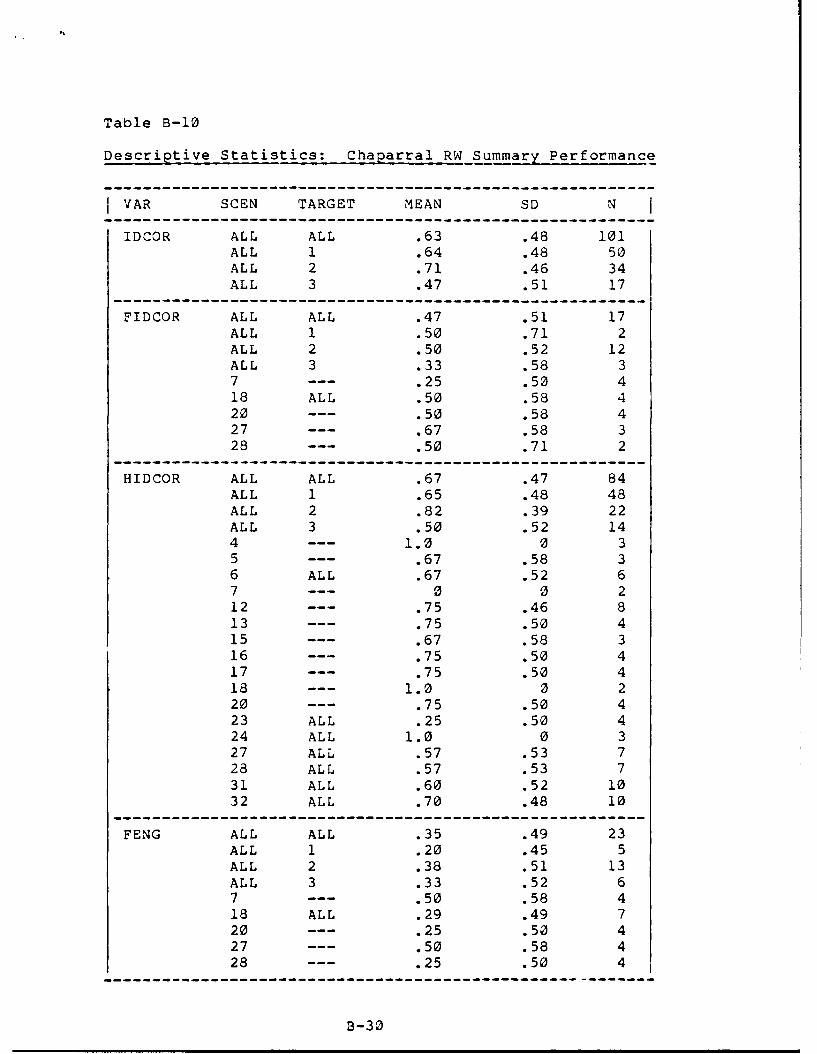
Table B-10
Descriptive Statistics: Chaparral RW SummaryPerformance--
VAR SCEN TARGET MEAN SD N
IDCOR ALL ALL .63 .48 101ALL 1 .64 .48 50ALL 2 .71 .46 34ALL 3 .47 .51 17
FIDCOR ALL ALL .47 .51 17ALL 1 .50 .71 2ALL 2 .50 .52 12ALL 3 .33 .58 37 --- .25 .50 418 ALL .50 .58 420 --- .50 .58 427 --- .67 .58 323 .50 .71 2
HIDCOR ALL ALL .67 .47 84ALL 1 .65 .48 48ALL 2 .82 .39 22ALL 3 .50 .52 144 --- 1.0 0 35 --- .67 .58 36 ALL .67 .52 67 0 0 212 .75 .46 813 --- .75 .50 415 --- .67 .58 316 .75 .50 417 --- .75 .50 418 1.0 0 220 --- .75 .50 423 ALL .25 .50 424 ALL 1.0 0 327 ALL .57 .53 723 ALL .57 .53 731 ALL .60 .52 1032 ALL .70 .48 10
FENG ALL ALL .35 .49 23ALL 1 .20 .45 5ALL 2 .38 .51 13ALL 3 .33 .52 67 --- .50 .58 418 ALL .29 .49 720 .25 .50 427 --- .50 .58 428 --- .25 .50 4
B-30

Table B-10 (Continued)
I VAR SCEN TARGET MEAN SD N
HENG ALL ALL .41 .49 97ALL 1 .50 .51 48ALL 2 .45 .51 29ALL 3 .15 .37 204 --- .75 .50 45 --- .33 .58 36 ALL .33 .52 67 --- 0 0 412 .63 .52 813 .75 .5o 415 .33 .58 316 --- .50 .58 417 --- .50 .58 418 .50 .58 420 .50 .58 423 ALL 0 0 624 ALL .50 .58 427 ALL .50 .53 828 ALL .25 .46 831 ALL .45 .52 1132 ALL .33 .49 12
PKILL ALL ALL 1.0 0 48
FKILL ALL ALL .35 .49 23ALL 1 .25 .50 4ALL 2 .38 .51 13ALL 3 .33 .52 67 --- .50 .58 418 ALL .29 .49 720 --- .25 .50 427 --- .50 .58 428 --- .25 .50 4
B-31

Table B-10 (Continued)
I VAR SCEN TARGET MEAN SD N
HKILL ALL ALL .41 .49 97ALL 1 .50 .51 48ALL 2 .45 .51 29ALL 3 .15 .37 204 --- .75 .50 45 .33 .58 36 ALL .33 .52 67 --- 0 0 412 .63 .52 813 --- .75 .50 415 --- .33 .58 316 --- .50 .58 417 --- .5o .58 418 --- .50 .58 420 .50 .58 423 ALL 0 0 624 ALL .50 .58 427 ALL .50 .53 828 ALL .25 .46 831 ALL .45 .52 1132 ALL .33 .49 12
ORD ALL ALL .79 .49 97ALL 1 .67 .48 48ALL 2 .83 .38 29ALL 3 1.0 0 204 --- .25 .50 45 --- .67 .58 36 ALL .83 .41 67 --- 1.0 0 412 --- .38 .52 813 --- .25 .50 415 --- 1.0 0 316 .75 .50 417 1.0 0 418 1.0 0 420 --- .75 .50 423 ALL 1.0 0 624 ALL .75 .50 427 ALL .63 .52 828 ALL 1.0 0 831 ALL 1.0 0 1132 ALL .83 .39 12
3-32

Table B-lI
Descriptive Statistics: Vulcan RW Summary Performance
I VAR SCEN TARGET MEAN SD N
IDCOR ALL ALL .82 .39 176ALL 1 .76 .43 96ALL 2 .87 .34 52ALL 3 .93 .26 28
FIDCOR ALL ALL .73 .45 49ALL 1 .56 .51 25ALL 2 .78 .44 9ALL 3 1.0 0 1511 --- .62 .52 814 --- .75 .46 818 ALL .50 .52 1219 --- 1.0 0 525 ALL .82 .40 1126 --- 1.0 0 5
HIDCOR ALL ALL .85 .36 127ALL 1 .83 .38 71ALL 2 .88 .32 43ALL 3 .85 .38 136 ALL 1 0 29 --- .62 .52 810 --- 1.0 0 812 --- .37 .35 813 --- .37 .52 818 --- .71 .49 719 --- 1.0 0 721 ALL 1.0 0 1122 ALL .91 .30 1125 --- 1.0 0 626 ALL .93 .27 1429 ALL .89 .32 1930 ALL .78 .43 18
FENG ALL ALL .35 .48 49ALL 1 .60 .50 25ALL 2 .22 .44 9ALL 3 0 0 1511 --- .38 .52 814 --- .50 .53 818 ALL .58 .51 1219 --- .20 .45 525 ALL .18 .40 1126 --- 0 0 5
-----------------------------------------------------
:3-33

L,
Table B-li (Continued)
I VAR SCEN TARGET MEAN SD N
HENG ALL ALL .80 .40 139ALL 1 .84 .37 75ALL 2 .86 .35 43ALL 3 .52 .51 216 ALL 1 0 29 --- .50 .53 810 --- 1.0 0 812 --- .88 .35 813 --- .38 .52 818 --- .71 .49 719 --- 1 0 721 ALL .85 .38 1322 ALL .77 .44 1325 --- 1.0 0 626 ALL .86 .36 1429 ALL .95 .23 1930 ALL .64 .49 22
PKILL ALL ALL .37 .49 124ALL 1 .30 .46 74ALL 2 .51 .51 39ALL 3 .36 .50 11
FKILL ALL ALL .02 .14 49ALL 1 .04 .20 25ALL 2 0 0 9ALL 3 0 0 1511 --- .13 .35 814 --- 0 0 818 ALL 0 0 1219 --- 0 0 525 ALL 0 0 1126 --- 0 ; 5
3-34

Table B-lI (Continued)
I VAR SCEN TARGET MEAN SD N
HKILL ALL ALL .32 .47 139ALL 1 .28 .45 75ALL 2 .47 .50 43ALL 3 .19 .40 216 ALL 0 0 29 --- .25 .46 810 --- .13 .35 812 --- .50 .53 813 --- 0 0 818 --- .43 .53 719 --- 0 0 721 ALL .23 .44 1322 ALL .69 .48 1325 --- .50 .55 626 ALL .43 .51 1429 ALL .53 .51 1930 ALL .18 .39 22
ORD ALL ALL .80 .40 139ALL 1 .73 .45 75ALL 2 .81 .39 43ALL 3 1.00 0 216 ALL 1 0 29 --- .75 .46 810 --- .88 .35 812 --- .50 .53 813 --- 1.0 0 818 --- .71 .49 719 --- 1.0 0 721 ALL .92 .28 1322 ALL .62 .51 1325 --- .67 .52 626 ALL .64 .50 1429 ALL .84 .37 1930 ALL .91 .29 22
HITS ALL ALL 9.3 17.9 189
ALL 1 8.0 16.3 101ALL 2 14.5 20.7 52ALL 3 5.7 16.8 36
BURSTS ALL ALL 1.6 1.5 189ALL 1 1.7 1.4 101ALL 2 1.8 1.6 52ALL 3 1.1 1.4 36
-----------------------------------------------------
3-35

APPENDIX C: INDIVIDUAL DIFFERENCES STATISTICS
C-1
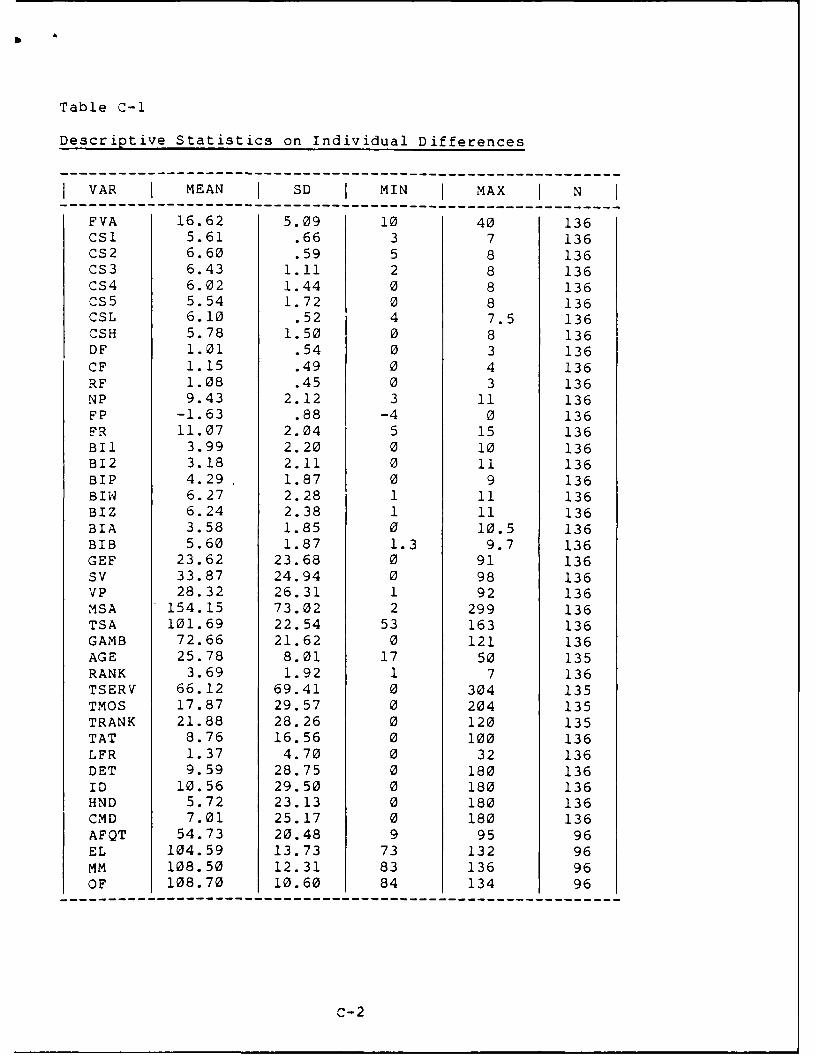
Table C-i
Descriptive Statistics on Individual Differences
VAR I MEAN I SD I MIN I MAX I N-----------------------------------------------------------
FVA 16.62 5.09 10 40 136CSl 5.61 .66 3 7 136Cs2 6.60 .59 5 8 136Cs3 6.43 1.11 2 8 136Cs4 6.02 1.44 0 8 136cs5 5.54 1.72 0 8 136CSL 6.10 .52 4 7.5 136CSH 5.78 1.50 0 8 136DF 1.01 .54 0 3 136CF 1.15 .49 0 4 136RF 1.08 .45 0 3 136Np 9.43 2.12 3 11 136FP -1.63 .88 -4 0 136FR 11.07 2.04 5 15 136BI1 3.99 2.20 0 10 136B12 3.18 2.11 0 11 136BIP 4.29 1.87 0 9 136BIW 6.27 2.28 1 11 136BIZ 6.24 2.38 1 11 136BIA 3.58 1.85 0 10.5 136BIB 5.60 1.87 1.3 9.7 136GEF 23.62 23.68 0 91 136SV 33.87 24.94 0 98 136VP 28.32 26.31 1 92 136MSA 154.15 73.02 2 299 136TSA 101.69 22.54 53 163 136GAMB 72.66 21.62 0 121 136AGE 25.78 8.01 17 50 135RANK 3.69 1.92 1 7 136TSERV 66.12 69.41 0 304 135TMOS 17.87 29.57 0 204 135TRANK 21.88 28.26 0 120 135TAT 8.76 16.56 0 100 136LFR 1.37 4.70 0 32 136DET 9.59 28.75 0 180 136ID 10.56 29.50 0 180 136HND 5.72 23.13 0 180 136CMD 7.01 25.17 0 180 136AFQT 54.73 20.48 9 95 96EL 104.59 13.73 73 132 96MM 108.50 12.31 83 136 96OF 108.70 10.60 84 134 96
C-2

Table C-2
Principal Components of Individual Differences
S 1 2 3 1 4 1 5 I 6 1EXPER I FOCUS IIMAGE INT I PERCEPT I MOTOR I PERSONAL I
AGE (.91) RF (-.67) FP (-.45) GEF (.79) MSA (.74) BI1 (.53)RANK (.77) FVA (-.79) BIP (.80) VP (.57) TSA (.75) GAMB (.75)TSERV(.94) CSL (.67) BIW (.78) SV (.66)TRANK(.80) CSM (.87) BIZ (.85)NP (-.72) CSH (.89) BI1 (.52)
B12 (.75)
I R2 .19 R2 = .34 1 R 2 = .48 1 R2 -= .56 R 2 .62 1 R2 = .67 1
1 1 1 2 1 3
IACTIVE FOCUSIIMAGE INTERPiPASSIVE FOCI
RF (-.61) BIZ (.84) RF (.50)FVA (-.84) 311 (.74) NP (.78)CSL (.73) B12 (.83) FP (.73)CSH (.90)
I R2 = .29 R2 = .53 1 R2 = .66 I
C-3
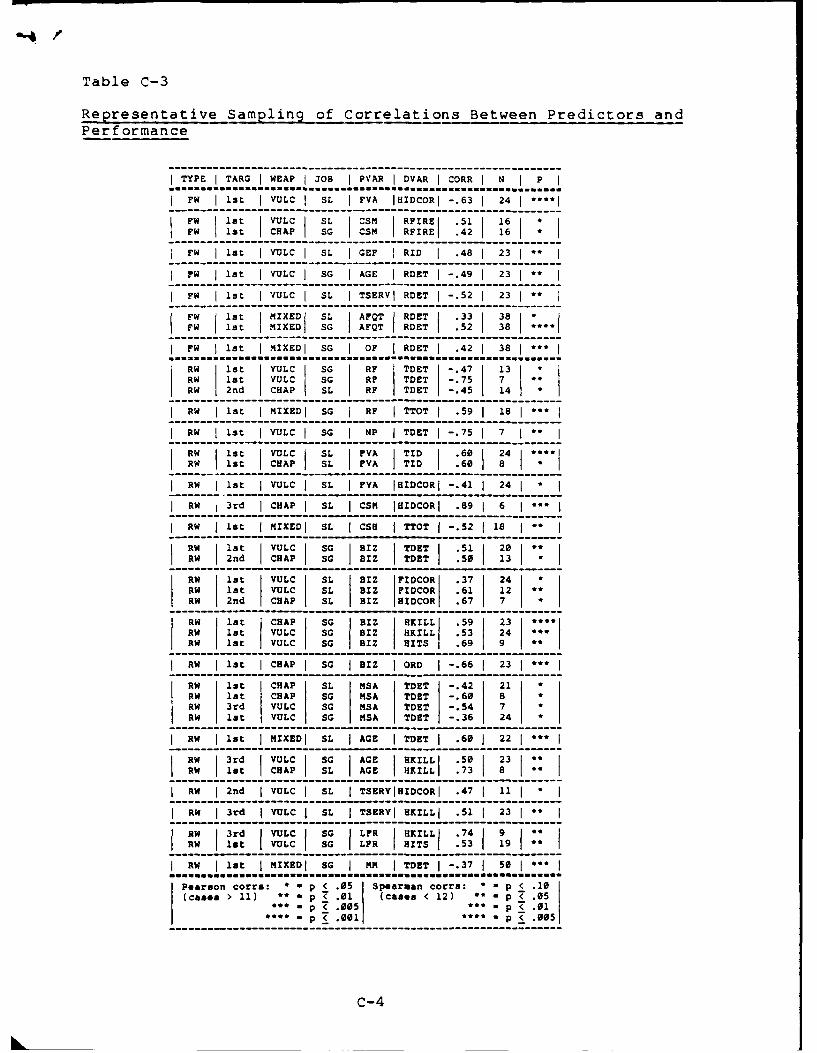
Table C-3
Representative Sampling of Correlations Between Predictors andPerformance
TYPE I TARG WEAP 38I J I PVAR I DVAR I CORR I
--------------------- -------------9* * * * * * * * *
FW 1st VULC ISL I FVA I RIOCRI -.6 246
Pw 1 t CHAP SG CSM RFIRE .42 16
1s lt jVULC ISL GEF IRID 1.48 123j
IW I 1t I VuLC I SG AGE RDET I -. 49 23j** I
I W I lst I VoLe I SL I TSERVj RDET I -. 52 1 23 I I
FW :et I MIXEDI SL IAFQT jRDET .33 . 38 1FW 1st MIXED SG AFQT RDET .52 38
FW Islt I MIXEDI SG I OF IRDETI .42 1381 ''
RW 1:t IVULC SG IRF TDET -.47 13RW Iat VULC SG RF TDET -. 75 7 *RW 2nd CHAP SL RF TDET -. 45 14
RW slt I MIXED1 SG i RF TTOT .59 18 1 1
RW ist I l LCI SG N NP ITDET -.751 7 I 1
R 1: LCISLI. FVA TID .60 24Rw 1st CHAP SL PVA TID .6 08
RW list VULC I SL I FVA IHIDCORI -.41I1 24 1
Rw 3rd CHAP I SLI , EHIDCORI .89 6 1 1
RW I lit IMNXEDI SL I CSS I ToT 1-.52 ( 18 1 1
RW lot VULC SQ I8BZ ITDET I 51 120RW 2nd CHAP SG BIZ TDET s.5 13
RN 1:t VULC ISL. IE ?I Z DCOR 37 24RW 1st VULC SL BIZ FIDCOR .61 12 *RW 2nd CHAP SL BIZ HIDCOR .67 7
RN 1:t CHAP SQ BIZ HKii 5 3~RW 1st VULC SG BIZ HKILL .53 24 9::
RW lst VULC SG BIZ HITS .69 9
RW lt CHAP SG BIEZ ORD -. 661 231 *1 I
RN 1st CRAP Si. NSA TDET -.42 21RW Ist CHAP SG NSA TDET -. 60 8RW 3rd VULC SG MSA TDET -. 54 7RW let VULC SG MSA TDET -. 36 24
IR 1st MIXEDI SL I AGE I TDET .60 1 22 IRN 3rd !VULC SG S I AGE RI HILIl :50 231:RW lEt CHAP SL AGE HKIiLi.I 73 1
Rw 2nd I VULC SL I TSERVHIDCORI .47 1 I *1
Rif 3rd IVULC I SL. I TSERVI HKILLiI .51 1 23 1 1
RN 3rd VULC I SQ I FR fHKILLI f74 199R I lt IVULC ISG i.FR IHITS .53 19
I RN I sot I MIXED S I M I TDET 1-.37f 501"*'... M=... = .. ........ = ..... - ... O...*fWl......f"lf...b
Pearson corrs: p < .05 Spearman corre: p < 10(cases > 11) * p < .C 1 (cases < 12) * p <05
** p .005 ** p .01•*** < P .001 **** p .005
C-4
h.