SHOCK THERAPY VERSUS GRADUALISM RECONSIDERED: … · countries) taken with a 33% weight – see...
32
This paper is the logical continuation of my earlier article: Shock Therapy versus Gradualism: The End of the Debate (Explaining the Magnitude of the Transformational Recession) Comparative Economic Studies, Vol. 42, No. 1, Spring 2000, pp. 1-57. The arguments of this earlier article, however, are reconsidered in light of new research and evidence. SHOCK THERAPY VERSUS GRADUALISM RECONSIDERED: LESSONS FROM TRANSITION ECONOMIES AFTER 15 YEARS OF REFORMS Vladimir Popov
Transcript of SHOCK THERAPY VERSUS GRADUALISM RECONSIDERED: … · countries) taken with a 33% weight – see...

This paper is the logical continuation of my earlier article: Shock Therapy versus Gradualism: The End of the Debate
(Explaining the Magnitude of the Transformational Recession) Comparative Economic Studies, Vol. 42, No. 1, Spring 2000, pp. 1-57. The arguments of this earlier article, however, are reconsidered in
light of new research and evidence.
SHOCK THERAPY VERSUS GRADUALISM RECONSIDERED: LESSONS FROM
TRANSITION ECONOMIES AFTER 15 YEARS OF REFORMS
Vladimir Popov

GDP change in selected transition economies, 1989 = 100%
35
45
55
65
75
85
95
105
115
125
1989
1990
1991
1992
1993
1994
1995
1996
1997
1998
1999
2000
2001
2002
2003
Poland
Slovenia
SlovakRepublic
Hungary
CzechRepublic
Romania
Bulgaria
Russia
Ukraine
CentralEurope
South Eastern Europe
FSU (Russia, Ukraine)

INITIAL LIBERALIZATION AND OUTPUT CHANGE DURING RECESSION
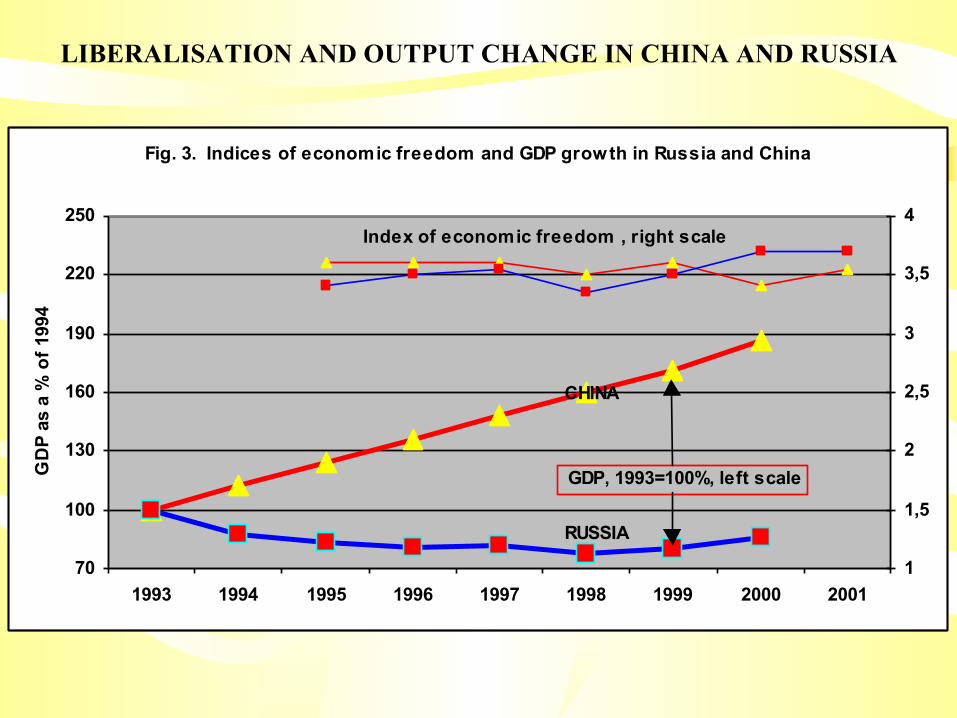
LIBERALISATION AND OUTPUT CHANGE IN CHINA AND RUSSIA
Fig. 3. Indices of economic freedom and GDP growth in Russia and China
70
100
130
160
190
220
250
1993 1994 1995 1996 1997 1998 1999 2000 2001
GD
P as
a %
of 1
994
1
1,5
2
2,5
3
3,5
4
GDP, 1993=100%, left scale
CHINA
RUSSIA
Index of economic freedom , right scale

GDP change in Asian economies, 1989 = 100% Fig. 1b. GDP change in Asian transition economies, 1989 = 100%
40
60
80
100
120
140
160
180
200
1989 1991 1993 1995 1997 1999 2001 2003
China
Vietnam
Central Europe
Uzbekistan
Mongolia
Turkmenistan
Kazakhstan
Russia
Kyrgyzstan
Tajikistan
Source: EBRD, World Bank.

GDP change in FSU economies, 1989 = 100% Fig. 2. GDP change in FSU economies, 1989 = 100%
25
35
45
55
65
75
85
95
105
115
1989 1990 1991 1992 1993 1994 1995 1996 1997 1998 1999 2000 2001 2002 2003 2004 2005
Central Europe
Uzbekistan
Belarus
Kazakhstan
Estonia
Turkmenistan
Azerbaijan
Latvia
Lithuania
Tajikistan
Russia
Kyrgyzstan
Armenia
Ukraine
Georgia
Moldova

Russia was leading in economic liberalization, while Belarus was lagging
Private sector share in GDP, %
0
10
20
30
40
50
60
70
80
1990
1991
1992
1993
1994
1995
1996
1997
1998
1999
2000
2001
2002
2003
2004
2005
2006
Russian FederationUkraineBelarus
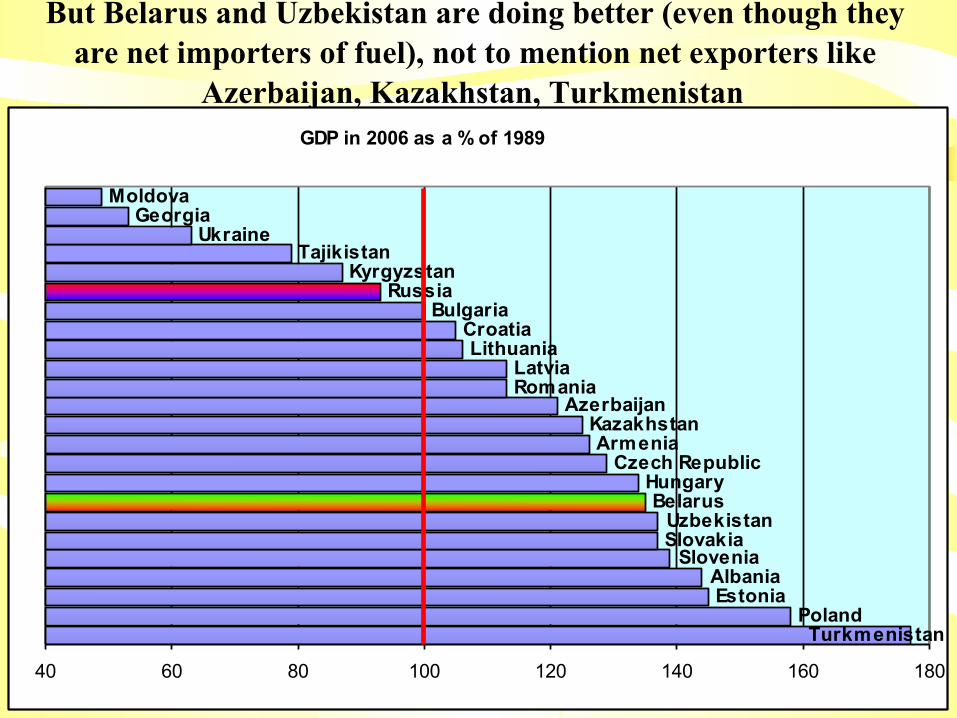
But Belarus and Uzbekistan are doing better (even though they are net importers of fuel), not to mention net exporters like
Azerbaijan, Kazakhstan, Turkmenistan GDP in 2006 as a % of 1989
TurkmenistanPoland
Estonia
Slovakia
BelarusHungary
Czech RepublicArmenia
KazakhstanAzerbaijan
RomaniaLatvia
LithuaniaCroatia
BulgariaRussia
KyrgyzstanTajikistan
UkraineGeorgia
Moldova
Uzbekistan
SloveniaAlbania
40 60 80 100 120 140 160 180

Russian growth is lagging behind that of oil exporters and some oil importers
Average annual GDP growth rates in CIS countries in 2000-07, EBRD estimates
02468
10121416
Kyr
gyz
stan
Uzb
ekis
tan
Mo
ldo
va
Ru
ssia
Geo
rgia
Ukr
ain
e
Bel
aru
s
Taj
ikis
tan
Kaz
akh
stan
Arm
enia
Tu
rkm
enis
tan
Aze
rbai
jan

INITIAL LIBERALIZATION AND OUTPUT CHANGE DURING RECOVERY
Fig. 8. Liberalization index by 1995 and performance in 1994-98
R2 = 0,3345
65
75
85
95
105
115
125
135
145
155
0,5 1 1,5 2 2,5 3 3,5 4 4,5
Cumulative liberalization index, 1995
1998
GD
P as
a %
of 1
994
GD
P
CZHU
POLSLOVAK
SLOVEN
VIETN
CROAT
MACED
CHINALITH
CIS countries
BULG
ESTALB
LATV
MONG
ROM
LIBERALIZATION STOCK AND OUTPUT CHANGE DURING RECOVERY
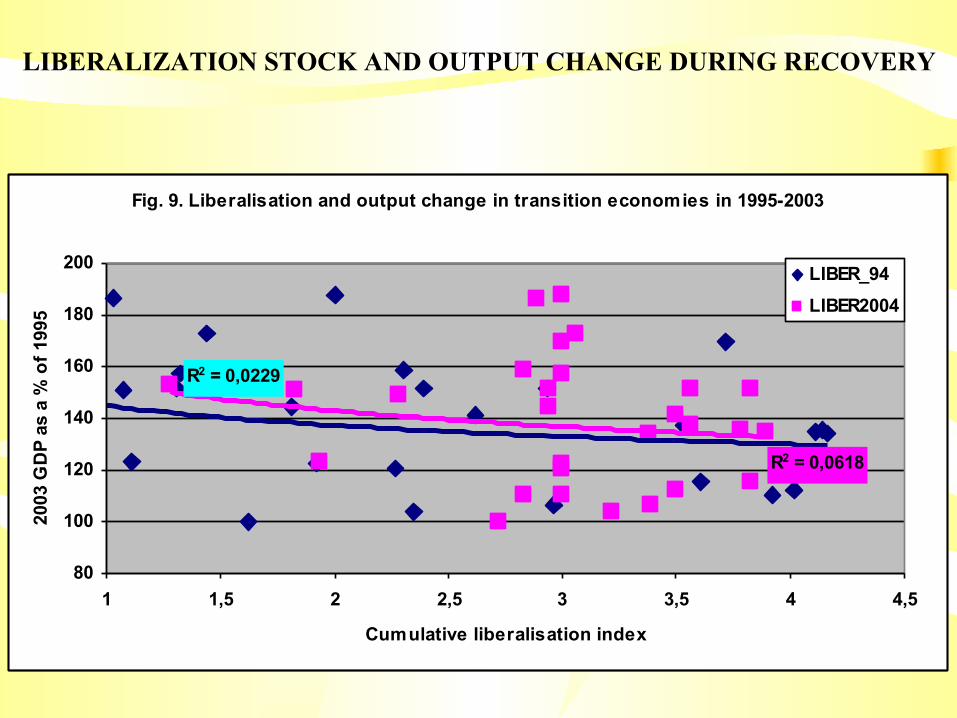
Fig. 9. Liberalisation and output change in transition economies in 1995-2003
R2 = 0,0618
R2 = 0,0229
80
100
120
140
160
180
200
1 1,5 2 2,5 3 3,5 4 4,5
Cumulative liberalisation index
2003
GD
P as
a %
of 1
995
LIBER_94LIBER2004
LIBERALIZATION STOCK AND OUTPUT CHANGE DURING RECOVERY
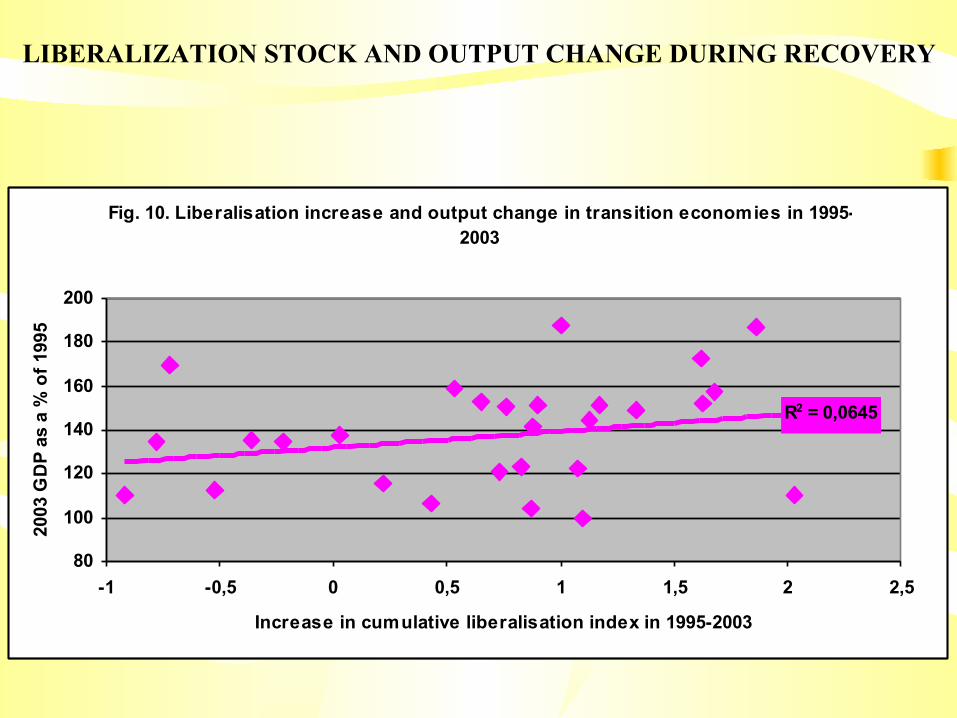
Fig. 10. Liberalisation increase and output change in transition economies in 1995-2003
R2 = 0,0645
80
100
120
140
160
180
200
-1 -0,5 0 0,5 1 1,5 2 2,5
Increase in cumulative liberalisation index in 1995-2003
2003
GD
P as
a %
of 1
995

Does liberalization matter? • Vietnam and China are similar in initial conditions and in
transition results (immediate growth of output without transformational recession) despite different reform strategies:
• Chinese reforms are the classical example of gradualism • Vietnamese reformers introduced shock therapy treatment
(instant deregulation of most prices and introduction of convertibility of dong) in 1989
• Differing performance of the former Soviet Union (FSU) states: • Baltic states are the champions of liberalization and
stabilization in the region. In the Baltics, however, output fell in the early 1990s by 36-60% and even in 2005, 10 years after the bottom of the recession was reached, was still below the pre-recession maximum.
• Uzbekistan is commonly perceived to be one of the worst procrastinators. However in Uzbekistan the reduction of output in 1990-95 totaled only 18% and the economy started to grow again in 1996
• By 2005 only two former Soviet republics - Uzbekistan and Turkmenistan - surpassed the pre-recession level of 1989

Reasons for recession: (1) Supply shock - change in relative prices
Fig. 4. Change in relative prices and output in 1990-98 in Russian industry
R2 = 0,4062
0
30
60
90
40% 60% 80% 100% 120% 140% 160%
Ratio of 1998 proices to 1990 prices as a % of industrial average
Janu
ary
1998
out
put a
s a
% o
f Ja
nuar
y 19
90 o
utpu
t
Electric energy
Fuel
Non-ferrous metals
Light
FoodWood
Constr. materialsMachinery
Chemicals
Petrochemicals
Steel

Industrial structure and external trade distortions
Fig. 7. Aggregate distortions in industrial structure and external trade before transition and GDP change during transition
20
50
80
110
140
170
200
0 10 20 30 40 50 60 70 80 90
Distortions in industrial structure and external trade, % of GDP
1996
GDP
as
a %
of 1
998
GDP
CHINA
VIETN
SLOVEN
HUNG
MACED
CZECH
CROATEST
ARM

Reasons for recession: (2) Collapse of state institutions - government revenues and
expenditure fell in most transition economies Fig. 13. Consolidated government revenues as a % of GDP
10
15
20
25
30
35
40
45
50
55
1989 1990 1991 1992 1993 1994 1995 1996
%
Central Europeancountries
South East Europecountries
Baltic states
Central Asiancountries
Caucasian states
-China
RUSSIA

Three major patterns of change in government expenditures
Fig. 10. Government expenditure , % of GDP
0
10
20
30
40
50
60
1985 1989 1995 1978 1985 1994 1989 1996
Debt serviceDefenceSubsidiesInvestment"Ordinary government"
POLANDCHINA
USSR/ RUSSIA
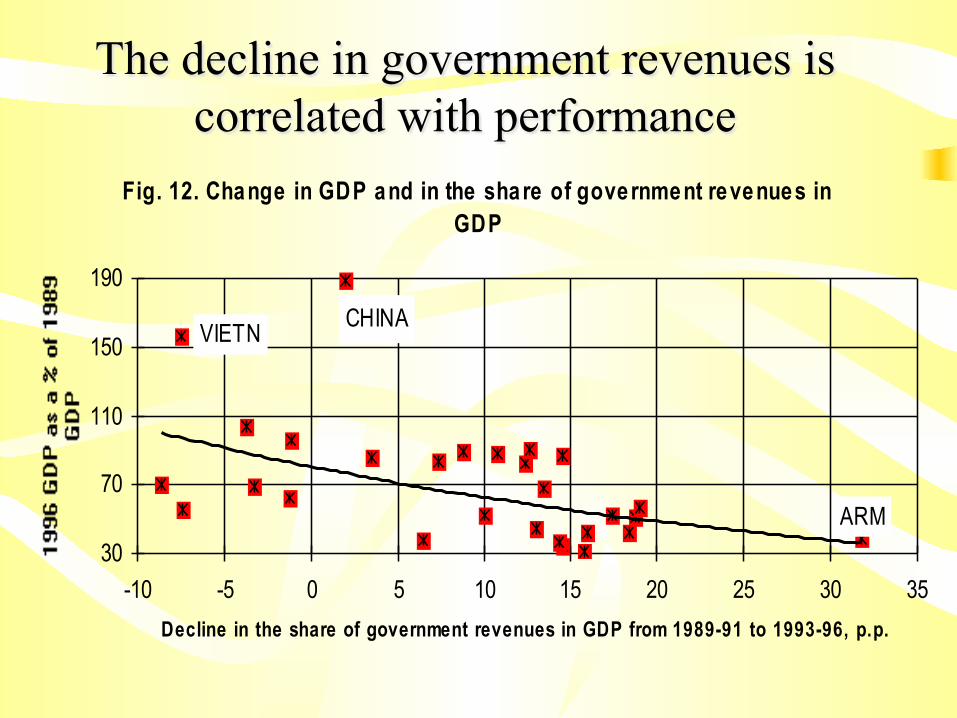
The decline in government revenues is correlated with performance
Fig. 12. Change in GDP and in the share of government revenues in GDP
30
70
110
150
190
-10 -5 0 5 10 15 20 25 30 35Decline in the share of government revenues in GDP from 1989-91 to 1993-96, p.p.
VIETN
ARM
CHINA

Impact of initial conditions, institutions, liberalization:1989-96
Table 1. Regression of change in GDP in 1989-96 on initial conditions, policy factors, and rule of lawand democracy indices, robust estimatesDependent variable = log (1996 GDP as a % of 1989 GDP)For China - all indicators are for the period of 1979-86 or similarEquations, Number ofObservations / Variables
1,N=28
2,N=28
3,N=28
4,N=28
5,N=28
6,N=28
7,N=28
Constant 5.3*** 5.4*** 5.2*** 5.4*** 5.4*** 5.5*** 5.7***Distortions, % of GDPa -.005** -.005** -.003 -.006** -.007*** -.007*** -.007***1987 PPP GDP per capita, % of theUS level
-.009** -.006* -.007** -.007** -.009*** -.008***
-.008***
War dummyb -.19c -.36*** -.37*** -.45***Decline in government revenues asa % of GDP from 1989-91 to 1993-96
-.011*** -.011***
-.011***
Liberalization index .05 -.02 .03Log (Inflation, % a year, 1990-95,geometric average)
-.16*** -.20*** -.18*** -.17*** -.13*** -.13*** -.14***
Rule of law index, average for1989-97, %
.008***
Democracy index, average for1990-98, %
-.005***
-.003**
Ratio of the rule of law todemocracy index
.07*** .07*** .06*** .05*** .05***
Adjusted R2, % 82 83 83 85 91 91 90*, **, *** - Significant at 1, 5 and 10% level respectively.aCumulative measure of distortions as a % of GDP equal to the sum of defense expenditure (minus 3%regarded as the 'normal' level), deviations in industrial structure and trade openness from the 'normal' level,the share of heavily distorted trade (among the FSU republics) and lightly distorted trade (with socialistcountries) taken with a 33% weight – see (Popov, 2000) for details.bEquals 1 for Armenia, Azerbaijan, Croatia, Georgia, Macedonia, and Tajikistan and 0 for all othercountries.c Significant at 13% level.

Evaluating the impact of non-policy and policy factors:1989-98
DDeeppeennddeenntt vvaarriiaabbllee == lloogg ((11999988 GGDDPP aass aa %% ooff 11998899 GGDDPP)) FFoorr CChhiinnaa -- aallll iinnddiiccaattoorrss aarree ffoorr tthhee ppeerriioodd ooff 11997799--8888 oorr ssiimmiillaarr
EEqquuaattiioonnss,, NNuummbbeerr ooff oobbsseerrvvaattiioonnss // VVaarriiaabblleess
11,, NN==2288
22,, NN==2288
33,, NN==2288
44,, NN==2288
55,, NN==1177
66,, NN==1177
77,, NN==1177
88,, NN==1177
CCoonnssttaanntt 55..3300 44..8888 55..6688 55..7733 55..7744 55..4433 55..8866 66..0088 DDiissttoorrttiioonnss,, %% ooff GGDDPPaa --..0011 --..0011 --..0011 --..0011 --..0011 --..0011 cc ((--..0000)) ((--..0000)) 11998877 PPPPPP GGDDPP ppeerr ccaappiittaa,, %% ooff tthhee UUSS lleevveell
--..0011 --..0022 --..0011 --..0011 --..0011 --..0022 --..0011cc ((--..0011))
WWaarr dduummmmyybb --..6677 --..5588 --..3388 --..3377 DDeecclliinnee iinn ggoovveerrnnmmeenntt rreevveennuueess aass aa %% ooff GGDDPP ffrroomm 11998899--9911 ttoo 11999933--9966
--..0022 --..0011 --..0011 --..0011
LLiibbeerraalliizzaattiioonn iinnddeexx ((..1111)) ((--..0011)) ((..1111)) ((--..0066)) LLoogg ((IInnffllaattiioonn,, %% aa yyeeaarr,, 11999900--9955,, ggeeoommeettrriicc aavveerraaggee))
--..1155 --..1155 --..1133 --..1166
SShhaaddooww eeccoonnoommyy aass aa %% ooff GGDDPP iinn 11999944 --..0022 --..0022 --..0011 --..0022 AAddjjuusstteedd RR22,, %% 6677 6699 8800 8800 7722 7733 8822 8811
aaCCuummuullaattiivvee mmeeaassuurree ooff ddiissttoorrttiioonnss aass aa %% ooff GGDDPP eeqquuaall ttoo tthhee ssuumm ooff ddeeffeennssee eexxppeennddiittuurree ((mmiinnuuss 33%% rreeggaarrddeedd aass tthhee ''nnoorrmmaall'' lleevveell)),, ddeevviiaattiioonnss iinn iinndduussttrriiaall ssttrruuccttuurree aanndd ttrraaddee ooppeennnneessss ffrroomm tthhee ''nnoorrmmaall'' lleevveell,, tthhee sshhaarree ooff hheeaavviillyy ddiissttoorrtteedd ttrraaddee ((aammoonngg tthhee FFSSUU rreeppuubblliiccss)) aanndd lliigghhttllyy ddiissttoorrtteedd ttrraaddee ((wwiitthh ssoocciiaalliisstt ccoouunnttrriieess)) ttaakkeenn wwiitthh aa 3333%% wweeiigghhtt ((sseeee AAppppeennddiixx ffoorr ddeettaaiillss)).. bbEEqquuaallss 11 ffoorr AArrmmeenniiaa,, AAzzeerrbbaaiijjaann,, CCrrooaattiiaa,, GGeeoorrggiiaa,, MMaacceeddoonniiaa,, aanndd TTaajjiikkiissttaann aanndd 00 ffoorr aallll ootthheerr ccoouunnttrriieess.. ccSSiiggnniiffiiccaanntt aatt 88%% lleevveell..
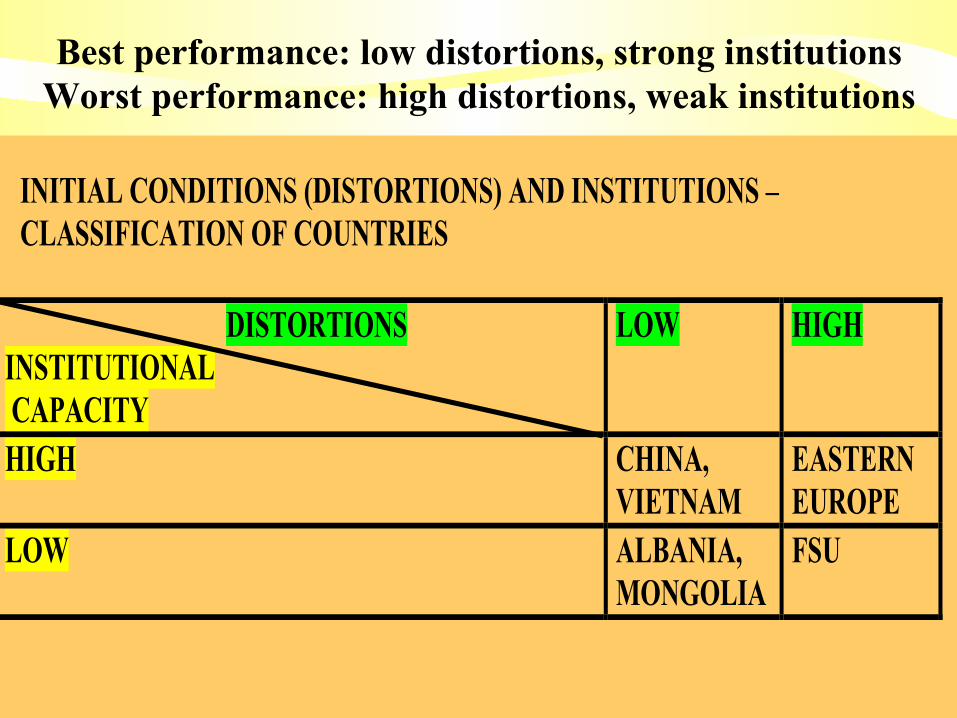
Best performance: low distortions, strong institutions Worst performance: high distortions, weak institutions
INITIAL CONDITIONS (DISTORTIONS) AND INSTITUTIONS –CLASSIFICATION OF COUNTRIES
DISTORTIONSINSTITUTIONAL CAPACITY
LOW HIGH
HIGH CHINA,VIETNAM
EASTERNEUROPE
LOW ALBANIA,MONGOLIA
FSU

Explaining the magnitude of recession:
• Differences in performance during transition depend strongly on the initial conditions:
• The higher the distortions (militarization, over-industrialization, "under-openness" of the economy and the share of perverted trade flows), the worse is the performance
• The higher was GDP per capita before transition, the greater were distortions embodied in fixed capital stock, the more difficult it was to overcome these distortions to achieve growth

Explaining the magnitude of recession:
• Macroeconomic stability matters a great deal for economic performance
• Liberalization index does not appear to be important
• Changes in the institutional capabilities of the state have dramatic impact on performance

By the end of the 1990s most countries were already recovering from recession
TTaabbllee 66.. RReeggrreessssiioonn ooff cchhaannggee iinn GGDDPP iinn 11999944--9988 oonn nnoonn--ppoolliiccyy aanndd ppoolliiccyy--rreellaatteedd ffaaccttoorrss ((aallll ccooeeffffiicciieennttss aarree ssiiggnniiffiiccaanntt aatt 1155%% lleevveell eexxcceepptt tthhoossee iinn bbrraacckkeettss)) DDeeppeennddeenntt vvaarriiaabbllee == lloogg ((11999988 GGDDPP aass aa %% ooff 11999944 GGDDPP)) FFoorr CChhiinnaa -- aallll iinnddiiccaattoorrss aarree ffoorr tthhee ppeerriioodd ooff 11998844--8888 oorr ssiimmiillaarr EEqquuaattiioonnss,, NNuummbbeerr ooff OObbsseerrvvaattiioonnss // VVaarriiaabblleess
11,, NN==2288
22,, NN==2288
33,, NN==2288
44,, NN==2288
55,, NN==2288
CCoonnssttaanntt 44..5511 44..2255 44..5566 44..3322 44..6600 DDiissttoorrttiioonnss,, %% ooff GGDDPPaa ..000044 ..000055 ..000033 ..000033 11998877 PPPPPP GGDDPP ppeerr ccaappiittaa,, %% ooff tthhee UUSS lleevveell WWaarr dduummmmyybb ..1155 DDeecclliinnee iinn ggoovveerrnnmmeenntt rreevveennuueess aass aa %% ooff GGDDPP ffrroomm 11998899--9911 ttoo 11999933--9966
--..000033 cc --..000044
LLiibbeerraalliizzaattiioonn iinnddeexx ..0077 ..1122 ..0099 ..1100 ..0077 LLoogg ((IInnffllaattiioonn,, %% aa yyeeaarr,, 11999900--9955,, GGeeoommeettrriicc aavveerraaggee))
--..0066 ..0044
AAddjjuusstteedd RR22,, %% 2211 2277 3377 2299 3333 aaCCuummuullaattiivvee mmeeaassuurree ooff ddiissttoorrttiioonnss aass aa %% ooff GGDDPP eeqquuaall ttoo tthhee ssuumm ooff ddeeffeennssee eexxppeennddiittuurree ((mmiinnuuss 33%% rreeggaarrddeedd aass tthhee ''nnoorrmmaall'' lleevveell)),, ddeevviiaattiioonnss iinn iinndduussttrriiaall ssttrruuccttuurree aanndd ttrraaddee ooppeennnneessss ffrroomm tthhee ''nnoorrmmaall'' lleevveell,, tthhee sshhaarree ooff hheeaavviillyy ddiissttoorrtteedd ttrraaddee ((aammoonngg tthhee FFSSUU rreeppuubblliiccss)) aanndd lliigghhttllyy ddiissttoorrtteedd ttrraaddee ((wwiitthh ssoocciiaalliisstt ccoouunnttrriieess)) ttaakkeenn wwiitthh aa 3333%% wweeiigghhtt ((sseeee AAppppeennddiixx ffoorr ddeettaaiillss)).. bbEEqquuaallss 11 ffoorr AArrmmeenniiaa,, AAzzeerrbbaaiijjaann,, CCrrooaattiiaa,, GGeeoorrggiiaa,, MMaacceeddoonniiaa,, aanndd TTaajjiikkiissttaann aanndd 00 ffoorr aallll ootthheerr ccoouunnttrriieess.. c Significant at 21% level.
Impact of initial conditions, institutions, liberalization
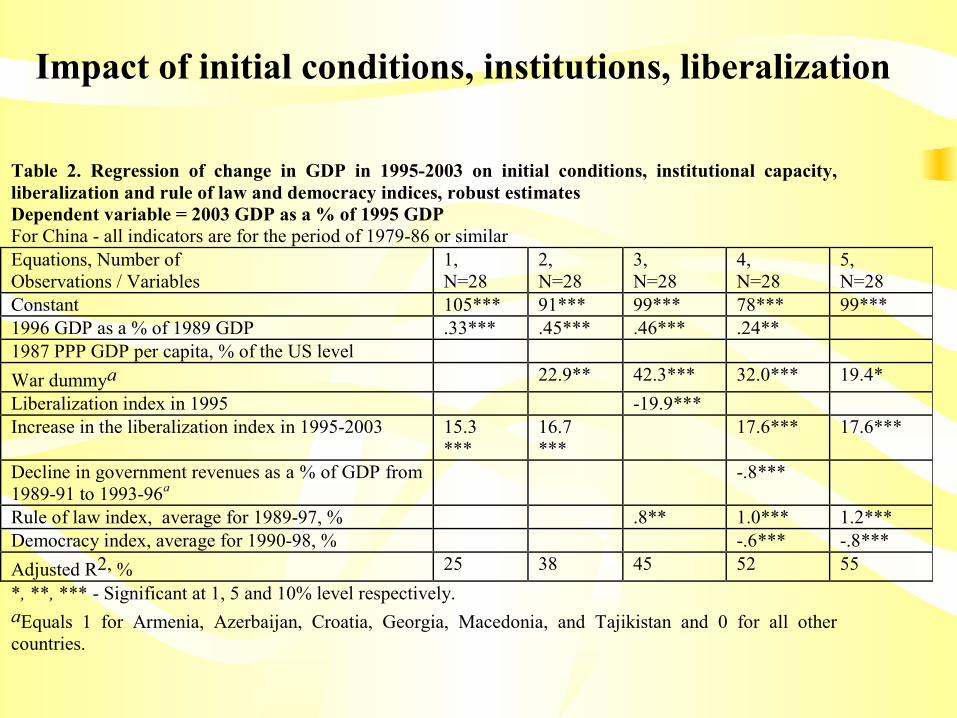
Table 2. Regression of change in GDP in 1995-2003 on initial conditions, institutional capacity,liberalization and rule of law and democracy indices, robust estimatesDependent variable = 2003 GDP as a % of 1995 GDPFor China - all indicators are for the period of 1979-86 or similarEquations, Number ofObservations / Variables
1,N=28
2,N=28
3,N=28
4,N=28
5,N=28
Constant 105*** 91*** 99*** 78*** 99***1996 GDP as a % of 1989 GDP .33*** .45*** .46*** .24**1987 PPP GDP per capita, % of the US levelWar dummya 22.9** 42.3*** 32.0*** 19.4*Liberalization index in 1995 -19.9***Increase in the liberalization index in 1995-2003 15.3
***16.7***
17.6*** 17.6***
Decline in government revenues as a % of GDP from1989-91 to 1993-96a
-.8***
Rule of law index, average for 1989-97, % .8** 1.0*** 1.2***Democracy index, average for 1990-98, % -.6*** -.8***Adjusted R2, % 25 38 45 52 55*, **, *** - Significant at 1, 5 and 10% level respectively.aEquals 1 for Armenia, Azerbaijan, Croatia, Georgia, Macedonia, and Tajikistan and 0 for all othercountries.

OBJECTION: Speed and extent of liberalization may be endogenous
Fig. 3. Liberalization indices and distortions in industrial structure and trade patterns
012345
0 20 40 60 80Distortions in the industrial structure and trade patterns
(% of GDP)
Cum
ulat
ive
iber
aliz
atio
n in
dice
s by
199
5
CIS

Economic liberalization and democratization go hand in hand
Fig. 4. Democracy index (1990-98, average) and economic liberalization index by 1995
0
1
2
3
4
5
0 20 40 60 80 100
Democracy index (Freedom House)
Cum
ulat
ive
iber
aliz
atio
n in
dex
by 1
995
CIS and BALKANSVIETN
CHINA
CROAT, MACED

Instrumenting liberalization stock with democracy level variable: 1989-96
Table 3. 2SLS robust estimates – regression of change in GDP in 1989-96 on initial conditions,institutional capacity, liberalization and rule of law and democracy indices (Liberalization indexinstrumented with the democracy level variable)Dependent variable = Log (1996 GDP as a % of 1989 GDP)For China - all indicators are for the period of 1979-86 or similarEquations, Number ofObservations / Variables
1,N=28
2,N=28
3,N=17
4,N=17
Constant 6.4*** 6.3*** 6.0*** 6.0***Pre-transition distortions, % of GDP -.01*** -.02*** -.0041987 PPP GDP per capita, % of the US level -.007** -.01***War dummya -.45*** -.29b
Liberalization index in 1995 -.18** -.39* -.19*** -.19***Decline in government revenues as a % of GDP from 1989-91 to1993-96
-.02*** -.02***
Log (Inflation, % a year, 1990-95, geometric average) -1.7*** -.22*** -.22*** -.19***Rule of law index, average for 1989-97, % -.01c
Increase in the share of shadow economy in GDP in 1989-94, p.p. -.02*** -.015***R2, % 86 77 88 90*, **, *** - significant at 1, 5 and 10% level respectively.aEquals 1 for Armenia, Azerbaijan, Croatia, Georgia, Macedonia, and Tajikistan and 0 for all othercountries.b Significant at 12% level.c Significant at 16% level.
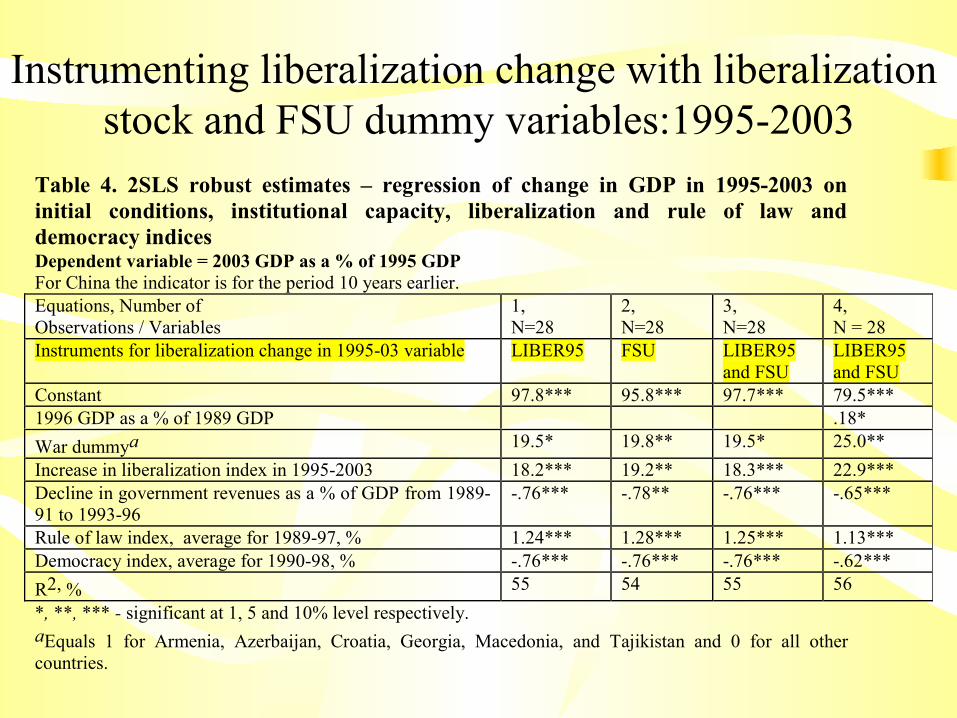
Instrumenting liberalization change with liberalization stock and FSU dummy variables:1995-2003
Table 4. 2SLS robust estimates – regression of change in GDP in 1995-2003 oninitial conditions, institutional capacity, liberalization and rule of law anddemocracy indicesDependent variable = 2003 GDP as a % of 1995 GDPFor China the indicator is for the period 10 years earlier.Equations, Number ofObservations / Variables
1,N=28
2,N=28
3,N=28
4,N = 28
Instruments for liberalization change in 1995-03 variable LIBER95 FSU LIBER95and FSU
LIBER95and FSU
Constant 97.8*** 95.8*** 97.7*** 79.5***1996 GDP as a % of 1989 GDP .18*War dummya 19.5* 19.8** 19.5* 25.0**Increase in liberalization index in 1995-2003 18.2*** 19.2** 18.3*** 22.9***Decline in government revenues as a % of GDP from 1989-91 to 1993-96
-.76*** -.78** -.76*** -.65***
Rule of law index, average for 1989-97, % 1.24*** 1.28*** 1.25*** 1.13***Democracy index, average for 1990-98, % -.76*** -.76*** -.76*** -.62***R2, % 55 54 55 56*, **, *** - significant at 1, 5 and 10% level respectively.aEquals 1 for Armenia, Azerbaijan, Croatia, Georgia, Macedonia, and Tajikistan and 0 for all othercountries.

Conclusions
• The impact of the speed of liberalization at the initial stage of transition, i.e. during the transformational recession, appears to be negative, if any.
• The reason for the negative impact is most probably associated with limited ability of the economy to adjust to new price ratios

Conclusions
Fig. 5. Hypothetical trajectories of output (Year "0" = 100%) assuming gradual and instant liberalization
80%85%90%95%
100%105%110%115%120%125%
0 1 2 3 4 5 6 7 8 9 10
Years
Out
put,
Year
"0"
= 1
00%
Reduction ofoutput in aNC sector at10% annually
Reduction ofoutput in aNC sector at30% annually
Reduction ofoutput in aNC sector at100%annually
Assumptions: size of non-competitive sector (NC) in the initial year = 20% of total output; net investment (s) = 10% of total output;
marginal capital productivity, output increase per unit of net investment (a) = 1/3.

Conclusions • At the recovery stage liberalization starts to affect
growth positively, whereas the impact of pre-transition distortions disappears. Institutional capacity and macroeconomic policy continue to be important prerequisites for successful performance.
• Liberalization at the recovery stage influences performance positively because it creates market stimuli without causing rapid collapse of output of ineff icient industr ies , which cannot be compensated fully by the rise of efficient industries due to investment constraints.