Shares Investment Malaysia Edition Issue 22
36
PP 14523/03/2010(023784) • MICA (P) 025/04/2009 Uncover the secrets to your wealth ™ ISSN 1793-7280 ISSUE 22 07/12/09 - 10/01/10 OTHER FEATURES Markets headed for consolidation The proposed 4% GST Banking on improved performance RESILIENT RUBBER: FROM PRODUCER TO MANUFACTURER
-
Upload
pcl-printers-pte-ltd -
Category
Documents
-
view
220 -
download
0
description
Shares Investment Malaysia Edition Issue 22
Transcript of Shares Investment Malaysia Edition Issue 22

PP 14523/03/2010(023784) • MICA (P) 025/04/2009
Uncover the secrets to your wealth™
I S S N 1 7 9 3 - 7 2 8 0
ISSUE 22 07/12/09 - 10/01/10
OTHER FEATURES
Markets headed for consolidation
The proposed 4% GST
Banking on improved performance
RESILIENT RUBBER:FROM PRODUCERTO MANUFACTURER
MSH_Cover22.indd 1 12/2/09 2:22:00 PM

MALAYSIA
Information in this guide has been obtained from sources believed to be reliable. However, its accuracy or completeness is not guaranteed. While every precaution is taken to ensure accuracy, the publisher accepts no liability for any error which may arise.The articles are based on the opinions of the various authors and do not represent the opinions of this publication and/or the opinions of the organisation he/she represents.In no event is SHARES INVESTMENT liable for all and/or any direct or indirect loss arising from any use or any reliance of any information provided.
FEATURES
p4 Resilient Rubber
p6 Markets Headed For Consolidation
p8 GST At 4%
p10 Momentum Weakening, Time For A Break?
p12 Introducing New Fuel Subsidy Scheme With Care
p14 Maximising A Return
p17 Banking On Improved Performance
p20 Christmas Comes Early For CapitaMalls Asia
■ CONTENTS ■ ■ Issue 22 ■ 07 Dec - 10 Jan 2010
PERSPECTIVE p4
All materials printed in SHARES INVESTMENT are protected under the copyright act. All rights reserved. No part of this publication may be reproduced in any form or by any means without the written permission of the publisher. Information in the publication should not be taken as offer/ advice to buy or sell securities.We, our associated companies and / or their officers, directors and employees may own or have positions in securities mentioned in the publication, and may from time to time, add on to or dispose of such securities.
p8
Malaysia used to be the world’s biggest producer of natural rubber. It lost its dominance as the supplier for one-third of the world’s output in 1985 with the country’s shift towards industrialization.
p14
MSHE_1-2_Content.indd 1 12/3/09 5:18:53 PM

p17
REGULARS
p23 Market Indices
p26 Foreign Indices
p28 Market Capitalisation
p30 Major Trades
p32 Most Active Shares
p34 Hitting 52-Week High
p35 Hitting 52-Week Low
p36 Top Gainers
p38 Top Losers
p40 Lowest P/E
p42 Highest Yield
p44 Highest Margins
p46 Highest ROA
p48 Profit & Loss
p50 Upcoming Results Announcements
p52 Entitlements (cd, xd, cb, xb…)
p54 Performance of Recent IPOs
p55 Discount to NAV
p56 Mainboard Companies A-Z
p246 ACE Market Companies A-Z
p247 Investment Trust
p251 Warrants A-Z
p256 Inactive Shares, Warrants & Loanstocks
p267 Companies Index A-Z
ShareS InveStment (malaySIa) is published once a month.
We welcome contributions from readers, as well as from finance professionals. Please fax or e-mail ([email protected]) should you also have any queries, remarks or suggestions.
Supported by
PUBlISherPioneers & leaders (malaysia) Sdn Bhd(Co. No. 660679-A)Unit 901, Level 9, City PlazaNo 21, Jalan Tebrau80300 Johor Bahru, MalaysiaTel : (03) 7875 6908 / (65) 6745 8733Fax: (65) 6745 8321
editor-in-chief Phan Tjun Serneditorial Director Lew Poh ChanSenior Consultant Dr Ho Kah Leongeditor Sang Ah Kewregional research editor Clement Kanresearch editor Stephen Chinresearch executives Aw Jie Sheng David Chung Donavan Lim Lai Wyai Kay Lee Szu Yung Soo Yin Ling Xavier Limtranslators Catherine Mak Choo Ai Loon Yong Chia Win
❖ executive Director Christopher Fun(Business Development) regional Business S. KrishnamoorthyDevelopment manager
Sales & marketing manager Clay FoomarKetInG rePreSentatIvenextvIeW Sdn Bhd(Co. No. 574271-D)Letter Box No. 8Level 8, Menara TM Asia Life189 Jalan Tun Razak, 50400 Kuala LumpurTel : (603) 2770 9388Fax : (603) 2770 9366PrIntervivar Printing Sdn Bhd (Co. No. 125107-D)Lot 25, Rawang Integrated Industrial Park 48000 Rawang Selangor Darul Ehsan Tel : (03) 6092 7818Fax : (03) 6092 8230DIStrIBUtInG aGentlife Publishers Berhad (10937-w)Tel : (603) 7620 2118 Fax : (603) 7620 2113
w w w . s h a r e s i n v . c o m
MSHE_1-2_Content.indd 2 12/3/09 5:19:14 PM

• editorial desk •
How time flies when you are having fun. It was not a lot of fun some 12 months ago when the world was in the throes
of a financial crisis. Economists and analysts tried to reassure everyone that in 1H09 things will bottom out and a recovery will be seen in 2H09.
As the year draws to a close, we are seeing a gradual recovery and the downslide did not seem to hurt as much as feared – though to many, it did hurt a lot, as unemployment data will attest. If only our economy is as resilient as rubber: it would bounce back in a jiffy!
This issue, we feature an exclusive interview with Minister for Plantation Industries and Commodities, Tan Sri Bernard Giluk Dompok, who shared his views on the rubber industry. It may interest you to know that Malaysia has no intention to regain its crown as the world’s top rubber producer. No, our land resources are too scarce and can be put to better use.
Yet, there are big plans for downstream
rubber industries, which is good news for the manufacturing sector, and in turn, investors in such companies. Find out more in our Perspec-tive article.
Fiscal reforms are also in the pipeline with the impending introduction of the Goods and Services Tax (GST). It will not be for at least another 18 months, but the government has al-ready let on that it will be a low 4% rate, and the GST will replace the current sales and service taxes, which are at a higher 5% to 10%.
Nonetheless, concerns linger regarding its implementation and businesses are particu-larly concerned since the tax is paid upfront for every transaction, and refunds must be claimed to prevent over-taxation. Will there be an adequate system in place to cope with this massive paperwork?
Happy investing and have a prosperous New Year! To our Christian readers, we also bid you a Merry and Blessed Christmas. May there be many great stocks in your stocking!
Clarification:In our November 2009 (#21) edition, the author of the article “What Are Shariah-Compliant Securities?” is the Securities Industry Develop-ment Corporation (SIDC) and not as published. In addition, the website of the Securities Com-mission should read as www.sc.com.my and not www.sc.org.my as printed. We deeply regret the error.
3
MSHE_3_Editorial.indd 3 12/3/09 5:03:47 PM

4
diversify rubber products from NR-base latex products to SR-based industrial rubber goods, especially in automotive and engineering components. Con-sumption of SR is expected to increase to 153,000 tonnes by 2010, 205,000 tonnes in 2015 and 270,000 by 2020.
The Third Industrial Master Plan (3IMP) envisaged the production of seismic bear-ings, rubber fender systems, automotive rubber-metal com-ponents and high-pressure hoses, for example. “The strat-egy is to manufacture high-end specialised products where Malaysia has the compara-tive advantage in research & development support and ex-pertise,” he said.
Since the 1970s, the Ma-laysian Rubber Board (MRB) has been developing rubber seismic bearing technology to be used in earthquake-prone countries. This would protect buildings, people and contents within buildings during earth-quakes. The effectiveness of such technology was evi-dent in Northridge (1994) and Kobe (1995): buildings with such technology withstood the quakes better than those that did not.
“The government is also actively implementing steps to further broaden applications into high value-added and high technology areas, such as engineering, marine, automo-tive, aeronautical and military
applications.“With the rubber products
industry entering a mature phase, and increasing com-petition from countries such as Thailand and China, issues such as creativity, innova-tion, efficiency, cost reduction and product designs will be a priority. Market access and penetration will depend not only on competitive pricing but customised products of high or improved quality,” Tan Sri Bernard explained.
To this end, the Ministry is encouraging R&D and pro-tecting intellectual property (IP). “Intellectual property reg-istration is the first priority. Our Technology Management Office (TMO) is looking for ways to protect our inventions, including the application of laws such as the Patents Act, 1983, Copyright Act 1987, In-dustrial Designs Act 1996 and the Trade Marks Act 1976.
Malaysia used t o be t he world’s big-gest produc-er of natural
rubber. It lost its dominance as the supplier for one-third of the world’s output in 1985 with the country’s shift towards industrialization. The lucrative prices of crude palm oil also led many plantation estates to change crops, favouring oil palm over rubber.
Yet, the rubber industry re-mains important to Malaysia, stressed Minister of Plantation Industries and Commodities, Tan Sri Bernard Giluk Dom-pok, in an exclusive inter-view with Shares Investment (Malaysia).
Malaysia does not aim to re-gain its position as the world’s top producer, he said. “We are constrained by a short-age of labour and competitive land use. Our direction is on value-added industrial and general rubber products,” he explained.
Malaysia is the largest pro-ducer of latex gloves. Global demand for gloves is expected to grow by 10%-12% annually, Tan Sri Bernard said. The de-mand for natural (NR) and syn-thetic (SR) latex is expected to grow in tandem.
In 2008, the domestic rubber industry consumed 603,191 tonnes of rubber, of which 77.7% was natural rubber. The government’s strategy is to
PersPectivetext : Stephen Chin & Paul Yeo
RESILIENT RUBBER
Tan Sri Bernard: The rubber industry remains important to Malaysia
MSHE_4-5_Perspective2.indd 4 12/3/09 5:18:27 PM

5
“The MRB also has an IP committee to ensure IP protection and facilitate the propagation of technologies to authorised stakeholders. The committee oversees IP registration for the MRB and works closely with IP agents to stay up-to-date and avoid ad-ministrative errors in the filing process,” he explained.
The MRB is also guided by the Ministry of Science, Technology and Innovation’s IP Policy which encourages scientists to protect their inven-tions and be rewarded when their R&D findings are suc-cessfully commercialised.
Investments in rubber man-ufacturing have been very encouraging, said Tan Sri Bernard. Investment grew at CAGR of 25.5% from RM328m in 2003 to RM812m in 2007, although total investments dipped to RM696m in 2008 due to unfavourable economic conditions, he explained.
The government offers vari-ous incentives to encourage investment in this sector, such as tax exemptions and allow-ances, incentives for investors producing certain rubber prod-ucts, and incentives for compa-nies setting up manufacturing plants in promoted areas such as Kelantan, Terengganu, Pa-hang, Perlis, Mersing in Johor, Sabah and Sarawak. For in-stance, imported raw materials and machinery or equipment not produced locally are ex-empted from import duty.
PLANTATION STILL A PRIORITY
Rubber planting and har-vesting are still important to
Tan Sri Bernard’s Ministry as they are a main source of income for about 250,000 smallholders in rural areas. “A rubber tree is a virtual Au-tomated Teller Machine. It generates income on tap. Rubber latex and sheet rubber can be stored and sold when needed, unlike palm oil which must be processed almost immediately,” he explained. “Therefore, the government will continue to improve tree and land productivity for areas planted with rubber. “
The MRB is responsible for the development of the Malay-sian rubber industry. Initially, its activities were centred on upstream activities. Since the 1950s, it produced a series of high latex-yielding clones. In recent years, it shifted its focus to produce clones called latex-timber clones that have a high latex yield and produce quality rubber wood.
“Consumers know that rub-ber wood comes from farmed trees. This is appealing to countries that are environ-mentally conscious and want to protect natural rainforests by avoiding hardwood timber,” Tan Sri Bernard explained.
The MRB also developed latex harvesting technology that uses gaseous or chemi-cal stimulation to prolong latex flow; improves tapper productivity; and prolongs the economic life of the trees. “So far, the application of the Low Intensity Tapping System has benefited 85,000 small-holders.
“Tappers can improve yields up to 1,500kg per hectare per annum with Ethephon,
and up to 2,500kg per hect-are per annum with gaseous stimulation,” Tan Sri Bernard explained.
The MRB promotes land and management consolida-tion programs to put uneco-nomic holding sizes under a central and more efficient management. “It is always our policy to encourage large-scale holdings to enjoy econo-mies of scale. Smallholdings are often developed as large blocks and placed under cen-tral management. FELDA, FELCRA, RISDA mini-estates and RRIM Panti are examples of such centralised manage-ment,” he said.
“We also encourage private plantation companies to go back to rubber, by replant-ing their hilly and marginal land (areas that are unsuit-able for oil palm planting) with rubber. Incentives such as Reinvestment Allowance, Accelerated Agricultural Al-lowance, Pioneer Status and Promoted Areas, and high rubber prices have attracted many plantation-based com-panies to do so.
“The government also promotes sustainable forest plantations with monetary and fiscal incentives. In such programs, rubber is the pre-ferred species. The wood can be harvested when the trees are 16-years-old, but from year nine onwards, latex can be tapped to generate income and provide additional raw material to rubber-based industries. This program is administered by Forest Plan-tation Development Sdn Bhd,” he said.
MSHE_4-5_Perspective2.indd 5 12/3/09 5:04:39 PM
6
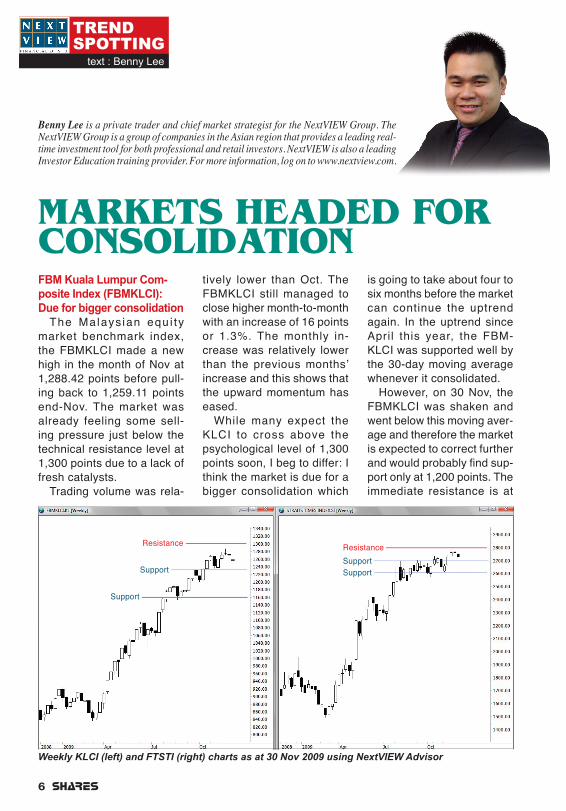
Benny Lee is a private trader and chief market strategist for the NextVIEW Group. The NextVIEW Group is a group of companies in the Asian region that provides a leading real-time investment tool for both professional and retail investors. NextVIEW is also a leading Investor Education training provider. For more information, log on to www.nextview.com.
MARKETS HEADED FOR CONSOLIDATION
tively lower than Oct. The FBMKLCI still managed to close higher month-to-month with an increase of 16 points or 1.3%. The monthly in-crease was relatively lower than the previous months’ increase and this shows that the upward momentum has eased.
While many expect the KLCI to cross above the psychological level of 1,300 points soon, I beg to differ: I think the market is due for a bigger consolidation which
is going to take about four to six months before the market can continue the uptrend again. In the uptrend since April this year, the FBM-KLCI was supported well by the 30-day moving average whenever it consolidated.
However, on 30 Nov, the FBMKLCI was shaken and went below this moving aver-age and therefore the market is expected to correct further and would probably find sup-port only at 1,200 points. The immediate resistance is at
FBM Kuala Lumpur Com-posite Index (FBMKLCI): Due for bigger consolidation
The Malays ian equ i ty market benchmark index, the FBMKLCI made a new high in the month of Nov at 1,288.42 points before pull-ing back to 1,259.11 points end-Nov. The market was already feeling some sell-ing pressure just below the technical resistance level at 1,300 points due to a lack of fresh catalysts.
Trading volume was rela-
Weekly KLCI (left) and FTSTI (right) charts as at 30 Nov 2009 using NextVIEW Advisor
Trend spoTTing
text : Benny Lee
Resistance
Support
Support
ResistanceSupportSupport
MSHE_6-7_TrendSpotting.indd 6 12/3/09 5:05:13 PM

7
(Continues on Pg 9)
1,280 points.
FTSE Straits Times Index (FTSTI): Heading towards immediate support level
I n m i d - N o v, t h e F T-STI managed to test the 2,700-point immediate re-sistance level and rallied to the next resistance level at 2,800 points, climbing to as high as 2803.83 points. How-ever, the market fell steeply in the last two trading days of the month by falling about 70 points or 2.5% to close at 2732.12 points.
On a month- to -month basis, the benchmark in-dex still closed positively by an increase of 81 points or 3%. Trading volume de-clined slightly in the past few months. Investor con-fidence in the market has been weak.
The FTSTI is still in an uptrend and since April this year when the uptrend start-ed, it has been supported by the 60-day moving average.
The moving average is cur-rently at 2,685 points and this should be the immediate support level. The pattern from the chart shows that the market has strong support at 2,600 points.
The FTSTI is expected to head towards the immediate support level before continu-ing the trend. There is still a chance for the benchmark index to climb to the uptrend technical target of 3,000 points but this is unlikely to happen in the next four to six months. Immediate resis-tance level is 2,800 points.
Hong Kong Hang Seng Index (HSI): Stronger bearish pressure
As one of the major financial hubs in Asia, the Hong Kong equity market took a plunge after Dubai announced its problems in paying its debts and sparked fears of another financial crisis.
The HSI gapped down and fell slightly more than
1,000 points or 4.8% on 27 Nov to close at 21,134.50 points. However, the market rebounded at the end of the month to close at 21,821.50 points.
In the middle of Nov, the HSI peaked at 23,100 points, the highest since August last year. Trading volume, which continued to decline slightly in the past few months, was quite high in the last few days of Nov.
The HSI rebounded ex-actly on the 90-day moving average. Since April this year, the HSI was supported by the 60-day moving aver-age but the 27 Nov plunge broke this support level. However, the benchmark index climbed back above the 60-day moving average. The upward momentum for the past three months has been weak. The momentum indicators started its diver-gence from the uptrend since
Resistance
SupportSupport
Weekly HSI (left) and DJI (right) charts as at 30 Nov 2009 using NextVIEW Advisor
Resistance
MSHE_6-7_TrendSpotting.indd 7 12/3/09 5:05:30 PM

8
ness and make Malaysia a more attractive destination for foreign direct investments and businesses.
Whilst businesses gener-ally have the responsibility to account for GST and remit the taxes to the government, the man in the street bears the burden of the tax, Chew Theam Hock, executive di-rector of KPMG, told Shares Investment (Malaysia). “By introducing GST at a low rate, the impact can be softened or managed,” he added.
KPMG executive director, Tan Eng Yew, added that in principle, GST should apply across most goods and ser-vices. “Ideally, GST should not distort investment, production and consumption decisions. As such, it should generally not affect the stock market. Empirically, the introduction of GST In other countries has not had a significant impact on the stock markets,” he explained.
Asked on the likely tax treat-ment that would be applied to the stock market, Tan said the general treatment used in other countries could be adopted here as well:• The issue of shares or
securities – to exempt supply
• Brokerage and other fee-based services – taxable supply
• Late payment interest – exempt supply
Usually, Chew said, GST is
introduced as a package that includes a reduction of income taxes, particularly personal income taxes, and the aboli-tion of some other taxes. “The government has announced the replacement of sales tax and service tax, but has not indicated its plan on personal income tax,” he said.
An ideal GST structure should be broad-based single-rate regime for simplicity’s sake, Chew said. It should also be fixed at a low rate so as not to be too burdensome on the public, and exemption applied for essential items to further ease the burden on the public. However, he added, exemptions should be kept to a minimum as they have a tendency to create complexity and confusion.
Tan suggested that Free Zones or the equivalent be maintained to encourage ex-
After deferring the proposed broad-based G o o d s a n d Services Tax
(GST) during Tun Abdullah Badawi’s tenure as prime minister, the government is finally going ahead with its implementation. It plans to introduce a 4% GST in 2011 and expects to earn RM1b in the first year. The tax legisla-tion is expected to be tabled for first reading in Parliament this month, and may be imple-mented in mid-2011.
Second Finance Minis-ter, Dato’ Seri Ahmad Husni Hanadzlah told Bernama news agency that the GST will not put pressure on prices as it replaces the current sales and services tax, at 5% and 10% respectively. To ease the burden on consumers, staple foods such as rice, sugar, cooking oil and flour will be exempted.
Maybank Investment Bank’s chief economist, Suhaimi Ilias said the GST is needed to reduce the country’s growing dependence on petroleum-based revenues, and to ad-dress the imbalance in the tax structure caused by nar-row-based sales and service taxes; falling revenues from trade-related duties (due to multilateral and bilateral free trade agreements); and a low-ering of direct income taxes to boost economic competitive-
PersPectivetext : Stephen Chin
GST AT 4%
Chew: By introducing GST at a low rate, the impact can be softened or managed
MSHE_8-9_Perspective.indd 8 12/3/09 5:23:37 PM

9
port-based businesses.It is also important for the
government to provide clear transitional rules leading up to the GST’s implementation, he added.
Maybank IB’s Suhaimi said the public must also be edu-cated to ensure a buy-in. He also stressed the importance of having the right systems in place. “The customs depart-ment and corporations must have the right systems in place. So sufficient prepara-tion time is vital, especially for SMEs,” he said.
“Test runs must be done to ensure efficiency of process-ing claims for GST rebates as delays will hurt the cash flow of companies since they pay GST for their inputs and then
claim from the government,” he added.
The Federation of Malay-sian Manufacturers (FMM) voiced the same concerns when it issued a statement in October. “The greatest concern of businesses, in particular, exporters, was the efficiency of refunds. The International Monetary Fund identified the efficiency of the refund mechanism as the Achilles’ heel of any GST system,” it said.
Efficiency depends on the quantum of refunds, the man-power to process the claims and the level of confidence in clearing and issuing re-funds without carrying out pre-refund audits. “As Malay-sia is a highly export-oriented
economy, GST refunds can be as high as 58.3% based on FMM’s estimates in 2005. The promise of refunds within 14 days could be difficult to fulfill,” it said.
Tan: GST should not distort investment, production and consumption decisions
(From Pg 7)
Sept, which indicate stron-ger bearish pressure. This shows strong resistance and there is a little chance for the HSI to move higher above the recent peak of 23,100 points. The HSI may test the 90-day moving average support level again at 21,250 points and if this is broken, the market may continue to move further downwards to the next support level at 20,400 points.
US Dow Jones Industrial Average (DJI): Momentum indicators are neutral
Investors in the US were start led by Dubai ’s debt problems on their national holiday celebrating Thanks-
giving Thursday. The panic caused investors to sel l on Friday and forced the DJI to fall 154.48 points or 1.48% to close at 10,309.92 points. The DJI went as low as 10,231 points intraday before rebounding to close higher.
On the last day of Nov, the DJI slightly rebounded to close at 10,344.84 points. The selling pressure was not as bad as expected despite heavy losses in the Asian and European markets when the US was on holiday: it was buffered by improved consumer spending, jobless claims and home sales.
Trading volume was unex-pectedly low as investors did not rush to sell, but preferred to hold on and wait for further
developments. The DJI is currently still in an uptrend supported strongly by 60-day moving average. The 60-day moving average is currently at 9,900 points and the DJI is expected to pullback to this immediate support level.
Momentum ind ica to rs have gone into the neutral zone, but in the long term, the uptrend is still strong because these indicators are in convergence with the uptrend. If the immediate support level is broken, the DJI may fall further into cor-rection and find support at 9,700 points. However, if the immediate resistance level at 10,500 points is broken, the market may rally strongly to the next resistance level at 10,700 points.
MSHE_8-9_Perspective.indd 9 12/3/09 5:23:52 PM
10
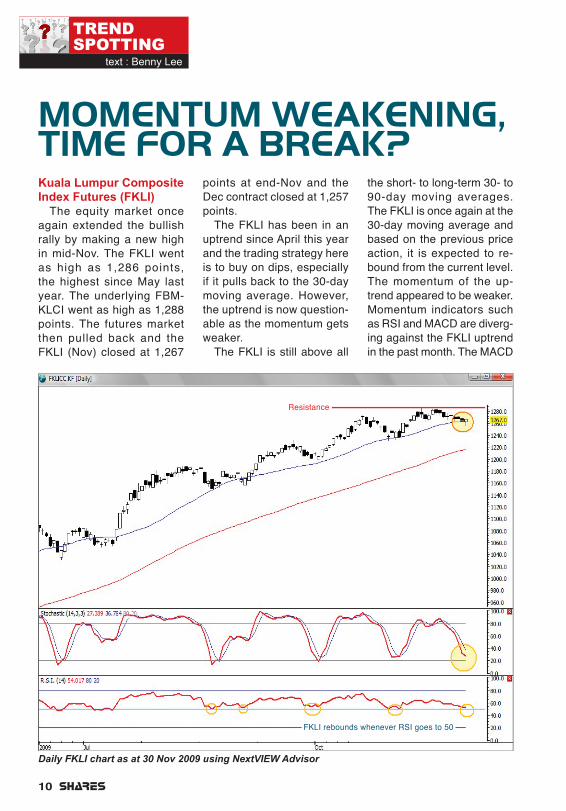
Trend spoTTing
text : Benny Lee
Kuala Lumpur Composite Index Futures (FKLI)
The equity market once again extended the bullish rally by making a new high in mid-Nov. The FKLI went as high as 1,286 points, the highest since May last year. The underlying FBM-KLCI went as high as 1,288 points. The futures market then pulled back and the FKLI (Nov) closed at 1,267
MOMENTUM WEAKENING, TIME FOR A BREAK?
points at end-Nov and the Dec contract closed at 1,257 points.
The FKLI has been in an uptrend since April this year and the trading strategy here is to buy on dips, especially if it pulls back to the 30-day moving average. However, the uptrend is now question-able as the momentum gets weaker.
The FKLI is still above all
the short- to long-term 30- to 90-day moving averages. The FKLI is once again at the 30-day moving average and based on the previous price action, it is expected to re-bound from the current level. The momentum of the up-trend appeared to be weaker. Momentum indicators such as RSI and MACD are diverg-ing against the FKLI uptrend in the past month. The MACD
Daily FKLI chart as at 30 Nov 2009 using NextVIEW Advisor
Resistance
FKLI rebounds whenever RSI goes to 50
MSHE_10-11_NextView.indd 10 12/3/09 5:06:31 PM

11
is currently at its lowest since July. The Stochastic indicator is currently oversold.
We may expect a rebound to happen in the very near term but it may not rally as strongly as before because of a strong resistance at 1,300 points. However, the market may face immediate resistance at 1,280 points. This provides a l itt le po-tential upside if the plan is to go long at current levels between 1,250 and 1,260 points. The immediate sup-port level is at 1,250 points and a stop should be placed below this level.
So, the plan to go long at, say 1,260 points, provides a
potential profit between 20 to 30 points, with a risk of 10 points. It is too early to have a short strategy as the uptrend is still intact.
The Average True Range (ATR) indicator reading is 11 points, which means a stop loss of 15 points should be sufficient. Therefore, trad-ing risk should be 15 points, or stop loss placed at 1,245 points if going long at 1,260 points. The potential reward-to-risk ratio may not be at-tractive in the current situ-ation and I would probably take a rest from trading this month. However, if I were still interested, I would think of going long.
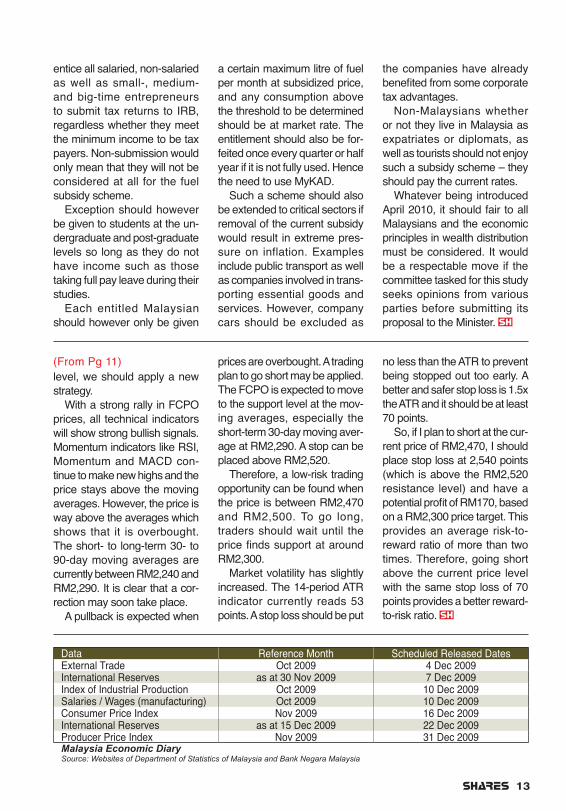
Daily FCPO chart as at 30 Nov 2009 using NextVIEW Advisor
Crude Palm Oil Futures (FCPO)
Just a month ago, the FCPO was at RM2,200 per metric ton and the strategy was to go long with a RM2,400 price target. The price of FCPO went as high as RM2,482 with an intraday high of RM2,521 before pulling back to settle at RM2,472 end-Nov. The re-sistance in Aug was RM2,521 as well and the price fell to RM2,000 in Oct.
The price rally was mainly due to better than expected exports and a rebound in the US dollar. Now that the price has moved to the resistance
(Continues on Pg 13)
Resistance
Averages
MSHE_10-11_NextView.indd 11 12/3/09 5:06:42 PM

12
Just say ittext : Ameer Ali Mohamed
Ameer Ali Mohamed is Director, Financial Research of NextVIEW. He has a total of 20 years experience as a corporate journalist, investment analyst and fund man-ager, including as research head of two stockbroking firms and CEO/CIO of a funds management company.
INTRODUCE NEW FUEL SUBSIDY SCHEME WITH CARE
proper and stringent immigra-tion or check point procedure. In addition, any argument on the price disparity should also include income disparity.
The new fuel subsidy system should take into account its real objective. On one hand it is to reduce the government’s expenditure where RM10b has been allocated on fuel subsidies in the 2010 Budget, on the other it should not be done in a manner that the rich enjoys the benefits more than the poor.
The new system should not mirror the scheme introduced in June 2008 that spanned for one year, it would not serve the purpose in terms of wealth distribution. Under the scheme, those owning cars below 2,000 cc were entitled to a one-time rebate of RM625 when they re-newed their road tax. For those owning cars with 2-litre engines, a RM200 deduction on the road tax payable applied.
Can we assume that those owning motor vehicles of less than 2,000 cc are poorer than those owning cars above that threshold? Definitely not. Just consider these two facts: * A 2.0-litre BMW 320iSE costs
about 2.4 times the price of a 2.5-litre V6 Naza Ria GS (A);
* A 1.8-litre Mercedes Benz E200 costs about both Hon-da Accord 2.4 and Toyota Camry 2.4 combined!There are many more ex-
amples that can be listed. In addition, the rich normally have more than one car and based on the previous scheme, he was entitled to the rebate to as many cars as he owned so long as the engine capacity was less than 2 litres.
If a new subsidy scheme must be introduced, engine capacity should therefore not be the consideration, as it does not serve the purpose of benefiting the rakyat. There are other ways that can be considered.
One of them is the income bracket of car owners. One may argue it would delay the implementation if this approach is adopted due to the need for data accumulation. But the gov-ernment has the Inland Rev-enue Board (IRB) that would be able to provide, not the exact income, but the income range of all who submit their tax returns.
Such an approach would also
Consumers filling up petrol in Malaysia may no longer en-joy fuel subsidy in the present form
if a new subsidy system is in-troduced in the second quarter of next year. Many, especially Malaysians, are waiting to see whether the new system to be introduced is fair to everyone.
Finance Minister II Datuk Seri Ahmad Husni Hanadzlah recently was quoted as saying that the new structure of the fuel subsidy system would be ready by April 2010. The system would enable huge savings on the part of the government.
Among the possibilities, ac-cording to the Minister, are that those in the higher income bracket and tourists would not be eligible for the subsidy. An-other criterion being studied currently is a subsidy system that is benchmarked against the engine size of motor vehicles.
Granted, there is now a dis-parity between petrol and diesel prices in Malaysia and those in neighboring countries such as Thailand and Singapore, but not in Brunei. However, this should not be an issue with a
MSHE_12-13_JustSayIt.indd 12 12/3/09 5:20:14 PM
13
entice all salaried, non-salaried as well as small-, medium- and big-time entrepreneurs to submit tax returns to IRB, regardless whether they meet the minimum income to be tax payers. Non-submission would only mean that they will not be considered at all for the fuel subsidy scheme.
Exception should however be given to students at the un-dergraduate and post-graduate levels so long as they do not have income such as those taking full pay leave during their studies.
Each entitled Malaysian should however only be given
a certain maximum litre of fuel per month at subsidized price, and any consumption above the threshold to be determined should be at market rate. The entitlement should also be for-feited once every quarter or half year if it is not fully used. Hence the need to use MyKAD.
Such a scheme should also be extended to critical sectors if removal of the current subsidy would result in extreme pres-sure on inflation. Examples include public transport as well as companies involved in trans-porting essential goods and services. However, company cars should be excluded as
the companies have already benefited from some corporate tax advantages.
Non-Malaysians whether or not they live in Malaysia as expatriates or diplomats, as well as tourists should not enjoy such a subsidy scheme – they should pay the current rates.
Whatever being introduced April 2010, it should fair to all Malaysians and the economic principles in wealth distribution must be considered. It would be a respectable move if the committee tasked for this study seeks opinions from various parties before submitting its proposal to the Minister.
level, we should apply a new strategy.
With a strong rally in FCPO prices, all technical indicators will show strong bullish signals. Momentum indicators like RSI, Momentum and MACD con-tinue to make new highs and the price stays above the moving averages. However, the price is way above the averages which shows that it is overbought. The short- to long-term 30- to 90-day moving averages are currently between RM2,240 and RM2,290. It is clear that a cor-rection may soon take place.
A pullback is expected when
prices are overbought. A trading plan to go short may be applied. The FCPO is expected to move to the support level at the mov-ing averages, especially the short-term 30-day moving aver-age at RM2,290. A stop can be placed above RM2,520.
Therefore, a low-risk trading opportunity can be found when the price is between RM2,470 and RM2,500. To go long, traders should wait until the price finds support at around RM2,300.
Market volatility has slightly increased. The 14-period ATR indicator currently reads 53 points. A stop loss should be put
no less than the ATR to prevent being stopped out too early. A better and safer stop loss is 1.5x the ATR and it should be at least 70 points.
So, if I plan to short at the cur-rent price of RM2,470, I should place stop loss at 2,540 points (which is above the RM2,520 resistance level) and have a potential profit of RM170, based on a RM2,300 price target. This provides an average risk-to-reward ratio of more than two times. Therefore, going short above the current price level with the same stop loss of 70 points provides a better reward-to-risk ratio.
(From Pg 11)
Data Reference Month Scheduled Released DatesExternal Trade Oct 2009 4 Dec 2009International Reserves as at 30 Nov 2009 7 Dec 2009Index of Industrial Production Oct 2009 10 Dec 2009Salaries / Wages (manufacturing) Oct 2009 10 Dec 2009Consumer Price Index Nov 2009 16 Dec 2009International Reserves as at 15 Dec 2009 22 Dec 2009Producer Price Index Nov 2009 31 Dec 2009Malaysia Economic DiarySource: Websites of Department of Statistics of Malaysia and Bank Negara Malaysia
MSHE_12-13_JustSayIt.indd 13 12/3/09 5:20:29 PM

14
Corporate Digest
text : Stephen Chin
The investability weighting was surprising low, said OSK. “We had assumed a weight-ing of 70%. However, there may be some changes in the computation of this weighting in December and Maxis may be an early reflection of these changes,” it added.
For the relisting, Maxis of-fered 2.25b shares via an offer for sale by its majority shareholders. Institutional in-vestors received a lion’s share of 2.04b (90.7%) shares.
Unlike the previously listed vehicle which included over-seas ventures in India and Indonesia, Maxis Communi-cations Bhd (MCB), the new listed entity comprises only Maxis’ domestic mobile busi-nesses. While this deprives in-vestors of long-term revenue potential, it also removes the strain on Maxis’ cash flow which was previously used to fund overseas expansion, OSK said.
Maxis will be a stock that “provides sustainable and
strong dividend yields similar to listed mobile telcos in mar-kets where growth has leveled off,” OSK Research said.
Maxis chief financial officer, Rossana Annizah Ahmad Rashidi was quoted in the press as aiming to pay out 75% of net profit as dividend.
OSK pointed out that Maxis’ dividend policy is among the more aggressive of Malaysian telcos. TM has a two-pronged dividend payout guidance of a minimum RM700m or 90% of earnings, whichever is higher. Digi has a revised 80% payout target, which translates into respective yields of 7%-8%. “We expect Maxis and Digi to be pitted alongside each other in rewarding shareholders via generous dividends and po-tential capital management,” it said.
The Malaysian mobile tele-communications scene is fiercely competitive. Three major 3G operators, name-ly Celcom, Digi and Maxis, dominate the market with a
Maxis Bhd’s r e l i s t i n g on 19 Nov r a i s e d a great deal
of interest in the local equi-ties market. “It was the biggest IPO for Bursa Malaysia this year, boosting stock mar-ket velocity and breadth in a single stroke,” remarked OSK Research in a report.
Transactions for Maxis shares accounted for almost half of the total transaction value for the entire market on 19 and 20 Nov. On the first trading day, 305.8m Maxis shares worth RM1.6b changed hands.
The significance is not lost on Bursa, as it fast-tracked Maxis’ entry into the FBM KLCI, nudging out Malaysia Airlines. On 20 Nov, Maxis was included in the compos-ite index with an investability weighting of 30% and an im-plied weightage of 2.84%. It was the 11th largest compo-nent of the index.
MAXIMISING A RETURN
MSHE_14-15_CD.indd 14 12/3/09 5:21:05 PM

15
collective 95% market share. In recent years, mobile virtual network operators (MVNOs) have joined the fray but they lack coverage and marketing funds.
OSK projects mobile pen-etration to reach 109% by end-2009 and rising there-after to 118% and 122% in 2010 and 2011 respectively. It also expects subscriber growth to slow from 12% in 2009 to 7% by 2011. “Mobile revenue growth will deceler-ate to low-to-mid-single digit growth by 2011 from the mid-to-high single digit growth in 2009,” it added, citing weak subscriber growth and pres-sure on average revenue per user (ARPU).
The key growth catalyst will come from data and non-voice revenues, it predicted. The data revenue market is projected to grow by a compounded annual growth rate (CAGR) of 20.2% over the next three years, driven by the proliferation of smart phones, higher adoption of wireless broadband and in-creasing use of mobile In-ternet. Broadband market penetration is currently below 30%, said OSK.
Frost & Sullivan reported mobile data revenue in Ma-laysia grew from RM1.57b in 2004 to RM4.41b in 2008, at a CAGR of 29.4%. Over the same period, mobile data revenue doubled to represent 25.3% of the overall industry mobile revenue. OSK esti-mated a CAGR of 25.5% from FY09 to FY12.
Maxis’ overall market share for both prepaid and postpaid
services has been shrinking due to strong competition from Digi and Celcom. “Cel-com’s prepaid additions have overtaken Maxis since 3Q08 due to Celcom’s aggressive acquisition campaigns tar-geted at youths outside the Klang Valley,” OSK noted. Celcom increased its market share by 4%-points over the last eight quarters at Maxis’ expense, said OSK, gaining ground in the youth and en-terprise segments.
Despite voice revenue de-clining due to competitive tariff and a slowing market, Maxis’ data revenue grew by a CAGR of 29% between FY06 and FY08, due to the adoption of 3G mobile servic-es, mobile Internet and wire-less broadband services.
Maxis presently derives about 90% of its revenue from mobile services, with the remainder split between fixed line and international gate-way revenues. In FY08, voice and data revenues accounted for 71% and 29% of mobile revenues respectively.
By 1H09, data revenues grew to represent 31.1% of mobile revenue, compared to Celcom’s 2% and Digi’s 19%. OSK forecasts the proportion of data revenue to widen to 35%-40% over the next two years. “Maxis already has a sizeable proportion of high ARPU for enterprise and data subscribers to support strong growth,” it noted.
Despite being the f irst to launch wireless mobile broadband in Sept 2006, Maxis failed to capitalize on its first-mover advantage
due to network congestion problems. It also lost sub-scribers to competitors who offered cheaper packages and bundled modems, OSK noted. Maxis added 31,000 mobile broadband subscrib-ers in 1H09 compared to Celcom’s 192,000.
Competition is also heating up with the emergence of WiMAX broadband services. Packet One plans to double its subscriber base in the next 12 months with some 700 sites installed nationwide. TM is also due to roll out its high-speed broadband in 1Q10. To mitigate this, Maxis has been continuously upgrading the capacity of its core network and launching more aggres-sive customer retention initia-tives, OSK noted.
Maxis’ management is tar-geting to double its mobile broadband subscriber base (171,200 as at end-2Q09) by the end of 2009. It recently launched a new campaign – “Something for Everyone” with attractive plans ranging from RM8 per day to RM48 per month.
The telco may also mitigate eroding ARPUs by cross-selling voice and data prod-ucts through bundling pack-ages. Maxis is also eyeing the youth segment (15-24 years old) particularly for data services. The segment repre-sented 18.4% of Malaysia’s total population in 2008.
Mobile operators would do well to target areas where mobile penetration is still low, such as the rural markets in East Malaysia and the east coast.
MSHE_14-15_CD.indd 15 12/3/09 5:21:19 PM

Thank you for your support in 2009.
With the management and staff of the Pioneers & Leaders Group,
the Shares Investment family
wishes our readers and their families
a very blessed Christmas and Happy New Year!
Gearing You Towards Investment Success!
™
Full_Ad_2009.indd 3 12/3/09 4:17:06 PM

17
Net NPL was 2.19% (down from 2.44% in June 2009).
The improved outlook has prompted Maybank Investment Bank to upgrade its net profit growth forecasts to 9% p.a. The stock continues to offer good exposure to banking sector recovery, it said.
AMMB is proceeding with plans to acquire MAA’s gen-eral insurance business for RM180m, but will abort its planned 4.9% acquisition of MAA’s takaful insurance sub-sidiary. The deal will make AMMB’s 51%-subsidiary, AmG Insurance, one of Malaysia’s largest general insurers.
Malayan BankingMaybank recorded a 1Q10
net profit of RM881.8m (+54.1% y-o-y; -178.9% q-o-q), on rev-enue of RM3.2b (+54.1% y-o-y; -4.5% q-o-q). On an annualized basis, the 1Q10 results were 24.9% ahead of market con-sensus, said OSK.
The strong results were due
to a 28.7% increase in net inter-est income; a relatively robust annualized loans growth of 11%; a 130.7% y-o-y jump in non-interest income in tandem with an 807.9% surge in invest-ment and trading income; and a 36% increase in commission fee-based income. Therefore, operating profit grew y-o-y de-spite a 125.2% y-o-y increase in loan loss provision.
The results were also partially driven by trading gain of almost RM80m from the sale of gov-ernment securities. This may fall to more normalized levels in subsequent quarters. Maybank also enjoyed a one-off RM25m tax credit at its subsidiary, Bank Internasional Indonesia.
RHB CapitalRHB Capital reported a 3Q09
net profit of RM334.8m (+1.5% y-o-y, +11.0% q-o-q) on rev-enue of RM922.9m (+6.7% y-o-y, -0.5% q-o-q).
OSK said RHB’s annualized 9M09 earnings were 16.5%
AMMB HoldingsAMMB Holdings recorded
2Q10 net profit of RM240.2m (+4.4% y-o-y; -7.0% q-o-q), on revenue of RM845.9m (+25.6% y-o-y, -4.8% q-o-q) due to strong loans growth and low rate of non-performing loans (NPL). This brings 1H10 profit to RM498.4m (+15.1% y-o-y).
The q-o-q drop in revenue (4.8%) and net profit (7.0%) was attributed to 1Q’s surge in bond underwriting fees. The six-month 15.1% growth in net profit came from investment banking while income from retail and business banking was stable.
New loans in 2Q were more than double the previous quar-ter. Loans grew 6.3% in 1H10 from corporate and business segments, especially in bridg-ing loans for mergers and ac-quisitions, and construction projects.
Gross NPL shrank 3.9% in 2Q10 due to write-offs while the formation of new NPL slowed.
compiled : Stephen Chin
INVESTORS’ CORNER
Banking on improved performance
AMMB Holdings (FY Mar 2010) Maybank Investment Bank OSK ResearchResearch dated 18 Nov 2009 9 Nov 2009Forecast EPS 10 (sen) 32.8 30.8PER 10 (x) 14.8 15.7Forecast DPS 10 (sen) 10.2 9.0Div. Yield 10 (%) 2.1 1.9Call Buy BuyTarget price (RM) 5.20 5.35Share price as at 30 Nov, 2009: RM4.85
MSHE_17-19_InvCorner.indd 17 12/2/09 9:12:58 AM

18
and 8.2% above consensus and its own full-year estimates, respectively. This improved performance stemmed from a write-back of RM63m from excess general provisioning and effective cost containment measures. These helped limit RHB’s increase in operating expenses to just 1.9% y-o-y.
RHB’s underlying core per-formance remained robust, OSK noted, despite a chal-lenging macro environment. Pre-provision profits expanded 10.3% y-o-y. On a q-o-q basis, pre-provision profits were 8.6% lower because of 2Q09’s high Islamic income earnings base.
The bank also recorded a 10.0% growth in retail loans, largely on mortgage loans while loans in the corporate business segment grew by a slower 0.8%.
Eastern Pacific Industrial Corp (EPIC)
Despite a lackluster quarter
for the oil & gas sector, EPIC recorded better than expected 9M09 results. According to OSK, EPIC’s 9M09 net profit of RM32.6m (+24.7% y-o-y) on revenue of RM133.9m (-25.5% y-o-y) was 85% of consensus forecasts for the year, and 89% of its own forecasts.
The improved net profit de-spite a drop in revenue were mainly due to effective cost cutting measures by some of its divisions and a lower effective tax rate due to the recognition of some tax allowances. Neverthe-less the lethargy in O&G activi-ties in the quarter is reflected in a 22.1% q-o-q decline in 3Q09 net profit (RM10.8m).
OSK has upgraded EPIC’s FY09-10 earnings forecast by 12% and 13% respectively to reflect its 3Q results. It also anticipated a pick-up in O&G activities with the recent sta-bilization of crude oil prices to above US$70/barrel.
Maybank IB added that it
favored EPIC’s cash cow sup-ply base operations, which was largely unaffected by a slow-down in its 61%-owned Kema-man Port activities and poorer sales at its fabrication and pipe threading operations. Supply base operations accounted for almost 96% of the O&G divi-sion’s pre-tax profit. Valuations are also inexpensive on PER and PBV basis, it added.
Maybank IB noted that EPIC is still in negotiations to acquire IJM Corp’s West Wharf port operations to complement its East Wharf port activities, and that EPIC intends to build an offshore fabrication yard in the next 2-3 years. A budget of RM188m in capex has been allocation for the fabrication year and Phase 3 expansion program.
AirAsiaAirAsia recorded a 3Q09 net
profit of RM130.1m (-127.9% y-o-y, -6.5% q-o-q) on revenue
Malayan Banking (FY Jun 2010) Maybank Investment Bank OSK ResearchResearch dated 13 Nov 2009 13 Nov 2009Forecast EPS 10 (sen) 39.9 41.7PER 10 (x) 16.9 16.2Forecast DPS 10 (sen) 21.2 26.0Div. Yield 10 (%) 3.1 3.1Call Not rated NeutralTarget price (RM) - 6.95Share price as at 30 Nov, 2009: RM6.75
RHB Capital (FY Dec 2009) Maybank Investment Bank OSK ResearchResearch dated 19 Nov 2009 19 Nov 2009Forecast EPS 09 (sen) 53.1 49.1PER 09 (x) 10.0 10.8Forecast DPS 09 (sen) 20.2 21.3Div. Yield 09 (%) 3.8 4.0Call Buy BuyTarget price (RM) 6.40 6.00Share price as at 30 Nov, 2009: RM5.31
MSHE_17-19_InvCorner.indd 18 12/2/09 9:13:10 AM

19
of RM739.7m (+4.5% y-o-y, +12.5% q-o-q). Despite an im-provement in revenue for the quarter, AirAsia’s performance was dragged down by weak economic conditions; concerns over the A(H1N1) pandemic; lower average fares; and higher fuel costs.
Seasonally, 3Q is AirAsia’s weakest quarter but “we are sur-prised by the further contraction in average fares to RM141.60 (-11.5% q-o-q) against the back-drop of escalating fuel costs,” said OSK. The company’s fuel price averaged US$79.30/bar-rel in 3Q (+30.4% q-o-q).
The drop in average fares suggests that the price under-cutting had intensified despite signs of a recovery in the global economy. The continuing up-trend in fuel prices is also a concern as the company’s lat-est fuel hedging contract only covers approximately 20% of the group’s 4Q requirements,
OSK added.Maybank IB said AirAsia has
addressed several key con-cerns by deferring the delivery of 16 out of 45 new aircraft scheduled for 2010-11; raising RM505m from a 16% private placement; and seeking a dual listing in Thailand to raise eq-uity.
The airline is currently in discussions with lead arranger CIMB Group to work out its list-ing details. The exercise could see a separate listing of Thai AirAsia or a merger by inject-ing Thai AirAsia into AirAsia. “A merger would eventually rationalize the current RM438m in inter-company dues Thai AirAsia owes AirAsia,” Maybank IB said.
OSK said it believed the exercise would be a secondary listing without involving any changes to the existing group structure. In some instances, a dual listing may improve a
company’s valuation if it is in a market that offers significantly higher valuation than its pri-mary listed market. However, OSK noted that Thai Airways International is trading at only 16.1x FY09 and 6.9x FY10 EPS, which does not reflect a significant premium to Bursa Malaysia’s valuation.
“We think a direct listing of the Thai unit may be a better option,” OSK said. AirAsia owns 49% of Thai AirAsia and has thus been funding the purchase of the latter’s aircraft, which resulted in the group’s high gearing level. A direct listing would enable the Thai unit to independently secure its own financing in the future, it said. The only major hurdle for this type of listing is Thai AirAsia’s lack of a profit record, as it is still in the red although manage-ment is confident of turning it around by the end of this fiscal year.
EPIC (FY Dec 2009) Maybank Investment Bank OSK ResearchResearch dated 24 Nov 2009 24 Nov 2009Forecast EPS 09 (sen) 25.7 24.4PER 09 (x) 5.8 6.1Forecast DPS 09 (sen) 8.0 8.9Div. Yield 09 (%) 5.4 6.0Call Buy BuyTarget price (RM) 1.95 2.03Share price as at 30 Nov, 2009: RM1.48
AirAsia (FY Dec 2009) Maybank Investment Bank OSK ResearchResearch dated 20 Nov 2009 23 Nov 2009Forecast EPS 09 (sen) 21.0 13.9PER 09 (x) 6.1 9.1Forecast DPS 09 (sen) 0.0 0.0Div. Yield 09 (%) 0.0 0.0Call Hold SellTarget price (RM) 1.35 1.13Share price as at 30 Nov, 2009: RM1.27
MSHE_17-19_InvCorner.indd 19 12/2/09 4:28:58 PM

20
Assuming the over-allot-ment option is not exercised, net proceeds from the offering is expected to be $2.4b, mak-ing it Singapore’s largest IPO since the listing of SingTel. As at press time, the public tranche of the IPO was sub-scribed nearly 5 times.
The pure-play shopping mall company, one of the largest in Asia, will have a total of 59 completed retail properties in 2009 and 86 retail properties by the end of 2012, estimated to be worth $20.3b.
The principal strategy for CapitaMalls is to invest and manage a portfolio of real estate assets used for retail purpose in Asia. Operations
are carried out through 2 seg-ments, the property business whereby the company invests in properties through direct ownership, REITs, joint-ven-tures and private real estate funds and the management segment consisting of fund and mall management.
Upon listing, CapitaLand will retain 65.5% to 70% of CapitaMalls, allowing the latter to access the former’s expertise as well as wide business network.
String Of Pearls
Spanning 48 cities in the countries of Singapore, Ma-laysia, China, Japan and In-dia, CapitaMalls’ portfolio is diverse geographically and
Don’t tel l any-body, San ta Claus dropped by town last week, descend-
ing from his anachronistic transport onto Robinson Point, headquarters of CapitaMalls Asia (CapitaMalls).
Priced at $2.12 apiece or 1.55x P/BV, the initial public offering (IPO) of CapitaMalls attracted a great deal of pent-up demand from retail and institutional investors alike. According to CapitaLand President and Chief Executive Liew Mun Leong, demand for the IPO was robust with US and European institutional in-vestors clamouring for a slice of the pie.
Christmas Comes early For Capitamalls asia
text : Donavan Lim
Across the cAusewAy
MSHE_20-21_ipo.indd 20 12/2/09 9:21:16 AM

21
holds immense potential for development.
Insofar, Singapore with relatively low average retail space per capita (compared to developed economies) is expected to be the anchor market of the company. In time to come, however, top line growth will be fueled by the China and India card.
Initially, CapitaMalls will focus on the Middle Kingdom, accelerating development of malls and actively seeking out opportunities for expansion.
By December 2009, Capita-Malls will have 32 properties in China as compared to 16 in Singapore. In the year 2012, 58% of the company’s prop-erty will be in China.
Such aggressive expan-sion could easily heighten risk for the company. China’s Rmb4 trillion stimulus pack-age has lifted the economic performance of the country and there are valid concerns of a future downturn following the unwinding of the pack-age. In such a scenario, the
bursting of the bubble could drag earnings and in turn divi-dend payouts. FY08 dividend was $0.107 a share.
I n v e s t o r s looking for a sa fe i ncome play could park t h e i r m o n e y in CapitaMall Trust or other S i n g a p o r e -centric REITs such as Suntec REIT. For those seeking cred-i b l e g r o w t h , then Cap i ta -Malls is a bet-ter option.
Growing From Strength To Strength
During the 3 years, FY06 to FY08, CapitaMalls’ top line grew at a CAGR of 44.6%. Nonetheless, FY08’s bottom line was hit by a 48% increase in finance costs, owing to the impact of additional borrowings from CapitaLand in 4Q07 and 2Q08 for financing investment in CapitaRetail China Trust and the China Incubator Fund among other funds.
On an EBIT basis, Singa-pore accounted for the lion share (53.3%) followed by China (28%). For reasons discussed above, China is ex-pected to be the main revenue driver in the future.
9M09 was another bumper period for CapitaMalls. Turn-over rose marginally 5.1% to $206.3m as compared to $196.3m in the corresponding period. But the bottom line surged to $244.5m boosted by a 112% increase in contri-butions from associates and jointly-controlled entities.
Undoubtedly, the floatation of CapitaMalls is a much-need-ed boost for the local equity market in a year where notable listing is a rarity. Investors are advised to examine their port-folio and risk-return profile to assess the suitability of taking a stake in the company.
S$’000 FY06 FY07 FY08 9M08 9M09Revenue 130,843 169,698 273,776 196,332 206,328Gross Profit 53,029 97,575 184,468 132,108 135,621Net Profit 112,342 185,407 156,799 152,512 244,506GPM (%) 40.53 57.50 67.38 67.29 65.73NPM (%) 85.86 109.26 57.27 77.68 118.50
CapitaMalls Asia’s financial highlights
Aggressive expansion ahead
MSHE_20-21_ipo.indd 21 12/2/09 9:21:38 AM

45%Discounts
Up To
Raid / Shares_Msia / msh_fillers / SubscribeForm / SI-msia_msia_BW / SImis_msia_BW.indd
SubScription Form You can now subscribe online at subscribe.SharesInvestment.com
Name: (Dr/Mr/Mdm/Ms)
Company:
Address:
Tel: Fax:
Email:
If you are a current subscriber and would like to renew, please fill in your 6-digit Subscriber ID:
Subscription Term Retail Price Offer Price 4
6 issues (30% discount) RM 72 RM 50
12 issues (35% discount) RM 144 RM 93
24 issues (40% discount) RM 288 RM 172For subscriptions to East Malaysia, please add RM3 per issue for delivery · Shares Investment (Malaysia) is a monthly publication.
English Edition Chinese Edition Commencement Month / Year /
A mustfor serious investors
whicheverway the market goes
MalaysiaEdition
Mail or fax completed form to: Pioneers & Leaders (Malaysia) Sdn BhdLevel 16, Menara Hap SengJalan P. Ramlee50250 Kuala Lumpur, MalaysiaTel : (603) 2782 6865Fax : 03-9236 7333Attn : SI (Malaysia) Subscription
Cheques to be made payable to:Pioneers & Leaders (M) Sdn Bhdor bank directly into:United Overseas Bank (Malaysia) Bhd(A/C 319-3001-2866)A/C payable to: Pioneers & Leaders (M) Sdn Bhd
For bulk subscription & other enquiries:Tel : (603) 7877 8481 / 8482Fax : (603) 7877 8486Email : [email protected]*Overseas postage will be charged separately
SingaporeEdition
ChinaEdition
Subscribe Online and get additional Discounts!!!
SImsia_msia_BW_1.indd 1 12/3/09 4:21:06 PM

Raid / Advertisement / P&L / SH_Wanted / Wanted_Ad_Msia_1.indd
You will be: Writing investment/financial
articles for Shares Investment and SharesInvestment.com, with focus on equities investment.
Conducting interviews with top-managements, and interact with like-minded investors in the industry.
Working in a dynamic team to contribute ideas and drive content/focus for the different platforms.
You’reWanted
Email us your resume and your expected remuneration today to
[email protected]!(Please place “SI(M) -
Contributor” in the subject)
Website: www.sharesinvestment.com • Facebook: Shares Investment • Twitter : sharesinv • Magazine: subscribe.sharesinvestment.com
The only shares investment magazinein Malaysia with English and Mandarin editions,
we’re looking for dynamic, self-driven and
experienced writers
to contribute to Shares Investment as we grow in the region.
Wanted_Ad_Msia_1.indd 1 12/3/09 4:57:42 PM

aaaaaaaaaaaaaaaaaaaaaaaaaaaaaaaaaaaaaaaaaaaaaa
MARKET CAPITALISATION
22 Close in RM, Vol (volume) in ‘00
2 wks Last Mkt CapPage Company...........................Vol Close (‘000)
2 wks Last Mkt CapPage Company...........................Vol Close (‘000)
196 Sime Darby.................................... 565,187 9.06 RM54,445,164149 Malayan Banking .......................... 488,368 6.92 RM48,977,42866 CIMB Group Hldgs ........................ 352,421 13.38 RM47,874,684
184 Public Bank.................................... 175,663 11.40 RM40,263,956151 Maxis ............................................. 415,874 5.33 RM39,975,000
110 IOI Corp.......................................... 840,552 5.59 RM37,247,568210 Tenaga Nasional ........................... 513,243 8.20 RM35,563,400260 MISC .................................................. 9,777 8.50 RM31,618,53893 Genting .......................................... 407,946 7.54 RM27,926,80359 Axiata Group ................................. 726,396 3.16 RM26,686,687
172 PPB Group ....................................... 54,193 16.60 RM19,679,300179 Petronas Gas ................................... 30,963 9.75 RM19,292,637125 Kuala Lumpur Kepong.................... 80,674 17.04 RM18,190,28579 Digi.Com .......................................... 22,195 21.92 RM17,042,80093 Genting M’sia ................................ 333,628 2.88 RM16,997,184
171 PLUS Expressways ....................... 383,301 3.27 RM16,350,00052 AMMB Hldgs ................................. 414,005 5.10 RM14,881,214
222 YTL Corp .......................................... 23,541 7.52 RM14,265,380258 Fraser & Neave Hldgs ....................... 4,357 11.00 RM14,224,584106 Hong Leong Bank............................ 44,623 8.35 RM13,193,893
223 YTL Power Int’l.............................. 375,229 2.20 RM13,002,616257 British American Tobacco ................. 6,096 43.00 RM12,277,790186 RHB Capital...................................... 65,737 5.34 RM11,499,557210 Telekom M’sia ............................... 358,456 3.11 RM10,748,160179 Petronas Dagangan ........................ 27,396 8.79 RM8,732,461
261 Nestlé ................................................ 1,294 34.50 RM8,090,112259 Hong Leong Financial Group........... 15,844 7.52 RM7,916,815146 MMC Corp...................................... 194,315 2.45 RM7,460,397216 UMW Hldgs ..................................... 80,563 6.45 RM7,044,329108 IJM Corp ........................................ 146,218 4.76 RM6,243,920
174 Parkson Hldgs ............................... 105,568 5.96 RM6,177,00458 Astro All Asia Networks PLC......... 121,459 3.21 RM6,163,20062 Berjaya Sports Toto...................... 136,181 4.37 RM5,904,00192 Gamuda ......................................... 886,547 2.84 RM5,706,290
131 Lafarge Malayan Cement ................ 14,183 6.18 RM5,251,115
208 Tanjong PLC .................................... 28,780 17.54 RM5,125,434143 M’sian Airline System ..................... 91,492 2.97 RM4,962,87694 Genting Plantations........................ 98,389 6.43 RM4,865,92881 EON Capital ..................................... 81,002 7.01 RM4,859,395
256 Batu Kawan ....................................... 4,481 10.72 RM4,673,395
256 Berjaya Land...................................... 1,575 3.96 RM4,534,885141 M’sia Airports Hldgs ....................... 66,346 3.98 RM4,378,00065 Bursa M’sia ...................................... 50,307 8.14 RM4,280,712
190 SP Setia............................................ 86,603 4.10 RM4,168,46562 Berjaya Corp.................................. 125,296 1.27 RM4,039,315
216 UEM Land Hldgs ........................... 358,496 1.57 RM3,812,23654 Affin Hldgs ....................................... 96,184 2.55 RM3,810,63656 Alliance Financial Group............. 1,458,021 2.42 RM3,746,41755 AirAsia............................................ 486,712 1.43 RM3,395,120
143 M’sian Bulk Carriers........................ 34,098 3.21 RM3,210,000
213 Top Glove Corp ............................... 55,662 10.52 RM3,195,534195 Shell Refining Co............................. 31,575 10.60 RM3,180,000259 KLCC Ppty Hldgs ............................. 13,383 3.39 RM3,166,51165 Boustead Hldgs ............................... 74,232 3.47 RM3,162,711
118 KNM Group................................. 1,897,754 0.79 RM3,127,168
108 IGB Corp ........................................155,909 1.97 RM2,935,883261 Oriental Hldgs ...................................6,469 5.66 RM2,926,039264 United Plantations ...........................1,115 13.98 RM2,909,713191 SapuraCrest Petroleum ................270,564 2.38 RM2,841,327109 IJM Land .........................................73,115 2.34 RM2,581,647
257 Bintulu Port Hldgs ............................1,439 6.25 RM2,500,000121 Kencana Petroleum ......................241,183 1.58 RM2,425,347263 Star Publications ..............................1,669 3.24 RM2,392,947125 Kulim ...............................................20,172 7.59 RM2,341,151204 TA Global ......................................478,150 0.485 RM2,335,275
207 Tan Chong Motor Hldgs ...............138,591 3.42 RM2,298,240213 Titan Chemicals Corp .....................74,554 1.31 RM2,296,037184 Proton Hldgs ...................................31,408 4.00 RM2,196,852219 WCT ...............................................190,289 2.79 RM2,152,479258 Guinness Anchor ..............................3,077 6.95 RM2,099,581
264 YTL Cement .........................................889 4.26 RM2,089,760109 IJM Plantations ..............................66,093 2.58 RM2,067,462259 Hap Seng Plantations Hldgs ...........35,458 2.50 RM2,000,000260 LPI Capital .........................................2,137 13.98 RM1,939,34878 Dialog Group ................................231,420 1.34 RM1,893,701
161 Multi-Purpose Hldgs ......................85,277 1.89 RM1,818,987256 Aeon Co .............................................9,143 5.15 RM1,807,650159 Mudajaya Group .............................62,955 4.80 RM1,795,20074 DRB-Hicom ......................................52,769 1.04 RM1,788,385
101 Hartalega Hldgs ..............................36,983 6.72 RM1,628,337
154 Media Prima ..................................142,664 1.90 RM1,622,241220 Wah Seong Corp ............................51,310 2.41 RM1,583,370256 Ann Joo Resources ........................13,144 3.01 RM1,573,348259 KFC Hldgs ..........................................5,619 7.88 RM1,562,407259 Hap Seng Consolidated ....................9,014 2.47 RM1,537,970
201 Sunway City ...................................30,461 3.25 RM1,527,338202 Supermax Corp ............................426,378 5.70 RM1,512,039162 NCB Hldgs .......................................30,772 3.10 RM1,457,784144 M’sian Resources Corp .................829,370 1.57 RM1,424,833260 Lingkaran Trans Kota Hldgs ...........10,297 2.85 RM1,416,450
118 KPJ Healthcare ...............................45,872 2.61 RM1,366,732262 QL Resources ..................................14,497 4.01 RM1,323,30060 BIMB Hldgs .....................................15,084 1.24 RM1,322,708
257 Carlsberg Brewery M’sia ..................7,771 4.63 RM1,314,883259 JT Int’l .............................................10,159 4.94 RM1,291,978
203 TA Enterprise ................................273,207 0.75 RM1,283,93376 Damansara Realty ..........................81,009 0.81 RM1,266,336
259 Hong Leong Industries .....................4,957 4.50 RM1,265,157185 Puncak Niaga Hldgs .......................36,697 3.05 RM1,253,986262 Sarawak Oil Palms ...........................3,365 2.92 RM1,248,031
260 M’sian Pacific Industries .................11,442 5.86 RM1,229,92064 Boustead Heavy Industries Corp ......12,427 4.92 RM1,222,413
256 Amway Hldgs ......................................676 7.31 RM1,201,662139 Lion Industries Corp .....................482,544 1.68 RM1,197,785264 UBG ...................................................1,822 2.39 RM1,195,946
148 Mah Sing Group .............................58,780 1.90 RM1,191,007167 OSK Hldgs .......................................90,784 1.76 RM1,184,601181 Pos M’sia .........................................11,149 2.20 RM1,181,457194 Selangor Ppties ................................8,298 3.37 RM1,157,989200 Sunrise ............................................35,482 2.20 RM1,089,858
MEa22_mcap.indd 2010-1-8, 18:021

aaaaaaaaaaaaaaaaaaaaaaaaaaaaaaaaaaaaaaaaaaaaaa
LOWEST P/E
34 Close & EPS (earnings per share) in RM, Yield in %
139 Lion Forest Industries................. 1.29 0.795 --- 1.6221 XiDeLang Hldgs ........................ 0.49 --- --- 3.9105 Hock Lok Siew Corp................. 0.19 0.096 --- 4.0161 Multi Sports Hldgs ................. 0.515 --- --- 4.0221 Xingquan Int’l Sports Hldgs........... 1.18 0.583 --- 4.1
211 Teo Seng Capital .................... 0.465 0.113 3.4 4.1263 Tomei Consolidated ................. 0.51 0.120 4.9 4.2140 London Biscuits ........................ 1.02 0.205 2.9 5.0260 Khind Hldgs............................... 0.98 0.191 5.1 5.1264 Tradewinds ............................... 2.77 0.530 7.2 5.2
180 Poh Huat Resources Hldgs ........ 0.475 0.092 4.2 5.2264 Yee Lee Corp............................. 1.48 0.277 3.4 5.3197 Sinaria Corp .............................. 0.39 --- --- 5.5103 Hing Yiap Group ....................... 1.27 0.227 5.9 5.6260 Lay Hong ................................... 0.85 0.145 1.5 5.9
260 Malayan Flour Mills .................. 3.19 0.539 3.1 5.9263 Tafi Industries ......................... 0.375 0.064 6.0 5.9180 Poh Kong Hldgs ...................... 0.415 0.070 3.4 6.075 DXN Hldgs................................. 0.56 0.089 2.2 6.3
260 LTKM ......................................... 1.37 0.219 5.8 6.3
CONSUMER (15.1)*Last
Page Company.........................Close EPS Yield PE
187 Ranhill........................................ 0.89 0.383 1.1 2.3257 DKLS Industries ........................ 1.06 0.407 2.8 2.6261 Merge Energy............................ 0.38 0.102 --- 3.7258 Grand Hoover............................ 0.21 0.050 --- 4.2261 Melati Ehsan Hldgs................... 0.68 0.117 --- 5.8
263 TRC Synergy ............................. 1.38 0.240 4.3 5.8148 Magna Prima............................. 3.62 0.503 1.4 7.2257 Crest Builder Hldgs................. 0.765 0.099 3.9 7.788 Fajarbaru Builder Group.............. 1.07 0.132 1.4 8.1
262 SBC Corp ................................... 0.52 0.061 2.9 8.6
CONSTRUCTION (16.5)*Last
Page Company.........................Close EPS Yield PE
145 MBF Hldgs................................. 0.54 0.081 --- 3.3263 Syarikat Takaful M’sia ................ 1.35 0.240 5.4 5.6111 Insas .......................................... 0.63 0.075 --- 8.4167 OSK Hldgs ................................. 1.76 0.200 4.3 8.8256 Allianz M’sia.............................. 4.27 0.460 0.5 9.3
256 Aeon Credit Svcs ...................... 3.98 0.406 5.1 9.8186 RHB Capital ............................... 5.34 0.487 3.7 11.0260 Manulife Hldgs.......................... 2.62 0.232 5.0 11.360 BIMB Hldgs................................ 1.24 0.107 1.0 11.6
259 Hong Leong Financial Group ........ 7.52 0.600 3.1 12.5
54 Affin Hldgs................................. 2.55 0.196 2.0 13.0203 TA Enterprise ............................ 0.75 0.064 6.0 14.0106 Hong Leong Bank ..................... 8.35 0.573 2.9 14.6259 Hwang-DBS............................... 1.72 0.118 2.9 14.6184 Public Bank.............................. 11.40 0.731 4.8 15.6
FINANCE (20.7)*Last
Page Company.........................Close EPS Yield PE
132 Landmarks ................................ 1.28 0.131 --- 9.8258 Grand Central Enterprises ........... 0.70 0.066 4.3 10.7263 Shangri-La Hotels .................... 1.85 0.112 4.3 16.5
HOTEL (12.5)*Last
Page Company.........................Close EPS Yield PE
260 M’sia Steel Works .................... 1.02 0.407 2.5 2.5261 Minho ........................................ 0.32 0.121 --- 2.674 DRB-Hicom ............................... 1.04 0.384 2.4 2.7
256 Asia Poly Hldgs ........................ 0.18 0.060 --- 3.0261 Metrod ...................................... 3.30 1.082 3.6 3.0
261 Mentiga Corp ........................... 0.51 0.156 3.9 3.3257 Chuan Huat Resources ............ 0.61 0.182 9.0 3.3264 United U-Li Corp .................... 0.595 0.161 --- 3.7261 PMB Tech ................................. 0.43 0.117 3.5 3.7260 Kia Lim ...................................... 0.23 0.059 --- 3.9
99 HPI Resources .......................... 1.40 0.442 1.4 4.0262 Public Packages Hldgs ............. 0.235 0.057 --- 4.1258 Emas Kiara Industries ................ 0.52 0.128 2.9 4.1260 Lysaght Galvanized Steel ........... 1.43 0.341 3.5 4.2192 Scomi Group ............................ 0.49 0.114 1.0 4.3
264 Ya Horng Electronic ................. 0.71 0.165 7.0 4.3261 Metech Group .......................... 0.30 0.069 --- 4.3262 Seacera Tiles ............................ 0.36 0.076 2.8 4.7182 Prestar Resources .................. 0.605 0.124 2.5 4.9263 Sersol Tech ............................... 0.09 0.018 --- 4.9
261 Muda Hldgs ............................ 0.815 0.155 3.1 5.2133 Leader Universal Hldgs .............. 0.79 0.149 3.8 5.3262 Pelangi Publishing Group ......... 0.475 0.089 5.8 5.368 Cahya Mata Sarawak .............. 1.54 0.290 3.2 5.3
256 Ajiya .......................................... 1.70 0.318 --- 5.3
84 Eksons Corp ............................. 0.85 0.158 --- 5.4257 Bright Packaging Industry ........... 0.23 0.042 --- 5.4114 Jasa Kita ................................... 0.15 0.028 3.3 5.4
INDUSTRIAL PRODUCTS (11.9)*Last
Page Company.........................Close EPS Yield PE
256 Aliran Ihsan Resources .............. 1.30 0.221 --- 5.9260 Lingkaran Trans Kota Hldgs ......... 2.85 1.028 8.8 13.979 Digi.Com ................................. 21.92 1.467 5.0 14.9
223 YTL Power Int’l ........................ 2.20 0.106 6.3 20.8185 Puncak Niaga Hldgs ................ 3.05 0.239 3.3 50.9
INFRASTRUCTURE (17)*Last
Page Company.........................Close EPS Yield PE
MINING(No shares for this issue)
MEa34_pe.indd 2010-1-8, 18:0034

aaaaaaaaaaaaaaaaaaaaaaaaaaaaaaaaaaaaaaaaaaaaaa
LOWEST P/E
35PE derived from company’s latest full year earnings, * denotes industry’s weighted average PE.
263 TDM .......................................... 1.65 0.455 8.5 3.6205 TH Plantations .......................... 1.53 0.345 8.2 4.4260 MHC Plantations....................... 1.22 0.269 2.5 4.580 DutaLand................................. 0.535 0.113 --- 4.769 Cepatwawasan Group ........... 0.985 0.191 2.5 5.2
260 Kurnia Setia............................... 2.60 0.482 5.8 5.465 Boustead Hldgs......................... 3.47 0.889 8.6 5.5
256 BLD Plantation.......................... 3.80 0.687 2.9 5.5261 NPC Resources.......................... 1.88 0.327 4.8 5.7125 Kulim ......................................... 7.59 1.180 2.0 6.4
264 Tradewinds Plantation ............... 1.66 0.252 3.6 6.6258 Far East Hldgs........................... 6.60 0.979 3.8 6.7100 Harn Len Corp......................... 0.795 0.113 2.5 7.0260 Malpac Hldgs ............................ 1.20 0.158 --- 7.6260 Kretam Hldgs ............................ 1.22 0.149 --- 8.2
PLANTATION (17.2)*Last
Page Company.........................Close EPS Yield PE
207 Talam Corp.............................. 0.105 0.031 --- 3.4258 Fima Corp.................................. 2.98 0.693 5.7 4.3256 Bina Darulaman ........................ 0.99 0.226 5.1 4.4262 Plenitude ................................... 2.71 0.591 5.2 4.6259 KSL Hldgs.................................. 1.21 0.257 4.1 4.7
72 Crescendo Corp ........................ 1.09 0.204 6.4 5.3259 KLCC Ppty Hldgs....................... 3.39 0.573 3.1 5.9258 Encorp........................................ 1.00 0.165 5.0 6.1200 Sunrise....................................... 2.20 0.315 1.4 7.0256 Bandar Raya Devts ................... 1.59 0.228 1.9 7.0
120 Keladi Maju ............................. 0.165 0.022 9.1 7.6222 YNH Ppty................................... 1.68 0.218 --- 7.7262 Paramount Corp ....................... 3.04 0.389 5.3 7.8156 Metro Kajang Hldgs.................. 1.44 0.185 3.5 7.8259 Hua Yang................................... 0.77 0.096 3.2 8.1
149 Majuperak Hldgs....................... 0.23 0.027 --- 8.7107 Hunza Ppties ............................. 1.64 0.183 3.4 9.063 Bertam Alliance ........................ 0.26 0.027 5.8 9.8
194 Selangor Ppties......................... 3.37 0.345 3.3 9.8260 Krisassets Hldgs ....................... 3.10 0.297 4.2 10.4
PROPERTY (13.2)*Last
Page Company.........................Close EPS Yield PE
256 AmFirst REIT ............................. 1.06 0.417 8.3 2.5249 Starhill REIT .............................. 0.86 0.302 8.0 2.8247 AL-Hadharah Boustead REIT......... 1.32 0.341 8.4 3.9250 Tower REIT................................ 1.14 0.237 8.2 4.8256 Amanahraya REIT................... 0.845 0.155 8.3 5.4
248 Hektar REIT ............................... 1.13 0.189 9.0 6.0256 Atrium REIT............................. 0.905 0.140 9.3 6.4248 Axis REIT ................................... 1.94 0.248 7.5 7.8
REIT (4.6)*Last
Page Company.........................Close EPS Yield PE
219 Vastalux Energy ..................... 0.175 0.091 5.7 1.9260 Mechmar Corp ......................... 0.19 0.103 --- 1.9130 LCL Corp ................................... 0.20 0.065 --- 3.1214 Tradewinds Corp ..................... 0.65 0.196 1.3 3.388 Fitters Diversified .................... 0.56 0.167 --- 3.4
259 Ipmuda ...................................... 0.67 0.193 4.5 3.5264 Yinson Hldgs ............................ 0.68 0.187 3.7 3.687 Faber Group ............................. 1.60 0.429 2.5 3.7
188 SAAG Consolidated ............... 0.175 0.047 --- 3.7226 Asia Bioenergy Technologies ........ 0.10 0.022 --- 4.5
263 TASCO ...................................... 0.87 0.184 --- 4.7126 Kumpulan Fima ........................ 0.84 0.177 3.6 4.7259 Hap Seng Consolidated ............. 2.47 0.504 4.9 4.9256 ATIS Corp ............................... 0.945 0.192 --- 4.9206 TSM Global .............................. 2.12 0.421 2.4 5.0
257 Complete Logistics Svcs ............. 0.54 0.106 11.1 5.1259 Kamdar Group ....................... 0.345 0.068 --- 5.1259 Harbour-Link Group ................ 0.74 0.144 2.7 5.1193 Scomi Marine ........................... 0.48 0.089 2.9 5.4260 MBM Resources ....................... 2.60 0.485 4.6 5.4
257 Cheetah Hldgs ........................ 0.555 0.099 5.4 5.6178 Petra Perdana ........................... 1.67 0.285 1.2 5.9174 Pantech Group Hldgs ............ 0.945 0.159 3.0 5.9258 Fiamma Hldgs .......................... 0.70 0.116 5.7 6.0259 Harrisons Hldgs ....................... 2.07 0.341 4.3 6.1
TRADE/SERVICE (19.3)*Last
Page Company.........................Close EPS Yield PE
239 Mangotone Group ................. 0.025 0.007 --- 3.4259 Heitech Padu ............................ 1.07 0.296 15.0 3.6256 Asdion ....................................... 0.32 0.079 --- 4.0258 Genetec Tech ........................... 0.35 0.070 5.7 5.0264 Tricubes .................................... 0.12 0.023 --- 5.3
238 MEMS Tech .............................. 0.07 0.011 --- 6.6237 M3 Tech (Asia) ....................... 0.225 0.033 8.9 6.9261 Microlink Solutions ............... 0.135 0.018 7.4 7.4245 Tejari Technologies ................. 0.14 0.019 --- 7.4259 K-One Tech ............................. 0.405 0.054 --- 7.5
85 Eng Teknologi Hldgs ............... 1.76 0.205 3.4 8.6245 Technodex ................................ 0.38 0.043 --- 8.8243 Opensys .................................... 0.12 0.014 --- 8.9261 Mikro MSC ............................... 0.17 0.027 2.5 9.0264 Vitrox Corp ............................... 0.49 0.054 0.8 9.1
259 KESM Industries ...................... 2.08 0.227 1.4 9.2258 Excel Force MSC ...................... 0.40 0.043 6.3 9.3261 PUC Founder (MSC) ................ 0.10 0.010 --- 9.694 Globetronics Tech ................... 0.90 0.017 5.0 10.8
264 Willowglen MSC ...................... 0.35 0.033 5.7 10.8
166 Notion Vtec .............................. 3.01 0.256 1.0 11.8258 Elsoft Research ...................... 0.455 0.037 4.4 12.3228 DSC Solutions .......................... 0.32 --- --- 13.3230 ETI Tech Corp ......................... 0.415 0.089 --- 14.0227 CBS Tech .................................. 0.54 0.038 --- 14.4
TECHNOLOGY (18.8)*Last
Page Company.........................Close EPS Yield PE
MEa34_pe.indd 2010-1-8, 18:0035

aaaaaaaaaaaaaaaaaaaaaaaaaaaaaaaaaaaaaaaaaaaaaa
HIGHEST YIELD
36 Dividend yield does not include special dividends
259 JayCorp ......................................... 0.775 0.0875 8.6 11.3258 Eurospan Hldgs .............................. 0.98 0.11 11.7 11.2258 Eng Kah Corp.................................. 2.37 0.30 13.0 10.5263 Teo Guan Lee Corp ........................ 1.10 0.10 6.5 9.1166 Ni Hsin Resources ........................ 0.235 0.02 8.9 8.5
258 Formosa Prosonic Industries ......... 0.685 0.055 12.1 8.0264 Yeo Hiap Seng ................................ 1.42 0.11 97.8 7.7256 Apollo Food Hldgs.......................... 2.78 0.20 10.6 7.2264 Tradewinds ..................................... 2.77 0.20 5.2 7.2225 Zhulian Corp ................................... 1.65 0.11 7.6 6.7
264 UPA Corp ........................................ 1.50 0.10 6.6 6.7258 Golden Pharos ................................ 0.28 0.0185 6.8 6.6258 Emivest ......................................... 0.625 0.04 6.7 6.4257 CCM Duopharma Biotech.............. 2.41 0.15 12.3 6.2257 British American Tobacco ........... 43.00 2.65 15.1 6.2
257 Classic Scenic ............................... 0.485 0.03 7.5 6.2261 Mintye Industries ........................... 1.00 0.06 35.0 6.0263 Tafi Industries............................... 0.375 0.0225 5.9 6.0256 Acoustech ....................................... 0.76 0.045 15.8 5.9258 Guinness Anchor............................ 6.95 0.41 14.8 5.9
CONSUMERLast
Page Company.........................Close Div PE YIELD
262 Protasco .......................................... 0.93 0.08054 10.4 8.7262 Pintaras Jaya .................................. 1.36 0.10 9.5 7.4260 Ken Hldgs...................................... 0.705 0.04 10.8 5.7259 Ireka Corp...................................... 0.765 0.0435 14.5 5.7257 Bina Puri Hldgs ............................... 0.81 0.04 19.3 4.9
263 TRC Synergy ................................... 1.38 0.06 5.8 4.3257 Brem Hldg ....................................... 1.21 0.05 10.9 4.1257 Crest Builder Hldgs ...................... 0.765 0.03 7.7 3.9258 Ekovest............................................ 1.48 0.05 28.6 3.4219 WCT ................................................ 2.79 0.095 21.2 3.4
CONSTRUCTIONLast
Page Company.........................Close Div PE YIELD
260 LPI Capital ..................................... 13.98 0.28 18.6 6.1203 TA Enterprise.................................. 0.75 0.045 14.0 6.0263 Syarikat Takaful M’sia ................... 1.35 0.0725 5.6 5.4256 Aeon Credit Svcs............................ 3.98 0.201 9.8 5.1260 Manulife Hldgs ............................... 2.62 0.13 11.3 5.0
184 Public Bank ................................... 11.40 0.55 15.6 4.8167 OSK Hldgs....................................... 1.76 0.075 8.8 4.3186 RHB Capital..................................... 5.34 0.196 11.0 3.7260 MNRB Hldgs ................................... 3.00 0.10 28.2 3.381 ECM Libra Financial Group........... 0.655 0.02 106.6 3.1
259 Hong Leong Financial Group.......... 7.52 0.23 12.5 3.165 Bursa M’sia ..................................... 8.14 0.243 41.0 3.0
259 Hwang-DBS .................................... 1.72 0.05 14.6 2.9142 M’sia Building Society ................... 1.02 0.03 21.9 2.9106 Hong Leong Bank........................... 8.35 0.24 14.6 2.9
FINANCELast
Page Company.........................Close Div PE YIELD
263 Shangri-La Hotels ......................... 1.85 0.08 16.5 4.3258 Grand Central Enterprises ............. 0.70 0.03 10.7 4.3
HOTELLast
Page Company.........................Close Div PE YIELD
264 Weida ............................................. 0.67 0.075 6.5 11.2257 Chuan Huat Resources ................. 0.61 0.055 3.3 9.0263 Tien Wah Press Hldgs ................... 1.80 0.154 6.6 8.6217 Uchi Tech ....................................... 1.40 0.12 8.9 8.6264 Yi-Lai ............................................ 0.705 0.06 8.6 8.5
262 Scanwolf Corp ............................... 0.37 0.03 22.2 8.1257 CYL Corp ........................................ 0.52 0.04 8.9 7.7264 Ya Horng Electronic ...................... 0.71 0.05 4.3 7.0264 UAC ................................................ 3.30 0.22 19.1 6.7257 Century Bond .............................. 0.615 0.04 6.0 6.5
258 Greenyield ................................... 0.235 0.015 9.7 6.4257 Chemical Co of M’sia .................... 2.29 0.1465 14.2 6.467 CSC Steel Hldgs ............................ 1.36 0.085 8.8 6.3
258 Furniweb Industrial Pdts ............ 0.475 0.03 6.7 6.3198 Southern Steel .............................. 2.01 0.125 7.9 6.2
262 Perusahaan Sadur Timah M’sia ..... 3.27 0.20 10.1 6.1258 Golden Frontier ............................. 1.14 0.07 5.5 6.1261 OKA Corp ..................................... 0.665 0.04 9.9 6.0262 Pelangi Publishing Group .......... 0.475 0.0275 5.3 5.8193 Sealink Int’l .................................. 0.685 0.04 5.9 5.8
259 Hexza Corp .................................... 0.60 0.035 17.2 5.8260 Magni-Tech Industries .................. 0.88 0.05 7.6 5.7262 Sapura Industrial ........................ 0.525 0.03 6.8 5.7130 LCTH Corp ................................... 0.315 0.0175 5.6 5.6256 Advanced Packaging Tech ........... 0.84 0.045 29.9 5.4
263 Tekala Corp ................................... 0.74 0.04 12.2 5.4256 APB Resources .............................. 1.22 0.065 5.9 5.3179 Petronas Gas ................................. 9.75 0.50 20.8 5.1257 Box-Pak ........................................ 0.985 0.05 9.1 5.1
INDUSTRIAL PRODUCTSLast
Page Company.........................Close Div PE YIELD
260 Lingkaran Trans Kota Hldgs .......... 2.85 0.25 13.9 8.8223 YTL Power Int’l .............................. 2.20 0.13875 20.8 6.379 Digi.Com ...................................... 21.92 1.88 14.9 5.0
185 Puncak Niaga Hldgs ...................... 3.05 0.10 50.9 3.3
INFRASTRUCTURELast
Page Company.........................Close Div PE YIELD
MINING(No Yield)
MEa36_yield.indd 2010-1-8, 18:1536

aaaaaaaaaaaaaaaaaaaaaaaaaaaaaaaaaaaaaaaaaaaaaa
HIGHEST YIELD
37Yield in %, Yield = (Full Year Dividend Per Shr / Shr Price) x 100
261 Negri Sembilan Oil Palms ............. 4.24 0.40 18.0 9.465 Boustead Hldgs .............................. 3.47 0.30 5.5 8.6
263 TDM ................................................ 1.65 0.14 3.6 8.5205 TH Plantations ................................ 1.53 0.175 4.4 8.2122 Kim Loong Resources .................... 2.18 0.36 10.1 6.0
260 Kurnia Setia .................................... 2.60 0.15 5.4 5.8264 United Malacca............................... 8.00 0.40 15.0 5.0262 Sarawak Plantation........................ 2.22 0.11 12.2 5.0264 Unico-Desa Plantations ................. 0.81 0.04 12.6 4.9261 NPC Resources ............................... 1.88 0.09 5.7 4.8
257 Chin Teck Plantations .................... 7.65 0.35 15.1 4.6262 Riverview Rubber Estates ............. 2.37 0.20 12.8 4.2259 Hap Seng Plantations Hldgs........... 2.50 0.10 15.3 4.0258 Far East Hldgs................................. 6.60 0.325 6.7 3.8256 Batu Kawan .................................. 10.72 0.40 13.9 3.7
PLANTATIONLast
Page Company.........................Close Div PE YIELD
120 Keladi Maju ................................... 0.165 0.015 7.6 9.1261 Oriental Interest ............................. 1.35 0.10 14.1 7.4257 Daiman Devt ................................... 1.52 0.10 15.1 6.672 Crescendo Corp .............................. 1.09 0.07 5.3 6.463 Bertam Alliance .............................. 0.26 0.015 9.8 5.8
258 Fima Corp........................................ 2.98 0.17 4.3 5.7262 Paramount Corp ............................. 3.04 0.21 7.8 5.3262 Plenitude ......................................... 2.71 0.14 4.6 5.2256 Bina Darulaman.............................. 0.99 0.05 4.4 5.1258 Encorp ............................................. 1.00 0.05 6.1 5.0
262 SHL Consolidated........................... 1.25 0.06 13.8 4.8163 Naim Hldgs ..................................... 2.98 0.13 11.9 4.496 Gromutual....................................... 0.23 0.01 11.0 4.3
260 Krisassets Hldgs ............................. 3.10 0.13 10.4 4.2148 Mah Sing Group ............................. 1.90 0.08 12.8 4.2
259 KSL Hldgs........................................ 1.21 0.05 4.7 4.195 Glomac ............................................ 1.45 0.07 13.3 4.1
190 SP Setia........................................... 4.10 0.17 19.5 4.1263 TAHPS Group ................................. 3.16 0.1225 10.8 3.9170 PJ Devt Hldgs ............................... 0.765 0.03 15.4 3.9
PROPERTYLast
Page Company.........................Close Div PE YIELD
256 Atrium REIT .................................. 0.905 0.084 6.4 9.3248 Hektar REIT ..................................... 1.13 0.102 6.0 9.0247 AL-Hadharah Boustead REIT .......... 1.32 0.1103 3.9 8.4256 AmFirst REIT................................... 1.06 0.08748 2.5 8.3256 Amanahraya REIT......................... 0.845 0.070107 5.4 8.3
250 Tower REIT ..................................... 1.14 0.0935 4.8 8.2247 AL-’Aqar KPJ REIT........................ 0.985 0.081 10.5 8.2249 Starhill REIT .................................... 0.86 0.069121 2.8 8.0
REITLast
Page Company.........................Close Div PE YIELD
143 M’sian Bulk Carriers ..................... 3.21 0.40 7.0 12.5257 Complete Logistics Svcs .............. 0.54 0.06 5.1 11.1263 Seni Jaya Corp .............................. 0.53 0.05 35.6 9.4210 Telekom M’sia ............................... 3.11 0.2625 13.6 8.477 Dayang Enterprise Hldgs ............. 1.81 0.14 9.1 7.7
257 CNI Hldgs ..................................... 0.235 0.018 9.6 7.762 Berjaya Sports Toto ...................... 4.37 0.29 14.4 6.6
257 Deleum ........................................... 1.69 0.11 7.3 6.5261 Nationwide Express Courier Svcs ..... 0.73 0.045 20.5 6.2263 Suiwah Corp .................................. 1.30 0.08 7.4 6.2
262 Pharmaniaga ................................. 4.40 0.27 7.8 6.1244 Scicom (MSC) ................................ 0.42 0.025 12.8 6.0258 Fiamma Hldgs ............................... 0.70 0.04 6.0 5.7219 Vastalux Energy .......................... 0.175 0.01 1.9 5.7257 Eastern Pacific Industrial Corp .......... 1.57 0.09 12.0 5.7
258 Freight Mgt Hldgs ....................... 0.805 0.045 7.2 5.6261 PBA Hldgs .................................... 0.885 0.05 9.4 5.6162 NCB Hldgs ..................................... 3.10 0.25 9.4 5.5257 Bintulu Port Hldgs ........................ 6.25 0.4095 16.6 5.4257 Cheetah Hldgs ............................. 0.555 0.03 5.6 5.4
161 Multi-Purpose Hldgs ..................... 1.89 0.10 13.5 5.3208 Tanjong PLC ................................ 17.54 0.90 11.1 5.1179 Petronas Dagangan ...................... 8.79 0.45 15.1 5.1258 Esthetics Int’l Group ................... 0.595 0.03 7.4 5.099 Hai-O Enterprise ............................ 8.47 0.42 13.7 5.0
259 Hap Seng Consolidated ................ 2.47 0.12 4.9 4.9171 PLUS Expressways ....................... 3.27 0.16 15.1 4.9264 Unimech Group ............................. 0.76 0.037 8.1 4.9261 NV Multi Corp ............................... 0.61 0.03 11.5 4.9
TRADE/SERVICELast
Page Company.........................Close Div PE YIELD
259 Heitech Padu ................................. 1.07 0.16 3.6 15.0259 JHM Consolidation ..................... 0.195 0.025 295.9 12.8261 Mesiniaga ...................................... 1.83 0.19 14.8 10.4237 M3 Tech (Asia) ............................ 0.225 0.02 6.9 8.9261 Microlink Solutions .................... 0.135 0.01 7.4 7.4
258 Excel Force MSC ........................... 0.40 0.025 9.3 6.3262 Rexit ............................................... 0.60 0.035 16.4 5.8264 Willowglen MSC ........................... 0.35 0.02 10.8 5.7258 Genetec Tech ................................ 0.35 0.02 5.0 5.794 Globetronics Tech ......................... 0.90 0.02 10.8 5.0
258 Elsoft Research ........................... 0.455 0.02 12.3 4.485 Eng Teknologi Hldgs .................... 1.76 0.06 8.6 3.4
263 Solution Engrg Hldgs ................. 0.175 0.005 22.2 2.9260 Kobay Tech .................................... 0.69 0.02 30.3 2.9261 Mikro MSC ..................................... 0.17 0.006 9.0 2.5
259 KESM Industries ........................... 2.08 0.03 9.2 1.4217 Unisem ........................................... 1.94 0.025 46.1 1.3166 Notion Vtec ................................... 3.01 0.03 11.8 1.0264 Vitrox Corp .................................... 0.49 0.011 9.1 0.872 D&O Ventures ............................. 0.705 0.0035 37.1 0.5
TECHNOLOGYLast
Page Company.........................Close Div PE YIELD
MEa36_yield.indd 2010-1-8, 18:1537

aaaaaaaaaaaaaaaaaaaaaaaaaaaaaaaaaaaaaaaaaaaaaa
PERFORMANCE OF RECENT LISTINGS
MAIN MARKET
48 Close in $ in their respective currencies
Premium/Date of No of Shares Offer 1st Day Last Discount vs
Page Company......................................... Listing Offered (m) Price Closing Done IPO Price (%) High Low PE IPO Manager
224 Yoong Onn Corp................................ 23-12-09 25.17 0.88 0.90 0.845 -3.98 0.93 0.815 7.3 Public Invs Bank204 TA Global ........................................... 23-11-09 460.00 0.50 0.475 0.485 -3.00 0.52 0.41 25.1 AmInvestment Bank151 Maxis ................................................. 19-11-09 2250.00 4.75 5.42 5.33 12.21 5.50 5.20 16.7 CIMB Invs Bank197 Sinaria Corp ....................................... 12-11-09 24.00 0.56 0.51 0.39 -30.36 0.645 0.34 5.5 OSK Invs Bank221 XiDeLang Hldgs................................. 11-11-09 100.00 0.58 0.63 0.49 -15.52 0.765 0.485 3.9 OSK Invs Bank
159 Muar Ban Lee Group......................... 28-10-09 21.00 0.65 0.72 0.61 -6.15 0.815 0.535 14.0 Maybank259 Halex Hldgs........................................ 16-09-09 10.00 0.78 0.94 0.695 -10.90 1.00 0.63 9.1 OSK Invs Bank204 TAS Offshore ..................................... 28-08-09 77.00 0.90 0.87 0.715 -20.56 0.99 0.675 8.0 OSK Invs Bank161 Multi Sports Hldgs ............................ 19-08-09 100.10 0.85 0.765 0.515 -39.41 0.89 0.475 4.0 AmInvestment Bank100 Handal Resources.............................. 30-07-09 18.50 0.72 1.16 0.87 20.83 1.47 0.75 8.5 OSK Invs Bank
221 Xingquan Int’l Sports Hldgs .............. 10-07-09 99.50 2.10 1.78 1.18 -43.81 1.91 1.16 4.1 CIMB Invs Bank191 Samchem Hldgs ................................ 23-06-09 21.36 0.71 0.90 0.835 17.61 0.965 0.685 9.3 RHB Invs Bank258 Fibon .................................................. 18-12-08 71.00 2.73 0.80 1.00 -63.37 1.23 0.455 11.8 Alliance Invs Bank216 UEM Land Hldgs................................ 18-11-08 ---- ---- 0.575 1.57 ---- 2.01 0.50 51.4 CIMB Invs Bank211 Teo Seng Capital ............................... 29-10-08 38.61 0.45 0.36 0.465 3.33 0.555 0.195 4.1 HwangDBS Invs Bank
219 Vastalux Energy ................................ 12-09-08 57.23 0.75 0.525 0.175 -76.67 0.70 0.14 1.9 KAF Invs Bank178 Perwaja Hldgs.................................... 20-08-08 150.00 2.90 2.48 1.40 -51.72 2.80 0.59 8.7 RHB Invs Bank193 Sealink Int’l ........................................ 29-07-08 113.37 1.25 1.09 0.685 -45.20 1.19 0.31 5.9 AmInvestment Bank218 Uzma ................................................. 29-07-08 28.00 1.90 1.97 1.78 -6.32 2.06 1.20 13.2 AmInvestment Bank141 Luxchem Corp ................................... 27-06-08 20.00 1.10 0.78 1.14 3.64 1.23 0.55 8.3 AmInvestment Bank
77 Dayang Enterprise Hldgs................. 28-04-08 85.87 1.45 1.53 1.81 24.83 1.90 0.60 9.1 AmInvestment Bank101 Hartalega Hldgs................................. 17-04-08 24.21 1.80 1.91 6.72 273.33 6.90 1.30 19.3 RHB Invs Bank258 Ewein ................................................. 28-03-08 25.12 0.70 0.995 0.90 28.57 1.18 0.72 10.0 Alliance Invs Bank262 SLP Resources ................................... 12-03-08 26.00 0.85 0.89 1.20 41.18 1.20 0.70 24.3 AmInvestment Bank262 SCGM ................................................. 28-02-08 12.00 0.78 0.78 0.51 -34.62 0.795 0.405 7.2 Public Invs Bank
121 Key Asic.............................................. 31-01-08 202.00 0.40 0.415 0.47 17.50 0.825 0.26 19.5 CIMB Invs Bank263 Signature Int’l.................................... 24-01-08 17.69 1.25 1.05 1.63 30.40 1.71 0.95 6.5 Alliance Invs Bank264 WZ Steel............................................. 02-01-08 15.00 0.68 0.66 0.335 -50.74 0.725 0.125 19.5 Kenanga Invs Bank263 TASCO................................................ 28-12-07 25.20 1.10 1.26 0.87 -20.91 1.40 0.53 4.7 AmInvestment Bank256 Aeon Credit Svcs............................... 12-12-07 22.00 2.50 3.34 3.98 59.20 4.84 2.40 9.8 CIMB Invs Bank
257 Bio Osmo ........................................... 05-12-07 37.01 0.33 0.285 0.18 -45.45 0.35 0.035 ---- Alliance Invs Bank256 BHS Industries................................... 20-11-07 20.00 0.68 0.75 0.815 19.85 0.87 0.295 9.9 Public Invs Bank259 Hap Seng Plantations Hldgs.............. 16-11-07 300.00 2.65 3.06 2.50 -5.66 3.78 1.25 15.3 CIMB Invs Bank264 Voir Hldgs .......................................... 24-10-07 11.75 1.91 1.89 1.32 -30.89 1.60 1.20 8.0 CIMB Invs Bank257 Complete Logistics Svcs ................. 30-08-07 30.67 1.00 1.19 0.54 -46.00 1.50 0.17 5.1 MIBM Invs Bank
262 Sarawak Plantation........................... 28-08-07 39.75 3.00 3.20 2.22 -26.00 4.20 1.53 12.2 CIMB Invs Bank262 Petra Energy ...................................... 26-07-07 46.00 2.62 4.92 1.71 -34.73 5.60 0.88 7.9 Alliance Invs Bank
ACE MARKET
228 DSC Solutions ................................... 09-12-09 12.58 0.50 0.745 0.32 -36.00 0.915 0.305 13.3 Kenanga Invs Bank259 Kelington Group................................ 25-11-09 9.71 0.53 0.635 0.635 19.81 0.90 0.58 7.2 Kenanga Invs Bank226 Asia Bioenergy Technologies............ 12-12-08 130.00 0.43 0.28 0.10 -76.74 0.41 0.07 4.5 Kenanga Invs Bank263 Sunzen Biotech ................................. 08-10-08 25.00 0.32 0.28 0.23 -28.13 0.39 0.11 17.4 Public Invs Bank259 Innity Corp ......................................... 30-06-08 17.00 0.55 0.265 0.14 -74.55 0.295 0.11 42.3 RHB Invs Bank
259 JF Technology ................................... 16-04-08 34.79 0.40 0.325 0.26 -35.00 0.405 0.145 ---- HwangDBS Invs Bank263 TFP Solns ........................................... 22-02-08 24.00 0.48 0.275 0.155 -67.71 0.37 0.065 101.0 Kenanga Invs bank246 Winsun Tech ...................................... 22-01-08 30.00 0.85 0.345 0.075 -91.18 0.48 0.04 34.4 Public Invs Bank
MEa48_ipo.indd 2010-1-8, 18:311

aaaaaaaaaaaaaaaaaaaaaaaaaaaaaaaaaaaaaaaaaaaaaa
DISCOUNT TO NAV*(NAV is updated when company announces results.)
49* Refers to the trading of a company’s shares at below its NAV
Last DiscountPage Company..................................Close NAV (%)
Last DiscountPage Company..................................Close NAV (%)
256 Baneng Hldgs..................................... 0.165 1.26 86.9261 Nilai Resources Group ........................ 0.58 3.53 83.6262 SHH Resources Hldgs.......................... 0.22 1.30 83.1261 Minho.................................................... 0.32 1.83 82.5101 Harvest Court Industries..................... 0.20 1.143 82.5
258 Focal Aims Hldgs................................. 0.21 1.19 82.4258 Golsta Synergy .................................. 0.215 1.223 82.4149 Majuperak Hldgs.................................. 0.23 1.31 82.453 Advance Synergy................................. 0.16 0.902 82.3
262 Petaling Tin .......................................... 0.19 1.07 82.2
264 Wijaya Baru Global............................ 0.245 1.37 82.1164 Nam Fatt Corp ................................... 0.315 1.71 81.6263 Stone Master Corp ............................ 0.155 0.8381 81.5260 Komarkcorp........................................ 0.275 1.44 80.9120 Karambunai Corp............................... 0.075 0.39 80.8
262 SBC Corp .............................................. 0.52 2.70 80.797 Gula Perak............................................ 0.06 0.31 80.6
261 PW Consolidated ................................. 0.43 2.13 79.8261 PCCS Group ......................................... 0.45 2.165 79.2151 Maxbiz Corp......................................... 0.07 0.33 78.8
264 Yong Tai ............................................... 0.26 1.22 78.7176 Perak Corp............................................ 0.85 3.90 78.2257 EG Industries........................................ 0.43 1.96 78.1119 KPS Consortium ................................ 0.225 1.01 77.7261 Metech Group...................................... 0.30 1.34 77.6
258 FACB Industries Incorp ..................... 0.465 2.06 77.4259 Jerasia Capital ..................................... 0.30 1.27 76.4262 Pasdec Hldgs........................................ 0.40 1.69 76.3257 Country Heights Hldgs........................ 0.60 2.46 75.6260 Mechmar Corp ..................................... 0.19 0.78 75.6
262 Public Packages Hldgs ...................... 0.235 0.96 75.5258 Furqan Business Organisation................0.14 0.57 75.4169 Olympia Industries .............................. 0.23 0.93 75.3258 Eupe Corp............................................. 0.45 1.81 75.1258 Grand Hoover....................................... 0.21 0.84 75.0
260 Kia Lim.................................................. 0.23 0.912 74.8263 Teck Guan Perdana ............................. 0.30 1.1815 74.6261 OCB ...................................................... 0.53 2.07 74.4160 Mulpha Int’l ........................................ 0.475 1.85 74.3208 Tanco Hldgs ....................................... 0.135 0.52 74.0
256 BCB ...................................................... 0.41 1.57 73.9262 Seacera Tiles........................................ 0.36 1.36 73.5198 South M’sia Industries ........................ 0.24 0.90 73.3261 Ornapaper ............................................ 0.36 1.34 73.174 DPS Resources................................... 0.185 0.68 72.8
259 Kamdar Group ................................... 0.345 1.26 72.6138 Lion Diversified Hldgs ....................... 0.465 1.69 72.5262 SMPC Corp........................................... 0.14 0.51 72.5261 Multi-Usage Hldgs............................. 0.145 0.51 71.6262 Rex Industry......................................... 0.66 2.32 71.6
260 MESB .................................................. 0.305 1.07 71.5260 Major Team Hldgs ............................... 0.15 0.52 71.2257 Dolomite Corp...................................... 0.18 0.62 71.0261 Mulpha Land ........................................ 0.49 1.69 71.0259 JPK Hldgs ............................................. 0.07 0.24 70.8
261 PNE PCB .............................................. 0.26 0.89 70.8261 Pan M’sia Corp .................................. 0.135 0.46 70.7116 John Master Industries ...................... 1.28 4.352 70.6183 Priceworth Wood Pdts ..................... 0.515 1.75 70.6264 Xian Leng Hldgs ................................. 0.51 1.72 70.3
57 Asia Pacific Land ............................... 0.315 1.047 69.9261 Mitrajaya Hldgs .................................. 0.58 1.93 69.951 AKN Tech ............................................ 0.13 0.43 69.8
155 Melewar Industrial Group ............... 0.645 2.12 69.6139 Lion Forest Industries ........................ 1.29 4.23 69.5
262 Prolexus ............................................... 0.31 1.01 69.3207 Talam Corp ........................................ 0.105 0.34 69.1259 JMR Conglomeration ......................... 0.25 0.80 68.8164 Naim Indah Corp .............................. 0.055 0.175 68.6258 Gefung Hldgs ...................................... 0.34 1.08 68.5
136 Limahsoon .......................................... 0.06 0.19 68.4258 FSBM Hldgs ........................................ 0.42 1.31 67.9260 M’sian AE Models Hldgs .................... 0.64 1.98 67.7264 VisDynamics Hldgs .......................... 0.075 0.23 67.4152 Maxtral Industry ................................. 0.31 0.95 67.4
260 Len Cheong Hldg .............................. 0.115 0.35 67.1262 SMIS Corp ........................................... 0.49 1.49 67.1261 OSK Ppty Hldgs ................................ 0.555 1.68 67.0264 Utusan Melayu ................................... 0.85 2.537 66.5150 Malton ................................................. 0.41 1.22 66.4
157 Mieco Chipboard .............................. 0.505 1.49 66.1242 OSK Ventures Int’l ............................ 0.685 2.02 66.168 Caely Hldgs ....................................... 0.305 0.90 66.1
256 Bina Darulaman .................................. 0.99 2.91 66.0257 Cymao Hldgs ....................................... 0.64 1.88 66.0
257 Daiman Devt ....................................... 1.52 4.47 66.0262 Pulai Springs ..................................... 0.525 1.54 65.9193 Scomi Marine ...................................... 0.48 1.40 65.7264 Triumphal Associates ........................ 0.80 2.33 65.778 Denko Industrial Corp ...................... 0.125 0.363 65.6
260 Kuchai Devt ......................................... 0.76 2.21 65.6263 Tiong Nam Logistics Hldgs ............... 0.83 2.38 65.1256 Autoair Hldgs ...................................... 0.25 0.71 64.8260 Lipo Corp ........................................... 0.465 1.32 64.8257 Comintel Corp ..................................... 0.28 0.792 64.6
238 MEMS Tech ......................................... 0.07 0.197 64.5215 UDS Capital ....................................... 0.165 0.4652 64.579 Dijaya Corp ........................................ 0.935 2.62 64.3
130 LCL Corp .............................................. 0.20 0.56 64.3240 Mobif ................................................... 0.08 0.224 64.3
262 Prinsiptek Corp ................................. 0.365 1.02 64.2256 Asas Dunia .......................................... 0.64 1.79 64.2256 ASIAEP ................................................ 0.09 0.25 64.0261 PMB Tech ............................................ 0.43 1.19 63.957 Asian Pac Hldgs ................................ 0.105 0.29 63.8
263 The Nomad Group .............................. 0.50 1.38 63.8132 Landmarks .......................................... 1.28 3.52 63.6259 Ireka Corp .......................................... 0.765 2.10 63.6259 Hua Yang ............................................. 0.77 2.11 63.5257 Chee Wah Corp ................................... 0.42 1.15 63.5
MEa49_nav.indd 2010-1-8, 18:321

aaaaaaaaaaaaaaaaaaaaaaaaaaaaaaaaaaaaaaaaaaaaaa
$0.80
$0.76
$0.72
616800 308400
$2.10
$1.50
$0.90
5127000 2563500
$2.50
$2.30
$2.10
9800 4900
$2.40$2.10$1.80$1.50$1.20$0.90
30600 15300
118
KNM Group par RM0.25 Paidup RM989.610 m NAV : RM0.49 PE : 9.3 PB : 1.6 Yield : 1.9 Traded in RMChairman: Y. Bhg. Dato’ Mohd Idris CEO/MD: Lee Swee EngH BUSINESS : Co is principally engaged in design & mfr of process eqmt for oil & gas industry. [9M09 Geographical] Asia & Oceania (30.8%), Europe & US (69.2%).
H INSIGHT : Jul-09, Co acq the entire stake of dormant Co, Compart Compressor Technology GmbH (CCTG) for approx RM124k. Earlier, CCTG inked agmt to acq the core business in the development, pro-duction and distribution of valves, compressor parts and monitor-ing systems for compressors and the provision of maintenance and repair works of compressors together with all assets of Compart Technology GmbH & Co. KG for RM5.6m. Co via subsi, inked agmt with The National Oil Corp of Chad to establish a JV co with a 60:40 equity spilt, to operate, dvlp and maintain the Sedigi Oilfield Facilities in Chad, with contract value of US$220m and lasting 24 months.
9M09 earnings fell by 20.5% on the back of lower revenue as a result of the global economic slowdown. Co expects to be profitable for FY09. (02/12/09-YL)
Daily
Vol
Weekly
Vol
30.11.09 to 25.12.09 08.01.10H-Low: 0.755 - 0.70 0.82 - 0.73PE(wk vol): 8.5 (1,080,941) 9.2 (948,877)
18.01.08 to 11.07.08 09.01.09 10.07.09 08.01.10High-Low: 2.44 - 1.47 2.01 - 0.39 1.09 - 0.32 0.915 - 0.69Av PE(wk vol): 41.1 (215,383) 21.5 (1,854,971) 7.9 (3,018,505) 9.2 (2,017,870)
Period High Low Close Vol’ 00 + 2 wk 0.745 0.70 0.715 1,706,395pre 2 wk 0.755 0.715 0.73 455,486
28-12-09 0.75 0.73 0.74 83,45829-12-09 0.76 0.745 0.76 198,74430-12-09 0.77 0.75 0.77 82,26731-12-09 0.775 0.755 0.77 130,06301-01-10 --- --- --- ---
04-01-10 0.80 0.765 0.80 198,15805-01-10 0.82 0.80 0.81 385,05406-01-10 0.815 0.80 0.80 247,76007-01-10 0.81 0.795 0.80 261,27008-01-10 0.82 0.78 0.79 310,980
Mkt Cap : RM3,127.168 m
Ann’d date for 2H08 : 24-FEB-09
H 5-Yr CAP ISSUE : ......................................................... bn 1:1 ex 12-07-07............................................. rt 1:4(RM4.00) ex 27-05-08.....bn 2:1 ex 23-07-08
FINANCIAL PRE-TAX TURNOVER M’GIN AFT-TAX & MI SH’HOLDERS ROE TOTAL ASSETS ROA TOTAL LIAB DIV EPSYR CLOSE P&L (RMm) (RMm) in % P&L (RMm) FUND (RMm) in % (RMm) in % (RMm) in RM in RM
31-12-05 53.107 343.936 15.44 41.172 157.419 26.15 350.799 11.74 200.380 .05 .17731-12-06 147.545 908.987 16.23 132.506 390.330 33.95 1,015.695 13.05 610.663 .05 .13031-12-07 215.358 1,230.116 17.51 188.133 555.470 33.87 1,247.049 15.09 691.380 .04 .181
1H08 170.951 930.616 18.37 150.415 1,735.759 --- 3,796.068 --- 2,057.663 --- .03831-12-08 453.705 2,528.750 17.94 336.383 1,813.822 18.55 4,455.354 7.55 2,635.011 .015 .085
1H09 190.252 964.710 19.72 169.872 1,935.373 --- 4,251.355 --- 2,311.188 --- .0439M09 219.014 1,423.058 15.39 201.793 1,979.843 --- 4,241.256 --- 2,252.681 --- .051
KPJ Healthcare par RM0.50 Paidup RM261.826 m NAV : RM1.136 PE : 17.4 PB : 2.3 Yield : 1.1 Traded in RMChairman: Tan Sri Dato’ Mohd Ali CEO/MD: Datin Paduka Siti Sa’adiahH BUSINESS : Ops of hospitals.
H INSIGHT : Nov, Co inked agmt to subscribe for 50k preference shrs in Intrapreneur Devt for RM5m. Oct-09, Co proposed a) splitting of 1 RM1 shr into 2 RM0.50 shr b) bonus issuance on the basis of 1 shr for every 4 shrs held and d) free wrts on the basis of 1 for every 4 shrs held. Aug-09, Co via subsi, acq’d add’l 16% equity stake in Lablink (M) for RM1m. Co acq 28.3% equity interest in Seremban Specialist Hospital for total cash of RM14.2m. Jul-09, Co inked agmt to acq Bandar Baru Klang Medical Centre Bldg for RM38m cash. Co in 70:30 JV agmt with Pasdec Hldgs to dvlp a hospital bldg on a pc of l/h land of 3.12 acres in Kuantan. Feb-09, Co proposed to distrib-ute Al-’Aqar KPJ REITS units to shrhldrs on the basis of 23 Al-’Aqar units for every 100 shrs held, in a move to return surplus assets to shrhlders. Dec-08, Co completed acquisition of add’l 150k shrs in Lablink for RM1.5m.
9M09 earnings rose 16.4% on the back of higher revenue as strong demand for its hospitals continued. (10/12/09-YL)
Daily
Vol
Weekly
Vol
30.11.09 to 25.12.09 08.01.10H-Low: 2.40 - 1.98 2.61 - 2.41PE(wk vol): 14.9 (17,714) 17.2 (22,936)
18.01.08 to 11.07.08 09.01.09 10.07.09 08.01.10High-Low: 1.48 - 1.20 1.44 - 0.90 1.31 - 1.00 2.61 - 1.16Av PE(wk vol): 12.0 (8,051) 8.4 (4,551) 7.8 (6,804) 11.7 (16,666)
Period High Low Close Vol’ 00 + 2 wk 2.37 1.98 2.23 20,282pre 2 wk 2.40 2.21 2.40 15,147
28-12-09 2.46 2.41 2.44 7,38929-12-09 2.57 2.46 2.57 11,78730-12-09 2.57 2.50 2.50 12,16631-12-09 2.61 2.53 2.61 14,53001-01-10 --- --- --- ---
04-01-10 2.61 2.61 2.61 ---05-01-10 2.61 2.61 2.61 ---06-01-10 2.61 2.61 2.61 ---07-01-10 2.61 2.61 2.61 ---08-01-10 2.61 2.61 2.61 ---
Mkt Cap : RM1,366.732 m
Ann’d date for 2H08 : 25-FEB-09
H 5-Yr CAP ISSUE : ......................................................... bn 1:4 ex 06-01-10
FINANCIAL PRE-TAX TURNOVER M’GIN AFT-TAX & MI SH’HOLDERS ROE TOTAL ASSETS ROA TOTAL LIAB DIV EPSYR CLOSE P&L (RMm) (RMm) in % P&L (RMm) FUND (RMm) in % (RMm) in % (RMm) in RM in RM
31-12-05 42.301 659.643 6.41 32.657 430.510 7.59 996.268 3.28 561.349 .18 .16331-12-06 60.060 831.455 7.22 40.962 456.552 8.97 1,101.885 3.72 614.603 .14 .20331-12-07 85.225 1,108.313 7.69 74.209 494.142 15.02 1,190.957 6.23 651.270 .10 .361
1H08 60.290 615.068 9.80 41.877 550.966 --- 1,237.023 --- 637.492 .07 .20231-12-08 114.051 1,270.181 8.98 78.448 569.331 13.78 1,262.895 6.21 645.310 --- .375
1H09 67.474 709.522 9.51 46.715 628.892 --- 1,337.328 --- 657.013 .10 .2239M09 104.503 1,071.009 9.76 73.522 598.629 --- 1,303.525 --- 663.429 .10 .351
cd = cum dividend xd = ex-dividend cb = cum bonus xb = ex-bonus
MEb118.indd 2010-1-8, 17:511

aaaaaaaaaaaaaaaaaaaaaaaaaaaaaaaaaaaaaaaaaaaaaa
$0.55
$0.45
$0.35
807400 403700
$0.60$0.50$0.40$0.30$0.20$0.10
2117600 1058800
$1.34
$1.30
$1.26
$1.22
11600 5800
$3.00$2.50$2.00$1.50$1.00$0.50
287000 143500
132
Land & General par RM1.00 Paidup RM598.305 m NAV : RM0.359 PE : 22.5 PB : 1.6 Yield : NA Traded in RM CEO/MD: Low Gay TeckH BUSINESS : [1H10 Turnover] Ppties (62.7%), education (32.9%), others (4.4%).
H INSIGHT : Jun-09, Co is proposing par value reduction and shr premium reduction that will see its par value per shr reduced to RM0.2, which will allow Co to reduce its accumulated loss to a more appropriate level. May-08, Co’s subsi Bandar Sungai Buaya was served with a winding-up petition. Co completed disposal of Plaza Putra. Co is committed to ongoing Asset Disposal Programme and Composite Debt Restructuring Scheme to reduce financing cost and consolidate its resources so that Co can focus on its core ppty devt biz. Sales of the D’sara Villas bunglow lots have been reasonably good and mgt continued to focus on sales at Hidden Valley for its Australian ops. Co is now actively pursuing devt and other opportu-nities especially in Bandar Sri Damansara township.
1H10, profit soared to RM11.3m despite dip in sales. Higher earnings was attributed on a forex gain of RM10.3m from capital distribution from a foreign subsi. Co’s performance should be satis-factory for FY10. (30/11/09-DL)
Daily
Vol
Weekly
Vol
30.11.09 to 25.12.09 08.01.10H-Low: 0.37 - 0.31 0.60 - 0.33PE(wk vol): 13.2 (58,347)17.3 (1,749,508)
18.01.08 to 11.07.08 09.01.09 10.07.09 08.01.10High-Low: 0.545 - 0.265 0.35 - 0.14 0.36 - 0.145 0.60 - 0.245Av PE(wk vol): 30.2 (69,444) 15.5 (62,379) 13.5 (247,507) 13.6 (358,988)
Period High Low Close Vol’ 00 + 2 wk 0.37 0.32 0.345 72,831pre 2 wk 0.34 0.31 0.33 43,863
28-12-09 0.39 0.33 0.36 203,17229-12-09 0.375 0.36 0.365 66,58330-12-09 0.37 0.345 0.35 35,39331-12-09 0.36 0.345 0.355 17,64001-01-10 --- --- --- ---
04-01-10 0.395 0.35 0.395 127,24305-01-10 0.49 0.41 0.45 706,69706-01-10 0.595 0.49 0.575 1,211,04107-01-10 0.60 0.535 0.535 613,72908-01-10 0.585 0.52 0.57 517,518
Mkt Cap : RM341.034 m
Ann’d date for 3Q09 : 25-FEB-09FINANCIAL PRE-TAX TURNOVER M’GIN AFT-TAX & MI SH’HOLDERS ROE TOTAL ASSETS ROA TOTAL LIAB DIV EPSYR CLOSE P&L (RMm) (RMm) in % P&L (RMm) FUND (RMm) in % (RMm) in % (RMm) in RM in RM
31-03-06 96.370 283.333 34.01 69.137 181.786 38.03 671.942 10.29 491.342 --- .11631-03-07 8.597 94.695 9.08 6.967 195.348 3.57 558.802 1.25 363.454 --- .01231-03-08 2.308 46.734 4.94 2.593 201.886 1.28 450.419 0.58 248.533 --- .004
1H09 4.917 14.377 34.20 2.980 198.632 --- 381.576 --- 182.944 --- .00531-03-09 17.573 37.611 46.72 15.174 199.951 7.59 351.352 4.32 151.401 --- .025
1Q10 8.743 6.107 143.16 8.549 212.591 --- 291.626 --- 79.035 --- .0141H10 11.695 14.370 81.38 11.387 214.814 --- 293.910 --- 79.096 --- .019
Landmarks par RM1.00 Paidup RM480.682 m NAV : RM3.52 PE : 9.8 PB : 0.4 Yield : NA Traded in RMChairman: Harun Bin Halim Rasip CEO/MD: Mohd Abdul HalimH BUSINESS : [9M09 Turnover] Hotels & resorts (100%).
H INSIGHT : Co’s earnings in FY08 was largely derived from the sale of Teknologi Tenaga Perlis Consortium. Co completed the transfor-mation of its biz with the disposal of non-core asset Teknologi and the complete acquisition of Bintan Treasure Bay. Oct-08, Co made decision to postpone the launch of devt pjt in Bintan in view of the economic crisis. Co will be position to re-launch pjt when condi-tions improve. Feb-08, Co acq remaining 26% interest in Bintan Treasure Bay for RM360m from Castle Knight Invs and Complete Win Group. Nov-07, Co acq 9.5%-stake in Bintan Treasure Bay for $23.2m. Oct-07, Co’s subsi Bintan Treasure Bay inked MOU with China Metallurgical Group Corp for the devt of integrated resorts on Bintan Island. Co’s vision to become a leading player in the lifestyle sector focusing on resorts, hospitality and wellness in the South East Asia region.
9M09, Co fell into the red as sales slipped. The decrease in revenue was attributed to lower contribution from Carcosa Seri Negara. Fur-ther, corresponding period had booked a gain from the disposal of 20%-stake in Teknologi Tenaga Perlis Consortium. Co’s strong bal-ance sheet will allow it to take advantage of opportunities that arises. (30/11/09-DL)
Daily
Vol
Weekly
Vol
30.11.09 to 25.12.09 08.01.10H-Low: 1.26 - 1.19 1.36 - 1.21PE(wk vol): 9.4 (15,668) 9.7 (26,870)
18.01.08 to 11.07.08 09.01.09 10.07.09 08.01.10High-Low: 3.28 - 1.34 1.56 - 0.765 1.52 - 0.625 1.58 - 1.14Av PE(wk vol): 4.3 (40,302) 0.9 (11,750) 6.0 (87,856) 10.2 (40,368)
Period High Low Close Vol’ 00 + 2 wk 1.26 1.21 1.23 19,389pre 2 wk 1.25 1.19 1.22 11,947
28-12-09 1.24 1.21 1.22 2,67529-12-09 1.23 1.22 1.23 92830-12-09 1.24 1.22 1.24 1,78431-12-09 1.25 1.23 1.24 7,39201-01-10 --- --- --- ---
04-01-10 1.28 1.24 1.28 8,10305-01-10 1.35 1.28 1.34 17,35906-01-10 1.36 1.32 1.34 8,44907-01-10 1.34 1.30 1.31 3,46008-01-10 1.30 1.26 1.28 3,590
Mkt Cap : RM615.273 m
Ann’d date for 2H08 : 25-FEB-09FINANCIAL PRE-TAX TURNOVER M’GIN AFT-TAX & MI SH’HOLDERS ROE TOTAL ASSETS ROA TOTAL LIAB DIV EPSYR CLOSE P&L (RMm) (RMm) in % P&L (RMm) FUND (RMm) in % (RMm) in % (RMm) in RM in RM
31-12-05 46.896 316.335 14.82 29.231 332.965 8.78 993.530 2.94 627.515 .02 .06331-12-06 145.275 196.221 74.04 123.374 471.044 26.19 1,032.453 11.95 471.018 .02 .26431-12-07 582.565 122.053 477.30 571.124 1,073.498 53.20 1,520.427 37.56 300.740 .04 1.188
1H08 – 2.328 24.787 NA 67.710 1,729.043 --- 2,422.176 --- 692.499 --- .14131-12-08 60.966 48.721 125.13 62.865 1,695.793 3.71 2,386.381 2.63 689.610 --- .131
1H09 – 0.760 22.250 NA – 1.050 1,694.809 --- 2,372.595 --- 676.803 --- – .0029M09 – 2.101 33.550 NA – 1.786 1,694.030 --- 2,371.709 --- 677.061 --- – .004
1H09 = 1st half of FY09 9M09 =1st 9 months of FY09
MEb132.indd 2010-1-8, 17:531

aaaaaaaaaaaaaaaaaaaaaaaaaaaaaaaaaaaaaaaaaaaaaa
$2.80
$2.60
$2.40
$2.20
$2.00
47200 23600
$2.70$2.40$2.10$1.80$1.50$1.20
129800 64900
$0.21
$0.20
$0.19
$0.18
$0.17
490000 245000
$0.60$0.50$0.40$0.30$0.20$0.10
3311800 1655900
188
Rubberex Corp par RM1.00 Paidup RM83.110 m NAV : RM1.80 PE : 25.6 PB : 1.6 Yield : 4.3 Traded in RMChairman: Dato’ Mohamed Bin Hamzah CEO/MD: Ping Kok KohH BUSINESS : Co is in the biz of mfg and sales of rubber gloves and latex condoms, trdg in rubber gloves and other items.[9M09 Geo-graphical] PRC (70.5%), M’sia (21.6%), Europe (7.9%).
H INSIGHT : Oct-09, strong performance for 9M09 is largely attribut-able to PRC ops which mainly produce disposable gloves. Co will generate strong earnings for the rest of the yr as global demand for disposable gloves is increasing and the PRC expansion is pro-gressing satisfactorily. The latest phase of expansion will boost the annual pdtn capacity of gloves from 3.5b to 4.4b by yr end and is expected to reach 5.6b pieces by 2Q10. Significant growth pros-pects for Co will be derived mainly from its PRC ops. Co remains positive on its 4Q09 performance. Jun-09, Co has inked agmts to buy the remaining 40% equity interest in Pioneer Vantage (PV) and Lifestyle Invs (HK) (LI), and 20% equity interest in Rubberex (HK) for ttl cash RM12m.
9M09, both revenue and net profit rose yoy due to sales contribu-tion from PRC subsis and better profit margins of Co’s pdts. On qoq basis, pretax profit improved 4% on increased pdtn vol and efficien-cies achieved from PRC subsis. (30/10/09-SY)
Daily
Vol
Weekly
Vol
30.11.09 to 25.12.09 08.01.10H-Low: 2.03 - 1.87 2.85 - 1.98PE(wk vol): 17.7 (4,413) 21.5 (149,070)
18.01.08 to 11.07.08 09.01.09 10.07.09 08.01.10High-Low: 1.40 - 1.05 1.40 - 1.01 1.75 - 1.19 2.85 - 1.60Av PE(wk vol): NA (1,124) NA (3,528) NA (3,444) 16.8 (20,207)
Period High Low Close Vol’ 00 + 2 wk 2.00 1.87 1.94 4,360pre 2 wk 2.03 1.91 1.99 4,466
28-12-09 2.01 1.98 1.99 24,55029-12-09 2.01 1.99 1.99 3,84530-12-09 2.01 1.99 1.99 4,40031-12-09 2.48 2.00 2.34 70,71401-01-10 --- --- --- ---
04-01-10 2.47 2.38 2.41 20,12405-01-10 2.46 2.37 2.38 22,45106-01-10 2.77 2.28 2.75 55,14207-01-10 2.85 2.63 2.66 66,00908-01-10 2.82 2.65 2.82 30,905
Mkt Cap : RM234.370 m
Ann’d date for 2H08 : 26-FEB-09FINANCIAL PRE-TAX TURNOVER M’GIN AFT-TAX & MI SH’HOLDERS ROE TOTAL ASSETS ROA TOTAL LIAB DIV EPSYR CLOSE P&L (RMm) (RMm) in % P&L (RMm) FUND (RMm) in % (RMm) in % (RMm) in RM in RM
31-12-05 14.464 123.327 11.73 11.363 102.589 11.08 154.647 7.35 46.865 .20 .15831-12-06 8.208 121.390 6.76 6.879 99.666 6.90 186.051 3.70 79.238 .15 .09031-12-07 – 4.787 145.177 NA – 1.785 90.324 – 1.98 240.453 – 0.74 97.375 .06 – .022
1H08 4.613 108.313 4.26 2.679 137.075 --- 276.474 --- 128.451 .05 .03431-12-08 12.532 274.554 4.56 9.165 143.121 6.40 303.385 3.02 147.019 .07 .110
1H09 11.090 148.499 7.47 5.403 157.946 --- 315.149 --- 150.853 --- .0659M09 17.123 233.728 7.33 10.952 158.597 --- 321.821 --- 156.671 --- .132
SAAG Consolidated par RM0.10 Paidup RM64.844 m NAV : RM0.27 PE : 3.7 PB : 0.6 Yield : NA Traded in RMChairman: Dato’ Abu Bakar CEO/MD: Loganathan K RamanujamH BUSINESS : [9M09 Turnover] Trdg, maintenance, repair & over-haul (44.8%), discontinued ops (26.0%), marine logistics & support: Ownership, construction & ops (14.8%), construction, infrastruc & pjt mgt (11.1%), rig svcs (1.7%), manpower consultancy, design & engrg svcs (1.5%).
H INSIGHT : Dec-09, in its 3Q report looking ahead, Co says it is now negotiating and bidding to secure more new pjts. However, the ef-fect of these would only be seen in ensuing yr(s). Meanwhile Co will continue to stay focused towards the delivery and commencement of the charter hire contracts for modular workover rigs to ensure income generation from these assest which will then contribute significantly to Co’s rig svcs segment. Nov-09, Co has announced the 6th tranche of its exchangeable bonds to comprise US$5m in nominal value at exchange price of RM0.2105.
9M09, revenue took a plunge mainly due to lower revenue recogni-tion based on the progressive percentage of completion method for turbo machinery/rigs, the loss of revenue from the workover rig svcs op and the engrg and construction segment. These have resulted in lower gross profit margin and bottom line. (03/12/09-SY)
Daily
Vol
Weekly
Vol
30.11.09 to 25.12.09 08.01.10H-Low: 0.21 - 0.17 0.195 - 0.165PE(wk vol): 3.8 (452,181) 3.7 (1,373,947)
18.01.08 to 11.07.08 09.01.09 10.07.09 08.01.10High-Low: 0.60 - 0.35 0.53 - 0.16 0.395 - 0.14 0.315 - 0.165Av PE(wk vol): 12.6 (6,205) 6.8 (250,757) 5.3 (1,268,166) 4.8 (828,111)
Period High Low Close Vol’ 00 + 2 wk 0.21 0.17 0.185 551,854pre 2 wk 0.185 0.17 0.17 352,508
28-12-09 0.175 0.17 0.17 120,26329-12-09 0.175 0.17 0.175 99,95930-12-09 0.175 0.165 0.17 225,88731-12-09 0.175 0.165 0.175 170,64001-01-10 --- --- --- ---
04-01-10 0.18 0.17 0.18 734,92305-01-10 0.195 0.185 0.185 731,50706-01-10 0.19 0.175 0.185 396,51807-01-10 0.185 0.175 0.18 187,99308-01-10 0.18 0.175 0.175 80,204
Mkt Cap : RM113.477 m
Ann’d date for 2H08 : 27-FEB-09
H 5-Yr CAP ISSUE : ........................................ rt 1:10(RM0.10) ex 08-07-08
FINANCIAL PRE-TAX TURNOVER M’GIN AFT-TAX & MI SH’HOLDERS ROE TOTAL ASSETS ROA TOTAL LIAB DIV EPSYR CLOSE P&L (RMm) (RMm) in % P&L (RMm) FUND (RMm) in % (RMm) in % (RMm) in RM in RM
31-12-05 9.890 212.540 4.65 3.118 69.298 4.50 279.983 1.11 199.218 --- .07131-12-06 24.038 270.840 8.88 13.400 86.842 15.43 617.534 2.17 512.643 .03 .27531-12-07 42.937 495.959 8.66 28.032 137.133 20.44 692.799 4.05 535.081 .05 .486
1H08 31.582 221.245 14.27 20.765 155.764 --- 611.454 --- 430.966 --- .03131-12-08 49.798 542.130 9.19 30.545 173.470 17.61 635.247 4.81 433.196 --- .047
1H09 – 0.078 162.526 NA 5.256 200.794 --- 531.911 --- 295.622 --- .0089M09 – 7.307 183.111 NA 0.229 272.779 --- 892.428 --- 589.933 --- .000
1H09 = 1st half of FY09 9M09 =1st 9 months of FY09
MEb188.indd 2010-1-8, 17:281

aaaaaaaaaaaaaaaaaaaaaaaaaaaaaaaaaaaaaaaaaaaaaa
$1.40
$1.35
$1.30
$1.25
$1.20
3600 1800
$2.10
$1.50
$0.90
38400 19200
$0.51
$0.49
$0.47
$0.45
325200 162600
$1.40
$1.00
$0.60
3021600 1510800
192
Scomi Engrg par RM1.00 Paidup RM275.694 m NAV : RM1.62 PE : 30.4 PB : 0.8 Yield : 3.6 Traded in RMChairman: Datuk Zainun Aishah binti Ahmad CEO/MD: Hilmy ZainiH BUSINESS : [9M09 Turnover] Logistics engrg (62.9%), energy engrg (37.1%).
H INSIGHT : Nov-09, the Energy Engrg biz is expected to continue to contribute positively in the remaining 4Q09 with the expansion of existing facility in Indonesia and relocation of Australia and Thai-land machine shops to bigger facilities. The biz is also investing in R&D of new connector in an effort to expand the mkt coverage in the casing and connectors mkt. For Logistics Engrg biz, contribution from the Rail unit will continue to lead the performance throughout 2009. Co reckons that the core biz driver from 2009 onwards will be in the public tptn sector and will leverage on its rail expertise to pursue opportunities in monorail pjts and establish a global presence in this sector. Co has entered into a Joint Bidding Agmt with Geodesic Techniques, an India company, to submit a bid to undertake the finance, design, build, own, operate and transfer of new monorail alignments in Bangalore.
9M09, revenue jumped 25% yoy and net profit improved, mainly due to strong contributions from the Rail biz. (03/12/09-SY)
Daily
Vol
Weekly
Vol
30.11.09 to 25.12.09 08.01.10H-Low: 1.29 - 1.19 1.41 - 1.25PE(wk vol): 27.5 (1,907) 29.3 (6,187)
18.01.08 to 11.07.08 09.01.09 10.07.09 08.01.10High-Low: 2.58 - 0.655 1.10 - 0.42 1.29 - 0.45 1.70 - 1.01Av PE(wk vol): 10.3 (8,922) 4.6 (3,544) 13.4 (10,488) 30.4 (7,212)
Period High Low Close Vol’ 00 + 2 wk 1.29 1.19 1.21 2,119pre 2 wk 1.27 1.21 1.27 1,696
28-12-09 1.27 1.27 1.27 1029-12-09 1.27 1.27 1.27 ---30-12-09 1.25 1.25 1.25 1031-12-09 1.29 1.26 1.26 9201-01-10 --- --- --- ---
04-01-10 1.34 1.27 1.34 1,53005-01-10 1.37 1.30 1.36 5,31006-01-10 1.40 1.36 1.38 3,78307-01-10 1.41 1.37 1.37 1,53908-01-10 1.37 1.37 1.37 100
Mkt Cap : RM377.701 m
Ann’d date for 2H08 : 27-FEB-09
H 5-Yr CAP ISSUE : .......................................... rt 3:1(RM1.20) ex 29-11-05
FINANCIAL PRE-TAX TURNOVER M’GIN AFT-TAX & MI SH’HOLDERS ROE TOTAL ASSETS ROA TOTAL LIAB DIV EPSYR CLOSE P&L (RMm) (RMm) in % P&L (RMm) FUND (RMm) in % (RMm) in % (RMm) in RM in RM
31-12-05 16.701 0.918 1819.28 16.701 265.644 6.29 403.904 4.13 138.260 --- .71431-12-06 41.096 323.940 12.69 28.267 360.692 7.84 624.695 4.52 249.599 .03 .10631-12-07 47.350 368.788 12.84 42.401 394.758 10.74 580.590 7.30 185.570 .05 .154
1H08 20.370 228.288 8.92 17.032 412.527 --- 735.544 --- 322.585 --- .06231-12-08 18.222 428.759 4.25 12.435 411.583 3.02 654.406 1.90 242.224 .05 .045
1H09 49.185 277.940 17.70 36.923 435.259 --- 762.577 --- 326.623 --- .1349M09 58.039 400.201 14.50 48.815 445.894 --- 834.662 --- 388.072 --- .177
Scomi Group par RM0.10 Paidup RM102.184 m NAV : RM0.91 PE : 4.3 PB : 0.5 Yield : 1.0 Traded in RMChairman: Tan Sri Datuk Asmat bin Kamaludin CEO/MD: Shah HakimH BUSINESS : [9M09 Turnover] Oil svcs (72.9%), energy & logistics engrg (20.3%), pdtn enhancement (4.0%), energy logistics (2.4%), invs hldgs (0.4%).
H INSIGHT : Nov-09, in the Oilfield Svcs div, biz continued to be challenged by flat global drilling activity. This trend is expected to continue into early 2010 as oil majors kept capex under tight con-trol. The Energy & Logistics Engrg div will continue to contribute positively and lead Co’s performance with the Mumbai monorail pjt. The Machine Shop unit is investing in R&D on new connectors to expand mkt coverage. Co has also expanded its existing facilities, incl relocation to a bigger Australian facility. The Energy Logistics div achieved a 16% improvement in coal tonnage in 3Q09 and such trend is expected to continue in 4Q09. Charter rates in the coming mths are expected to remain stable in SEA and Co is working on expanding its fleet of vessels to capitalise on the current attractive vessel prices. The Pdtn Enhancement div is making good progress in the gas separation biz.
9M09, both revenue and net profit fell yoy. Compared to 3Q08, 3Q09 net profit rose mainly due to contribution from the Energy & Logistics Engrg div. (04/12/09-SY)
Daily
Vol
Weekly
Vol
30.11.09 to 25.12.09 08.01.10H-Low: 0.505 - 0.435 0.52 - 0.44PE(wk vol): 4.2 (128,631) 4.1 (871,315)
18.01.08 to 11.07.08 09.01.09 10.07.09 08.01.10High-Low: 1.69 - 0.53 0.74 - 0.255 0.825 - 0.285 0.73 - 0.435Av PE(wk vol): 5.3 (232,983) 1.9 (298,857) 3.7 (962,656) 5.0 (415,029)
Period High Low Close Vol’ 00 + 2 wk 0.505 0.45 0.49 94,752pre 2 wk 0.505 0.435 0.45 162,510
28-12-09 0.45 0.44 0.45 49,29529-12-09 0.46 0.445 0.455 275,28130-12-09 0.455 0.44 0.445 72,65731-12-09 0.45 0.44 0.445 38,19301-01-10 --- --- --- ---
04-01-10 0.485 0.445 0.48 311,16705-01-10 0.49 0.47 0.48 235,53406-01-10 0.52 0.475 0.505 487,75407-01-10 0.515 0.49 0.49 193,96608-01-10 0.495 0.475 0.49 78,783
Mkt Cap : RM500.702 m
Ann’d date for 2H08 : 27-FEB-09FINANCIAL PRE-TAX TURNOVER M’GIN AFT-TAX & MI SH’HOLDERS ROE TOTAL ASSETS ROA TOTAL LIAB DIV EPSYR CLOSE P&L (RMm) (RMm) in % P&L (RMm) FUND (RMm) in % (RMm) in % (RMm) in RM in RM
31-12-05 187.648 1,067.972 17.57 151.691 544.197 27.87 1,863.874 8.14 1,267.745 .06 .15631-12-06 120.722 1,577.495 7.65 84.545 592.376 14.27 2,585.604 3.27 1,948.606 .075 .08531-12-07 286.418 1,955.530 14.65 257.129 801.186 32.09 2,705.430 9.50 1,757.341 .02 .390
1H08 85.657 1,003.909 8.53 56.356 856.051 --- 2,849.601 --- 1,831.608 --- .05531-12-08 141.594 2,109.293 6.71 116.553 913.971 12.75 2,960.655 3.94 1,884.791 .005 .114
1H09 69.615 1,063.774 6.54 30.363 951.679 --- 3,081.625 --- 1,960.009 --- .0309M09 99.837 1,487.902 6.71 53.338 954.172 --- 3,033.107 --- 1,909.862 --- .052
1H09 = 1st half of FY09 9M09 =1st 9 months of FY09
MEb192.indd 2010-1-8, 17:311

aaaaaaaaaaaaaaaaaaaaaaaaaaaaaaaaaaaaaaaaaaaaaa
$1.40$1.35$1.30$1.25$1.20$1.15
12000 6000
$1.40
$1.20
$1.00
$0.80
$0.60
126000 63000
$0.085$0.08$0.075$0.07$0.065$0.06
832000 416000
$0.16
$0.12
$0.08
$0.04
4087800 2043900
71
C
MA
IN M
AR
KE
T
Cocoaland Hldgs par RM0.50 Paidup RM60.000 m NAV : RM0.82 PE : 18.9 PB : 1.7 Yield : 2.9 Traded in RMChairman: Dato’ Azman bin Mahmood H BUSINESS : Co is engaged in mfg & trdg of processed & preserved foods & other related foodstuffs.
H INSIGHT : Aug-09, plans have been undertaken to expand pdtn capacity to meet expected increase in demand on existing and new pdts to be launched. May-09, Co foresees the local food industry to remain resilient with intense competition in domestic and overseas mkts. Feb-09, the increase in local sales has contributed to the in-crease in ttl turnover. Aug-08, Co faces greater challenges ahead in view of anticipated higher material cost and intense competition in domestic and overseas mkts. Co is planning to expand pdtn capac-ity to meet expected increase in demand on existing and on new pdts to be launched. Jul-08, Co has injected US$1.5m in ttl into the JV. May-07, Co entered into a JV with La Bi Xiao Xin Int’l to mfr and distribute gummy candy pdts through a JV co in Fujian, PRC.
9M09 earnings soared 3 times due to increase in revenue from higher margin pdts and improved pdtn efficiency. Higher turnover was driven by an increase in demand for the export segments. (24/11/09-XL)
Daily
Vol
Weekly
Vol
30.11.09 to 25.12.09 08.01.10H-Low: 1.29 - 1.12 1.41 - 1.24PE(wk vol): 16.4 (8,947) 18.3 (21,599)
18.01.08 to 11.07.08 09.01.09 10.07.09 08.01.10High-Low: 0.78 - 0.55 0.65 - 0.50 0.82 - 0.50 1.46 - 0.75Av PE(wk vol): 7.9 (1,988) 7.6 (775) 8.8 (9,030) 15.6 (40,665)
Period High Low Close Vol’ 00 + 2 wk 1.19 1.12 1.15 6,814pre 2 wk 1.29 1.13 1.28 11,081
28-12-09 1.28 1.26 1.27 68529-12-09 1.28 1.25 1.26 1,56730-12-09 1.28 1.24 1.28 4,25231-12-09 1.31 1.26 1.31 3,53601-01-10 --- --- --- ---
04-01-10 1.33 1.30 1.33 1,82805-01-10 1.35 1.30 1.32 2,92506-01-10 1.35 1.29 1.35 5,78007-01-10 1.41 1.33 1.38 17,71608-01-10 1.40 1.33 1.36 4,909
Mkt Cap : RM163.200 m
Ann’d date for 2H08 : 26-FEB-09
H 5-Yr CAP ISSUE : ......................................................... bn 1:3 ex 30-06-06
FINANCIAL PRE-TAX TURNOVER M’GIN AFT-TAX & MI SH’HOLDERS ROE TOTAL ASSETS ROA TOTAL LIAB DIV EPSYR CLOSE P&L (RMm) (RMm) in % P&L (RMm) FUND (RMm) in % (RMm) in % (RMm) in RM in RM
31-12-05 10.232 100.262 10.21 8.361 69.158 12.09 88.202 9.48 19.044 --- .02031-12-06 14.284 119.239 11.98 12.199 77.720 15.70 102.221 11.93 24.501 .04 .10231-12-07 11.215 121.264 9.25 8.834 83.050 10.64 106.612 8.29 23.562 .04 .074
1H08 4.364 64.336 6.78 3.323 86.374 --- 108.564 --- 22.190 --- .02831-12-08 10.928 128.717 8.49 8.651 88.203 9.81 113.391 7.63 25.188 .04 .072
1H09 14.442 68.056 21.22 11.147 99.382 --- 126.036 --- 26.654 .05 .0939M09 18.912 97.768 19.34 14.500 98.213 --- 123.182 --- 24.969 .025 .121
Compugates Hldgs par RM0.10 Paidup RM213.429 m NAV : RM0.09 PE : NA PB : 0.8 Yield : NA Traded in RMChairman: Tan Sri Datuk Asmat Bin Karmaludin CEO/MD: Goh Kheng PeowH BUSINESS : Co is engaged in distributing a diverse range of pdts to end-users. [9M09 Geographical] M’sia (43.4%), Bangladesh (53.8%), Indonesia (2%), others (0.8%).
H INSIGHT : Dec-09, Co proposed to acq’d the remaining 40%-stake in Selama Muda Jaya from Rata Awana for RM10m. Jul-09, Co terminated an agmt with Celcom regard to the agmt that Co was appointed as distributor for the sales of Celcom’s pdts and svcs and the use of Celcom’s names, trademarks and literature. Based on the audited consolidated FY08 results, Celcom contributed ard 50% of the ttl revenue with a net loss after taxation of RM335k. Jun-09, Co proposed to acq 60%-stake in Selama Muda Jaya for RM6m. Mar-09, Co was appointed as the wholesaler of Canon’s image com-munication pdts. Co plans to tie up with MARA to develop a chain of 3k bumiputra-owned pharmacies and as the sole distributor with exclusive arrangements for Amavita Apotheke Central’s Pharma-ceutical Pdts for M’sia and ASEAN region.
9M09, Co managed to return to the black on the back of higher revenue. 3Q09 revenue fell, but Co still managed to turnaround with a profit ofRM75k as compared to a loss in 3Q08. Co’s prospect remains challenging. (23/12/09-XL)
Daily
Vol
Weekly
Vol
30.11.09 to 25.12.09 08.01.10H-Low: 0.07 - 0.06 0.085 - 0.06PE(wk vol): NA (125,984) NA (1,018,637)
18.01.08 to 11.07.08 09.01.09 10.07.09 08.01.10High-Low: 0.13 - 0.10 0.145 - 0.10 0.18 - 0.065 0.085 - 0.06Av PE(wk vol): 96.2 (62,841) 19.2 (48,476) NA (1,470,718) NA (390,514)
Period High Low Close Vol’ 00 + 2 wk 0.07 0.06 0.065 125,216pre 2 wk 0.07 0.06 0.065 126,751
28-12-09 0.065 0.06 0.065 9,38029-12-09 0.07 0.065 0.065 8,65730-12-09 0.065 0.06 0.065 3,53031-12-09 0.065 0.06 0.065 8,26901-01-10 --- --- --- ---
04-01-10 0.07 0.06 0.07 28,54705-01-10 0.085 0.065 0.075 1,247,91106-01-10 0.075 0.065 0.07 660,91507-01-10 0.07 0.065 0.065 44,26008-01-10 0.07 0.065 0.07 25,805
Mkt Cap : RM149.400 m
Ann’d date for 2H08 : 23-FEB-09FINANCIAL PRE-TAX TURNOVER M’GIN AFT-TAX & MI SH’HOLDERS ROE TOTAL ASSETS ROA TOTAL LIAB DIV EPSYR CLOSE P&L (RMm) (RMm) in % P&L (RMm) FUND (RMm) in % (RMm) in % (RMm) in RM in RM
31-12-05 1.201 60.815 1.97 – 0.642 212.790 – 0.30 242.321 – 0.26 29.531 --- PRELIST31-12-06 1.966 440.644 0.45 0.871 213.664 0.41 231.465 0.38 17.724 --- PRELIST31-12-07 25.799 586.577 4.40 12.941 225.835 5.73 265.633 4.87 29.204 --- .006
1H08 – 0.076 315.657 NA – 1.042 198.148 --- 237.148 --- 28.226 --- .00031-12-08 1.624 688.467 0.24 – 0.241 200.117 – 0.12 239.416 – 0.10 28.168 --- .000
1H09 1.724 415.716 0.41 0.341 200.862 --- 244.083 --- 31.785 --- .0009M09 2.575 589.686 0.44 0.416 201.535 --- 248.633 --- 34.471 --- .000
cr = cum right xr = ex-right cw = cum warrant xw = ex-warrant
MEb71.indd 2010-1-8, 17:341