SFDReport Chunar India - SuSanA
49
SFD Report Chunar India Final Report This SFD Report – Comprehensive level - was prepared by Centre for Science and Environment. Date of production: 26/04/2017 Last update: 04/05/2018
Transcript of SFDReport Chunar India - SuSanA

SFD Report
ChunarIndia
Final Report
This SFD Report – Comprehensive level - was preparedby Centre for Science and Environment.
Date of production: 26/04/2017Last update: 04/05/2018

SFD Report Chunar, India, 2017
Produced by:Suresh Kumar Rohilla, CSEBhitush Luthra, CSEShantanu Kumar Padhi, CSEBhavik Gupta, CSE
©CopyrightAll SFD Promotion Initiative materials are freely available following the open-source concept for capacity developmentand non-profit use, so long as proper acknowledgement of the source is made when used. Users should always givecredit in citations to the original author, source and copyright holder.
This Executive Summary and SFD Report are available from:
www.sfd.susana.org
Last Update: 04/05/2018 i
Chunar
India Produced by: CSEExecutive Summary
SFD Level:Comprehensive
Produced by:Centre for Science and Environment (CSE), NewDelhi with inputs from Chunar Nagar PalikaParishad (NPP)
Status:Final SFD report
Date of production:26/04/2017
Chunar is situated on the banks of River Gangaand River Jirgo, in the state of Uttar Pradesh, India.City lies in the Vidhyan Range, 42 km from thedistrict headquarters, Mirzapur and at a distance of273 km from the state capital, Lucknow. The city isfamous for pottery, especially of clay toys.
The population of the city, as per the Census ofIndia, 2011 is 37,185. Population density of the cityis 2,656 persons per sq.km, which is considerablyhigh, when compared to that of Uttar Pradesh, i.e.828 persons per sq.km. The slum population is9914, representing 27% of the total population(Census, 2011).
The city has sub-tropical climate. The temperatureranges between 22°C to 46°C during summerseason and 2°C to 17°C in winter season. Chunarlies in a moderate to high rainfall region, theaverage annual rainfall is 1,110 mm (UPJN, 2014).The administrative area of the city is 14 sq.km alsochosen for the current study. The local bodygoverning the city is called Chunar Nagar PalikaParishad (NPP) or municipal council.

Last Update: 04/05/2018 ii
Chunar
India Produced by: CSEExecutive Summary
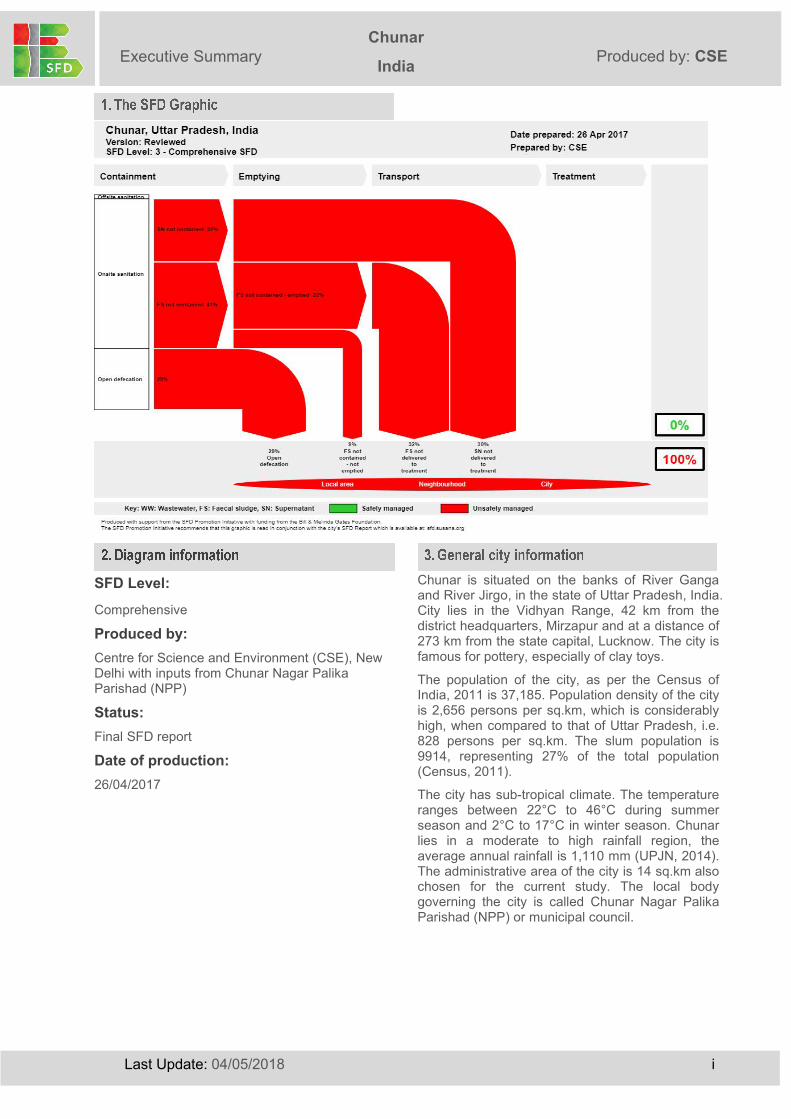
Overview on technologies and methods used fordifferent sanitation systems through the sanitationservice chain is as follows:
Containment: There is no sewerage system in thecity. 71% of the households in the city are eitherdependent on septic tanks or on lined pits, theirsizes depend on space availability and affordabilityof households. Due to no standardization beingfollowed while constructing the containmentsystem, few households have constructedtanks/pits large in capacity irrespective ofhousehold size to decrease the emptyingfrequency. Rest of the 29% of populationdefecates in open. Open defecation is mostlypractised in the wards in close proximity to RiverGanga and River Jirgo. There are ten communitytoilets available for urban poor (NPP, 2016).
Figure 1: Septic tank connected to open drain (source:Bhavik/CSE, 2016)
Emptying: Chunar NPP does not own a singlevacuum truck. The field survey revealed that mostof the settlement in the city is informal andunplanned. Due to narrow and congested roads,households are dependent on manual emptyingservice. The manual emptying is usually carriedout by 2 - 4 people, depending upon the size ofthe containment and the density of FS in thecontainment. Spade and bucket is used foremptying OSS. The charges for manual emptyingranges from INR1,500 to INR 2,000 (23 USD – 30USD).
There is no private emptier within the municipalarea but private emptiers from nearby citiesprovides the service to households andcommercial buildings. Chunar NPP shares avacuum tanker with Ahraura Nagar PalikaParishad, which is 22 km away from Chunar. Thecapacity of the vacuum tanker is 2,000 litres. Thetanker is employed for emptying service ofcommunity toilets and containment systems ofgovernment buildings. The sanitary workers do notuse any personal protective equipment (PPE) likegloves, boots and mask during emptying of OSSand cleaning of drains (NPP, 2016).
Transportation and treatment: The vacuumtankers operated by the private emptiers andUrban Local Body (ULB) are tractor mounted.
Emptiers discharge septage into open drains andopen fields, in and around the city. Wastewater(WW) and faecal sludge(FS) is conveyed throughtwenty seven major and minor nullahs. There is notreatment facility available for WW and FSgenerated in the city (NPP, 2016).
Figure 2: Nullahs discharging into: from top (i) RiverGanga; (ii) River Jirgo; and (iii) agricultural land (source:
Shantanu/CSE, 2016)
End-use/Disposal: FS and WW are dischargedinto the rivers and agricultural fields through bigand small nullahs. Out of the 27 major nullahs, 14discharge into River Ganga, 8 major nullahsdischarge into River Jirgo and the rest eventuallydischarge at agricultural fields. As much as 50% ofthe city’s WW is disposed into River Jirgo, 25% inRiver Ganga and 25% on agricultural fields. RiverJirgo meets the Ganga River during peak flowsafter flowing 16 km away from the city (NPP,2016).
There is no sewerage network in the city and 71%of the city is dependent on onsite sanitationsystems (OSS), out of which 60% are dependenton septic tanks and around 11% on pits.According to random survey and key informantinterviews (KII), community toilets are connectedto the septic tanks and hence considered in onsitesystems. Septic tanks as well as the pits are ‘notcontained’ as they are connected to open drainsand causing groundwater pollution throughseepage.
According to Census 2011, 29% of the populationstill practices open defecation, which was foundtrue based on comprehensive study.

Last Update: 04/05/2018 iii
Chunar
India Produced by: CSEExecutive Summary
There is no clear differentiation between thevolume of effluent and solid FS generated fromseptic tanks, hence to reduce the maximum error,it’s assumed to be 50% each. Therefore, 30% ofFS is assumed to be effluent that goes into opendrains and rest of FS is emptied from tankswhenever full. Even FS from pits is considerednot-contained and is calculated as 11% whichincludes infiltration of water as well. Some FS isalways left in the tanks and pits and is assumed tobe 3%.
National Urban Sanitation Policy (NUSP) wasissued in 2008, by the Ministry of Housing andUrban Affairs (MoHUA, GoI), formerly known asMinistry of Urban Development (MoUD). The policyaims to: raise awareness, promote behavior change;achieve open defecation free cities; developcitywide sanitation plans; and provide 100% safeconfinement, transport, treatment and disposal ofhuman excreta and liquid wastes. The NUSPmandates states to develop state urban sanitationstrategies and work with cities to develop CitySanitation Plans (CSPs).
NUSP identifies the constitution of multi-stakeholdertask force, known as city sanitation taskforce (CSTF)as one of the reforms to be taken up to start the citysanitation planning process. CSTF has now beenrenamed as Swachh Bharat City Level Task Force(SBCLTF) (MoUD, 2014)
The Environment (Protection) Act, 1986 and theWater (Prevention and Control of Pollution) Act,1974 have provisions relating to sanitation servicesand environmental regulations. It applies tohouseholds and cities with regard to disposingwastes into the environment. ULBs/ utilities alsohave to comply with discharge norms for effluentreleased from sewage treatment plants and to paywater cess under the Water Cess Act, 1977 (MoUD,2013).
In February 2017, MoHUA issued the NationalPolicy on Faecal Sludge and SeptageManagement (FSSM). The policy aims to set thecontext, priorities, and direction for, and tofacilitate, nationwide implementation of FSSMservices in all ULBs such that safe andsustainable sanitation becomes a reality for all ineach and every household, street, town and city inIndia (MoUD, 2017).
There are various schemes launched by centralgovernment to provide basic civic amenitiesincluding improvement of urban sanitation. UnderSwachh Bharat Mission (SBM), 16 individualhouseholds’ toilets and 9 community toilets havebeen approved but no toilet has been constructedyet. The city has proposed to National Mission forClean Ganga (NMCG): laying of 60.7 km sewerline, installation of a 6.5 MLD Sewage Treatment
Plant (STP) and interception of drains to abatepollution in the Ganga River (NPP, 2016).
The Chunar NPP did a rapid assessment of FSMin city to calculate the funds required for the same.It was estimated that INR 325 million (2.16 millionUSD) is required for implementation of effectiveFS and septage management including operationand maintenance for five years (MoUD, 2016).
The 74th Constitutional Amendment Act of 1992reformed the sector by transferring responsibilityfor domestic, industrial, and commercial watersupply and sewerage (WSS) from state agencies,such as Departments of Public Health Engineeringand State Water Boards, to Urban Local Bodies(ULBs). This transfer has resulted in a variety ofimplementation models, as well as lack of clarity inthe allocation of roles and responsibilities betweenstate and local agencies, which sometimes resultin large gaps in implementation (USAID, 2010).
Key Stakeholders Institutions / Organizations
Public institutions
Minsitry of Housing and Urban Affairs (MoHUA),National Ganga Council, Ganga Pollution ControlUnit, UP Jal Nigam (UPJN), Urban DevelopmentDepartment (UDD), Nagar Palika Parishad-Chunar (CNPP), District Urban DevelopmentAuthority (DUDA) Uttar Pradesh Pollution ControlBoard, Varanasi, Uttar Pradesh (UPPCB), StateLevel Programme Management Group (SPMG)
NGOs Centre for Science and Environment
Private sector Private emptiers, local masons
Others SBCLTFTable 1: Key stakeholders (Source: CSE, 2016)
UPJN is responsible for planning, designing andconstruction/development of the assets in watersupply, sewerage and drainage sector, while NPP isresponsible for operation and maintenance of assets(MoUD, 2013).
UDD is responsible for administrative and financialmanagement of municipalities, implementation ofdevelopment programmes. UPPCB is responsiblefor monitoring river pollution. DUDA is responsiblefor the implementation of central and stategovernment’s schemes. CNPP is responsible forseptage management. SPMG coordinates andoversee the implementation of projects sanctionedby Government of India under National GangaCouncil (NGC).
SBCLTF is a multi-stakeholder platform comprisingrepresentatives from different sectors of society,including agencies directly responsible for sanitation,agencies indirectly involved or impacted, eminentpersons, practitioners, NGOs and sanitary workers.

Last Update: 04/05/2018 iv
Chunar
India Produced by: CSEExecutive Summary
As mentioned in section 4, 69% of the population isdependent on onsite sanitation systems. Out of69% of the population, 56% of the population isdependent on septic tanks connected to open drainor storm sewer. 13% of the population, dependenton lined pit with semi-permeable walls and openbottom, is attributed to be FS not contained.
The only difference suggested in the context-adapted SFD is at containment stage for correctlydesigned septic tanks.
With an earlier assumption of 50% of the proportionof the content of the septic tank is solid FS,generated and collected inside the septic tanks.Rest of the 50% of the content is supernatant, whichattributes to 8% of the population that flows throughopen drains. According to SBCLTF the solid FScollected in the septic tank should be consideredcontained as it is neither polluting the ground waternor the solid excreta are overflowing in the opendrain. Hence 28% of FS is considered contained(represented green in colour). 25% FS contained isemptied and remaining 3% FS remains in the tankwhich is contained and never emptied.Nevertheless, the supernatant generated fromseptic tank connected to open drain is not containedand hence considered to be unsafely managed(represented red in colour).
Hence in the context-adapted SFD, the ‘FS notcontained’ changes from 100% to 97%, ‘FScontained’ becomes 3% and ‘SN not contained’remains 28% when compared to SFD generatedthrough graphic generator.
Overall excreta of 97% population are not managedsafely according to the context-adapted SFD.
Data are collected through secondary sources. Thecity is visited to conduct the surveys, FGDs and KIIswith relevant stakeholders, to fill in the data gap andto cross-check the data collected. To start with, arelationship between sanitation technologies definedin Census of India and that defined in the project isestablished. The survey data are quantified andcross-checked with FGDs and KIIs.
Due to lack of data available on excreta generatedby floating population in commercial areas andinstitutional buildings, an assumption of 10% of totalpopulation is added with the census population inthe SFD graphic generator.
The data are fed into the calculation tool to calculatethe excreta flow in terms of percentage of thepopulation. It can be concluded that excreta of thewhole population are discharged untreated in theenvironment.
The SFD graphic of Chunar city, developed usinggraphic generator is not able to capture the correctly

Last Update: 04/05/2018 v
Chunar
India Produced by: CSEExecutive Summary
designed fully functional septic tanks as a containedsystem, as based on feedback from SBCLTF.
Hence, a context-adapted city specific SFD graphicis manually corrected to convey the substantialpicture of the excreta management in the city.
Two key sources of data are used; Census of India,2011 and published documents of relevantdepartments. Most of the data are then updated byKIIs. Overall three FGDs and one KII have beenconducted with different stakeholders.There were three major challenges to develop theSFD. Census and published/unpublished reportswere not able to provide (i) up-to-date data oncontainment (ii) detailed typology of containmentand (iii) actual information about FSM servicesprovided to households. For this reason, field basedstudies were conducted to validate the dataprovided by secondary sources.
The Census and published/unpublished reportsmostly differentiate between systems connected tothe user interface, if any, but does not giveinformation about the design of actual containmentsystems on ground level or about the disposal ofseptage and wastewater generated.
Therefore, random household survey wasconducted strategically in few wards of the city toidentify and cross check the data collected from thesecondary sources.
Below is the list of data sources used for thedevelopment of SFD.
o Published reports and books: Census of India 2011, House listing and
housing data, Government of Indiao KIIs with representatives from
Chunar NPP: Sanitary Inspectoro FGDs
Chunar NPP staff and council members Local masons SBCLTF members
o Random household survey
Chunar, India, 2017
Produced by:Suresh Kumar Rohilla, CSE
Bhitush Luthra, CSE
Shantanu Kumar Padhi, CSE
Bhavik Gupta, CSE
© CopyrightAll SFD Promotion Initiative materials are freelyavailable following the open-source concept forcapacity development and non-profit use, solong as proper acknowledgement of the sourceis made when used. Users should always givecredit in citations to the original author, sourceand copyright holder.
This Executive Summary and the SFD Reportare available from: www.sfd.susana.org

Last Update: 04/05/2018 vi
Chunar
India Produced by:CSESFD Report
Table of contentsExecutive summary……………………………………………………………………………………i
Table of contents..…………………………………………………………………………………….v
List of tables…………………………………………………………………………………………..vii
List of figures…………………………………………………………………………......................viii
Abbreviations………………………………………………………………………………………….ix
1 City context.....................................................................................................................................1
2 Service outcomes.......................................................................................................................... 3
2.1 Overview................................................................................................................................. 3
2.1.1 Sanitation facilities.........................................................................................................3
2.1.2 Containment................................................................................................................... 4
2.1.3 Emptying......................................................................................................................... 5
2.1.4 Transportation and treatment...................................................................................... 5
2.1.5 End-use/Disposal...........................................................................................................5
2.2 SFD matrix..............................................................................................................................7
2.2.1 SFD matrix explanation................................................................................................ 7
2.2.2 Risk of groundwater contamination............................................................................ 8
2.2.3 Discussion of certainty/uncertainty levels of associated data................................ 8
2.3 Context-adapted SFD........................................................................................................... 9
3 Service delivery context description.........................................................................................11
3.1 Policy, legislation and regulation.......................................................................................11
3.1.1 Policy, legislations and regulations at national level..............................................11
3.1.2 Policies, legislations and regulations at state level and ULB level......................12
3.1.3 Institutional roles..........................................................................................................13
3.1.4 Service provision......................................................................................................... 15
3.1.5 Service standards........................................................................................................15
3.2 Planning................................................................................................................................ 16
3.2.1 Service targets.............................................................................................................16
3.2.2 Investments.................................................................................................................. 17
3.3 Reducing inequity................................................................................................................18
3.3.1 Current choice of services for the urban poor.........................................................18
3.3.2 Plans and measures to reduce inequity...................................................................18

Last Update: 04/05/2018 vii
Chunar
India Produced by:CSESFD Report
3.4 Outputs..................................................................................................................................18
3.4.1 Capacity to meet service needs, demands and targets........................................18
3.4.2 Monitoring and reporting access to services...........................................................19
3.5 Expansion.............................................................................................................................19
3.5.1 Stimulating demand for services...............................................................................20
3.5.2 Strengthening service provider roles........................................................................20
4 Stakeholder engagement...........................................................................................................21
4.1 Key informant interviews.................................................................................................... 21
4.2 Field observations............................................................................................................... 21
4.3 Focus group discussions....................................................................................................21
5 Acknowledgement.......................................................................................................................23
6 References................................................................................................................................... 24
7 Appendix.......................................................................................................................................26
7.1 Stakeholder identification...................................................................................................26
7.2 Tracking of engagement.....................................................................................................27
7.3 SFD graphic..........................................................................................................................28
7.4 SFD brief explanation......................................................................................................... 29
7.5 Context-adapted SFD Graphic..........................................................................................30
7.6 SFD selection grid...............................................................................................................31
7.7 SFD matrix............................................................................................................................31
7.8 List of community/public toilets..........................................................................................32
7.9 Swachh Bharat City Level Task Force – Chunar........................................................... 33
7.10 Photographs captured during field visit............................................................................34
7.11 Questionnaires for random household survey and emptiers........................................35

Last Update: 04/05/2018 viii
Chunar
India Produced by:CSESFD Report
List of tablesTable 1: Population growth rate.......................................................................................................... 1
Table 2: Sanitation technologies and corresponding percentages of population........................3
Table 3: Description of variables used for defining containment systems....................................7
Table 4: Description of variables used in SFD..................................................................................7
Table 5: Roles and responsibilities...................................................................................................14
Table 6: Service delivery targets in accordance with SLBs..........................................................16
Table 7: Service delivery progress in accordance with SBM....................................................... 17
Table 8: Status of fund released in the year 2015 in accordance with SBM.............................17
Table 9: Estimate of CAPEX and OPEX for FSSM....................................................................... 17
Table 10: Stakeholder identification................................................................................................. 26
Table 11: Tracking of engagement...................................................................................................27
Table 12: Percentage of the population using each system technology and method..............29
Table 13: SFD matrix..........................................................................................................................31
Table 14: Details of community/public toilets..................................................................................32
Table 15: Details of the community toilets proposed under SBM................................................32

Last Update: 04/05/2018 ix
Chunar
India Produced by:CSESFD Report
List of figuresFigure 1: Ward map of Chunar city.....................................................................................................2
Figure 2: Septic tank with effluent pipe connected to open drain..................................................4
Figure 3: Wastewater conveyed through open storm-water drains...............................................5
Figure 4: Nullahs discharging wastewater on agriculture fields.....................................................6
Figure 5: Nullahs discharging wastewater into River Ganga .........................................................6
Figure 6: Nullahs carrying wastewater...............................................................................................6
Figure 7: SFD Graphic........................................................................................................................28
Figure 8: Context-adapted SFD Graphic.........................................................................................30
Figure 9: SFD selection grid.............................................................................................................. 31
Figure 10: FGD with SBLTF members.............................................................................................33
Figure 11: Community toilet at Balughat..........................................................................................34
Figure 12: Solid waste dumping site................................................................................................ 34
Figure 13: Wastewater discharged at low-lying land in the city...................................................34

Last Update: 04/05/2018 x
Chunar
India Produced by:CSESFD Report
AbbreviationsAMRUT Atal Mission for Rejuvenation and Urban TransformationBIS Bureau of Indian StandardCAPEX Capital ExpenditureCGWB Central Ground Water BoardCNPP Nagar Palika Parishad – ChunarCPCB Central Pollution Control BoardCPHEEO Central Public Health and Environmental Engineering OrganizationCSE Centre for Science and EnvironmentCSP City Sanitation PlanCSTF City Sanitation Task ForceCT Community ToiletsDUDA District Urban Development AuthorityEWS Economically Weaker SectionsFC Finance CommissionFGD Focus Group DiscussionFS Faecal SludgeFSM Faecal Sludge ManagementFSSM Faecal Sludge and Septage ManagementGoI Government of IndiaGoUP Government of Uttar PradeshINR Indian RupeeKII Key Informant InterviewLPCD Litres per Capita per DayMHUPA Ministry of Housing and Urban Poverty AlleviationMIS Management Information SystemMLD Million Litres per DayMoSJE Ministry of Social Justice and EmpowermentMoHUA Ministry of Housing and Urban Affairs (formerly known as Ministry of Urban Development)
MoUD Ministry of Urban DevelopmentMoWRRD&GR Ministry of Water Resources, River Development and Ganga RejuvenationMPS Main Pumping StationMSL Mean Sea LevelNBC National Building CodeNFSSM National Faecal Sludge and Septage Management AllianceNGC National Ganga CouncilNIC National Informatics CentreNITI National Institution of Transforming IndiaNIUA National Institute of Urban AffairsNPP Nagar Palika ParishadOD Open DefecationOPEX Operational ExpenditureOSS Onsite Sanitation System

Last Update: 04/05/2018 xi
Chunar
India Produced by:CSESFD Report
PMAY Pradhan Mantri Awas YojnaPPE Personal Protective EquipmentPT Public ToiletsSBCLTF Swachh Bharat City Level Task ForceSFD Shit Flow DiagramSLB Service Level BenchmarkSN SupernatantSPS Sewage Pumping StationSTP Sewage Treatment PlantSUDA State Urban Development AgencySWM Solid Waste ManagementUDD Urban Development DepartmentULB Urban Local BodyUPJN Uttar Pradesh Jal NigamUPPCB Uttar Pradesh Pollution Control BoardUPSIDC Uttar Pradesh State Industrial Development CorporationUSAID United States Agency for International DevelopmentUSD United States Dollar (1 USD = 66.5 INR)WSS Water Supply and SewerageWW Waste Water

Last Update: 04/05/2018 1
Chunar
India Produced by:CSESFD Report
1 City contextChunar is situated on the banks of River Ganga and River Jirgo, in the state of Uttar Pradesh,India. City lies in the Vidhyan Range, 42 km from the district headquarters, Mirzapur, and ata distance of 273 km from the state capital, Lucknow. From historical point of view, Chunarachieved its name from the presence of Chunar Fort in the city, which was constructed in1029 by King Sahadeo and later by Sher Khan in 1532, by Sher Shah Suri in 1538 and byAkbar in 1575 (NIC, 2016).
The population of the city, as per the Census of India, 2011 is 37,185. Population density ofthe city is 2656 persons per sq.km, which is considerably high, when compared to that ofUttar Pradesh, i.e. 828 persons per sq.km. The slum population is 9914, representing 27% ofthe total population (Census, 2011). The population growth rate of the city is given in Table 1.The administrative area under Nagar Palika Parishad (NPP) or municipal council of Chunaris 14 sq.km (NPP, 2016) and the municipal boundary has been chosen for the current study.The city is divided into 25 municipal wards.
Table 1: Population growth rate
Censusyear Population Growth rate
(%)
1991 27,778 __
2001 33,933 22
2011 37,185 10
Source: Census, 2011
Primary mode of earning livelihood is agriculture and agro-based business. Chunar is wellknown for its small and micro scale pottery industries especially of clay toys. There isintermittent water supply and inadequate sanitary facilities (UPJN, 2014).
The city is located at 25o7’48’’N latitude and 82o54’E longitude with an average altitude of 84m above Mean Sea Level (MSL). Agro and sub-agro climatic zones of Chunar city falls undereastern plain zone of Uttar Pradesh. The climate is dry sub-humid to moist sub humid. Thetemperature rises maximum to 41.8°C during peak summer season and drops down tominimum of 9.6°C during the winter season. Chunar city lies in a moderate to high rainfallregion with the lowest being in April up to 3 mm and highest in August up to 345 mm (UPJN,2014).

Last Update: 04/05/2018 2
Chunar
India Produced by:CSESFD Report
Figure 1: Ward map of Chunar city.

Last Update: 04/05/2018 3
Chunar
India Produced by:CSESFD Report
2 Service outcomesAnalysis is based on data available from Census, 2011, published reports of government,non-profit organizations and random household survey. Data collected from secondarysources are triangulated in comprehensive study. Data on the containment are available inCensus 2011. Data have been cross-checked and updated by Key Informant Interviews (KIIs)and Focus Group Discussions (FGDs). According to the SFD promotion initiative (PI)definitions of sanitation systems, the types of containments prevalent in the wards areexamined through household survey (for details refer Table 2). Data on emptying, transport,treatment and disposal of FS are collected through KIIs with ULB, private emptiers andparastatal body. However most of the data are qualitative.
2.1 Overview
To start with, a relationship between sanitation technologies defined in Census of India andthe variables defined in the project is established. Then the population dependent on thosesystems is represented in terms of percentage of population, as shown in Table 2 below:
Table 2: Sanitation technologies and corresponding percentages of population
S.No.
Sanitation technologies and systems as defined by: SFDreferencevariable
Percentageof
populationCensus of India SFD Promotion Initiative
1 Piped sewersystem
User interface discharges directly to a centralized foul/separatesewer. T1A1C2 9
2 Septic tank Septic tank connected to open drain or storm sewer T1A2C6 53
3 Other Systems User interface discharges directly to open ground T1A2C8 2.6
4 Pit latrine withslab
Lined pit with semi-permeable walls and open bottom, no outlet oroverflow, general situation T1A5C10 0.7
5 Pit latrine withoutslab
Unlined pit no outlet or overflow, general situation T1A6C10 0.2
6Night soildisposed intoopen drain
User interface discharges directly to open drain or storm drainT1A1C6 0.2
7 Service latrine User interface discharges directly to ‘don‟t know where‟ T1A1C9 0.1
8 Public latrine Septic tank connected to open drain or storm sewer T1A2C6 3.1
9 Open defecation Open defecation T1B11C7TO C9 31
Source: Census of India, 2011
2.1.1 Sanitation facilities
This section presents on existing sanitation facilities in institutions, commercialestablishments, slums and facilities for tourists.
Community/public toilets: It is reported that there are 10 community toilets and no publictoilets in the city. All the community toilets are connected to septic tanks. The size and

Last Update: 04/05/2018 4
Chunar
India Produced by:CSESFD Report
design of septic tanks of the public toilets do not meet the design standards as stipulated inthe CPHEEO manual on sewerage and sewage treatment systems. Septage is emptied fromthe community toilets in every 200 days by the NPP and the collected septage isindiscriminately disposed at any low-lying areas in the city (NPP, 2016).
School sanitation: There are a total of 22 schools in the municipal area, out which 14 aregovernment aided and the rest 8 are privately owned. Also, there are 4 inter-colleges, ofwhich 2 are government aided and the other 2 are privately owned. All the educationalinstitutions have separate toilets for boys and girls. The user interface discharges the wasteinto septic tanks connected to soak pits. In general, the septic tanks are either 2 or 3chambered of size 7 m3 and soak pits are 1.8 m diameter and 2.4 m in depth (NPP, 2016).
Hospitals: There are 3 privately owned nursing homes and 1 government hospital in themunicipality area. All have separate toilets for men and women; the user interface isconnected to lined pits with semi-permeable wall and open bottom (NPP, 2016).
Commercial areas: Commercial areas comprise of roadside shops; informal markets; 6government and 2 private banks; and 8 private and 10 government banquet halls. All thebanks and banquet halls have toilets connected to septic tanks with outlet connected toopen/ storm-water drains (NPP, 2016).
Although the city witnesses a significant footfall in the fort especially during festivals. Due tolack of data on excreta generated by floating population in commercial areas and institutionalbuildings, around 10% (3,718) of total population is assumed to be the floating population. Itis also estimated that this population is dependent on septic tanks connected to open drain,as most of the institutions and commercial areas are dependent on septic tanks. The floatingpopulation is also considered while developing the SFD.
2.1.2 Containment
According to Census 2011, there is a sewer network in the city which covers about 9% of thehouseholds, but the field-based study revealed that there is no sewer network. Most of thehouseholds are either dependent on septic tank or lined pit, the size of which is dependenton space availability and affordability of households. Due to no standardization beingfollowed while constructing the containment system, often tanks and pits are constructedlarge in capacity irrespective of household size. A significant population defecates in open.Households’ deprived of toilets practices OD in the wards that are in close proximity to RiverGanga and River Jirgo.
Figure 2: Septic tank with effluent pipe connected to open drain (Source: Shantanu/CSE, 2016)

Last Update: 04/05/2018 5
Chunar
India Produced by:CSESFD Report
2.1.3 Emptying
Although 71% of the population is dependent on on-site sanitation facilities, Chunar NagarPalika Parishad (NPP) does not own a single vacuum tanker. The field survey revealed thatmost of the settlement in the city is informal and unplanned. Due to narrow and congestedroads, households are dependent on manual emptying service through private emptiers. Themanual emptying is usually carried out by 2 - 4 people, depending upon the size of thecontainment and the degree of density of FS in the containment. In general, frequency ofemptying the containment system is more than 5 years. Manual emptying is still prevalent.Spade and bucket are used by manual emptiers for emptying OSS without any safety gears.The emptying service fee ranges from INR1500 to INR 2,000 (23 USD – 30 USD) (KII, 2016).During the random household survey, it was alleged that vacuum tankers owned by privateemptiers from nearby cities also ply in the Chunar city. The private emptiers could not betracked due to non- availability of emptiers in the city during field based study by researchers.
Chunar NPP often hires a vacuum tanker from Ahraura Nagar Palika Parishad, which is 22km away from Chunar city. The capacity of the vacuum tanker is 2,000 litres. The tanker isemployed for providing emptying service to community toilets and government buildings. Thesanitary workers of the NPP do not use any personal protective equipment(PPE) like gloves,boots and mask during emptying of OSS and cleaning of drains (NPP, 2016).
2.1.4 Transportation and treatment
Emptiers discharge FS into open drains or any low-lying open grounds in and around the city.WW is conveyed through open drains in the city, which finally converge into twenty sevenmajor nullahs. There is no treatment of WW and FS generated in the city (NPP, 2016).
2.1.5 End-use/Disposal
At present, Chunar is completely non- sewered and emptiers discharge the faecal waste atlow-lying open grounds anywhere in and around the city. Depending upon the irrigationrequirement of the crops, farmers often draws WW and supernatant flows from big and smallnullahs passing through their agriculture fields. Out of the 27 major nullahs, 14 discharge intoRiver Ganga, 8 discharge into River Jirgo and the rest eventually discharge at agriculturalfields. As much as 50% of the city’s WW is disposed into River Jirgo, 25% in River Ganga
Figure 3: Wastewater conveyed through open storm-water drains (Source: Bhavik/CSE, 2016)

Last Update: 04/05/2018 6
Chunar
India Produced by:CSESFD Report
and 25% on agricultural fields. River Jirgo runs almost dry when it meets the Ganga Riverafter flowing for 16 km (NPP, 2016).
Figure 6: Nullahs carrying wastewater (Source: Shantanu/CSE, 2016)
Figure 4: Nullahs discharging wastewater on agriculture fields (Source: Shantanu/CSE, 2016)
Figure 5: Nullahs discharging wastewater into River Ganga (Source: Shantanu/CSE, 2016)

Last Update: 04/05/2018 7
Chunar
India Produced by:CSESFD Report
2.2 SFD matrix
The SFD matrix is shown in Appendix 7.7 and the final SFD for Chunar is presented inappendix 7.3.
2.2.1 SFD matrix explanation
Definition and estimation of different variables (used to make SFD) are explained below inTable 3 and 4.
Table 3: Description of variables used for defining containment systems
S. No. Variables Description (city context) Percentage ofpopulation
1 T1A2C5 User interface discharging to septic tank connected to open drain or storm sewer. 60
2 T2A5C10 User interface discharging to lined pit with semi-permeable walls and open bottom 11
3 T1B11C7 Open defecation 29
Source: CSE, 2016
Table 4: Description of variables used in SFD
Systemtype
Variables Description (city context) Percentage ofpopulation
Onsite
SN notcontained
Supernatant is the effluent from the outlet of onsite sanitation technology(T1A2C6) that is conveyed through open drains
30
SN not deliveredto treatment
Supernatant from the onsite sanitation technology (T1A2C6) that isconveyed through open drains : Discharges to the Ganga and Jirgo River Is applied to land for irrigation
30
FS notcontained
Faecal Sludge from the onsite sanitation technology (T1A2C6 andT2A5C10), where the depth of groundwater is low and there is‘significant risk’ of groundwater contamination.
41
FS notcontained –emptied
Faecal sludge is removed from the onsite sanitation technology(T1A2C6 and T2A5C10) where FS is not contained, which is emptied,using either motorized or manual emptying equipment.
32
FS not deliveredto treatment
Emptied Faecal Sludge that is either discharged into water body (GangaRiver and Jirgo River) or discharged on agricultural fields.
32
FS notcontained notemptied
Faecal Sludge not contained not emptied from OSS (T2A5C10 andT1A2C6) remains in the system and cannot be emptied.
9
Opendefecation
Open defecation With no user interface, users defecate in water bodies or on openground; consequently the excreta are not contained.
29
Source: CSE, 2016
Offsite systemsAccording to the Census, 9% of the city is dependent on sewer system, but at present, asper KII, FGD and field survey, the city is completely un-sewered. Hence it is considered thatthere is no sewerage network in the city.
Onsite sanitation systems71% of the city is dependent on onsite sanitation systems (OSS), out of which 60% aredependent on septic tanks and 11% on pits. Septic tanks are ‘not contained’ as they are

Last Update: 04/05/2018 8
Chunar
India Produced by:CSESFD Report
connected to open drains. FS from pits is also considered ‘not contained’ as the infiltratepollutes the ground water.
There is no clear differentiation between the volume of effluent and solid FS generated fromseptic tanks, hence to reduce the maximum error, it’s assumed to be 50% each. Therefore,30% of FS is assumed to be effluent (supernatant) that goes into open drains and rest 41%of FS (30% from septic tank and 11% from pits) from OSS is considered to be solid FS i.e.not contained. 50% of FS from pits, i.e. around 6% is assumed to be infiltrating into theground. It is also assumed that 90% of the population (dependent on onsite systems) getstheir system emptied when full. Hence around 32% of FS (not contained) is emptied and 3%FS (not contained) remains in the tank. So, total FS not contained- not emptied, comes out tobe 9% which includes the infiltrate from the pits as well i.e. 6%.
Open defecation29% of the population still practices open defecation.
It can be concluded that excreta of the whole city’s population are discharged untreated inthe rivers/agricultural fields therefore it is unsafely managed. The Appendix 7.4 summarizesthe percentage of the population using each sanitation technology and method along theservice chain.
2.2.2 Risk of groundwater contamination
Uttar Pradesh is covered with rich fertile soil and underlain by a large thickness of alluviummaking it one of the richest ground water repositories of the world (CGWB, 2014).
The SFD assessment includes the risk of groundwater pollution as an important factor indetermining whether excreta are contained or not contained. If the risk of contamination togroundwater is low then FS is considered “contained”. The type of onsite sanitationtechnology in use also has an influence on infiltration of liquid into the groundwater andtherefore on the potential risk of groundwater pollution.
Based on the survey with households and KIIs in Chunar, it was decided to characterize allexisting sanitation containment systems as having “significant risk‟ of groundwater pollution,as groundwater table is less than 10 mbgl (CGWB, 2014) . The NPP supplies drinking waterto the residents through deep tube-wells, groundwater being the most common source ofwater (NPP, 2016) . According to the Census, 75% of the population is dependent on pipedwater supply and the rest on hand pumps. Household survey and FGD with NPP revealed80% of the respondents are dependent on piped water supply through municipal bore wells,which also includes public tap water and households dependent on community based pipedwater connections. 20% of the respondents were depended on personal hand pumps, wellsand submersible pumps. Also, 53% of the respondents dependent on piped water supplyhave their private hand pumps as backup.
2.2.3 Discussion of certainty/uncertainty levels of associated data
There were three major challenges to develop the SFD. Census and published/unpublishedreports were not able to provide completely (i) up-to-date data on containment (ii) detailedtypology of containment and (iii) actual information about FSM services provided to

Last Update: 04/05/2018 9
Chunar
India Produced by:CSESFD Report
households. For this reason, field based studies were conducted to validate the data andtriangulation of data provided by secondary sources.
The Census mostly differentiate between systems connected to the user interface, if any, butdoes not give information about the design of actual containment systems on ground level orabout the disposal of septage and WW generated. Therefore, a random household samplesurvey was conducted in few wards of the city to identify and cross check the data collectedfrom secondary sources. The census data are solely derived from the responses of the headof the household. Since there is no mechanism to cross verify the responses, there could bemisreporting of the information due to various reasons including inadequate knowledge of therespondents or enumerators.
Although the number of households considered per ward was less to represent the whole city,the random households surveyed were from the different typology of settlements anddifferent socio-economic backgrounds
Assumption regarding the volume of FS emptied as compared to FS generated has highimpact on the overall SFD. Reliable method for estimating quantities of FS generated on acitywide scale do not yet exist, and it is complicated because the containment size andemptying period greatly varies. Since there is no clear differentiation between volume ofeffluent/supernatant and septage generated from septic tanks and lined tanks, hence it’sassumed to be 50% each. Based on survey, it is assumed that, respondents getting theirOSS emptied within 10 years are using their systems with emptying and respondents gettingtheir OSS emptied after 10 years are using their system without emptying. In the matrix it isassumed that 90% of the population gets containment systems emptied when full.
The objective of the survey conducted was to obtain a more accurate measure of howexcreta are managed through stages of sanitation service chain (from containment to end-use or disposal). To reduce the uncertainty around the data collected, the draft SFD wasprepared and presented to the SBCLTF, based on their feedback a context-adapted SFDwas prepared.
2.3 Context-adapted SFD
According to the SBCLTF, SFD generated by graphic generator is not sufficiently visualizingthe actual situation at containment stage of sanitation chain. According to the stakeholdersthe properly designed septic tanks, which are regularly emptied, should be consideredcontained even if the supernatant is discharged into open drains. Hence, a context-adaptedcity specific SFD graphic is manually corrected to convey the true picture of the excretamanagement in the city.
Please refer Appendix 7.5 for the context adapted SFD graphic. There is no major changedone in the graphic. The only difference suggested in the context-adapted SFD graphic is atcontainment stage, i.e. for correctly designed septic tanks. Out of 69% of the population,dependent on onsite sanitation system, 56% of the population is dependent on septic tanksconnected to open drain or storm sewer. 13% of the population, dependent on lined pit withsemipermeable walls and open bottom, is attributed to be FS not contained.
With an earlier assumption of 50% of the proportion of the content of the septic tank is solidFS, rest of the 50% is assumed to be supernatant, which attributes to 28% of the population,

Last Update: 04/05/2018 10
Chunar
India Produced by:CSESFD Report
that flows through open drains. According to SBCLTF the solid FS collected in the septic tank(attributed to 28% population) should be considered contained as it is neither polluting theground water nor the solid excreta are overflowing in the open drain. Hence 28% of FS isconsidered contained (represented green in colour). 25% FS contained is emptied and rest3% FS remains in the tank which is contained and never emptied. Nevertheless, thesupernatant generated from septic tank connected to open drain is not contained and henceconsidered to be unsafely managed (represented red in colour).
Hence in the context-adapted SFD, the ‘FS not contained’ changes from 100% to 97%, ‘FScontained’ becomes 3% and ‘SN not contained’ remains 28% when compared to SFDgenerated through graphic generator.Overall excreta of 97% population are not managed safely according to the context-adaptedSFD. The graphic is well received by the stakeholder's group and city’s authority has agreedthat the context-adapted SFD graphic is representing much closer picture to the groundconditions.

Last Update: 04/05/2018 11
Chunar
India Produced by:CSESFD Report
3 Service delivery context description
3.1 Policy, legislation and regulation
3.1.1 Policy, legislations and regulations at national level
In 2008, the Ministry of Housing and Urban Affairs (MoHUA), formerly known as Ministry ofUrban Development (MoUD) issued the National Urban Sanitation Policy (NUSP). The policyaims to: raise awareness; promote behaviour change; achieve open defecation free cities;develop citywide sanitation plans; and provide 100% safe confinement, transport, treatmentand disposal of human excreta and liquid wastes. The NUSP mandates states to developstate urban sanitation strategies and work with cities to develop City Sanitation Plans (CSPs).NUSP specifically highlights the importance of safe and hygienic facilities with properdisposal and treatment of sludge from on-site installations (septic tanks, pit latrines, etc.) andproper operation and maintenance (O&M) of all sanitary facilities. Furthermore, it explicitlystates that cities and states must issue policies and technical solutions that address onsitesanitation, including the safe confinement of Faecal Sludge (FS) (USAID, 2010) . Theobjectives of NUSP are to be realized through CSPs and state sanitation strategies. NUSPidentifies the constitution of multi-stakeholder task force as one of the principal activities tobe taken up to start the city sanitation planning process. As per the requirement of CSP,major role is to be played by the members of institutions, organizations, individuals, NGOs,academics, media representatives, local councillors, industry owners, consultants,representatives of private sector, etc. Constitution of Swachh Bharat City Level Task Force(SBCLTF) formerly known as City Sanitation Task Force (CSTF) is facilitated by drawingmembers from these groups in consensus with citizens who will be constantly supporting theCSP preparation by analyzing the strengths and competencies required to overcome thecurrent situation and to improve sanitation facilities (MoUD, 2014).
The advisory note on septage management in urban India, issued by MoHUA in 2013,recommends supplementing CSPs with a Septage Management Sub-Plan (SMP), preparedand implemented by cities. Septage here broadly refers to not only FS removed from septictanks but also that removed from pit latrines and similar on-site systems. This advisoryprovides reference to Central Public Health and Environmental Engineering Organisation(CPHEEO) guidelines, Bureau of Indian Standard (BIS), and other resources that users ofthis advisory may refer, for details while preparing their SMP (MoUD, 2013). The advisoryclearly discusses the techno-managerial and socio-economic aspects of septagemanagement in India and provides guidelines for Urban Local Bodies (ULBs) to plan andimplement SMP. A draft of Urban and Regional Development Plan Guidelines Formulationand Implementation promotes efficient implementation mechanisms and innovativetechniques for planned socio‐ economic development of urban areas. Under infrastructureplanning-physical infrastructure, the guidelines focus on sewage and sanitation includingseptage management in planning and implementation (MoUD, 2014a).
The Environment (Protection) Act, 1986 and the Water (Prevention and Control of Pollution)Act, 1974 have provisions relating to sanitation services and environmental regulations. Itapplies to households and cities with regard to disposing wastes into the environment. ULBs/utilities also have to comply with discharge norms for effluent released from sewagetreatment plants and to pay water cess under the Water Cess Act, 1977. The ULB is

Last Update: 04/05/2018 12
Chunar
India Produced by:CSESFD Report
responsible for ensuring the safe handling and disposal of septage generated within itsboundaries, for complying with the Water Act and for meeting all state permit requirementsand regulations (CSE, 2010). Municipal acts and regulations usually refer to management ofsolid and liquid wastes but may not provide detailed rules for septage management (MoUD,2013).
The Prohibition of Employment as Manual Scavengers and their Rehabilitation Act is enactedin 2013. This act prohibits employment of manual scavengers and insanitary latrines - Layingstrong emphasis on rehabilitation of manual scavengers. The broad objectives of the act areto eliminate insanitary latrines, prohibit the employment of manual scavengers and thehazardous manual cleaning of sewer and septic tanks, and to maintain a survey of manualscavengers and their rehabilitation (MoSJE, 2014).
In February 2017, MoUD issued the National Policy on Faecal Sludge and SeptageManagement (FSSM). The policy aims to set the context, priorities, and direction for, and tofacilitate, nationwide implementation of FSSM services in all ULBs such that safe andsustainable sanitation becomes a reality for all in each and every household, street, town andcity in India (MoUD, 2017).
The Fourteenth Finance Commission (FC-XIV) was constituted by the President of Indiaunder Article 280 of the Constitution on 2 January 2013 to make recommendations for theperiod 2015-20. Its assignments include: distribution of revenue between union and state;devising formula for grant; suggesting method to augment resources for local bodies; andtaking care of any matter referred to it (NIUA, 2015).
Model Municipal Building Bye-laws 2016 prepared by Town and Country PlanningOrganization (TCPO). Building Bye-laws 2016 is used to regulate coverage, height, buildingbulk, and architectural design and construction aspects of buildings so as to achieve orderlydevelopment of an area. They are mandatory in nature and serve to protect buildings againstfire, earthquake, noise, structural failures and other hazards. It includes chapters on greenbuildings and sustainability provisions, rainwater harvesting, wastewater (WW) reuse andrecycle, installation of solar roof top photo voltaic norms, revised norms for adequate toiletfacilities for women and public conveniences in public buildings and mandatory provisions forsegregated toilet facilities for visitors in public buildings (TCPO, 2016).
3.1.2 Policies, legislations and regulations at state level and ULB level
According to the Constitution of India, water and sanitation are state subjects. Statutorypowers are conferred to the state for making laws on water and sanitation. Some of thepolicies, laws and regulations are listed below:
The Uttar Pradesh Water Supply and Sewerage Act, 1975An act to facilitate the establishment of corporation, authorities and organizations for thedevelopment and regulation of water supply and sewerage services, related matters.According to this act the corporation has powers to fine the owner of the improper/damagedseptic tank.

Last Update: 04/05/2018 13
Chunar
India Produced by:CSESFD Report
The Uttar Pradesh Urban Sanitation Policy, 2010In 2010, the Director of Local Authorities, Uttar Pradesh issued the Uttar Pradesh UrbanSanitation Policy (UPUSP). The policy is inspired from the NUSP. The UPUSP mandates thecities to establish City Sanitation Task Force (CSTF) and to elevate the consciousness aboutsanitation in municipal agencies, government agencies and most importantly, amongst thepeople of the city. UPUSP specifically highlights the importance of safe and hygienic facilitieswith proper disposal and treatment of sludge from on-site installations (septic tanks, pitlatrines, etc.) and proper operation and maintenance (O&M) of all sanitary facilities. As ofnow there are very few cities that have finalized their CSPs; and it remains a major drawbackin the implementation of the UPUSP.
Draft Faecal Sludge and Septage Management Guidelines, 2016The draft guidelines provide step by step approach for preparation of plan for septagemanagement and financial resource mobilization, along with a focus on existing situationacross sanitation service chain and sources of revenue. The guidelines stress upon UttarPradesh Municipal Corporation Act, 1959, Chapter IX: Corporation taxation, Section 173(d),where Conservancy tax can be levied on all the properties by the corporation where cityundertakes the collection, removal and disposal of excreta and polluted matter from privies,urinals and cesspools.
Uttar Pradesh Municipal Building Bye-Laws, 2008Issued by Housing Department, Government of Uttar Pradesh. The codes specify standardsand design consideration for installation of toilets and septic tank.
The Uttar Pradesh Finance Commission is a committee pertaining to the state of UttarPradesh, established with a purpose of reviewing the financial implementations of the state.The main purpose of this committee is to formulate implementation of financial policiespertaining to the state of Uttar Pradesh. The Finance Commission is set up under the Article243 Sec I of the Indian Constitution, which orders that the Governor of the state would, at theend of every fifth year establish a Finance Commission for the purpose of reviewing, withinthe introduction of the 73rd Amendment of the Constitution Act, 1992 (SFC, 2014).
3.1.3 Institutional roles
The MoUD is the nodal ministry for policy formulation and guidance for the urban watersupply and sewerage sector. The ministry’s responsibilities include broad policy formulation,institutional and legal frameworks, setting standards and norms, monitoring, promotion ofnew strategies, coordination and support to state programmes through institutional expertiseand finance. The ministry is also responsible for managing international sources of finance.The Central Public Health and Environmental Engineering Organization (CPHEEO), createdin 1953, is the technical wing of the MoUD, which advises the ministry in all technical mattersand collaborates with the State Agencies about water supply and sanitation activities.CPHEEO plays a critical role in externally funded and special programmes. CPHEEO alsoplays a central role in setting design standards and norm setting for urban water supply andsanitation (Planning Commision, 2002).
National Council for Rejuvenation, Protection and Management of River Ganga referred asNational Ganga Council formerly known as National Ganga River Basin Authority (NGRBA),which was constituted under the provisions of the Environment (Protection) Act (EPA),

Last Update: 04/05/2018 14
Chunar
India Produced by:CSESFD Report
1986. The council aims at ensuring effective abatement of pollution and rejuvenation of theriver Ganga by adopting a river basin approach to promote inter-sectoral co-ordination forcomprehensive planning and management, maintenance of minimum ecological flows in theRiver Ganga with the aim of ensuring water quality and environmentally sustainabledevelopment (NMCG, 2011).
The 74th Constitutional Amendment Act of 1992 reformed the sector by transferringresponsibility for domestic, industrial, and commercial water supply and sewerage (WSS)from state agencies, such as Departments of Public Health Engineering and State WaterBoards, to Urban Local Bodies (ULBs). This transfer has resulted in a variety ofimplementation models, as well as a lack of clarity in roles and responsibilities of state andlocal agencies, resulting in large gaps in implementation (USAID, 2010).
Management and delivery of urban basic services in Chunar is governed by variousinstitutions. The following are the institutions responsible for policy making, service provisionand regulation of urban services:
Table 5: Roles and responsibilities
Institutions Roles and responsibilitiesUrban DevelopmentDepartment (UDD)
Policy formulation, preparation of municipal bye-laws, monitoring and evaluation of programmes,supervision of municipal administration, coordination with related state government departments,liaison with the central government and external funding agencies, administrative and financialmanagement of municipalities, implementation of development programmes.
Nagar PalikaParishad –Chunar(CNPP)
Water supply and sewerage, public health, sanitation, conservancy and solid waste management,urban poverty alleviation by providing infrastructure, provision and maintenance of urban amenities andfacilities such as parks, gardens, playgrounds, provision and maintenance of the lighting in the publicstreets, corporation markets, public buildings.
Registration of births and deaths, O&M of burial grounds, cremation grounds, etc. The ULB has a vitalrole in design, develop, plan and implement ULB level FSSM strategy, set up and ensure operation ofsystems for 100% safe and sustainable collection, transport, treatment and disposal of FS andseptage. Monitor and evaluate FSSM strategy and implementation plan. Implementation of MunicipalBye-laws.
Uttar Pradesh JalNigam (UPJN)
Preparation, execution, and promotion of ULB and state level plans of water supply, sewerage anddrainage schemes
Uttar PradeshPollution ControlBoard (UPPCB)
Regulation, licensing for environmental check etc. Monitor the compliance of the standards regardingground water, ambient air, leachate quality and the compost quality including incineration standards asspecified under Schedule II, III and IV of ‘The Water (Prevention and Control of Pollution) Act 1974’.
State ProgrammeManagement Group(SPMG)
It is implementing arm of NMCG in the state. Coordinate and oversee the implementation of projectssanctioned by Government of India under NGRBA. Take all such action and to enter all such actionsas may appear necessary, or incidental, for the achievement of the objectives of the NGRBA.
State/District Urbandevelopment Agency(S/DUDA)
Its functions are to–
Execute various government schemes for urban development and employment generation
Create urban infrastructure, including water supply
Undertake tasks related to urban infrastructure to generate local employment
Construct community toilets and link it to sewer lines etc.
Lay sewerage network according to plan made by Jal Nigam
Regulate and help ULBs set up systems to ensure financial sustainability in provision of sanitationservices
Source: CSE, 2016

Last Update: 04/05/2018 15
Chunar
India Produced by:CSESFD Report
3.1.4 Service provision
Institutional arrangements for water supply and sanitation in Indian cities vary greatly.Typically, a state-level agency is in charge of planning and investment, while the localgovernment (Urban Local Bodies) is in charge of operation and maintenance (NIUA, 2005) .Some of the largest cities have created municipal water and sanitation utilities that are legallyand financially separated from the local government. However, these utilities remain weak interms of financial capacity. In spite of decentralization, ULBs remain dependent on capitalsubsidies from state governments. Tariffs are also set by state governments, which oftensubsidize operating costs (Planning Commission, 2002).
Furthermore, when no separate utility exists, there is no separate allocation of accounts fordifferent activities within a municipality. Some states and cities have non-typical institutionalarrangements. For example, in Rajasthan the sector is more centralized and the stategovernment is also in charge of operation and maintenance while in Mumbai the sector ismore decentralized and local government is also in charge of planning and investment (NIUA,2005).
In Chunar, public health, sanitation, conservancy, and solid waste management services aredelivered by Health and Sanitation Department of CNPP. Septage management is also theresponsibility of the same department, headed by the Sanitary Officer.
3.1.5 Service standards
1. Service Level Benchmarks (SLB), 2008: Issued by the Ministry of Urban Development in2008, the SLB seek to (i) identify a minimum set of standard performance parameters forthe water and sanitation sector that are commonly understood and used by allstakeholders across the country; (ii) define a common minimum framework for monitoringand reporting on these indicators and (iii) set out guidelines on how to operationalize thisframework in a phased manner. The SLB refers to improving service through betterprovision and delivery. It evaluates the performance of urban services provided bydifferent ULBs throughout the country.
2. General Standards for Discharge of Environmental Pollutants – The Environment(Protection) Rules, 1986 (Schedule VI): Issued by Central Pollution Control Board(CPCB), a statutory organisation constituted in September, 1974 under the Water(Prevention and Control of Pollution) Act, 1974. General standards are notified withrespect to parameters for safe discharge of effluent to inland surface water/publicsewers/land for irrigation/ marine coastal areas.
3. Manual on Sewerage and Sewage Treatment, Second Edition, 2013: This manual wasdeveloped by Central Public Health and Environmental Engineering Organization(CPHEEO). It provides detailed designs and guidelines for various technologies of WWmanagement.
4. Code of Practice for Installation of Septic Tanks, 1985: Issued by, Bureau of IndianStandards. The code specifies standards and design consideration for installation ofseptic tanks.

Last Update: 04/05/2018 16
Chunar
India Produced by:CSESFD Report
3.2 Planning
3.2.1 Service targets
State governments must put in place targets for delivery of essential services provided by thelocal bodies for four services viz., water supply, sewerage, solid waste management andstorm water drains on lines of handbook for SLB by MoUD. State government must notify orcause all ULBs to notify by the end of a fiscal year the service standards and targets (PAS,2009-16).
The Swachh Bharat Mission (SBM), one of the flagship programmes of the Government ofIndia, launched on October 2nd 2014 by the Ministry of Housing and Urban Affairs. SBM-Urban aims to eliminate open defecation, eradicate manual scavenging, capacityaugmentation of ULBs and generate awareness about sanitation and its linkage with publichealth during the mission period till 2019. The SBM (urban) aims to ensure that no newinsanitary toilets are constructed during the mission period and that pit latrines should beconverted into sanitary latrines. The target group for construction of household units of toiletsthus is (i) 80% of urban households engaging in open defecation, remaining 20% ofhouseholds practising open defecation are assumed to be catered by community toilets dueto constraints of space (ii) all households with insanitary latrines (iii) all households withsingle-pit latrines (MoUD, 2014). Table 6 provides an overview of service delivery progress inaccordance with SBM.
Table 6: Service delivery targets in accordance with SLBs
Sanitationservice chain Parameter National
benchmarkTimeframe to achieve
benchmark
Containment Coverage of toilets 100% 2019
Transport
Coverage of sewer networkservices 100% 2031
Collection efficiency of thesewerage network 100% 2031
Treatment
Adequacy of sewagetreatment capacity 100% 2031
Quality of sewagetreatment 100% 2031
End-use/disposal Reuse and recycling 20% 2031
Other
Cost recovery 100% 2031
Efficiency of collection ofcharges 100% 2031
Redressal of customercomplaints 80% 2031
Source: Adapted from MoUD 2008 and MoUD 2010

Last Update: 04/05/2018 17
Chunar
India Produced by:CSESFD Report
Table 7: Service delivery progress in accordance with SBM
SBM HeadOnline application status
Received Verified Approved Rejected
IHHT 2907 29 16 344
CT 9 9 9 0
PT 0 0 0 0
Source: NPP, 2016According to rapid assessment of FSM in the city done by NPP, they would need sixemptying trucks, which will improve the emptying services provided by them extending tohouseholds. Each vehicle is expected to complete 2 trips per day with an average distance ofround trip being 12 km. Along with the emptying trucks, the NPP also needs one or moreFSTP in the municipal area, which is expected to treat 41 m3/day initially and 45 m3/day aftera period of 5 years (MoUD, 2016).
3.2.2 Investments
An investment of INR 53.66 crores (8.07 Million USD) was proposed for the project“Interception Diversion and Treatment Works at Chunar - Mirzapur”. The project proposed tointercept ten major drains flowing into River Ganga and two major drains flowing into RiverJirgo. The interceptor trunk sewer has been proposed to divert the flow of the nullahs. It isalso proposed to construct an intermediate pumping station at Tambal Ganj Nullah and onemain pumping station at the STP site. The discharge from the twelve nullahs is proposed tobe conveyed to 6.5 MLD STP through MPS (UPJN, 2015). Table 8 provides a status of fundsreleased by central government under SBM to the ULB for construction of toilets.
Table 8: Status of fund released in the year 2015 in accordance with SBM.
Individual Household Toilets (IHHT) Community Toilets (CT)
Totalfund(INR)
GoI share GoUP share GoI share GoUP share
No. ofapproved
applicationsINR 2000per toilet
No. ofapproved
applicationsINR 2000per Toilet
No. of CTseats
INR13000 per
SeatNo. of CTseats
INR13000per Seat
1 2,000 1 2,000 42 546,000 42 546,000 1,096,000
Source: (SBM, 2016)
As per the rapid assessment of FSM in city done by CNPP, the budgetary provision requiredfor capital expenditure for FSM is around INR 2,680 lakh (4.1 million USD). Whereas, theoperation and maintenance (O&M) cost associated with the emptying services and treatmentoperations is estimated to be INR 576 lakh (0.9 million USD) for 5 years (MoUD, 2016).Further details of CAPEX and OPEX have been provided in the Table 9.
Table 9: Estimate of CAPEX and OPEX for FSSM.
S. No. Component CAPEXINR (lakh)
OPEXINR (lakh)
TotalINR (lakh)
1 Faecal sludge management 780.93 413.65 1,194.58
2 Liquid waste management 1,898.84 162.36 2,061.19
3 FSSM total 2,679.77 576.01 3,255.77
Source: MoUD, 2016

Last Update: 04/05/2018 18
Chunar
India Produced by:CSESFD Report
3.3 Reducing inequity
3.3.1 Current choice of services for the urban poor
There are no notified slum settlements within the NPP limits (NPP, 2016) . But, according toCensus, 2011, the slum population is 9,914, which is 26.6% of the total population. Most ofthe people of low income group defecate in open and only a few use community toilets.Private emptiers provide emptying services to the slum households (NPP, 2016) . The fieldsurvey revealed that the practice of manual emptying is still prevalent in the city. The manualemptying is usually carried out by 2-4 people. Sometimes, manual emptiers enter into thecontainment systems to empty FS. No safety measure is taken while emptying and thusdiseases are common among sanitary workers. Bucket and spade is used to empty thecontainment.
Under Kanshiram Awas Yojna, a state scheme of Housing for All (HFA), a total of 1036 flatswere constructed for the urban poor in three phases. In the first phase, 465 flats wereconstructed behind St. Thomas School; in second phase 328 flats were constructed behindLIC building; and in third phase 243 flats were constructed behind Tehsil. The flats weredivided into blocks, each block consisting of 12 flats. Each flat constructed under this schemehas provision of a toilet connected to septic tanks. Two septic tanks are constructed for eachblock, with an average size being 4 m×2.5 m×3 m (NPP, 2016).
3.3.2 Plans and measures to reduce inequity
Pradhan Mantri Aawas Yojna (PMAY), a national scheme of HFA (Urban) project is aimed forurban areas with following components: (i) Slum rehabilitation of slum dwellers withparticipation of private developers using land as a resource; (ii) Promotion of affordablehousing for weaker section through credit linked subsidy; (iii) Affordable housing inpartnership with public and private sectors; and (iv) Subsidy for beneficiary-led individualhouse construction or enhancement.
All houses built or expanded under the mission should essentially have toilets facility. Themission has provision of civic infrastructure as per applicable state norms/CPHEEO norms/ISCode/NBC for connection sewer, if existing or has to be made through convergence of othernational or state schemes (MHUPA, 2016).
Under PMAY, 3,683 application forms were filled and submitted by NPP to SUDA, out ofwhich 3,029 have been inspected. (NPP, 2016) . Also, 2,907 application forms forconstruction of toilets were filled under SBM, of which 29 have been verified and 16approved.
3.4 Outputs
3.4.1 Capacity to meet service needs, demands and targets
NPP has insufficient fund to meet the demand of providing basic sanitation services andamenities through the revenue it is generating. NPP is majorly dependent on state andcentral schemes for fund. It is learnt during the focus group discussion with the NPP thatthere is often delay in the disbursement of fund through state finance department (NPP,2016).
Last Update: 04/05/2018 19
Chunar
India Produced by:CSESFD Report
Municipal expenditures in India account for 1.1% of the country’s GDP, compared to 6.9% inSouth Africa and 9.7% in Switzerland. ULBs therefore rely mainly on national or state grants(AFD, 2014). In the context of Chunar, the major source of income (both revenue and capital)is through grants from Finance Commission and the remaining is generated through taxesand user charges. NPP also received funds for sanitation infrastructure development whichcame through SBM.
Shortage of human resource can be witnessed in the NPP. It is largely relied on staff hiredon contractual basis to provide the daily service needs to the public. Also, the staff lacks thebasic know-how and technical skills (NPP, 2016).
3.4.2 Monitoring and reporting access to services
Data on service levels should be collected, documented and reported to MoUD according tothe format prescribed by SLB framework.
Progress of toilet coverage gets reflected on SBM-Urban dashboard of the website. Of 4041+Municipalities in 650+ districts, 3,802 ULBs are active. 75 million plus cities are beingmonitored separately (MoUD, 2014). Under SBM, no toilets have been constructed yet in thecity of Chunar (NPP, 2016).
The sanitary inspector is supposed to inspect the design of septic tanks and their adherenceto standards at the time of house/building construction but this is not done most of the times(NPP, 2016).
3.5 Expansion
In 2016, MoUD initiated rapid assessment of 131 flagship cities to estimate the budgetaryrequirement for implementing Faecal Sludge and Septage Management (FSSM) in selectedcities across the country, supported by the National Alliance for Faecal Sludge and SeptageManagement (NFSSM). The flagship cities include 100 smart cities, 12 cities in Ganga basinand others across India. A declaration was signed – for cities journey beyond OpenDefecation Free (ODF) - mainstreaming effective FS and septage management by keydecision makers and NFSSM alliance members.
Chunar is one of the flagship city and has undergone the assessment but since it is notcovered under the AMRUT programme, the NPP has to look for other sources of funding likeNMCG/ FC/ donor agencies etc.
National Mission for Clean Ganga, develop such infrastructure or make such infrastructurefunctional, as the case may be, for collection, storage, transportation and disposal of sewagein the territorial area of the local authority through its Namami Gange programme- anintegrated Ganga conservation programme (NMCG, 2014) . Under this mission, 118 townshave been identified as priority towns for the interventions near main stem of Ganga. Chunarcity is one of the cities listed in 118 urban habitations.
Nirmal Dhara is proposed under Namami Gange Programme – an initiative ensuringsustainable municipal sewage management which plans for (NMCG, 2014): Project prioritization in coordination with MoUD. Incentive for states to take up projects on Ganga Main-stem by providing an additional
share of central grants for sewerage infrastructure.

Last Update: 04/05/2018 20
Chunar
India Produced by:CSESFD Report
Uniform standards for both MoUD scheme and Namami Gange programme, 10 yearsmandatory O&M by the same service provider at par with NGRBA programme and Public-Private Partnership (PPP), Mandatory reuse of treated water.
Expanding coverage of sewerage infrastructure in 118 urban habitations on banks ofGanga- estimated cost by MoWRRD&GR is INR 51,000 crores (7.6 Billion USD).
3.5.1 Stimulating demand for services
The following activities may stimulate demand for services:
Awareness generation on septic tank construction, regular emptying of septic tanksthrough awareness campaigns
Awareness campaigns on ill effects of environmental degradation because of disposal ofuntreated septage into local environment
Capacity building of ULB staff on septage management Skill development for local masons and plumbers Monitoring and regulation of private emptiers
It is recognized that the end objectives and corresponding benefits of SBM and NMCGcannot be achieved without proper management of FS and septage across the sanitationservice chain. Further, it is well understood that sewerage coverage will not meet thecomplete sanitation needs in all areas, and a strategy which is a combination of OSS and off-site (decentralised and centralised) must co-exist in all cities and must be given equalattention. However, the current policies are not explicit enough and also do not provide anoutcome-focused direction on this issue (MoUD, 2017).
3.5.2 Strengthening service provider roles
Funding is estimated for septage management initiatives under rapid assessment for FSSMsupported by the MoUD, GoI through NFSSM. These funds can be used to buy vacuumtankers, building treatment facility, etc. CNPP has to make use of these funds to strengthenthe services. At present, there are no detailed plans for strengthening service delivery.
SBM majorly provides funds for access to toilets but thereafter lacks funds for treatment anddisposal of sewage and FS throughout the service chain. The service delivery of sewage andFS treatment and disposal can be meet through converging the two national flagshipprogrammes – SBM and NMCG. The ULB can take the benefit of the programmes andstrengthen the services along the value chain and achieve the goals of both programmes.

Last Update: 04/05/2018 21
Chunar
India Produced by:CSESFD Report
4 Stakeholder engagement
4.1 Key informant interviews
The KIIs were conducted with the stakeholders having a role or interest in sanitation andFSM services within the city. The relevant departments were contacted through e-mail, letter,and call to visit to the concerned departments. The purpose of the SFD study and depth ofdata required was conveyed through an introductory letter to respective departments. OneKII was conducted with three sanitary supervisors (see Appendix 7.2). Apart from KII, surveywas also conducted, which included interviews with representative from NGOs, institutionsand other commercial establishments. Indeterminate information was available prior to thefield based research about the type of containment, emptying service, transportation anddisposal of sewage generated by the city. The visit enabled in enhancing data collectionthrough gathering progress details of SBM, published and unpublished reports like CDP,DPRs etc. Interview with the private emptiers and other stakeholders provided additionalinsight into the service delivery context.
4.2 Field observations
In order to get a better picture of variety/typology of onsite sanitation system, primary surveyswere conducted. Random sample was carefully chosen to get good spatial representation,from each ward, of OSS dependence based on Census, 2011. At-least 5-6 households weresurveyed in each of the selected wards of Chunar. It was made sure that respondents fromslums are surveyed as well. The surveyor also recorded the field observations related tosanitation. Such surveys, observations and KIIs helped to produce a more credible andaccurate SFD, provides qualitative data and perhaps more precise quantitative data relatingto the service delivery. Some of the observations are listed below.
It was observed that few economically weaker section (EWS) households have poorlyconstructed toilets. The toilet is generally constructed for the females in the house, malesand children practice open defecation. The households situated near the bank of GangaRiver practice open defecation. The households in dense and core areas of the city wereobserved to have access to toilets and were found using it. The containment system variesaccording to the economic condition of the society. A visit was done to observe the variousdischarge points of sewage and septage in the city. Observation in the city also helped insample selection as it gave a better understanding of the city context.
Most of the settlement in the city is informal and unplanned. Due to narrow and congestedroads, households are dependent on manual emptying service through private emptiers.
4.3 Focus group discussions
The FGDs were conducted to complement, validate and challenge data collected duringliterature review and interviews. In total, three FGDs were conducted. FGDs were held withadministration wing of NPP and community representatives. The questionnaires for FGDswere prepared in English, but the interviewer asked the questions, translating into Hindilanguage.

Last Update: 04/05/2018 22
Chunar
India Produced by:CSESFD Report
The findings from the FGD sessions revealed information that increased the understandingof the sanitation and septage management in Chunar. FGDs were useful in data triangulation.Random survey helped in validating secondary data and data provided by differentstakeholders. It resulted in actual and true SFD of the city.
Stakeholders were identified and task force was formulated and notified under the mandateby NUSP (refer appendix 7.8 for more details). SBCLTF is a multi-stakeholder platformcomprising representatives from different sectors of society, including agencies directlyresponsible for sanitation, agencies indirectly involved or impacted, eminent persons,practitioners, NGOs and sanitary workers. An FGD was conducted with the SBCLTF’smembers and the draft SFD was presented and analysed. SBCLTF’s members validated thecollected data and the final SFD graphic (SBCLTF, 2017).

Last Update: 04/05/2018 23
Chunar
India Produced by:CSESFD Report
5 AcknowledgementThis report was compiled as part of the SFD promotion initiative project funded by the Billand Melinda Gates foundation (BMGF). We would like to thank Mr Shamsher Singh, Waterworks In-charge, Jal Nigam and Mr. Mithilesh Kumar, Sanitary and Food Inspector, NPP forproviding information for this assessment. A special thanks to Dr Suresh Kumar Rohilla,Programme Director, CSE, for his supervision and guidance at every step of the assessmentand report writing.

Last Update: 04/05/2018 24
Chunar
India Produced by:CSESFD Report
6 ReferencesAFD. 2014. Panorama of the Urban and Municipal Sector in India. Agence Française deDéveloppement (AFD).
BMOI. 2016. Uttar Pradesh Finance Commission. [online]. [Accessed 15 February 2017].Available from World Wide Web: <http://business.mapsofindia.com/finance-commission/state/uttar-pradesh.html>
Census of India. 2011. District Census Handbook - Mirzapur. Directorate of CensusOperations - Uttar Pradesh.
CGWB. 2014. Groundwater Year Book. Uttar Pradesh: Central Ground Water Board. Ministryof Water Resources, River Development and Ganga Rejuvenation
Chunar. 2016. [online]. [Accessed 15 December 2016]. Available from World Wide Web:<https://en.wikipedia.org/wiki/Chunar>
CSE. 2010. Policy Paper on Septage Management in India. New Delhi: Centre for Scienceand Environment.
Demographics of Uttar Pradesh. 2017. [online]. [Accessed 2017 January 2017]. Availablefrom World Wide Web: <https://en.wikipedia.org/wiki/Demographics_of_Uttar_Pradesh>
KII. 2016. Key Informant Interview conducted with Sanitary Supervisors of Chunar-NagarPalika Parishad. Uttar Pradesh
MHUPA. 2016. Pradhan Mantri Awas Yojna, Housing for All (Urban) Scheme guidelines.Ministry of Housing and Urban Poverty Alleviation. GoI.
MoSJE. 2014. The Prohibition of Employment as Manual Scavengers and their RehabilitationAct, 2013 [18th September, 2013]. Ministry of Social Justice and Empowerment, GoI.
MoUD. 2008. Handbook on Service Level Benchmarking. Ministry of Urban Development,GoI.
MoUD. 2010. Service Level Benchmarking Data book - Improving Service Outcomes.Ministry of Urban Development. GoI.
MoUD. 2013. Septage Management in Urban India. Ministry of Urban Development. GoI.
MoUD. 2014. Guidelines for Swachh Bharat Mission. Ministry of Urban Development. GoI.
MoUD. 2014a. Urban and Regional Development Plans Formulation and ImplementationGuidelines: Volume 1 Final draft report. Ministry of Urban Development. GoI.
MoUD. 2015. City Development Plan for Varanasi, 2041. Varanasi: Ministry of UrbanDevelopment. GoI.
MoUD. 2016. Rapid Financial Estimate for FSSM Infrastructure for the city of Chunar.Ministry of Urban Development. GoI.

Last Update: 04/05/2018 25
Chunar
India Produced by:CSESFD Report
MoUD. 2017. National Policy on Faecal Sludge and Septage Management. Ministry of UrbanDevelopment. GoI.
NIC. 2016. Chunar. [online]. [Accessed 15 February 2017] National Informatics Centre.Available from World Wide Web: <http://varanasi.nic.in/tourist/tourist8.html> Last Update:27/04/2017
NIC. 2016. Chunar. [online]. [Accessed 15 February 2017] National Informatics Centre.Available from World Wide Web: <http://varanasi.nic.in/tourist/tourist8.html> Last Update:27/04/2017
NIUA. 2015. Fourteenth Finance Commission (2015-2020) - Report. [online]. [Accessed 19January 2017]. Available from World Wide Web:<https://smartnet.niua.org/content/1aa83088-04ef-4e97-be11-9d4d93abc210>
NMCG. 2011. National Mission for Clean Ganga. [online]. [Accessed 15 February 2017].Available from World Wide Web: http://nmcg.nic.in/about_nmcg.aspx
NMCG. 2014. Namami Gange programme. [online]. [Accessed 15 February 2017]. Availablefrom World Wide Web: <http://nmcg.nic.in/NamamiGanga.aspx>
NPP. 2016. Focus Group Discussions conducted with Chunar Nagar Palika Parishad. UttarPradesh.
PAS. 2009-16. Service Level Benchmarking - Maharashtra. CEPT University.Planning Commission 2002. Tenth Five Year Plan- 2002 to 2007.Vol 2. PlanningCommission, GoI.
SBCLTF. 2017. Minutes of the Swachh Bharat City level Task Force meeting. In: SwachhBharat City Level Task Force. Chunar.
SFC. 2014. 4th State Finanace Commssion- Panchayati Raj and urban local body final report.[online]. [Accessed 23 January 2017]. Available from World Wide Web:<http://sfc.up.nic.in/FourththSFC.aspx>
TCPO. 2016. Model Building Bye-Laws. Town and Country Planning Organization, Ministryof Urban Development, Government of India.
UPJN. 2014. Sewarage works in Chunar (NP) for Abatement of Pollution of River Ganga.Mirzapur-Detailed Project Report: Uttar Pradesh Jal Nigam. GoUP.
UPJN. 2015. Interception, Diversion and Treatment Works at Chunar, Mirzapur. Mirzapur:Uttar Pradesh Jal Nigam.
USAID. 2010. A Rapid Assessment of Septage management in Asia: Policies and Practicesin India, Indonesia, Malaysia, the Philippines, Sri Lanka, Thailand and Vietnam. Bangkok:United States Agency for International Development (USAID).
VC. 2016. Chunar Fort-Varanasi City. [online]. [Accessed 20 January 2017].Available from World Wide Web: <http://www.varanasicity.com/chunar-fort.html>

Last Update: 04/05/2018 26
Chunar
India Produced by:CSESFD Report
7 Appendix
7.1 Stakeholder identificationTable 10: Stakeholder identification.
S. No. Stakeholder group In Chunar context
1 City council / Municipal authority / Utility Nagar Palika Parishad, Chunar
2 Ministry in charge of urban sanitation and sewerage Urban Development Department, GoUP
3 Ministry in charge of urban solid waste Urban Development Department, GoUP
4
Ministries in charge of urban planning finance and economicdevelopment
Urban Development Department, GoUP
Ministries in charge of environmental protection/ Environment Department, GoUP
Ministries in charge of health Department of Medical Health and FamilyWelfare, GoUP
5 Service provider for construction of onsite sanitation technologies Local masons
6 Service provider for emptying and transport of faecal sludge Private emptiers
7 Service provider for operation and maintenance of treatmentinfrastructure
N/A
8 Market participants practicing end-use of faecal sludge end products N/A
9 Service provider for disposal of faecal sludge (sanitary landfillmanagement)
Nagar Palika Parishad, Chunar
10External agencies associated with FSM services: e.g. NGOs,academic institutions, donors.
Swachh Bharat City Level Task Force,Centre for Science and Environment, NewDelhi
Source: (CSE, 2016)

Last Update: 04/05/2018 27
Chunar
India Produced by:CSESFD Report
7.2 Tracking of engagement
Table 11: Tracking of engagement.
S. No. Name ofOrganisation
Designation Date ofengagement
Purpose of engagement
1CNPP
Mayor 20/10/2016 Introduction of SFD and permissionto conduct FGDs in the offices andmunicipal wards.
2
CNPP
Chairman
20/10/2016 FGD
3 Accountant and officesuperintendent
4 Tax inspector
4 CNPP Sanitary and food inspector
5 CNPP Ward representatives (Ward no.13, 14 8) 20/10/2016 FGD
6 CNPP Three Sanitary supervisors ofNPP
21/10/2016 KII
7 SBCLTF 11 Members of SBCLTF 21/03/2017 FGD
Source: (CSE, 2016)

Last Update: 04/05/2018 28
Chunar
India Produced by:CSESFD Report
7.3 SFD graphic
Figure 7: SFD Graphic (Source: Graphic generator)

Last Update: 04/05/2018 29
Chunar
India Produced by:CSESFD Report
7.4 SFD brief explanation
Table 12: Percentage of the population using each system technology and method
SystemType Containment Emptying Transport Treatment and End
Use
Onsite
T1A2C6: 60% ofpopulation isdependent on septictank connected toopen drain.
T2A5C10: 11% ofpopulation isdependent on linedpit with semi-permeable walls andopen bottom.
Since there is no cleardifferentiation between % ofseptage and effluent, it isassumed to be 50% each. FS notcontained is 41%.
Since most of the population isgetting their systems emptied, it isassumed 90% of population hastheir onsite sanitation systemsemptied. - FS not contained andemptied is comes out to be 32%and FS not contained-not emptiedcomes out to be 9%
No treatment facilityexists hence no FS istransported totreatment planttherefore FS notdelivered totreatment plant is31%.
No treatment facilityexists hence no FS istreated; therefore FStreated is 0%.
All the FS emptiedends up in local areawithout any treatment.Sometimes WWflowing through opendrains is used atagriculture fields byfarmers
OpenDefecation
29% of population practice open defecation.
Source: CSE, 2016

Last Update: 04/05/2018 30
Chunar
India Produced by:CSESFD Report
7.5 Context-adapted SFD Graphic
Figure 8: Context-adapted SFD Graphic (Source: CSE)

Last Update: 04/05/2018 31
Chunar
India Produced by:CSESFD Report
7.6 SFD selection grid
7.7 SFD matrix
Source: SFD graphic generator, 2016
Table 13: SFD matrix
Figure 9: SFD selection grid (Source: SFD graphic generator, 2016)

Last Update: 04/05/2018 32
Chunar
India Produced by:CSESFD Report
7.8 List of community/public toilets
Table 14: Details of community/public toilets.
S. No. Location Number of Seats Number of Urinals Effluent connected to
1 Tehsil Parisar 06 04
Septic tank effluentconnected to open drain
2 Near Tehsil Parisar 04 00
3 Balughat 04 00
4 Balughat 02 00
5 Rattay 04 00
6 Jirgo Chungi 04 00
7 Market Area 02 02
8 Station Road 04 00
9 Near Kabir Mutt 04 01
10 Durgah 04 01
Source: NPP, 2016
Table 15: Details of the community toilets proposed under SBM
S. No. Location Number of Seats Number of Urinals
1 Near Ganda Nullah of Mohalla Saddupur 04 02
2 Near Water Tank of Mohalla Lal Darvaza 04 02
3 Near Pampughat of Mohalla Sarai Taikor 04 02
4 Near Durgah Shareef Police Booth Bus Stand 04 02
5 Near Railway Station Tempo Stand 04 02
6 Near Amberdar Park of Mohalla Sarai Taikor 06 02
7 Near Stand Post of Mohalla Tambalganj 06 02
8 Near Sarai of Mohalla Lal Darvaza 04 02
9 Near Bavnaji Temple, Mohalla Behramganj 06 02
Source: NPP, 2016

Last Update: 04/05/2018 33
Chunar
India Produced by:CSESFD Report
7.9 Swachh Bharat City Level Task Force – Chunar
Chairman Mayor
Convener Executive Officer
Members
1. Sanitary Incharge
2. Nominee from Ganga Pollution ControlUnit, Jal Nigam
3. Representatives from Construction andDesign Services, Jal Nigam
4. Advisor from Centre for Science andEnvironment
5. Respected personalities of the city(one/two)
6. Members of Council (one/two)
7. Representatives from local NGO
8. Representative from local media
9. Representatives fromMarket associations
10. Member of legislative assembly
11. A representative from Health department
Figure 10: FGD with SBLTF members

Last Update: 04/05/2018 34
Chunar
India Produced by:CSESFD Report
Figure 11: Community toilet at Balughat (Source: Shantanu/CSE, 2016)
Figure 12: Solid waste dumping site (Source: Shantanu/CSE, 2016)
Figure 13: Wastewater discharged at low-lying land in the city (Source: Shantanu/CSE, 2016)
7.10 Photographs captured during field visit

Last Update: 04/05/2018 35
Chunar
India Produced by:CSESFD Report
7.11 Questionnaires for random household survey and emptiers

Last Update: 04/05/2018 36
Chunar
India Produced by:CSESFD Report
For emptiers