Needle Blight Mycosphaerella gibsonii Photo: H. Hashimoto, Bugwood.org # 1949016.
Upload
truongcongCategory
view
212download
0
Copyright 0 1996 by the Genetics Society of America
Sexual Reproduction Plays a Major Role in the Genetic Structure of Populations of the Fungus Mycosphaerella graminicola
Ruey-Shyang Chen and Bruce A. McDonald
Department of Plant Pathology and Microbiology, Texas A H M University, College Station, Texas 77843-2132 Manuscript received March 13, 1995
Accepted for publication January 10, 1996
ABSTRACT The relative contributions of sexual and asexual reproduction to the genetic structure of populations
can be difficult to determine for fungi that use a mixture of both types of propagation. Nuclear RFLPs and DNA fingerprints were used to make indirect and direct measures of departures from random mating in a population of the plant pathogenic fungus Mycosphaerella graminicola during the course of an epidemic cycle. DNA fingerprints resolved 617 different genotypes among 673 isolates sampled from a single field over a %month period. Only 7% of the isolates represented asexual clones that were found more than once in the sample. The most common clone was found four times. Genotypic diversity averaged 85% of its maximum possible value during the course of the epidemic. Analyses of multilocus structure showed that allelic distributions among FWLP loci were independent. Pairwise comparisons between individual RFLP loci showed that the majority of alleles at these loci were in gametic equilibrium. Though this fungus has the capacity for a significant level of asexual reproduction, each analysis suggested that M. graminicola populations maintain a genetic structure more consistent with random-mating over the course of an epidemic cycle.
F UNGI use a wide array of reproductive strategies in natural populations (ANDERSON et al. 1992), often
including alternating cycles of sexual and asexual repro- duction. The genetic structure of fungal populations will be affected by the relative contributions of sexual and asexual reproduction to each generation. Popula- tions that are largely asexual will exhibit a high degree of clonality, with few genotypes present at relatively high frequencies. Random mating (sexual) populations are expected to display a high degree of genotypic di- versity. The balance between sexual and asexual repro- duction will be affected by the availability of compatible sexual strains, alternate hosts (as for some rust fungi), and suitable climatic regimes (LEUNG et al. 1993).
The relative contributions of sexual and asexual re- production to the genetic structure of fungal popula- tions often are poorly understood (KOHN 1995). BUR- DON and ROELFS (1985) used isozymes to show that sexual populations of Puccinia graminis f. sp. tn'tici from the Pacific Northwest had greater genotypic diversity than asexual populations from the Central Plains. BROWN and WOLFE (1990) used temporal changes in gametic disequilibrium between pairs of virulence genes and fungicide resistance to estimate the fraction of an Erisyphe graminis f. sp. hordei population that origi- nated from sexual spores. In both of these cases, the sexual stage was known to play an important role in the life cycle of the fungus, and the authors confirmed the
Cmresponding authm: Bruce A. McDonald, Department of Plant Pa- thology and Microbiology, Texas A&M University, College Station, T X 778432132, E-mail: [email protected]
Genetics 142: 1119-1127 (April, 1996)
impact of sexual reproduction on the genetic structure of populations. For many plant pathogenic fungi, how- ever, it is not clear whether asexual or sexual reproduc- tion plays the major role in determining the genetic structure of populations. This is especially true for fungi that do not have a recognized sexual stage. In many cases, asexual reproduction is thought to occur more frequently than sexual reproduction because a limited number of clones or clonal lineages are widespread throughout agricultural fields over a wide geographical range (LEVY et al. 1991; GOODWIN et al. 1994; KOHLI et al. 1995). However, repeated sampling of a few clones that are found at high frequency because of strong se- lection or random drift can obscure the contribution of a sexual cycle to the genetic structure of these popu- lations (LEUNG et al. 1993; KOHN 1995; MCDONALD et al. 1995). In addition, estimates of the relative degrees of sexual and asexual reproduction may be affected by differences in the dispersal distances of sexual and asexual spores and by the spatial scale used for sam- pling. For example, if asexual spores are dispersed only over short distances (e.g., centimeters), the asexual frac- tion of a population may not be adequately represented if sampling is conducted at a larger scale (e.g., meters).
During the past five years, DNA-based genetic mark- ers have become widely used to analyze the genetic structure of fungal populations (KOHN et al. 1991; LEVY et al. 1991; GOODWIN et al. 1992; MILGROOM et al. 1992; BOEGER et al. 1993; MCDONALD et al. 1994; KOHLI et al. 1995). These surveys have shown that fungal popula- tions are not invariably clonal but can occupy a spec- trum of population structures ranging from highly out-
1120 R.-S. Chen and B. A. McDonald
crossing to almost strictly clonal. RFLPs in nuclear and mitochondrial genomes have been used to estimate gene and genotypic diversity within and among popula- tions. DNA fingerprinting has been used to distinguish among different asexual lineages in a population. The advent of DNA markers that assay genotypic variation directly has made it possible to measure the relative impact of sexual and asexual reproduction using a com- bination of direct and indirect measures of the degree of random mating in populations. The direct measures are based on using DNA fingerprints to estimate the fraction of a population that is genetically identical be- cause of asexual reproduction. Indirect measures are based on measuring nonrandom associations among loci, such as gametic disequilibrium.
Mycosphaerella graminicola (Fuckel) J. Schrt. in Cohn (anamorph Septon’a tn’tici Roberge in Desmaz.) is a hap- loid, ascomycete fungus that infects wheat worldwide (KING et aZ. 1983). The fungus produces airborne sexual ascospores that have the potential to disperse over long distances (kilometers). Rainsplash dissemination of the asexual spores presumably occurs over relatively short distances (meters). Several epidemiology studies have suggested that ascospores were the primary inoculum that colonize wheat fields (SHAW and ROYLE 1987,1989; SCHUH 1990), while asexual pycnidiospores were thought to be the main source of subsequent secondary infection. The teleomorph (sexual stage) has been found in several countries (SANDERSON and HAMPTON 1978; Scorn et al. 1988; GARCIA and MARSHALL 1992), but it was not clear how sexual reproduction affected the genetic structure of the population. Based on re- sults from a previous study (MCDONALD and MARTINEZ 1990a), we hypothesized that the initial infections re- sulted from airborne sexual ascospores and subsequent infections resulted from splash dispersal of asexual pyc- nidiospores. Under this hypothesis, we expected that the genetic structure of the population would become more clonal over the course of an epidemic cycle. The main objectives in this experiment were to determine whether the genetic structure of a M. graminicola popu- lation was more consistent with random mating or asex- ual reproduction and to determine whether the effect of asexual reproduction on genetic structure increased over the course of an epidemic cycle.
MATERIALS AND METHODS
Fungal isolates: Isolates of M. gruminicolu were collected from a field experiment conducted on the Oregon State Uni- versity Experimental Farm near Corvallis, OR. In October 1989, four wheat varieties that differed in resistance to M. gruminicolu were planted in pure stands and in all possible two- , three-, and four-way variety mixtures (15 treatments total) in a randomized complete block design with three replications. The field site was fallow in the year before initiating the exper- iment. Individual plots in the field measured 1.5 X 6.1 m in size. Natural infection was distributed uniformly through the field by mid-December. We believe that the initial infection
came from ascospores originating from stubble in wheat fields 80 km distant from the field site. The plots were sampled on March 6 and May 30, 1990, hereafter referred to as early and late season, respectively. Twenty infected leaves were chosen randomly along two transects running across the length of each plot. The average distance between collections was 50 cm within each plot. The infected leaf tissue was air dried at room temperature for 2 weeks before making isolations. Only one isolation was made from each infected leaf. A total of 149 isolates were obtained from early in the season and 562 isolates were obtained from late in the season. Sample sizes were <900 isolates for both collections because some leaves did not possess viable fungal fruiting bodies and limitations in funding restricted the number of isolates that could be assayed.
DNA extraction, probes, and hybridization: DNA was ex- tracted from each isolate using a CTAB extraction protocol described previously (MCDONALD and MARTINEZ 1990b). Pun- fied DNA (4 pg) was digested individually with the restriction enzymes PstI or XhoI. DNA fragments were separated on 0.8% agarose gels and then transferred to nylon membranes using the alkaline transfer method (REED and MANN 1985) as recom- mended by the manufacturer (BioRad, Hercules, C A ) .
Development of anonymous DNA probes used for RFLP analysis was described previously (MCDONALD and MARTINEZ 1990b). The source of these probes was a partial Suu3A diges tion of total DNA from S. tritici. DNA fragments ranging from 500-2500 bp in size were size-fractionated before cloning into a pGEM4 (Promega, Madison, WI) plasmid vector. Four hundred randomly chosen clones were kept for use as probes. Based on an initial screen, 10 probes that hybridized to single loci, and one probe that hybridized simultaneously to two loci located on different chromosomes (MCDONALD and MARTI- NEZ 1991a,b) were used. Together these probes hybridized to loci on 12 of the 18 chromosomes in the M. graminicola ge- nome (MCDONALD and MARTINEZ 1991a; B. A. MCDONALD, unpublished results). Two probes (pSTL40 and pSTL70) that hybridized to dispersed, repetitive DNA sequences were also used in this study. The repetitive probes were shown pre- viously to be useful for DNA fingerprinting (MCDONALD and MARTINEZ 1991b). Probes were labeled by nick translation following the manufacturer’s recommendations (BRL, Gaith- ersburg, MD).
Data analysis: Each probeenzyme combination was de- fined as a different RFLP locus. DNA fragments or combina- tions of fragments with different sizes were treated as alleles at each RFLP locus. Only PstI was used to digest DNA from the late-season collection to lower the cost of collecting data. As a result, there are larger sample sizes for all RFLP loci that use PstI than for RFLP loci that use XhoI. Isolates having the same multilocus haplotype (i.e., having the same alleles at each of the single RFLP loci) were compared using DNA fingerprints. Isolates having the same multilocus haplotype and DNA fingerprint were assumed to be individual members of the same clone (MCDONALD and MARTINEZ 1991b). Based on frequencies of alleles at individual loci, and frequencies of individual fragments in DNA fingerprints, the probability that two individuals would have the same DNA profile by chance was <lo-’ on average in this population (B. A. MG DONALD, unpublished observations). To determine whether repeat sampling of the same clone would s e c t measures of association among loci, a second “clonecorrected” data set was constructed by including only one representative of each clone for each analysis of gametic disequilibrium.
The measure of genotypic diversity (STODDART and TAYLOR 1988) was based on the number of isolates with different multilocus haplotypes and DNA fingerprints in each collec- tion. Only isolates with the full complement of single-locus
Sexual Reproduction in Fungi 1121
RFLP data and fingerprints were included in this analysis. Genotypic diversity in each collection was measured using the formula
1 e = c C C f X ) * W N ) * I
X=O
where N is the sample size and fx is the number of genotypes obsepled x times in the sample. The maximum possible value for G, which occurs when each individual in the sample has a different genotype, is the number of individuals in the sam- ple. To compare G in collections with different sample sizes, we divided G from each collection by N to calculate the per- centage of maximum possible diversity that was obtained (CHEN et al. 1994). A t-test was used for statistical comparisons between the normalized measures of G (CHEN et al. 1994).
The method suggested by BROWN et al. (1980) was used to measure multilocus associations among all loci based on the variance of heterozygosity. Gametic disequilibrium between pairs of loci was calculated using the following methods sug- gested by WEIR (1990). A test for significance of the disequilib rium coefficient across all alleles for each pair of loci was formulated with the chi-square test statistic
for all pairs of alleles u and v, which were present at loci that had k and 1 alleles total, respectively. n was the number of individuals in the sample and B,,,, was the maximum likelihood estimator for the coefficient of disequilibrium between alleles u and v. The observed allele frequencies for the loci were pu and p,, respectively. This chi-square statistic had (k - 1) ( I - 1) degrees of freedom for each pair of loci. We observed that tests based on pairs of rare alleles at the two loci often resulted in a significant value for the chi-square test as a result of a low expected number in the denominator. This sometimes led to a rejection of the null hypothesis of independence when only one or two rare allele pairs were in disequilibrium out of 60- 70 allele pairs in a typical locus-by-locus comparison. To correct for this bias, alleles present at a frequency of <lo% were pooled into a single category for comparisons in the late-season collection ( N = 562) and alleles at a frequency of <20% were pooled in the early-season collection ( N = 149).
A test for the significance of the disequilibrium coefficient between each pair of alleles at two loci was formulated with the chi-square statistic
4 w
Pu(l - P,)P"(l - P") x;" =
This chi-square statistic had one degree of freedom. As before, all alleles present at frequencies of <10 and 20% in the late- and early-season populations, respectively, were pooled into a single category. Pairs of alleles that showed a significant ( P < 0.05) departure from random expectations were tested further with Fisher's exact test of independence (WEIR 1990). The two-tailed exact test for independence between pairs of alleles at different loci was calculated with the computer pro- gram FISH 6, version 1.001 (ENGELS 1988). In each exact test, all alleles except for the tested allele pairs were pooled into a single category. The level of significance used for the exact test was P < 0.05.
RESULTS
To make direct measures of the asexual fraction pres- ent in each sample, only the 673 isolates that had com-
"'1"-
"4
, .I ." d
9 .
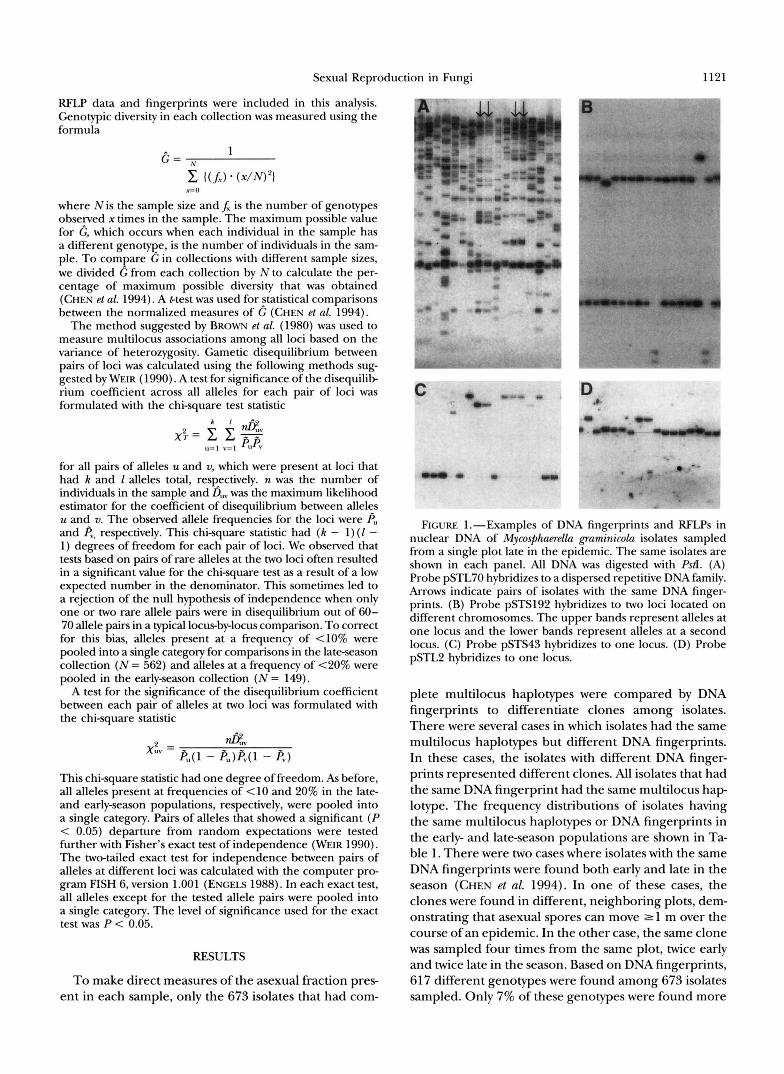
FIGURE 1.-Examples of DNA fingerprints and RFLPs in nuclear DNA of Mycosphaerelkz graminicokz isolates sampled from a single plot late in the epidemic. The same isolates are shown in each panel. All DNA was digested with PstI. (A) Probe pSTL70 hybridizes to a dispersed repetitive DNA family. Arrows indicate pairs of isolates with the same DNA finger- prints. (B) Probe pSTS192 hybridizes to two loci located on different chromosomes. The upper bands represent alleles at one locus and the lower bands represent alleles at a second locus. (C) Probe pSTS43 hybridizes to one locus. (D) Probe pSTL2 hybridizes to one locus.
plete multilocus haplotypes were compared by DNA fingerprints to differentiate clones among isolates. There were several cases in which isolates had the same multilocus haplotypes but different DNA fingerprints. In these cases, the isolates with different DNA finger- prints represented different clones. All isolates that had the same DNA fingerprint had the same multilocus h a p lotype. The frequency distributions of isolates having the same multilocus haplotypes or DNA fingerprints in the early- and late-season populations are shown in Ta- ble l. There were two cases where isolates with the same DNA fingerprints were found both early and late in the season (CHEN et al. 1994). In one of these cases, the clones were found in different, neighboring plots, dem- onstrating that asexual spores can move 2 1 m over the course of an epidemic. In the other case, the same clone was sampled four times from the same plot, twice early and twice late in the season. Based on DNA fingerprints, 617 different genotypes were found among 673 isolates sampled. Only 7% of these genotypes were found more
1122 R . 4 . Chen and B. A. McDonald
TABLE 1
Frequency distribution of genotypes in early and late season populations of Mycosphaere22a graminicola in the Oregon
field experiment
Multilocus haplotypes" DNA fingerprintsb
Early Late Early Late X" season season season season
1 80 387 112 459 2 14 42 7 30 3 4 14 1 7 4 1 4 0 1 5 1 1 0 0
Total number of
Total number in genotypes 100 448 120 497
sample ( N ) 129 544 129 544 e. 78.1 384.3 111.7 449.8 ( G / N ) %" 60.5% 70.6% 86.6% 82.7%
Multilocus haplotypes were differentiated by combining the alleles present at 11 and 12 individual RFLP loci in the early- and late-season populations, respectively.
bDNA fingerprints were based on hybridization of probe pSTL40 and pSTL70 to DNA from each isolate.
Number of times each genotype is present in the popula- tion.
Index of genotypic diversity G (STODDART and TAYLOR 1988).
"The percentage of maximum possible value for G.
than once in the sample. Two measures of genotypic diversity were made from these data. From the multilo- cus haplotype data, 60.6 and 70.7% of the maximum possible values were found in the early- and late-season populations, respectively. These values were not sig- nificantly different ( P = 0.54). Based on the DNA fin- gerprint data, 86.6 and 82.7% of maximum possible values were found in the early-and late-season popula- tions, respectively ( P = 0.72). Though the DNA finger- prints detected more genotypic diversity than the multilocus haplotypes, the difference between the two values was not statistically significant ( P = 0.14 for late- season haplotypes us. fingerprints).
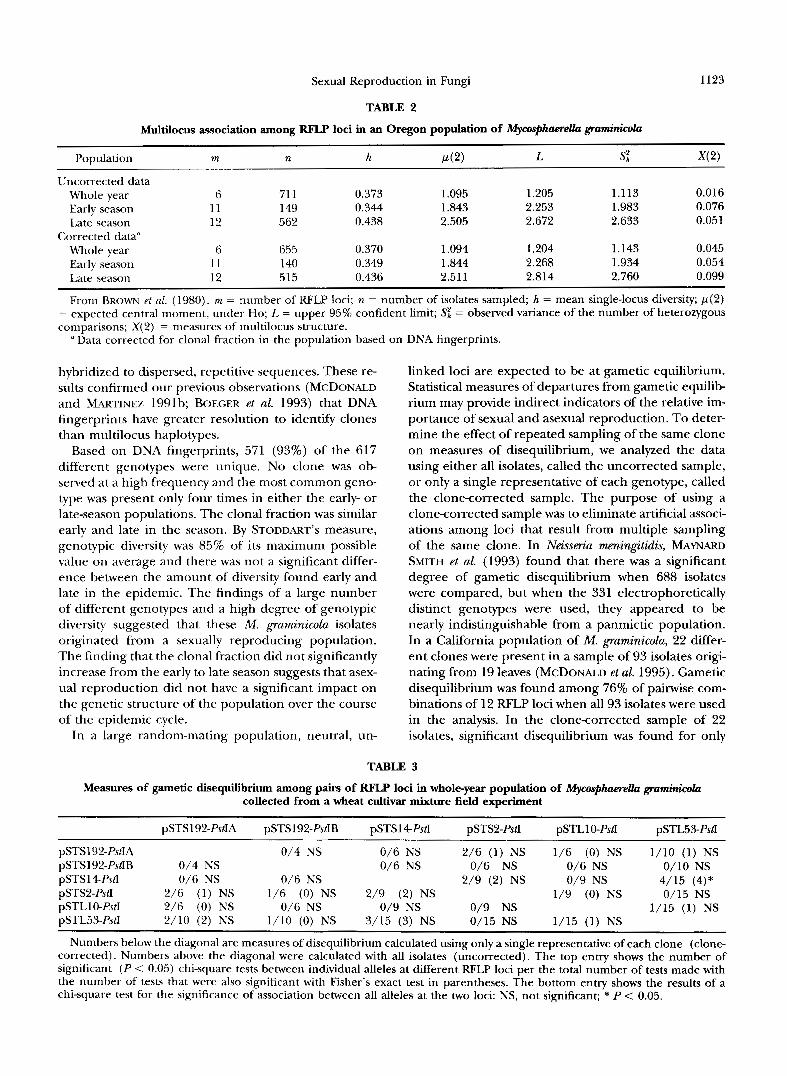
Table 2 summarizes multilocus associations among RFLP loci in the M. graminicola population based on the method of BROWN et al. (1980). All six subsets of the data had an adjusted value of S; that exceeded p(2), supporting independence of loci. Statistically sig- nificant increases in multilocus associations (SE ex- ceeding L) were not found in any population, sug- gesting that allele distributions among RFLP loci were independent. \'slues of X(2), the measure of intensity of multilocus association, were low ranging from 0.016 to 0.095 among populations. Values of X(2) were higher in the clonecorrected data, but there were no signifi- cant differences among any data sets.
WEIR'S measures of gametic disequilibrium for the
entire population are summarized in Table 3. Only the six RFLP loci common to both early- and late-season collections were used in this analysis. Pairwise compari- sons for gametic disequilibrium between RFLP loci were measured for all isolates (uncorrected) included in the data set or only one representative of each clone (clone- corrected). For the 15 pairwise comparisons among loci in the uncorrected data, one pair of loci was in disequi- librium (5% level). In the clone-corrected data, all of the loci were at gametic equilibrium. Allele-by-allele comparisons were significant in 12 of 132 cases in the uncorrected and 14 of 132 comparisons in the clone- corrected data. However, only nine cases (7%) in the uncorrected data and nine cases (7%) in the corrected were significant at the 5% level with Fisher's exact test.
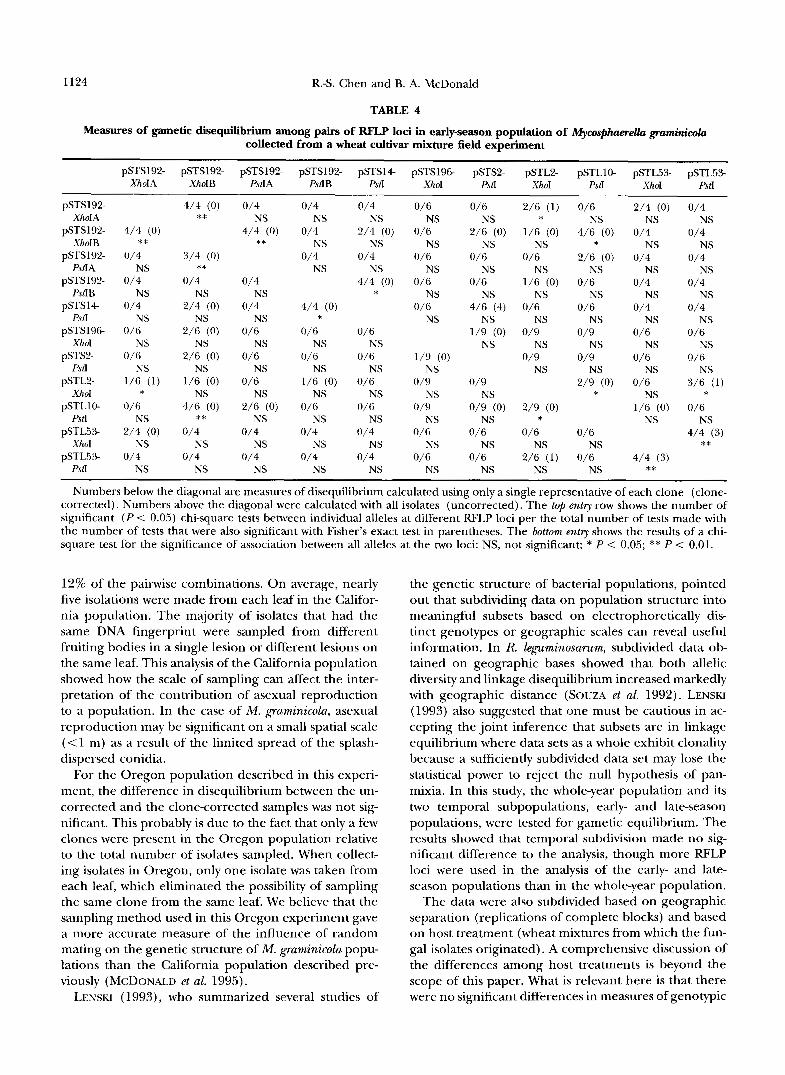
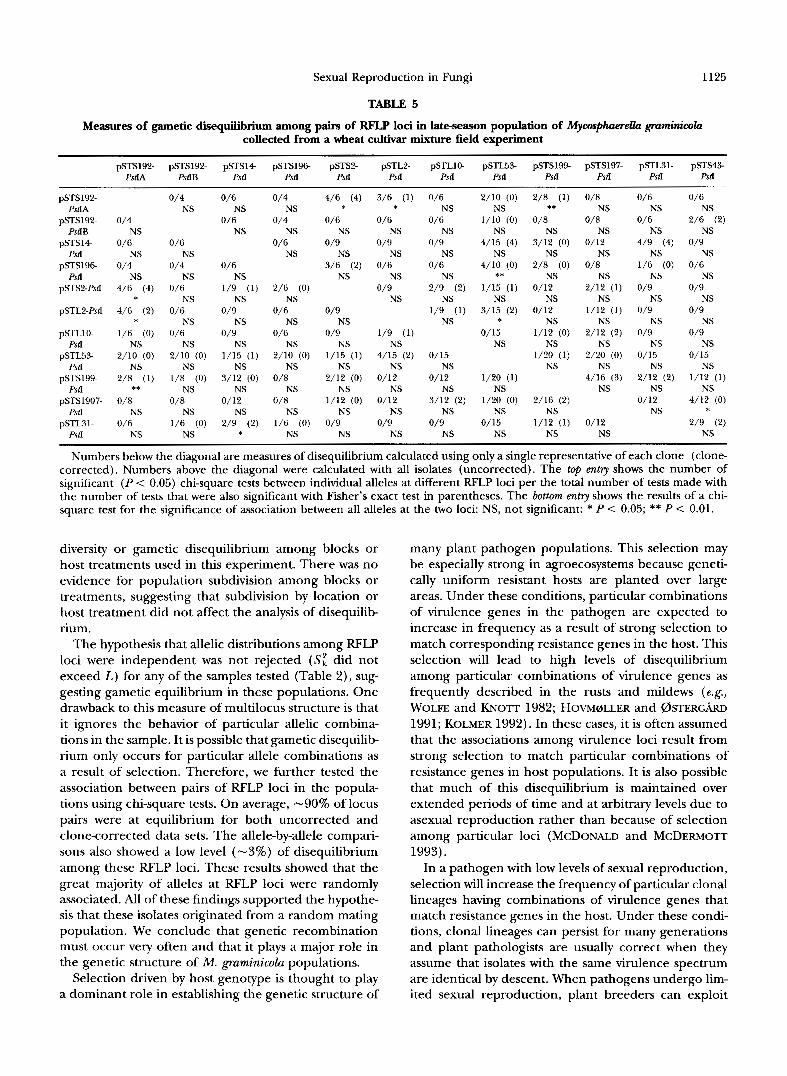
In the early-season population, eight out of 55 pair- wise comparisons from the uncorrected and seven com- parisons for the corrected data were significant at the 5% level (Table 4). In the uncorrected samples, 43 of 306 allele-by-allele comparisons were significant at 5% level, but only nine (3%) of these comparisons were significant with Fisher's exact test. In the clone-cor- rected samples, 37 of 306 allele-by-allele comparisons were significant at 5% level, but only five (2%) of these comparisons were significant with Fisher's exact test. Table 5 shows the measures of gametic disequilibrium in the late-season population. Significance at the 5% level was found among six of the 66 possible painvise combinations from the uncorrected data, and only four of these comparisons were significant in the clonecor- rected data. Allele-by-allele comparisons showed that 64 and 54 of 623 cases in the uncorrected and clone- corrected data, respectively, were significant at the 5% level and 37 (6%) and 24 (4%), respectively, were sig- nificant with Fisher's exact test.
DISCUSSION
DNA fingerprints and tests for departures from ga- metic equilibrium among single copy RFLP probes were used to made direct and indirect assessments of the relative importance of sexual and asexual reproduction on the genetic structure of a M. graminicola population. Direct measures of the amount of asexual reproduction based on DNA fingerprints showed that a low degree of clonality existed in the M. graminicola population during the course of an epidemic cycle. This suggested that the genetic structure of this M. graminicola popula- tion was dominated by outcrossing. Despite the poten- tial for a significant amount of asexual reproduction, 617 different nuclear DNA genotypes were found among 673 isolates. Many M. graminicola isolates had the same multilocus haplotypes, formed by combining 11 - 12 individual RFLP loci at one time, while their DNA fingerprints were different. An average of 20 frag- ments was found for the DNA fingerprints, suggesting that more loci were being sampled by the probes that
Sexual Reproduction in Fungi 1123
TABLE 2
Multilocus association among RFLP loci in an Oregon population of MycaSphaereUu gmminicola
Population rn n h P(2) L s: 342)
Uncorrected data Whole year 6 71 1 0.373 1.095 1.205 1.113 0.016 Early season 11 149 0.344 1.843 2.253 1.983 0.076 Late season 12 562 0.438 2.505 2.672 2.633 0.051
Whole year 6 655 0.370 1.094 1.204 1.143 0.045 Early season 11 140 0.349 1.844 2.268 1.934 0.054 Late season 12 515 0.436 2.51 1 2.814 2.760 0.099
From BROWN et at. (1980). rn = number of RFLP loci; ?z = number of isolates sampled; h = mean single-locus diversity; p ( 2 ) = expected central moment, under Ho; L = upper 95% confident limit; Sz = observed variance of the number of heterozygous comparisons; X(2) = nleasures of multilocus structure.
Corrected data''
(1 Data corrected for clonal fraction in the population based on DNA fingerprints.
hybridized to dispersed, repetitive sequences. These re- sults confirmed our previous observations (MCDONALD and hlARTINEZ 1991b; BOECER et al. 1993) that DNA fingerprints have greater resolution to identify clones than multilocus haplotypes.
Based on DNA fingerprints, 571 (93%) of the 617 different genotypes were unique. No clone was ob- served at a high frequency and the most common geno- type was present only four times in either the early- or late-season populations. The clonal fraction was similar early and late in the season. By STODDART'S measure, genotypic diversity was 85% of' its maximum possible value on average and there was not a significant differ- ence between the amount of' diversity found early and late in the epidemic. The findings of a large number of different genotypes and a high degree of genotypic diversity suggested that these M. graminicola isolates originated from a sexually reproducing population. The finding that the clonal fraction did not significantly increase from the early to late season suggests that asex- ual reproduction did not have a significant impact on the genetic structure of the population over the course of the epidemic cycle.
In a large random-mating population, neutral, un-
linked loci are expected to be at gametic equilibrium. Statistical measures of departures from gametic equilib- rium may provide indirect indicators of the relative im- portance of sexual and asexual reproduction. To deter- mine the effect of repeated sampling of the same clone on measures of disequilibrium, we analyzed the data using either all isolates, called the uncorrected sample, or only a single representative of each genotype, called the clone-corrected sample. The purpose of using a clonecorrected sample was to eliminate artificial associ- ations among loci that result from multiple sampling of the same clone. In Neissm'u meningztidis, MAYNARD SMITH et al. (1993) found that there was a significant degree of gametic disequilibrium when 688 isolates were compared, but when the 331 electrophoretically distinct genotypes were used, they appeared to be nearly indistinguishable from a panmictic population. In a California population of M. graminicola, 22 differ- ent clones were present in a sample of 93 isolates origi- nating from 19 leaves (MCDONALD et al. 1995). Gametic disequilibrium was found among 76% of pairwise com- binations of 12 RFLP loci when all 93 isolates were used in the analysis. In the clone-corrected sample of 22 isolates, significant disequilibrium was found for only
TABLE 3
Measures of gametic disequilibrium among pairs of RFLP loci in whole-year population of Mycosphaerella gmminicola collected from a wheat cultivar mkture field experiment
pSTS192-PstIA pSTS192-PstIB pSTS14PstI pSTS2-PstI PSTLlO-PstI pSTL53-Pd
pSTS192-PstIA 0/4 NS 0/6 NS 2/6 (1) NS 1/6 (0) NS 1/10 ( 1 ) NS pSTS192-PstIB 0/4 NS 0/6 NS 0/6 NS 0/6 NS 0/10 NS pSTS 14PstI 0/6 NS 0/6 NS 2/9 (2) NS 0/9 NS 4/15 (4)* pSTS2-PstI 2/6 (1) NS 1/6 (0) NS 2/9 (2) NS 1/9 (0) NS 0/15 NS PSTLlO-PstI 2/6 (0) NS 0/6 NS 0/9 NS 0/9 NS 1/15 (1) NS pSTL53PstI 2/10 (2) NS 1/10 (0) NS 3/15 (3) NS 0/15 NS 1/15 (1) NS
Numbers below the diagonal are measures of disequilibrium calculated using only a single representative of each clone (clone- corrected). Numbers above the diagonal were calculated with all isolates (uncorrected). The top entry shows the number of significant (P < 0.05) chi-square tests between individual alleles at different RFLP loci per the total number of tests made with the number of tests that were also significant with Fisher's exact test in parentheses. The bottom entry shows the results of a chi-square test for the significance of association between all alleles at the two loci: NS, not significant; * P < 0.05.
1124 R . 4 . Chen and B. A. McDonald
TABLE 4
Measures of gametic disequilibrium among pairs of RFLP loci in early-season population of Myco+huerella graminicola collected from a wheat cultivar mixture field experiment
pSTS192- pSTS192- pSTS192- pSTS192- pSTS14 pSTS196- pSTS2- pSTL2- pSTL10- pSTL53- pSTL53- XhoIA XhnIB PstIA PstIB PstI XhnI PstI XhnI PstI XhoI PstI
pSTS192- 4/4 (0) 0/4 0/4 0/4 0/6 0/6 2/6 ( 1 ) 0/6 2/4 (0) 0/4
4/4 (0) 0/4 pSTSl92- 4/4 (0) 2/4 (0) 0/6 2/6 (0) 1/6 (0) 4/6 (0) 0/4 0/4
pSTS192- 0/4 3/4 (0) 0/4 0/6 0/6 0/4 0/6 2/6 (0) 0/4 0/4
pSTS192- 0/4 0/4 0/4 4/4 (0) 0/6 0/6 1/6 (0) 0/6 0/4 0/4
pSTS14 0/4 2/4 (0) 0/4 4/4 (0) 0/6 4/6 (4) 0/6 0/6 0/4 0/4
pSTSI96- 0/6 2/6 (0) 0/6 0/6 0/6 1/9 (0) 0/9 0/9 0/6 0/6
pSTS2- 0/6 2/6 (0) 0/6 0/6 0/6 1/9 (0) 0/9 0/9 0/6 0/6
pSTL2- 1/6 (1) 1/6 (0) 0/6 1/6 (0) 0/6 0/9 0/9 2/9 (0) 0/6 3/6 ( 1 ) XhoI * NS NS NS NS NS NS * NS *
pSTL10- 0/6 4/6 (0) 2/6 (0) O/fi 0/6 0/9 0/9 (0) 2/9 (0) 1/6 (0) 0/6
pSTL.53. 2/4 (0) 0/4 0/4 014 0/4 0/6 0/6 0/6 0/6 4/4 (3) XhoI NS NS NS NS NS NS NS NS NS **
pSTL.53- 0/4 0/4 0/4 0/4 0/4 0/6 0/6 2/6 (1) 0/6 4/4 (3)
XhnIA ** NS NS NS NS NS * NS NS NS
XhnIB ** ** NS NS NS NS NS * NS NS
NS PstIA
PstIB NS NS NS
** NS NS NS NS NS NS NS NS
* NS NS NS NS NS NS
NS PstI NS NS NS NS NS NS NS * NS
NS Xhd NS NS NS NS NS NS NS NS NS
NS NS PstI NS NS NS NS NS NS NS NS
PstI NS ** NS NS NS NS NS * NS NS
PstI NS NS NS NS NS NS NS NS NS ** Numbers below the diagonal are measures of disequilibrium calculated using only a single representative of each clone (clone-
corrected). Numbers above the diagonal were calculated with all isolates (uncorrected). The top ently row shows the number of significant ( P < 0.05) chi-square tests between individual alleles at different RFLP loci per the total number of tests made with the number of tests that were also significant with Fisher’s exact test in parentheses. The bottom ently shows the results of a chi- square test for the significance of association between all alleles at the two loci: NS, not significant; * P < 0.05; ** P < 0.01.
12% of the painvise combinations. On average, nearly five isolations were made from each leaf in the Califor- nia population. The majority of isolates that had the same DNA fingerprint were sampled from different fruiting bodies in a single lesion or different lesions on the same leaf. This analysis of the California population showed how the scale of sampling can affect the inter- pretation of the contribution of asexual reproduction to a population. In the case of M. gruminicolu, asexual reproduction may be significant on a small spatial scale (<1 m) as a result of the limited spread of the splash- dispersed conidia.
For the Oregon population described in this experi- ment, the difference in disequilibrium between the un- corrected and the clone-corrected samples was not sig- nificant. This probably is due to the fact that only a few clones were present in the Oregon population relative to the total number of isolates sampled. When collect- ing isolates in Oregon, only one isolate was taken from each leaf, which eliminated the possibility of sampling the same clone from the same leaf. We believe that the sampling method used in this Oregon experiment gave a more accurate measure of the influence of random mating on the genetic structure of M. gruminicolu popu- lations than the California population described pre- viously (MCDONALD et ul. 1995).
LENSKI (1993), who summarized several studies of
the genetic structure of bacterial populations, pointed out that subdividing data on population structure into meaningful subsets based on electrophoretically dis- tinct genotypes or geographic scales can reveal useful information. In R Zeguminosurum, subdivided data ob- tained on geographic bases showed that both allelic diversity and linkage disequilibrium increased markedly with geographic distance (SOUZA et al. 1992). LENSKI (1993) also suggested that one must be cautious in ac- cepting the joint inference that subsets are in linkage equilibrium where data sets as a whole exhibit clonality because a sufficiently subdivided data set may lose the statistical power to reject the null hypothesis of pan- mixia. In this study, the whole-year population and its two temporal subpopulations, early- and late-season populations, were tested for gametic equilibrium. The results showed that temporal subdivision made no sig- nificant difference to the analysis, though more RFLP loci were used in the analysis of the early- and late- season populations than in the whole-year population.
The data were also subdivided based on geographic separation (replications of complete blocks) and based on host treatment (wheat mixtures from which the fun- gal isolates originated). A comprehensive discussion of the differences among host treatments is beyond the scope of this paper. What is relevant here is that there were no significant differences in measures of genotypic
Sexual Reproduction in Fungi
TABLE 5
1125
Measures of gametic disequilibrium among pairs of RFLP loci in late-season population of Mycosphmrella gmmimcola collected from a wheat cultivar mixture field experiment
pSTS192- pSTS192- pSTS14 pSTS196 pSTS2- pSTL2- pSTLlO pSTL53- pSTS194 pSTS197- pSTL31- pST.543- PstIA PsdB PstI PstI PstI PstI PstI PstI PstI Psa PstI PstI
pSTS192- PstIA
pSTS192- PstIB
pSTS14 PstI
pSTS196 PstI
pSTSBPstI
pSTL2-Pstl
pSTLl0- PstI
pSTL53- PstI
pSTS199- PstI
pSTS1907- PSlI
pSTL31- PrtI
Numbers below the diagonal are measures of disequilibrium calculated using only a single representative of each clone (clone- corrected). Numbers above the diagonal were calculated with all isolates (uncorrected). The top e n t ~ shows the number of significant ( P < 0.05) chi-square tests between individual alleles at different RFLP loci per the total number of tests made with the number of tests that were also significant with Fisher’s exact test in parentheses. The bottom e n t ~ shows the results of a chi- square test for the significance of association between all alleles at the two loci: NS, not significant: * P < 0.05; ** P < 0.01.
~ ~~~
diversity or gametic disequilibrium among blocks or host treatments used in this experiment. There was no evidence for population subdivision among blocks or treatments, suggesting that subdivision by location or host treatment did not affect the analysis of disequilib- rium.
The hypothesis that allelic distributions among RFLP loci were independent was not rejected ( S z did not exceed L ) for any of the samples tested (Table 2), sug- gesting gametic equilibrium in these populations. One drawback to this measure of multilocus structure is that it ignores the behavior of particular allelic combina- tions in the sample. It is possible that gametic disequilib rium only occurs for particular allele combinations as a result of selection. Therefore, we further tested the association between pairs of RFLP loci in the popula- tions using chi-square tests. On average, -90% of locus pairs were at equilibrium for both uncorrected and clone-corrected data sets. The allele-by-allele compari- sons also showed a low level (-3%) of disequilibrium among these RFLP loci. These results showed that the great majority of alleles at RFLP loci were randomly associated. All of these findings supported the hypothe- sis that these isolates originated from a random mating population. We conclude that genetic recombination must occur very often and that it plays a major role in the genetic structure of M. graminicola populations.
Selection driven by host genotype is thought to play a dominant role in establishing the genetic structure of
many plant pathogen populations. This selection may be especially strong in agroecosystems because geneti- cally uniform resistant hosts are planted over large areas. Under these conditions, particular combinations of virulence genes in the pathogen are expected to increase in frequency as a result of strong selection to match corresponding resistance genes in the host. This selection will lead to high levels of disequilibrium among particular combinations of virulence genes as frequently described in the rusts and mildews (e.g., WOLFE and ~ O T T 1982; HOWaLLER and Q ) S T E R G h 1991; KOLMER 1992). In these cases, it is often assumed that the associations among virulence loci result from strong selection to match particular combinations of resistance genes in host populations. It is also possible that much of this disequilibrium is maintained over extended periods of time and at arbitrary levels due to asexual reproduction rather than because of selection among particular loci (MCDONALD and MCDEFWOTT 1993).
In a pathogen with low levels of sexual reproduction, selection will increase the frequency of particular clonal lineages having combinations of virulence genes that match resistance genes in the host. Under these condi- tions, clonal lineages can persist for many generations and plant pathologists are usually correct when they assume that isolates with the same virulence spectrum are identical by descent. When pathogens undergo lim- ited sexual reproduction, plant breeders can exploit

1126 R.S. Chen and B. A. McDonald
the limits on recombination of virulence genes by de- ploying new combinations of resistance genes into a single host genotype. This is the strategy that has been used successfully to control many of the cereal rusts in North America for several decades.
In a pathogen with a high level of sexual reproduc- tion, such as M. paminicola, every sexual generation produces new combinations of virulence genes that can be selected out by the corresponding host resistance genes. Under this scenario, fungal isolates having the same combinations of virulence genes may not have recent common ancestors and the assumption that a population is composed of a limited number of clonal lineages will be incorrect. A breeding program oriented toward pyramiding resistance genes into common varie- ties is likely to fail because the pathogen has the poten- tial to rapidly recombine new combinations of match- ing virulence genes. In this case, plant breeders should pursue nonspecific resistance that often is inherited as a quantitative trait.
Before deciding on a gene deployment strategy, plant breeding programs should consider the genetic struc- ture of the pathogen population. In this manuscript, we have described methods that can be used to assess the relative contributions of sexual and asexual repro- duction to the genetic structure of pathogen popula- tions. In the case of the wheat pathogen M. graminicoh, it appears that resistance gene pyramids would not r e p resent an appropriate deployment strategy. Resistance genes may prove to be more durable if they are de- ployed in variety mixtures.
The authors gratefully acknowledge the assistance of C. C. MUNDT and M. SCHMITT, who collected much of the infected leaf tissue from which the isolates used in this study originated. This project was supported in part by National Science Foundation grant DEE 9306377.
LITERATURE CITED
ANDERSON, J. B., L. M. KOHN and J. F. LESLIE, 1992 Genetic mecha- nisms in fungal adaptation, pp. 73-98 in The Fungal Community: Its Organixation and Role in the Ecosystem, edited by G. C. CARROLL and D. T. WICKLOW. Dekker, New York.
BOEGER, J. M., R. S. CHEN and B. A. MCDONALD, 1993 Gene flow between geographic populations of Mycosphuerella gruminicola (anamorph Sgbtm'u hitici) detected with RFLP markers. Phytopa-
BROWN, A. H. D., M. W. FELDMAN and E. NEVO, 1980 Multilocus structure of natural populations of Hordeum spontaneum. Genetics
BROWN, J. K. M., and M. S. WOLFE, 1990 Structure and evolution of a population of Eqsiphe gruminis f. sp. hordei. Plant Pathol. 39:
BURDON, J. J., and A. P. ROELFS, 1985 The effect of sexual and asexual reproduction on the isozyme structure of populations of Puccinia gruminis. Phytopathology 7 5 1068-1073.
CHEN, R. S., J. M. BOEGER and B. A. MCDONALD, 1994 Genetic stabil- ity in a population of a plant pathogenic fungus over time. Mol.
ENGELS, B., 1988 FISH6. Version l.001. University of Wisconsin Ge-
GARCIA, C., and D. MARSHALL, 1992 Observations on the ascogenous
thology 83 1148-1154.
96: 523-536.
376-390.
EcoI. 3: 209-218.
netics Department, Madison, WI.
stage of Septm'a tn'tici in Texas. Mycol. Res. 96: 65-70.
GOODWIN, S. B., L. J. SPIELMAN, J. M. MATLJSZAK. S. N. BERGERON and W. E. FRY, 1992 Clonal diversity and genetic differentiation of Phytophthol-a infatans populations in Northern and Central Mex- ico. Phytopathology 8 2 955-961.
GOODWIN, S. B., B. A. COHEN and W. E. FRY, 1994 Panglobal distribu- tion of a single clonal lineage of the Irish potato famine fungus. Proc. Natl. Acad. Sci. USA 91: 11591-11595.
HOVMBLLER, M. S., and H. @STERG&, 1991 Gametic disequilibria between virulence genes in barley powdery mildew populations in relation to selection and recombination. 11. Danish observa- tions. Plant Pathol. 40: 178-189.
KING, J. E., R. J. COOK and S. C. MELVILLE, 1983 A review of Septoria diseases of wheat and barley. Ann. Appl. Biol. 103: 345-373.
KOHLI, Y., L. J. BRUNNER, H. YOELL, M. G. MILGROOM, J. B. ANDERSON et ul., 1995 Clonal dispersal and spatial mixing in populations of the plant pathogenic fungus, Sclerotinia sclerotzmm. Mol. Ecol.
KOHN, L. M., 1995 The clonal dynamic in wild and agricultural plant pathogen populations. Can. J. Bot. 73(Suppl. 1): S1231- S1240.
KOHN, L. M., E. STASOVSKI, I. CARBONE, J. ROIER and J. B. ANDERSON, 1991 Mycelial incompatibility and molecular markers identify genetic variability in field populations of Sclerotiniu sclootimm. Phytopathology 81: 480-485.
KOLMER, J. A., 1992 Virulence heterozygosity and gametic phase disequilibria in two populations of Puccinia reconditu (wheat leaf rust fungus). Heredity 68: 505-513.
LENSKI, R. E., 1993 Assessing the genetic structure of microbial p o p ulations. Proc. Natl. Acad. Sci. USA 90: 4334-4336.
LEUNG, H., R. J. NELSON and J. E. LEACH, 1993 Population structure of plant pathogenic fungi and bacteria, pp. 157-205 in Advances in Plant Pathology, Vol. 10, edited by J. H. ANDREW and I. C. TOMMERUP. Academic Press, New York.
LEVY, M., J. ROMAO, M. A. MARCHETTI andJ. E. HAMER, 1991 DNA fingerprinting with a dispersed repeated sequence resolves pathotype diversity in the rice blast fungus. Plant Cell 3: 95- 102.
MAYNARD SMITH, J., N. H. SMITH, M. O'ROURKE and B. G. SPRATT, 1993 How clonal are bacteria? Proc. Natl. Acad. Sci. USA 90:
MCDONALD, B. A,, and J. M. MCDERMO~, 1993 Population genetics of plant pathogenic fungi. Bioscience 4 3 311-319.
MCDONALD, B. A., and J. P. MARTINEZ, 1990a DNA restriction frag- ment length polymorphisms among Mycosphaerellu gruminicola (anamorph Septon'a hitici) isolates collected from a single wheat field. Phytopathology 80: 1368-1373.
MCDONALD, B. A,, and J. P. MARTINEZ, 1990b Restriction fragment length polymorphisms in Septmia hiticioccur at a high frequency. Curr. Genet. 17: 133-138.
MCDONALD, B. A., and J. P. MARTINEZ, 1991a Chromosome length polymorphisms in a .9@toriu tn'tici population. Curr. Genet. 1 9
MCDONALD, B. A,, and J. P. MARTINEZ, 1991b DNA fingerprinting of the plant pathogenic fungus Mycosphmlla gruminicola (ana- morph Sqbtm'a hitici). Exp. Mycol. 15: 146-158.
MCDONALD, B. A., J. MILES, L. R. NELSON and R. E. PETIWAY, 1994 Genetic variability in nuclear DNA in field populations of S t a p nosporu nodmm. Phytopathology &I: 250-255.
MCDONALD, B. A., R. E. PETIWAY, R. S. CHEN, J. M. BOEGER and J. P. MARTINEZ, 1995 The population genetics of Septm'a tn'tici (teleomorph Mycosphaerella gruminicola). Can. J. Bot. 73(Suppl
MILGROOM, M. G., S. E. LIPARI and W. A. POWELL, 1992 DNA fin- gerprinting and analysis of population structure in the chestnut blight fungus, CTphonechiu parasitica. Genetics 131: 297-306.
REED, K. C., and D. A. MANN, 1985 Rapid transfer of DNA from agarose gels to nylon membranes. Nucleic Acids Res. 13: 7207- 7221.
SANDERSON, F. R., and J. G. HAMITON, 1978 Role of the perfect states in the epidemiology of the common Sqbtoria diseases of wheat. N. Z. J. Agric. Res. 21: 277-281.
SCHUH, W., 1990 Influence of tillage systems on disease intensity and spatial pattern of Septoria leaf blotch. Phytopathology 8 0
4 69-77.
4384-4388.
265-271.
1): S292-S301.
1337-1340.
Sexual Reproduction in Fungi 1127
Scorn, P. R., F. R. SANDERSON and P. W. BENEDIKZ, 1988 Occurrence of M y c o s p h l h gmminicola, teleomorph of hitici, on wheat debris in the UK. Plant Pathol. 37: 285-290.
SHAW, M. W., and D. J. Row. 1987 Spatial distributions of sgtmia nodorum and sq?toria tritici within crops of winter wheat. Plant Pathol. 36 84-94.
Smw, M. W., and D. J. Ram, 1989 Airborne inoculum as a major source of Septm'a tn'tici ( M y c o s p h l h gmminicolu) infections in winter wheat crops in the UK. Plant Pathol. s8: 35-43.
SOUZA. V., T. T. NGUYEN, R R. HUDSON, D. F'INERO and R. E. LENSKI, 1992 Hierarchical analysis of linkage disequilibrium in Rhim
bium populations: Evidence for sex? Proc. Natl. Acad. Sci. USA
STODDART, J. A., and J. F. TAILOR, 1988 Genotypic diversity: estima- tion and prediction in samples. Genetics 118 705-711.
WEIR, B. S., 1990 Gcnctic Data Analysis. Sinauer Associates, Sunder- land, M A .
WOLFE, M. S., and D. R. mom, 1982 Populations of plant path* gens: some constrains on analysis of variation in pathogenicity. Plant Pathol, 31: 79-90.
8 9 8389-8393.
Communicating editor: A. H. D. BROWN