Services Marketing in the Hospitality Economy: An ... · Services Marketing in the Hospitality...
23
Services Marketing in the Hospitality Economy: An exploratory study Fotis C. Kitsios Technical University of Crete, Dept. of Production Engineering and Management, Chania, Greece Paper prepared for presentation at the 98 th EAAE Seminar ‘Marketing Dynamics within the Global Trading System: New Perspectives’, Chania, Crete, Greece as in: 29 June – 2 July, 2006 Copyright 2006 by [Fotis C. Kitsios]. All rights reserved. Readers may make verbatim copies of this document for non- commercial purposes by any means, provided that this copyright notice appears on all such copies. 1
Transcript of Services Marketing in the Hospitality Economy: An ... · Services Marketing in the Hospitality...
Services Marketing in the Hospitality Economy: An exploratory study
Fotis C. Kitsios
Technical University of Crete, Dept. of Production Engineering and Management, Chania, Greece
Paper prepared for presentation at the 98 th EAAE Seminar ‘Marketing Dynamics within the Global Trading System: New Perspectives’,
Chania, Crete, Greece as in: 29 June – 2 July, 2006
Copyright 2006 by [Fotis C. Kitsios]. All rights reserved. Readers may make verbatim copies of this document for non- commercial purposes by any means, provided that this copyright notice appears on all such copies.
1
Services Marketing in the Hospitality Economy: An exploratory study
Fotis C. Kitsios
Technical University of Crete, Dept. of Production Engineering and Management, Chania, Greece
Abstract. Meeting the challenges of an unstable and unsettled environment is not easy. The recent impacts on the hospitality services economy of changing technology, mergers of institutions, increasingly demanding consumers and increased competition have created an atmosphere of volatility and rapid change. In order to survive in this demanding market place, service organisations have only one choice, to successfully develop and launch new services. However, the failure rate of new service projects is high, because the knowledge on how new services should be developed is limited. Unfortunately, unlike tangible new product development practices which have the benefit of extensive research into how successful new products are developed, the service sector has only recently begun to explore ways to ensure the success of new services. Therefore, this study focuses on a better understanding of how successful new hotel services are developed and investigates the factors, which have impact on success or failure in new service development (NSD) in the hotel sector. The results of the exploratory study are summarised in a conceptual model for further research.
Key words : Innovation process, services marketing, new product development, new service development, critical success factors, hotels - tourism
1 IntroductionWithin the rapidly changing business environment there has been a resurgence of interest among marketing researchers regarding the role of innovation in gaining competitive advantage. The literature to date has focused on manufacturing innovation. However, services innovation literature has grown significantly over the last decade, reflecting the increased contribution of service industries to the national economy. But the limited literature on new service development (NSD) remains fragmented.
The majority of NSD research has concentrated on the financial service sector, and one of the largest industries world- wide, the hospitality industry, has not been specifically investigated. Success factors for new services are in general similar to those for new product development, only the potency of the factors differ (Cooper and de Brentani, 1991). This can be explained by the nature of services, which are intangible, heterogeneous, perishable, and where production and consumption are inseparable (Zeithaml and Bitner, 2000).
The success rate of new service projects is on average 58% (Griffin, 1997). In other words four out of ten new services fail in the market place. The empirical studies, which have investigated the success factors at the project level, indicated that success or failure is not the result of managing one or two activities very well, it is the result of a holistic approach, managing several aspects competently and in a balanced manner (Johne and Storey, 1998). The critical dimensions that influence new service performance can be categorised into four clusters: (1) product - related, (2) market - related, (3) company-related, and (4) process - related (de Brentani, 1999).
This article reports on exploratory research into potential characteristics that distinguish between success or failure of new hotel services in Greece; and it thereby contributes to the goal of improving success rates by allowing managers to refine their development processes for new services in a more satisfying way. This goal is
2
accomplished by presenting numerous variables that may have an impact on success and failure. These variables are summarised in a conceptual model for further research.
2 Background of the ResearchThe second part of this article presents a general overview of the development of service economies that we considered necessary to place the study in context. What follows is a more detailed analysis of tourism as a major service activity and the hotel industry within tourism services.
2.1 Service Sector
Fundamental changes have occurred in the structure of most countries’ economies since the Second World War, with services becoming the major sector of economic activity (OECD 2000a). The USA was the first service- oriented nation. At the beginning of the 1900s, fewer than 30% of workers in the United States were employed in services, compared to 40% in agriculture. However 55%, of the working population was employed in services since 1929, and approximately 54% of GNP was generated by services (Zeithhaml and Bitner 1996). Service employment in the US rose to over 66% by 1980; the trend in Europe was slower, though by 1977 52% of employment in the EEC was in the tertiary sector (Gershuney and Miles, 1983).
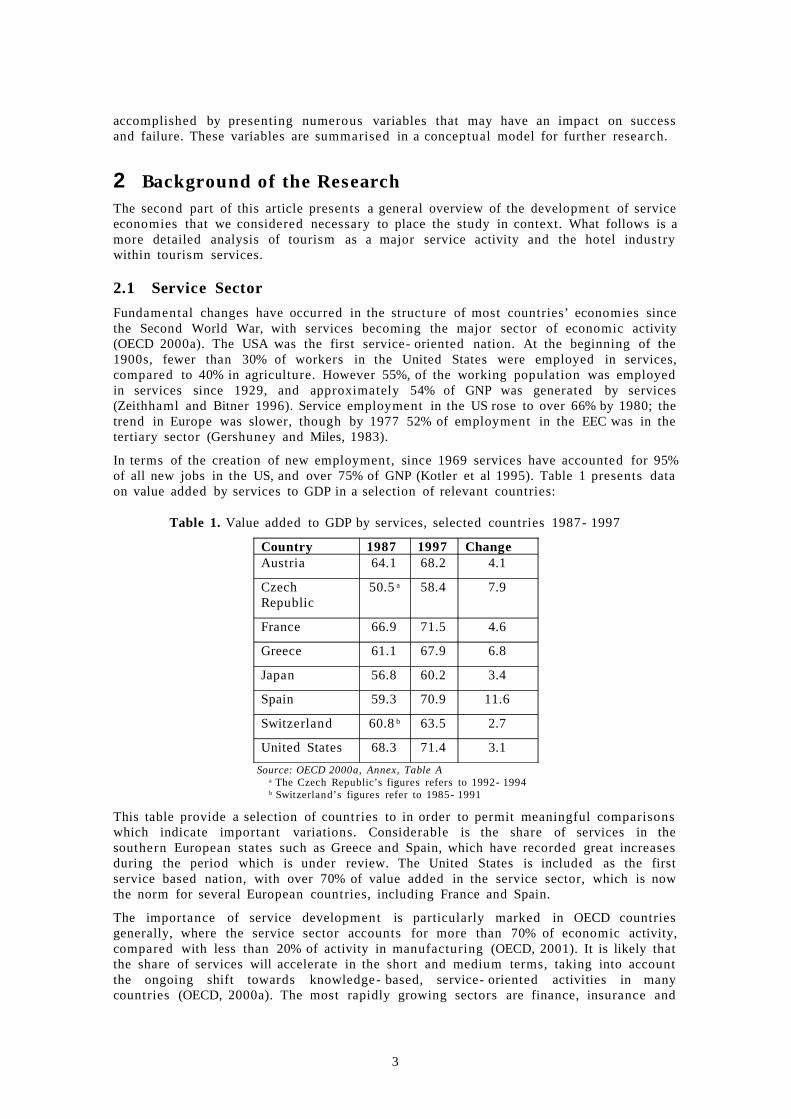
In terms of the creation of new employment, since 1969 services have accounted for 95% of all new jobs in the US, and over 75% of GNP (Kotler et al 1995). Table 1 presents data on value added by services to GDP in a selection of relevant countries:
Table 1. Value added to GDP by services, selected countries 1987- 1997
Country 1987 1997 ChangeAustria 64.1 68.2 4.1
Czech Republic
50.5 a 58.4 7.9
France 66.9 71.5 4.6
Greece 61.1 67.9 6.8
Japan 56.8 60.2 3.4
Spain 59.3 70.9 11.6
Switzerland 60.8 b 63.5 2.7
United States 68.3 71.4 3.1
Source: OECD 2000a, Annex, Table Aa The Czech Republic’s figures refers to 1992- 1994b Switzerland’s figures refer to 1985- 1991
This table provide a selection of countries to in order to permit meaningful comparisons which indicate important variations. Considerable is the share of services in the southern European states such as Greece and Spain, which have recorded great increases during the period which is under review. The United States is included as the first service based nation, with over 70% of value added in the service sector, which is now the norm for several European countries, including France and Spain.
The importance of service development is particularly marked in OECD countries generally, where the service sector accounts for more than 70% of economic activity, compared with less than 20% of activity in manufacturing (OECD, 2001). It is likely that the share of services will accelerate in the short and medium terms, taking into account the ongoing shift towards knowledge- based, service- oriented activities in many countries (OECD, 2000a). The most rapidly growing sectors are finance, insurance and
3
real estate and business services; in 1995, for 19 OECD countries these sectors, exceeded a total of US$ 1.1 trillion. By 1997 ten of the largest 20 corporations in the world by revenues were service enterprises.
Changes have occurred on both the supply and demand side for services. Often it is not the type of human need that has changed, but rather the way of satisfaction that is required (Harvey, 2000). Developed countries have moved from industrial, mechanical, nationally- focused economies producing mass consumer durables under a regulatory framework and in stable conditions, to globalised, de- regulated, client - focused economies characterized by rapid, discontinuous change, which is impossible to forecast in the long term (Kostecki, 1994). This has resulted in the development of “service economies”.
It is clear that these fundamental changes had a great impact on the extraordinarily rapid development of service industries during the past 25 years in both developed and developing countries, and in many cases have provoked it. The international hotel sector is one such industry (Johnson, 2002).
2.2 Tourism as a major service “industry”
Although tourism is often referred to as "the world's largest (and often fastest - growing) industry" it is not one industry, rather is it composed of a number of related and inter -related service sectors that do not fit neatly into the standard criteria for national accounts (OECD 2000b). The Standard International Classification of Tourism- Related Services (SITCA) of the World Tourism Organisation (WTO) identified 70 specific activities related to supplying tourism services, and an additional 70 activities which were at least partially concerned with them (WTO, 1998). An important consequence of this dispersion is that it is extremely difficult to measure accurately the full economic impact. Nevertheless, when looking at the sum of the parts, i.e. accommodation, meals, local transport, entertainment and shopping, statistics relating to tourism are of significant scale.
Tourism is considered here as international tourism; this is estimated at only 10% of total tourism flows (Poon, 1993). Even so, by 1995 tourism accounted for over one third of the value of total worldwide services trade. In terms of output, travel and tourism are forecast globally to generate 11% of GDP (WTTC, 1995). Tourism is a highly labour intensive industry, and is a major source of both employment and foreign currency, especially in remote and rural regions. Tourism demand (both international and domestic) is directly related to income levels; therefore the sector has grown as a function of increasing prosperity throughout the world. In contrast to fast - moving consumer goods (FMCG) marketing, tourism marketing may be seen to consist of “slow marketing”, as tourism projects require substantial investment in infrastructure and other facilities. This can run into billions of US dollars and take over a decade for results to be seen as it happens in certain countries in Eastern Central Europe.
Tourism is an important employer in developing nations. This may be attributed to the high growth rates of the tourism sector in relation to the domestic economy as a whole: By the late 1970s there was already substantial expansion by international hotel companies in developing countries (Dunning and McQueen, 1982). Initially tourism was heavily concentrated in the developed world (focused strongly on Europe and the United States, which had over 70 % of market share). The share of developing countries now accounts for 1/3rd of the total (WTO, 2002). Less developed countries have enjoyed strong increases (albeit from very low bases). Other factors that will have a bearing on the development in these countries are perceived political and economic stability, along with levels of transport and infrastructure (Johnson, 2002).
4
2.3 Tourism Services
Although it is a set of complex and interrelated service activities, we may usefully define tourism as “the activities of persons travelling to and staying in places outside their normal environment for a period of no more than one consecutive year for leisure, business and other purposes" (OECD, 2000b). The tourism “industry” may therefore be considered from both the demand and supply side as those organizations and individuals involved in the consumption and supply of tourism activities.
All statistics may be aggregated into the different industry sectors to provide a fuller picture of the contribution that tourism makes, both directly and indirectly, to the various industry classifications. Coefficients are then calculated to obtain the numbers of people employed in the different branches. Recently, real progress has been made in quantifying the full impact of tourism across different industry sectors. After much ambiguity and in exactitude, serious attempts have been made to determine the contribution of tourism and the value added from the demand side.
Over the past fifteen years the Statistical Committee of the OECD has been working with the World Tourism Organisation and the UN to develop a set of Tourism Satellite Accounts. The creation of the TSAs is an important step forward, enabling more accurate comparability and credibility in data analysis of the direct impact, (e.g. in hospitality and tourism enterprises), and in indirect supplier sectors (e.g. in aircraft and ship manufacturing.)
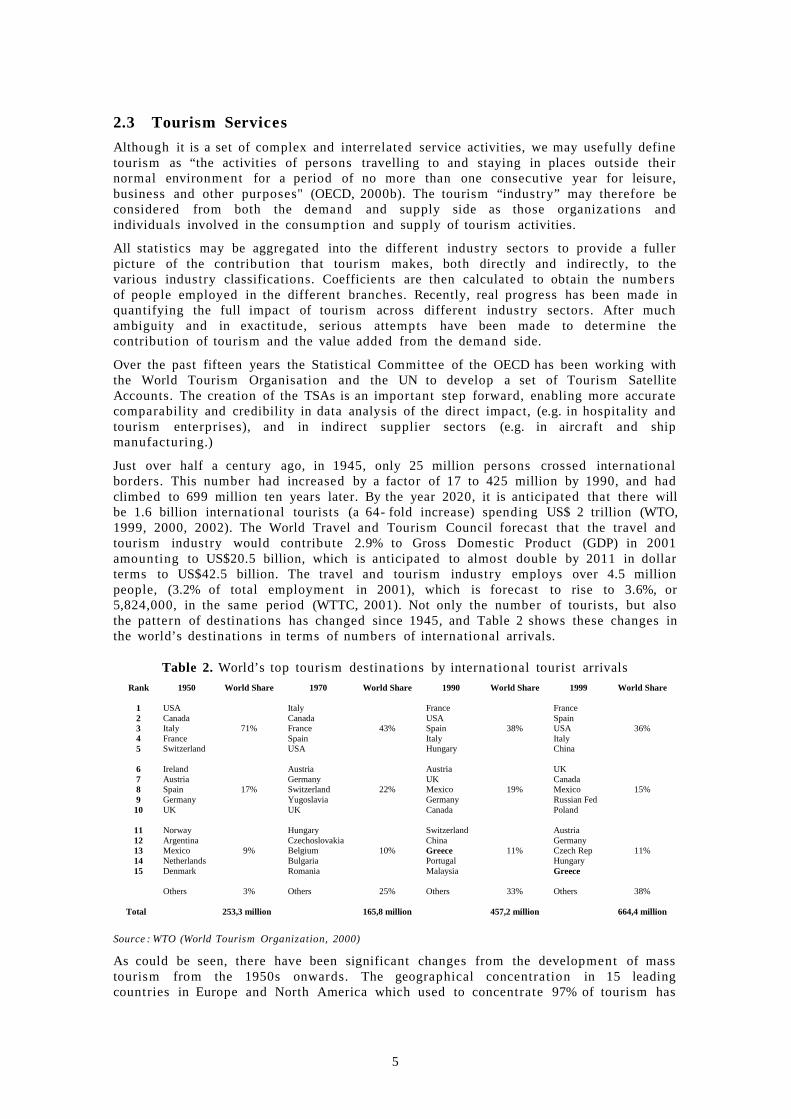
Just over half a century ago, in 1945, only 25 million persons crossed international borders. This number had increased by a factor of 17 to 425 million by 1990, and had climbed to 699 million ten years later. By the year 2020, it is anticipated that there will be 1.6 billion international tourists (a 64- fold increase) spending US$ 2 trillion (WTO, 1999, 2000, 2002). The World Travel and Tourism Council forecast that the travel and tourism industry would contribute 2.9% to Gross Domestic Product (GDP) in 2001 amounting to US$20.5 billion, which is anticipated to almost double by 2011 in dollar terms to US$42.5 billion. The travel and tourism industry employs over 4.5 million people, (3.2% of total employment in 2001), which is forecast to rise to 3.6%, or 5,824,000, in the same period (WTTC, 2001). Not only the number of tourists, but also the pattern of destinations has changed since 1945, and Table 2 shows these changes in the world’s destinations in terms of numbers of international arrivals.
Table 2. World’s top tourism destinations by international tourist arrivals
Rank 1950 World Share 1970 World Share 1990 World Share 1999 World Share
1 USA Italy France France 2 Canada Canada USA Spain 3 Italy France Spain USA 4 France Spain Italy Italy 5 Switzerland
71%
USA
43%
Hungary
38%
China
36%
6 Ireland Austria Austria UK 7 Austria Germany UK Canada 8 Spain Switzerland Mexico Mexico 9 Germany Yugoslavia Germany Russian Fed
10 UK
17%
UK
22%
Canada
19%
Poland
15%
11 Norway Hungary Switzerland Austria 12 Argentina Czechoslovakia China Germany 13 Mexico Belgium Greece Czech Rep 14 Netherlands Bulgaria Portugal Hungary 15 Denmark
9%
Romania
10%
Malaysia
11%
Greece
11%
Others 3% Others 25% Others 33% Others 38% Total 253,3 million 165,8 million 457,2 million 664,4 million
Source : WTO (World Tourism Organization, 2000)
As could be seen, there have been significant changes from the development of mass tourism from the 1950s onwards. The geographical concentration in 15 leading countries in Europe and North America which used to concentrate 97% of tourism has
5
been reduced. The industry has become more diverse and more "democratised". There have been other underlying trends, such as attempts to lessen the impact of seasonality (i.e. the preponderance of mid- summer, north - south travel) through the staggering of school and work holidays. A greater variety also appears through an evolution in the reasons for travel, which tends to blur the distinction between business and leisure. There is an overall trend towards shorter individual stays (but with more frequent breaks), and an increasingly varied supply of accommodation. The Meetings, Incentive, Congress and Events (MICE) segments have been a major driving force behind the development of business tourism. There has also been a major increase in different types of vacation offered, including cultural, sports, adventure, rural and cruise tourism segments.
Although the largest segment numerically and economically is still “sea and sand” tourism, there have also been significant attitudinal changes, resulting in a demand for more information on the local surroundings and for more activities to be made available. From the original 25 million tourists who in 1945 visited just 15 countries, by 1997 over 70 countries had more than one million tourists, with the share of the top 15 countries slipping by 35%, from 97% to 62%.
In addition to the general changes in supply and demand, there are specific changes that have impacted on the tourism sector directly. Some of the major factors are (Weiermair, 1995; Johnson, 2002):
1. Increasing price and quality competition.2. Tourist consumers who are increasingly becoming “dollar rich, time starved”.3. Polarisation of the market into either standardized low value- added tourism
products / services or highly individualized / higher value- added services.4. An increasing awareness of the need for sustainable development in tourism planning.5. Continually increasing demand from consumers for more choice and activities, and
improved interaction between service suppliers and consumers.6. Increasing awareness of safety and security in consumers’ perception.7. Expansion of business tourism, including conventions and incentive tours8. A general tendency towards more frequent, but shorter - duration, travel (improving
seasonality), and interspersed with infrequent long haul, longer duration vacations.
These trends have had an evident effect upon tourism supply. One interesting analysis of this effect is that of Poon (1993) who has applied the product life cycle (PLC) to the tourism industry, with the early stages of "mass tourism" appearing on the scene from the early 1960s. By the end of the 1980s, however, there were signs that this form of tourism had matured and the main characteristics of mass production - i.e. charter flights filled with sun- seeking travellers who passively accepted whatever was given to them - was unappealing to many new segments of the market. Instead, the so- called “new tourism” was being offered as the alternative, based on sustainable development with diagonal integration and a combination of new technology and differently segmented markets. “New tourists”, it is postulated, are fundamentally different from old tourists in a number of key areas, including higher income, travel experience and education levels, and greater environmental and cultural sensitivity (Poon, 1993). The result may be seen in the development of such tourism products as adventure holidays, with their mix of nature, fitness and excitement (Johnson, 2002).
The industry's direct services to tourists represent between 3- 4% of GDP worldwide. Strong regional variations exist, however, and in some countries this may be as high as 10% (ILO, 2001). Travel and tourism is growing at about 3% per annum, again with differences according to region. In recent years, growth in Europe has been lower than average at 2.3%, but this masks intra- European differences, with Eastern and Central Europe recording growth of 5.2%. Again, regional variations range from 1.2% in the Americas to 2% in the Caribbean and Europe.
If indirect services are also included (i.e. those that provide infrastructure and supplies to the tourism industry), the tourism- related economy has been calculated to produce
6

up to 11% of GDP, employing 8% of the labour force worldwide (WTTC, 2001). As an approximate calculation, one direct job in the tourism industry induces one- and- a- half jobs in the wider, tourism - related economy. It is important to note that tourism includes travel undertaken for business purposes, not just for leisure.
2.4 Greek Tourism Industry
Tourist developed faster in Greece than in the rest of Europe and the world until 1990. During the decade 1990- 2000, even though we notice that the decline in the arrival growth rate, is bigger in Greece than in Europe and the world. This signals the fact that Greece is already a “mature” tourist destination –within the product life cycle concept - , which is facing the risk of entering a stagnation period, which will of course be followed by a decline one, of unknown duration, unless it there is some drastic action.
Table 3: Arrivals in Greece, Europe, World, 1950- 2000
World (in millions)
Variation per
decade
Europe (in millions)
Variation per decade
Greece (in
thousands)
Variation per
decade1950 25,3 16,8 33,3
1960 69,3 174,11% 50,4 199,70% 399,4 1098,33%
1970 165,8 137,25% 117,3 133,01% 1.609,2 302,87%
1980 286,0 72,50% 188,3 60,50% 5.271,1 227,56%
1990 457,2 59,86% 282,7 50,13% 8.873,0 68,33%
2000 698,8 52,84% 403,3 42,66% 12.500,0 40,88%Source: WTO,G NTO
It is impressive that in the past decade, during the trimester July, August and September, more than 50% of the annual arrivals come steadily in that period of time. Any efforts to smoothen the seasonality has had no effect, either because of lack of continuance, or consistency or –and primarily that - because they were not based on differentiation /enrichment of the product. The continuation of this situation intensifies the problem of endurance of the infrastructure during the high season, and lowers the return on investments.
The main competitors of Greece as tourist destinations and as countries in the same phase in the product life cycle concept are the following: Spain, Turkey, Cyprus, Portugal and Egypt. Greece and Spain have the same development growth rate (and lower than the rest), a fact that can be justified since both destinations have reached a maturity stage. Turkey and Egypt are developing faster since both destinations are still in a relatively young age. Cyprus, because of its size, is a special case, and finally, Portugal presents a higher development rate as a “younger age” tourist destination.
A common characteristic for all countries is the fact that the majority of tourist activity, as it is expressed by the spatial concentration of Hotel beds, is in three regions. Because of its size, Cyprus must be excluded from the comparison. The concentration ratios for all countries shows: High dependence on tourism, by some area, but simultaneously possibilities for growth for the rest.
Table 4: Concentration of Hotel Beds, Greece and Competitors, 2000
% beds to the total in three regions
Other regions
Spain *Balearic Islands 24%
Catalonia 18%Andalusia 14%
Total 56% 44%
Turkey
7

Antalya 41%Mugla 15%
Constantinople 14%Total 70% 30%
PortugalAlgarve 39%Lisbon 24%Madera 10%Total 73% 27%
Egypt **Red Sea Coast 23%
Dahab 15%Cairo 14%Total 52% 48%
GreeceCrete 20%
Dodecanese 18%Central Greece 16%
Total 53% 47%
*spatial concentration in Spain and Egypt applies to rooms , **1999 data
Sources: Egyptian Federation of Tourist Chambers, Hellenic Chamber of Hotels, Hotel Union of Spain, TYD, CTO, INE- Portugal
One of the most important problems of Greek Tourism is the intense seasonality of demand. This problem, at least, shows the existing development potential. What must stop of course, is wishing for a 12month tourist season, with the development of every type and kind of tourism and at the same time to aim initially, at the prolonging of the season by the development of congress /exhibition infrastructure, golf, thalassotherapy, and marinas.
There are important qualitative and quantitative differences also, observed at a supportive tourist infrastructure level that is in conference centers, marinas, golf courses thalassotherapy centers etc. This data, differentiate quality- wise the composition of the tourist product, contributing in the smoothing of the seasonality, and have obviously higher returns.
Table 5: Specific Tourist Infrastructures Greece and Competitors, 2000
Spain Turkey
Cyprus
Portugal
Egypt Greece
Golf Courses 254 10 2 55 12 4Con ference Centers * 46 6 2 44 1 9Thallaso SPA Centers 89 31 5 42 2 5Marinas 260 15 2 17 2 15*exclusively conference grounds
Source : Andersen (2002) – SETE (2002)
Based on Table 5, referred to arrivals per million, and in accordance to competitive destinations, Greece should have today, 46 Golf courses, 15 Conference /Exhibitions centers, 24 Thalassotherapy SPA Centers and 42 Marinas.
Table 6: Comparative table of existing towards the necessary specific infrastructure in Greece based on potential arrivals in relation with the competitors
Existing NecessaryGolf Grounds 4 46Convention Centers * 9 15SPA Centers 5 24Marinas 15 42
Source : SETE (2002)
Although these targets are quite ambitious even on a decade level nothing is impossible. In order to realize these investments along with the necessary for modernization and
8
upgrading of Greek tourist supply as whole, it needs a clear, stable, attractive institutional investment framework, adapted to market conditions (SETE, 2002).
2.5 Aims of the Research
The effort of goal- setting and strategic approach for Greek tourism according to the special tourism infrastructure, in which hotels will be invited to invest on, also the modernization of all the Greek hotel units in order to handle the demanding business environment, is very difficult and must be effective. The challenge for the hotel owners and hotel executives is very significant and nobody wants not to be involved in such a holistic development that comes upon. So a research question could be if it is possible for someone to investigate the way to develop successful new services in hotel enterprises. Another one could be if there are any factors that are able to discriminate between success and failure of new services? To sum up, the new decisions will be made under the question if it is possible the future successfulness of new hotel services to be predicted.
2.6 The Conceptual Framework
During the recent years the competitive environment has become very tough and demanding. At the same time the general pace of doing things has accelerated tremendously mainly due to technological inventions - such as internet, e- mail, mobile phones, etc. All these general changes in our society give us a good motive to develop more flexible and quickly applicapable approaches to offering development. However, one should remember that flexibility and speed in offering development is an asset only, if the final outcome of that process is perceived as something superior compared with what has been by the end- user. A clear danger is that we use more energy for developing our development processes than products and services themselves.
If one looks at the quantity of the existing literature the area of service development could be seen as an infant brother to product development. One should, however, remember that the trend is changing and more and more research is carried out in the area of service development. The reason for the increased interest is the fact that most products are described as combinations of tangible and intangible elements and the traditional line between intangible services and tangible goods has become like a line drawn on water. In order to relieve the traditional battle between goods and services, the term ´offering ´ is used in this study due to its holistic and customer orientated character. Despite this kind of common approach, one has to be well aware of the differences between goods and services in order to be able to manage and control them in a proper way. Regarding those differences most scholars seem to agree upon their existence.
The number of studies on service development in the hospitality industry is very modest. Most authors base their argumentation on the existing product / service development models and the discussion is limited to the specific characteristics of the hospitality industry. One of the findings is also that in many cases no systematic approaches to service development are used. Feltenstein (1986) presents a totally new model, but unfortunately it covers only a very specific area of hospitality management, menú- planning.
Conceptual frameworks can be built in many different ways. On a general level the framework should assist us in our orientation towards different components associated with the studied phenomena (Engelbart, 1962). Furthermore, it should establish some kind of shared vision of the target area of interest. In this study the conceptual framework has been given the role of creating order and showing different aspects having an impact on the service development process. Moreover it will investigate the anticipated relationship between the process development and the potential successful or failure result. The approach has been chosen because the author feels that it explicitly supports the empirical part of this study and very generally takes into consideration the
9
reviewed theories. As the entire study is based on a strong management - orientation, the conceptual framework has been also seen from a management point of view. In addition the author feels that the chosen simple and visual way of presenting the framework serves best the study as a whole.
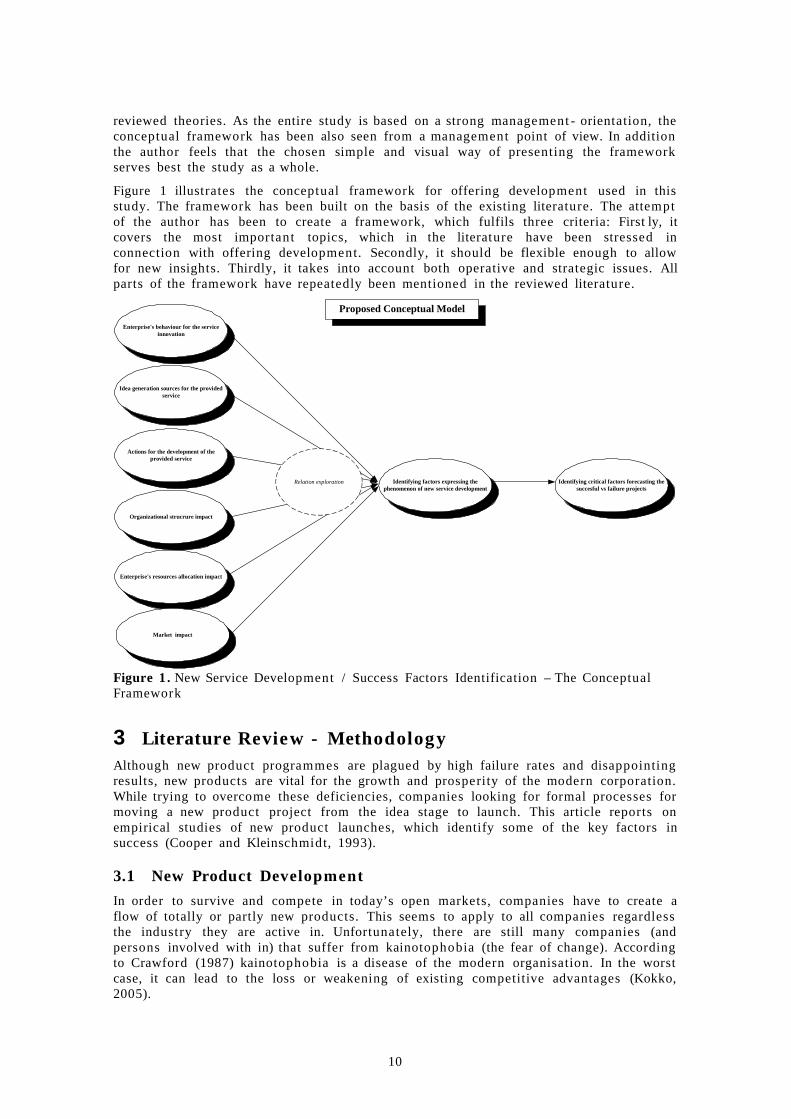
Figure 1 illustrates the conceptual framework for offering development used in this study. The framework has been built on the basis of the existing literature. The attempt of the author has been to create a framework, which fulfils three criteria: First ly, it covers the most important topics, which in the literature have been stressed in connection with offering development. Secondly, it should be flexible enough to allow for new insights. Thirdly, it takes into account both operative and strategic issues. All parts of the framework have repeatedly been mentioned in the reviewed literature.
Enterprise's behaviour for the serviceinnovation
Idea generation sources for the providedservice
Actions for the development of theprovided service
Organizational strucrure impact
Enterprise's resources allocation impact
Market impact
Identifying critical factors forecasting thesuccesful vs failure projects
Identifying factors expressing thephenomenon of new service development
Proposed Conceptual Model
Relation exploration
Figure 1 . New Service Development / Success Factors Identification – The Conceptual Framework
3 Literature Review - MethodologyAlthough new product programmes are plagued by high failure rates and disappointing results, new products are vital for the growth and prosperity of the modern corporation. While trying to overcome these deficiencies, companies looking for formal processes for moving a new product project from the idea stage to launch. This article reports on empirical studies of new product launches, which identify some of the key factors in success (Cooper and Kleinschmidt, 1993).
3.1 New Product Development
In order to survive and compete in today’s open markets, companies have to create a flow of totally or partly new products. This seems to apply to all companies regardless the industry they are active in. Unfortunately, there are still many companies (and persons involved with in) that suffer from kainotophobia (the fear of change). According to Crawford (1987) kainotophobia is a disease of the modern organisation. In the worst case, it can lead to the loss or weakening of existing competitive advantages (Kokko, 2005).
10

One has to remember that products and services of an organisation are among its most visible assets (or liabilities) linking a firm to its environment. That environment consists of many different groups: customers, suppliers, owners, employees, regulators and others interested in the firm’s performance. Interaction with all these groups is essential. New products are therefore the basis for a variety of strategic decisions that define an organisation’s direction. In other words, product development can be seen as an activity vital for the existence of the company (Kokko, 2005).
A lot of research has been carried on the elements of successful and unsuccessful product development. Looking at the literature the findings tend to be quite similar. The findings are also of a rather general character, so obviously more research is needed. In the following some of these findings are presented and commented.
Estimates of the new product failure rate in the literature vary between 20 and 90% (Urban and Hauser, 1993). Booz, Allen and Hamilton (1982), talk about a 35% failure rate. The failure rate seems to differ from business to business and the impact of all possible external forces can obviously not be precisely calculated.
Moore and Pessemier (1993), present three essential success factors: superior value in the eyes of the customer, an efficient development process and a well- directed and well- funded market launch. Crawford (1987), has looked at failures and gives three reasons for new product failure: no real potential buyer need or desire for the product, the new product does not meet the existing needs and mishandled marketing effort.
In his study of 161 business units in a variety of industries in the US, Germany, Denmark and Canada Cooper (1998) could identify three cornerstones of performance that distinguish the top performing businesses: having a high quality new product process, selecting a sound new product strategy for the business and making the necessary resource commitments (Cooper, 1998). Urban and Hauser (1993), have analysed comparatively Booz, Allen and Hamilton (1982), de Brentani (1989), Cooper and Kleinschmidt (1987) and Duerr (1986). They recognised thirteen potential success factors.
There are also studies that come to a conclusion which it is not possible to indicate a single factor that would lead to success or failure. See for instance the discussion in Rothwell et al (1974). Quite often there seems to be a joint effect that results in success. Therefore, instead of looking at single success factors, one should create a list of general ´house rules ´ in order to avoid clear strategic mistakes. One example of a set of eleven house rules is presented in Cooper and Kleinschmidt (1991). Johne (1996) reminds us that much more attention should be paid to continuous product development success rather than to project /product success.
When the success / failure of a new product program has been studied, there seems to be evidence that an analytical approach, clear strategy and consistency increase the probability for good business results. Also internal commitment and motivation are important (Song and Parry, 1997).
A lot of research has been carried out concerning success and failure factors. Most researchers seem to agree that product development is an essential function of the company and there are no signs that this importance will decrease. Most scholars seem to have a united opinion that product development is one of the most important strategic functions of the company. The literature on traditional product development is orientated towards tangible goods (Kokko, 2005).
3.2 New Service Development
In all service development, one of the major stumbling blocks is the inability to describe the service process characteristics objectively. To depict them so that employees, customers and managers alike know what the service is one can see their role in its delivery, as well as understand all of the steps and flow involved in the service process. (Zeithaml and Bitner, 1996)
11

One possible approach is the use of different mapping techniques where an existing service is described visually in order to find potential weak points or to evaluate alternative procedures (Shostack, 1984; Ekholm and Wrange, 1996 and Wrange 1997). In the literature at least five different kinds of mapping techniques can be found: service blueprinting (Shostack, 1981), Service mapping (Kingman- Brundage, 1989), The Structured Analysis and Design Technique- SADT (Congram and Epelman, 1994), Multilevel Mapping (Norling, 1993) and Service Process Rationalization Method (Kim and Kim, 2001).
One of the first researchers, who looked at service development, was Shostack (1982). Her molecular model has become a classic as it separated between intangible and physical parts of the service and she also identified bonds, which later became an interesting object of versatile research. Scheuing and Johnson (1989), propose a 15-stage model for new service development in which they have paid special attention to test the service- to- become from the concept, service, process and marketing point of view (Kokko, 2005).
Wilhelmsson and Edvardsson (1994), have presented a four- stage development model, where the stages are: idea phase, project stage, development phase and implementation phase. According to the researchers the phases overlap and sometimes one has to return to an earlier phase. The similar processs - thinking can be found from Jönsson (1995) and from Angberg and Åberg (1997), who basically have further developed the Wilhelmsson and Edvardsson model by stressing that the phases overlap and that quite often one has to go back to the previous phase.
Edvardsson ´ s and Olsson ´s (1996; Edvardsson, 1996a; 1996b), model for service development consists of three essential parts: development of the service concept, development of the service process and development of the service system. These components have different kinds of interrelationships depending on the character of the service development project.
De Brentani (1993), has studied 106 new industrial services from 37 financial institutions. Approximately half of the services were considered by companies themselves to be successful. She came up with four significant factors that are positively linked to new service success. The four factors were: supportive, high involvement new service development environment, formal and extensive launch programme, formal up-front design and evaluation and expert - driven new service development process. In her study she found two factors, which were not significant to new service success. They were: marketing - dominated new service development process and customer - driven new service development process.
Also Martin and Horne (1995), have looked at success factors. In a study of 88 firms concerning a total of 176 service innovations, they found that in five factors out of six there were significant differences between the most and least successful service innovations. The significant differences could be found in the following factors: direct overall customer participation in service innovations, direct participation of senior management in service innovations, direct participation of customer contact personnel in service innovations, direct participation of non- contact personnel in service innovations and the greater use of customer information. The only non- significant factor was the participation of other outside resources. (Martin and Horne, 1995).
Edvardsson (1995), has made a general synthesis of characteristics of the service development processes. He presents nine points and he further gives a list of eight potential factors for successful new service development, which give quite a complex picture of the new service development as a process.
Tax and Stuart (1997), present a normative seven- step planning cycle through which they try to integrate the potential new service successfully with the existing service system. Starting with an audit of the firm´s original service system, the requirements of the market and the extent of change that the new service represents are analysed.
12

Finally, the effects that the new service will have on the existing service system are assessed.
Grönroos (1990) has presented a dynamic six stages model for developing the service offering. This approach takes into account both customer features and organisational features. At the end he refers to the basic characteristics of services.
Fitzsimmons and Fitzsimmons (2000), are calling for a totally new paradigm for service development: real- time marketing. In their vocabulary real- time marketing practically means that an offering is under modification during the contact between the contact person and the customer. The authors suggest that real- time marketing will become the dominant marketing paradigm. Further, they see this change of paradigm as one way of blurring the traditional definitions separating products and services from each other and, at the same time, increasing the sensitivity towards customer values and needs for customization (Kokko, 2005).
3.3 Service Development in the Hospitality Economy
Very little has been written specifically about service development in the hospitality economy. The results of some studies, which have all been concentrated explicitly on the hospitality industry, will be presented in this paragraph.
Feltenstein (1986) writes about menu development, which is a small part of a total restaurant offering development. He suggests a model for new- product development consisting of six stages which is very comprehensive and operations - orientated. Jones (1995) has studied how to develop new products and services in flight catering and, more generally, how to manage hospitality innovation (1996). In his earlier paper he compares new product development (Booz, Allen and Hamilton 1982) and new service development (Scheuing and Johnson, 1989). After the comparison he goes on and discusses new service development in the flight catering. In his latter paper (Jones 1996), discusses new service development more generally. He uses the Scheuing and Johnson model (1989), as the basis and then presents four case studies. His conclusion is that the firms do not usually follow the formal process for innovation due to three reasons: the nature of the innovated product itself, the nature of the organisation engaged in the innovation and the external environment (Jones, 1996).
Jones, Hudson and Costis (1997), have studied new product development in the UK tour - operating industry. Their study consisted of four case studies, which were analysed with the Scheuing and Johnson (1989), 15- stage model as a theoretical framework. The four cases illustrated that the firms do not follow the model in their approach to innovation. What is even more striking is that they do not seem to follow any other models either. There may be three major reasons for this: originality of the product or service, the size of organisations in the tour - operating industry and environmental factors.
Knowles and Ware- Lane (1994) discuss new product development in food and beverage operations. In their context, they see food and beverage operations as a combination of products and services within a total product system consisting of three levels: the core product, the tangible product and the augmented product. (Knowles and Ware- Lane, 1994) Further on they discuss concept development, product lifecycle, product testing and creativity. In their conclusions, they state that in food and beverage operations the total concept and elements of that concept require continual review and development in line with market forces. A structured approach is required and creativity is crucial for the entire process.
Komppula and Boxberg (2002) present a five- stage model for developing a tourism product. Based on the continuous development of the service system, the model suggests the following stages in chronological order: development of the service concept, development of the service process, Market testing, commercialisation and assessment after commercialisation (Kokko, 2005).
13
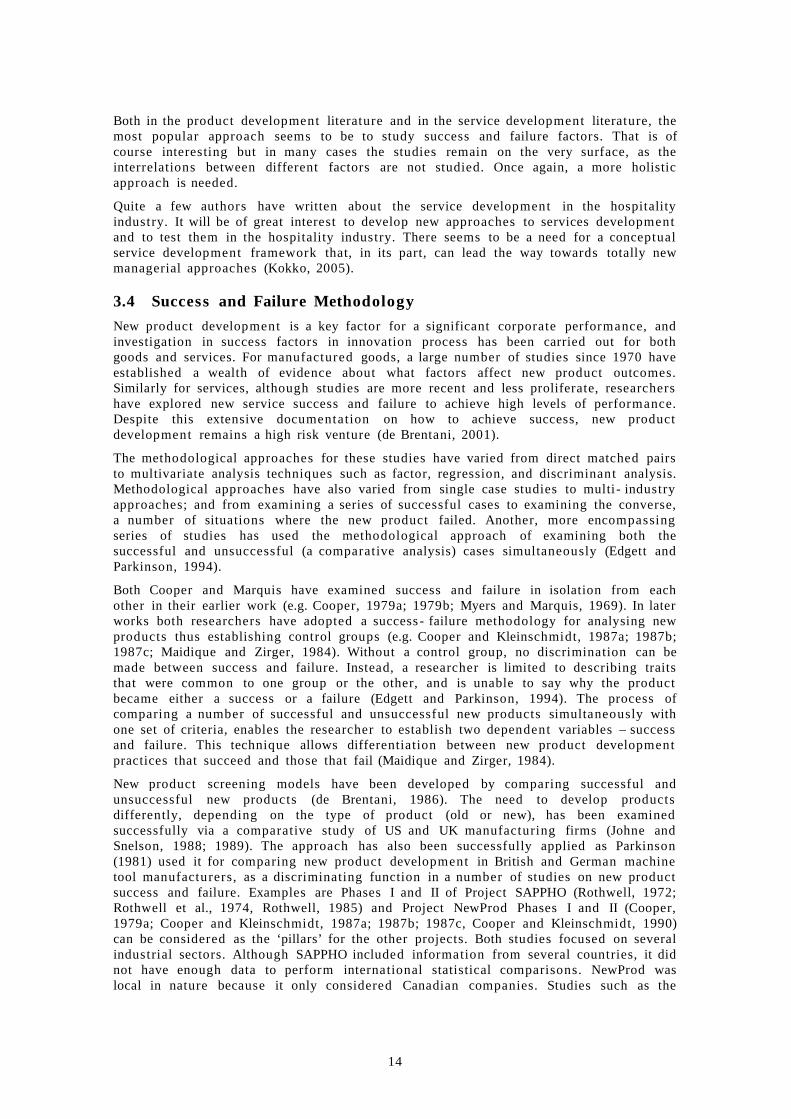
Both in the product development literature and in the service development literature, the most popular approach seems to be to study success and failure factors. That is of course interesting but in many cases the studies remain on the very surface, as the interrelations between different factors are not studied. Once again, a more holistic approach is needed.
Quite a few authors have written about the service development in the hospitality industry. It will be of great interest to develop new approaches to services development and to test them in the hospitality industry. There seems to be a need for a conceptual service development framework that, in its part, can lead the way towards totally new managerial approaches (Kokko, 2005).
3.4 Success and Failure Methodology
New product development is a key factor for a significant corporate performance, and investigation in success factors in innovation process has been carried out for both goods and services. For manufactured goods, a large number of studies since 1970 have established a wealth of evidence about what factors affect new product outcomes. Similarly for services, although studies are more recent and less proliferate, researchers have explored new service success and failure to achieve high levels of performance. Despite this extensive documentation on how to achieve success, new product development remains a high risk venture (de Brentani, 2001).
The methodological approaches for these studies have varied from direct matched pairs to multivariate analysis techniques such as factor, regression, and discriminant analysis. Methodological approaches have also varied from single case studies to multi - industry approaches; and from examining a series of successful cases to examining the converse, a number of situations where the new product failed. Another, more encompassing series of studies has used the methodological approach of examining both the successful and unsuccessful (a comparative analysis) cases simultaneously (Edgett and Parkinson, 1994).
Both Cooper and Marquis have examined success and failure in isolation from each other in their earlier work (e.g. Cooper, 1979a; 1979b; Myers and Marquis, 1969). In later works both researchers have adopted a success - failure methodology for analysing new products thus establishing control groups (e.g. Cooper and Kleinschmidt, 1987a; 1987b; 1987c; Maidique and Zirger, 1984). Without a control group, no discrimination can be made between success and failure. Instead, a researcher is limited to describing traits that were common to one group or the other, and is unable to say why the product became either a success or a failure (Edgett and Parkinson, 1994). The process of comparing a number of successful and unsuccessful new products simultaneously with one set of criteria, enables the researcher to establish two dependent variables – success and failure. This technique allows differentiation between new product development practices that succeed and those that fail (Maidique and Zirger, 1984).
New product screening models have been developed by comparing successful and unsuccessful new products (de Brentani, 1986). The need to develop products differently, depending on the type of product (old or new), has been examined successfully via a comparative study of US and UK manufacturing firms (Johne and Snelson, 1988; 1989). The approach has also been successfully applied as Parkinson (1981) used it for comparing new product development in British and German machine tool manufacturers, as a discriminating function in a number of studies on new product success and failure. Examples are Phases I and II of Project SAPPHO (Rothwell, 1972; Rothwell et al., 1974, Rothwell, 1985) and Project NewProd Phases I and II (Cooper, 1979a; Cooper and Kleinschmidt, 1987a; 1987b; 1987c, Cooper and Kleinschmidt, 1990) can be considered as the ‘pillars’ for the other projects. Both studies focused on several industrial sectors. Although SAPPHO included information from several countries, it did not have enough data to perform international statistical comparisons. NewProd was local in nature because it only considered Canadian companies. Studies such as the
14

Stanford Innovation Project (Maidique and Zirger, 1984) were focused in just one industrial sector and in one particular country. Keys to New Product Success and Failure (Link, 1987) was local, focused on Australian companies. Other studies have also been carried out which focus on international comparative studies (Edgett et al., 1992, Dae Hoon et al., 1996, Buisson et al., 1997).
The comparison method has also been used with good results in a number of studies on new services. For example, Edgett and Parkinson (1994) used it for comparing new service development in British building societies that were registered and maintained active membership status in the Building Societies Association, Edgett (1994) used it for comparing new service development activities in British banks and building societies (building societies are similar to US savings and loans). In a study of new commercial service companies Cooper and de Brentani (1991) compared successful and unsuccessful services in a way similar to the methodology previously used by Cooper (Edgett and Parkinson, 1994, Ernst, 2002).
The success of the comparative methodology for tangible new product studies earlier and for new services later, indicated that this approach would be suitable and reliable for this study. A useful framework has been provided by these studies for similar work in a service setting, as each attempt has identified new product development characteristics that effectively discriminate between successful and unsuccessful new products (Edgett and Parkinson, 1994).
4 Survey Design
4.1 Population - Sample
Previous researchers have argued that it is both necessary and appropriate for further empirical studies in this subject area to explore a specific service industry rather than to take the traditional cross - sectional approach (Cowell, 1988, Easingwood, 1986). Therefore, only a single service economy sector comprised the resulting sample frame: Greek hotels, class A (4*) and class AA (5*). This is the population of the study. The definition of the sample is very important in order to ensure the validity of data collecting and the representative of the population. The target of the research is the largest sample according to the studies with related content which have been carried out in the past. These studies have been executed in the field of new product and service development and the size of sample taken into consideration could be summarized in Table 7:
Table 7. Typical Empiric Studies of New Service Development
Authors Nr Projects Nr CompaniesCooper and Kleinschmidt, 1993b 103 21Cooper and Kleinschmidt, 1993c 103 21Cooper and Kleinschmidt, 1995a, 1996 (*) 135Barczak, 1995 140 (*)Calantone and di Benedetto, 1988 189 (*)Calantone et al., 1997 142 (*)De Brentani, 1989 279 (*)Dwyer and Mellor, 1991a 95 (*)Dwyer and Mellor, 1991b 114 (*)Edgett (1994) 118 67Edgett & Parkinson (1994) 148 88Kotzbauer, 1992 120 (*)Maidique and Zirger, 1984 158 (*)Rothwell et al., 1974 86 (*)Rubenstein et al., 1976 103 (*)Schmalen and Wiedemann, 1999 40 (*)
15
Souder et al., 1997 150 (*)Utterback et al., 1976 117 (*)
(*)Is not reported this element
Source : Ernst , (2002)
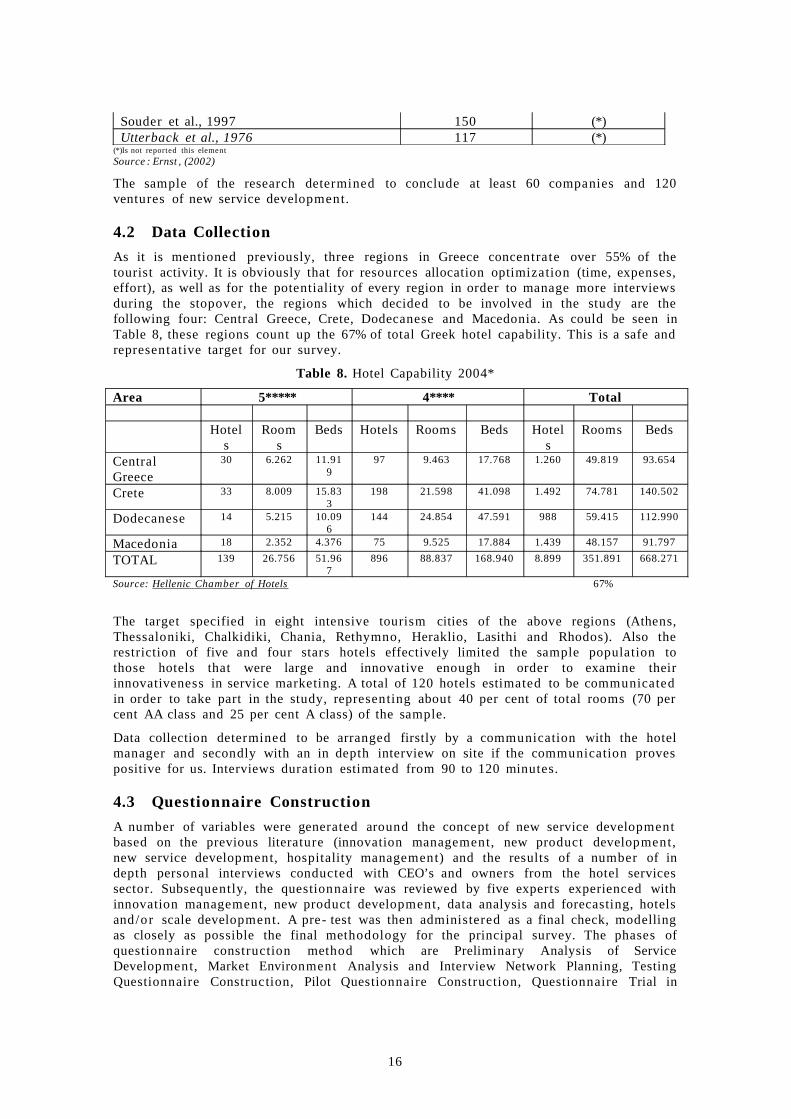
The sample of the research determined to conclude at least 60 companies and 120 ventures of new service development.
4.2 Data Collection
As it is mentioned previously, three regions in Greece concentrate over 55% of the tourist activity. It is obviously that for resources allocation optimization (time, expenses, effort), as well as for the potentiality of every region in order to manage more interviews during the stopover, the regions which decided to be involved in the study are the following four: Central Greece, Crete, Dodecanese and Macedonia. As could be seen in Table 8, these regions count up the 67% of total Greek hotel capability. This is a safe and representative target for our survey.
Table 8. Hotel Capability 2004*
Area 5***** 4**** Total
Hotels
Rooms
Beds Hotels Rooms Beds Hotels
Rooms Beds
Central Greece
30 6.262 11.919
97 9.463 17.768 1.260 49.819 93.654
Crete 33 8.009 15.833
198 21.598 41.098 1.492 74.781 140.502
Dodecanese 14 5.215 10.096
144 24.854 47.591 988 59.415 112.990
Macedonia 18 2.352 4.376 75 9.525 17.884 1.439 48.157 91.797
TOTAL 139 26.756 51.967
896 88.837 168.940 8.899 351.891 668.271
Source: Hellenic Chamber of Hotels 67%
The target specified in eight intensive tourism cities of the above regions (Athens, Thessaloniki, Chalkidiki, Chania, Rethymno, Heraklio, Lasithi and Rhodos). Also the restriction of five and four stars hotels effectively limited the sample population to those hotels that were large and innovative enough in order to examine their innovativeness in service marketing. A total of 120 hotels estimated to be communicated in order to take part in the study, representing about 40 per cent of total rooms (70 per cent AA class and 25 per cent A class) of the sample.
Data collection determined to be arranged firstly by a communication with the hotel manager and secondly with an in depth interview on site if the communication proves positive for us. Interviews duration estimated from 90 to 120 minutes.
4.3 Questionnaire Construction
A number of variables were generated around the concept of new service development based on the previous literature (innovation management, new product development, new service development, hospitality management) and the results of a number of in depth personal interviews conducted with CEO’s and owners from the hotel services sector. Subsequently, the questionnaire was reviewed by five experts experienced with innovation management, new product development, data analysis and forecasting, hotels and/or scale development. A pre- test was then administered as a final check, modelling as closely as possible the final methodology for the principal survey. The phases of questionnaire construction method which are Preliminary Analysis of Service Development, Market Environment Analysis and Interview Network Planning, Testing Questionnaire Construction, Pilot Questionnaire Construction, Questionnaire Trial in
16

Real Time, Final Questionnaire Construction and Interviews Conducting, could be seen in Figure 2.
Preliminary Analysis of Service DevelopmentBibliography Research
New Product DevelopmentNew Product Development in the Service SectorNew Product Development in the Hotel Sector
Draft Questionnaire ShapingPersonal Interviews - Questionnaire Filled Out
(random sample - 3 executives interviews)
Criteria Identification in New Service Development
Market Environment Analysis &Intrview Network Planning
Testing Questionnaire Construction(6 interviews 3 academic experts, 3 hotel owners- executives)
According to Market Environment Analysis
Process development requirements and data analysis techniques a questionnaire isshaped in order to be filled out by the appropriate sample of executives that will be
defined later
Pilot Questionnaire Construction
Questionnaire Trial in Real Time(7 pilot interviews)
Final Questionnaire Construction
Interviews Conducting
Figure 2. Questionnaire Construction Method (Kitsios, 1996; DSSLab, 1991)
To identify the determinants of success or failure for a new service, 126 variables were developed and tested in nine categories (Figure 3.). First, respondents will be asked to select and refer to one successful new product. Then, they will be asked to indicate the level of quality of performance with the way each of the 126 variables reflected the events that occurred during development of the successful new product.
This process will be repeated for a new product that the respondent considered to have been a failure for the firm. Success and failure will be defined by each respondent in terms of their own company’s interpretation of whether or not the new service meets their success criteria. Each set of the 126 variables will be measured using a five- point Likert - type point scale anchored at each end with “percentage of 0% - not done” (1) and “100% - completely done” (5). This approach produced a more reliable rating than continuous scales (Churchill, 1987). Although a more reliable measurement would be seven point scales (Churchill and Peter, 1984), in the pilot phase of the questionnaire construction, hotel managers seem to succeed in five- point Likert - type better.
. Company ProfileΑ
C. Description of New Service Offered
D. Idea Generation Sources
. Activities for the New Service DevelopmentΕ
F. Organization
G. Resource Allocation
. Market PotentialityΗ
I. Market Synergy
(Dependent Variable)
(IndependentVariables)
RelationsExamination
. New Services GenerallyΒ
Figure 3. Process Analysis
17
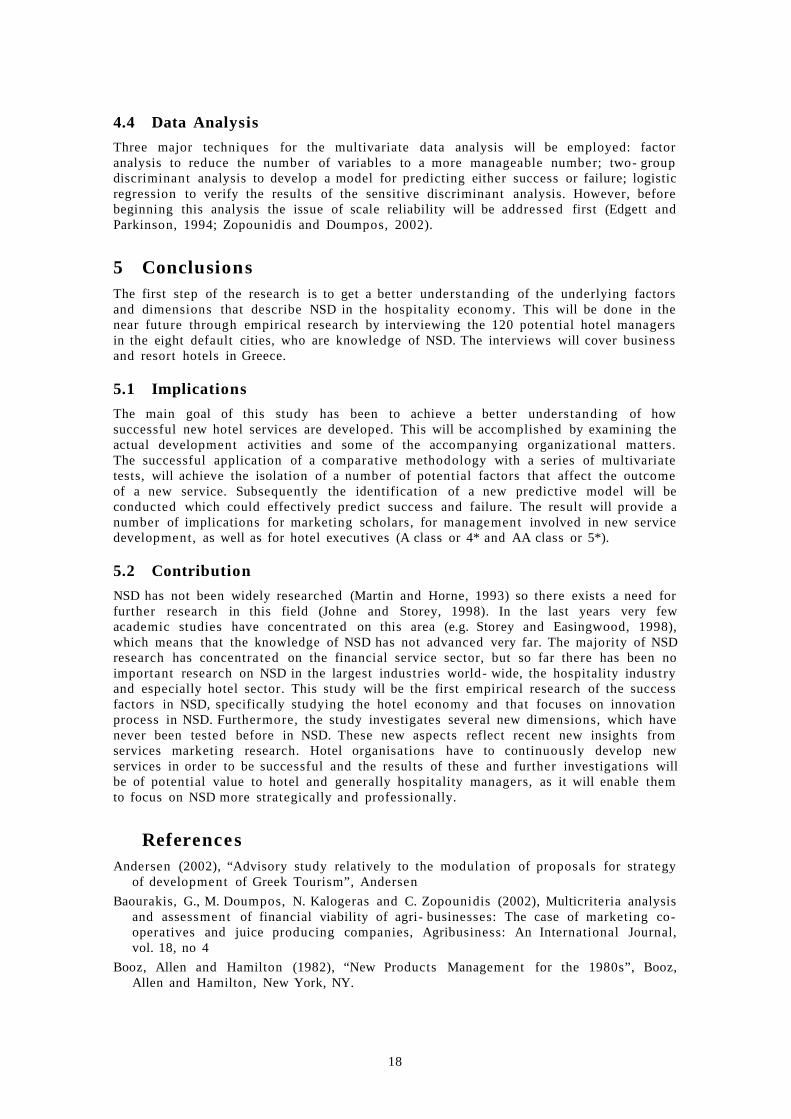
4.4 Data Analysis
Three major techniques for the multivariate data analysis will be employed: factor analysis to reduce the number of variables to a more manageable number; two- group discriminant analysis to develop a model for predicting either success or failure; logistic regression to verify the results of the sensitive discriminant analysis. However, before beginning this analysis the issue of scale reliability will be addressed first (Edgett and Parkinson, 1994; Zopounidis and Doumpos, 2002).
5 ConclusionsThe first step of the research is to get a better understanding of the underlying factors and dimensions that describe NSD in the hospitality economy. This will be done in the near future through empirical research by interviewing the 120 potential hotel managers in the eight default cities, who are knowledge of NSD. The interviews will cover business and resort hotels in Greece.
5.1 Implications
The main goal of this study has been to achieve a better understanding of how successful new hotel services are developed. This will be accomplished by examining the actual development activities and some of the accompanying organizational matters. The successful application of a comparative methodology with a series of multivariate tests, will achieve the isolation of a number of potential factors that affect the outcome of a new service. Subsequently the identification of a new predictive model will be conducted which could effectively predict success and failure. The result will provide a number of implications for marketing scholars, for management involved in new service development, as well as for hotel executives (A class or 4* and AA class or 5*).
5.2 Contribution
NSD has not been widely researched (Martin and Horne, 1993) so there exists a need for further research in this field (Johne and Storey, 1998). In the last years very few academic studies have concentrated on this area (e.g. Storey and Easingwood, 1998), which means that the knowledge of NSD has not advanced very far. The majority of NSD research has concentrated on the financial service sector, but so far there has been no important research on NSD in the largest industries world- wide, the hospitality industry and especially hotel sector. This study will be the first empirical research of the success factors in NSD, specifically studying the hotel economy and that focuses on innovation process in NSD. Furthermore, the study investigates several new dimensions, which have never been tested before in NSD. These new aspects reflect recent new insights from services marketing research. Hotel organisations have to continuously develop new services in order to be successful and the results of these and further investigations will be of potential value to hotel and generally hospitality managers, as it will enable them to focus on NSD more strategically and professionally.
ReferencesAndersen (2002), “Advisory study relatively to the modulation of proposals for strategy
of development of Greek Tourism”, Andersen
Baourakis, G., M. Doumpos, N. Kalogeras and C. Zopounidis (2002), Multicriteria analysis and assessment of financial viability of agri- businesses: The case of marketing co-operatives and juice producing companies, Agribusiness: An International Journal, vol. 18, no 4
Booz, Allen and Hamilton (1982), “New Products Management for the 1980s”, Booz, Allen and Hamilton, New York, NY.
18
Buisson, D., Garrett, T., Souder, W.E., 1997. Success through customer - driven new product development: a comparison of US and New Zealand small entrepreneurial high technology firms. Journal of Product Innovation Management 14, 459–472.
Churchill, G. and Peter, P., (1984), “Research Design Effects on the Reliability of Rating Scales: A Meta- analysis”, Journal of Marketing Research, Vol. 21 No. 4, pp. 360- 75.
Churchill, G., (1987), “Marketing Research: Methodological Foundations”, Holt, Rinehart and Winston, New York, NY.
Congram, C. & Epelman, M. (1994): How to describe your service. An invitation to the structured analysis and design technique, International Journal of Service Industry Management, Vol. 6, Nr. 2, pp. 6 - 23
Cooper, R.G. and de Brentani, U., (1991), “New industrial financial services: what distinguishes winners”, Journal of Product Innovation Management, Vol. 8 No. 2, pp. 75- 90.
Cooper, R.G. and Kleinschmidt, E.J., (1987a), “New products: what separates winners from losers”, Journal of Product Innovation Management, 4, pp. 169–184.
Cooper, R.G. and Kleinschmidt, E.J., (1987b), “Success factors in product innovation”, Industrial Marketing Management, 16, pp. 215–223.
Cooper, R.G. and Kleinschmidt, E.J., (1987c), “What makes a new product a winner: success factors at the project level”, R&D Management, 17, pp. 75–189.
Cooper, R.G. and Kleinschmidt, E.J., (1993), “Uncovering the keys to new product success”, Engineering Management Review, 11, pp. 5–18.
Cooper, R.G., (1979), “Identifying Industrial New Product Success: Project NewProd”, Industrial Marketing Management 8, pp. 136- 144.
Cooper, R.G., (1979), “The dimensions of industrial new product success and failure”, Journal of Marketing, Vol. 43, pp. 93- 103.
Cooper, R.G., (1998), “Benchmarking New Product Performance: Results of the Best Practices Study”, European Management Journal, Vol. 16, No 1, pp. 1–17.
Cooper, R.G., (1998), “Product Leadership: Creating and Launching Superior New Products,” New York: Perseus Books.
Cooper, R.G., Kleinschmidt, E.J., (1990), “New Products, the Key Factors in Success”, American Marketing Association, Chicago, IL.
Cooper, R.G., Kleinschmidt, Elko J., (1991), “New product process at leading industrial firms”, Industrial Marketing Management 10(2): pp. 137- 147, May.
Cowell, D.W., (1988), “New service development”, Journal of Marketing Management, Vol. 3 No. 3, pp. 313- 27.
Crawford, C.M., (1987), “New Products Management”, Irwin, Homewood, Ill.
Crawford, C.M., (1987), “New Products Management”, Irwin, Homewood, Ill.
Dae Hoon, L., Dongwook, K., Mishra, S., (1996), “Factors affecting new product success: cross - country comparisons”, Journal of Product Innovation Management 13, 530–550.
de Brentani, U. (1986), “Do Firms Need a Custom- designed New Product Screening Model?”, Journal of Product Innovation Management, Vol. 3, pp. 108- 19.
de Brentani, U. “An empirical analysis of the effect of product innovativeness on success and failure of new industrial services.” Conference Proceedings: ANZMAC 1999, University of New South Wales, Sydney, November /December (1999).
de Brentani, U., (1989), “Success and failure in new industrial services”, Journal of Product Innovation Management, Vol. 6, pp. 239- 58.
de Brentani, U., (2001), “Innovative versus incremental new business services: Different keys for achieving success”, Journal of Product Innovation Management 18, pp. 169–187.
Decision Support Laboratory (1991), “Cretan industry products market Survey”,
19

Technical University of Crete
Duerr, M.G., (1986), “The Commercial Development of New Products”, Conference Board, New York.
Dunning, J.H.,and McQueen, M.,(1982) "Multinational Corporations in the International Hotel Industry", in Annals of Tourism Research, Vol 4, March- April, pp. 69- 90.
Easingwood, C.J., (1986), “New product development for service companies”, Journal of Product Innovation Management, Vol. 3 No. 4, pp. 264- 75.
Edgett, S., (1994), “The traits of successful new service development”, Journal of Services Marketing, Vol. 8 No. 3, pp. 40- 49.
Edgett, S., J. & Parkinson, S. (1994): The Development of New Financial Services. Identifying Determinants of Success and Failure, International Journal of Service Industry Management, Vol. 5, No. 4, pp. 24 - 28
Edvardsson, B. (1995): Tjänsteutveckling med inbyggd kvalitet - manuscript, CTF, Centrum för tjänsteforskning, Högskolan i Karlstad, Karlstad
Edvardsson, B. (1996a): Tjänsteutveckling med inbyggd kvalitet, CTF, Centrum för tjänsteforskning, Högskolan i Karlstad, Forskningsrapport 96:9, Karlstad
Edvardsson, B. (1996b): Kvalitet och tjänsteutveckling, Lund, Studentlitteratur de Brentani, U., (1993), “The New Product Process in Financial Services: Strategy for Success”, International Journal of Bank Marketing, Vol. 11 No. 3, pp. 15- 22.
Edvardsson, B. and Olsson, J., (1996), “Key concepts in new service development”, Service Industries Journal, Vol. 16 No. 2, pp. 140- 64.
Ekholm, V. & Wrange, K. (1996): Towards a Multilevel Service Process Chart - Empirical findings from a pharmaceutical service, Swedish School of Economics and Business Administration, Working papers, Nr. 322
Engelbart, D., C. (1962): Augmenting Human Intellect: A Conceptual Framework, Summary report AFOSR- 3223 under contract AF49(638)- 1024, SRI Project 3578 for Air Force Office of Scientific Research, Stanford Research Instititute, Menlo Park, Ca.
Ernst, H., (2002), “Success factors of new product development: a review of the empirical literature”, International Journal of Management Reviews, 4(1), pp. 1- 40.
Feltenstein, T., (1986), “New- Product Development in Food Service: A structured Approach” The Cornell H.R.A. Quarterly, November, pp. 63- 71.
Fitzsimmons, J., A. and Fitzsimmons, M., J., (2000), “New Service Development: Creating Memorable Experiences”, Sage Publications, Inc., London.
Gershuny, J.I. and Miles, I.D., (1983), “The New Service Economy”, F.Pinter, London.
Griffin, A., (1997), “PDMA Research on new product development practices: updating trends and benchmarking best practices,” Journal of Product Innovation Management 14, 6 429- 458.
Grönroos, C., (1990), “Service Management and Marketing: Managing the moment of truth in service competition”, Lexington Books, Massachusettes, Toronto.
Harvey M.C., (2000), “Croissance, emploi et productivité dans le secteur tertiaire: controverses théoriques et réalités suisses”, Fribourg, Switzerland.
International Labour Organization (2001) Human Resources Development, Employment and Globalisation in the Hotel, Catering and Tourism Sector, International Labour Office, Geneva.
Johne, A. and Snelson, P., (1988), “Marketing’s Role in Successful Product Development”, Journal of Marketing Management, Vol. 3 No. 3, pp. 256- 68.
Johne, A. and Snelson, P., (1988), “Success factors in product innovation: a selective review of the literature”, Journal of Product Innovation Management, Vol. 5 No. 2, pp. 114- 28.
Johne, A. and Snelson, P., (1989), “Product Development Approaches in Established Firms”, Industrial Marketing Management, Vol. 18, pp. 113- 24.
20

Johne, A. and Snelson, P., (1990), “Successful Product Development: Lessons from American and British Firms”, Blackwell, Oxford.
Johne, A. and Storey, C., (1998), “New service development: a review of the literature and annotated bibliography”, European Journal of Marketing, Vol. 32 No. 3/4, pp. 184-251.
Johne, A., (1996), “Succeeding at Product Development Involves More Than Avoiding Failure”, European Management Journal, Vol. 14, Nr. 2, pp. 176–180.
Johnson, C., (2002), “Locational strategies of international hotel corporations in eastern central Europe”, anecdotal Phd, Faculty of Economic and Social Sciences, University of Fribourg, Switzerland.
Jones, P., (1995), “Developing new products and services in flight catering”, International Journal of Contemporary Hospitality Management, Vol. 7 No. 2,3, pp. 24- 8.
Jones, P., (1996), “Managing Hospitality Innovation”, Cornell H.R.A. Quarterly, October, pp. 86–95.
Jones, P., Hudson, S. & Costis, P., (1997), “New Product Development in the UK Tour- Operating Industry”, Progress in Tourism and Hospitality Research, Vol. 3, pp. 283–294.
Kim, Hee- Woong & Kim, Young- Gul (2001): Rationalizing the Customer Service Process, Business Process Management Journal, Vol. 7
Kingman- Brundage, J. (1989): The ABC’s of Service System Blueprinting in M., J. Bitner & L., A. Crosby (Eds): Designing a Winning Service Strategy, Chicago, pp. 30 - 33
Kitsios, F., (1996), “Strategic Development of the Daily Regional Press”, 3rd Conference of Owners of Daily Regional Press Union, Mediterranean Agronomic Institute of Chania, September 1997, Chania
Knowles, T. & Ware- Lane, B. (1994): New Product Development in Food and Beverage Operations in Davis, B. & Lockwood, A.: Food & Beverage Management: A selection of readings, London
Kokko, T., (2005), “Offering Development in the Restaurant Sector - A Comparison between Customer Perceptions and Management Beliefs”, anecdotal PhD dissertation, Swedish School of Economics and Business Administration, Helsinki, Finland.
Komppula, R. & Boxberg, M. (2002): Matkailuyrityksen tuotekehitys, Edita, Helsinki
Kostecki, M., (1994), “Marketing Strategies for Services” Pergamon Press, Oxford, U.K.
Kotler et al. (1995), “Principles of Marketing for Hospitality”, Prentice Hall International, Englewood Cliffs, NJ, USA.
Link, P.L., (1987), “Keys to New Product Success and Failure”, Industrial Marketing Management 16, 109–118.
Maidique, M.O. and Zirger, B.J., (1984), “A study of success and failure in product innovation: the case of the U.S. electronics industry”, IEEE Transactions on Engineering Management, EM- 31, pp. 192–203.
Martin, C.R. and Horne, D.A., (1995), “Level of success inputs for service innovations in the same firm”, International Journal of Service Industry Management, Vol. 6 No. 4, pp. 40- 56.
Moore, W.L. & Pessemier, E.A., (1993), “Product Planning Management – Designing and Delivering Value”, McGraw- Hill, New York.
Myers, S. and Marquis, D. (1969), Successful Industrial Innovations, National Science Foundation, NSF 69- 17.
Norling, P. (1993): Tjänstekonstruktion, University of Stockholm/CTF, Stockholm
Organisation for Economic Cooperation and Development (OECD) (2000a), “Science, Technology and Industry”, The Service Economy, Business and Industry Policy Forum Series, OECD Paris.
Organisation for Economic Cooperation and Development (OECD) (2000b).
21

Organisation for Economic Cooperation and Development (OECD) (2001), “Statistics on International Trade in Services”, eurostat, 2001 edition, OECD, Paris and EU, Brussels.
Organisation for Economic Cooperation and Development (OECD), (1999), “Business and Industry Policy Forum on the Services Economy: Background Report”, OECD, Paris.
Parkinson, S. (1981), “Successful New Product Development – An International Comparative Study”, R and D Management, Vol. 11 No. 2, pp. 79- 85.
Poon, A., (1993), “Tourism, Technology and Competitive Strategies”, CAB International, Oxon, UK.
Rothwell, R., (1972), “Factors for Success in Industrial Innovations, in Project SAPPHO—A Comparative Stud)' of Success and Failure in Industrial Innovation”, University of Sussex, Science Policy Research Unit, Brighton, U.K.
Rothwell, R., (1985), “Project SAPPHO: a comparative study of success and failure on industrial innovation”, Information Age 7 (4), 215– 219.
Rothwell, R., Freeman, C., Horlsey, A., Jervis, V.T.P., Roberston, A.B. and Townsend, J., (1974), “SAPPHO updated – project SAPPHO phase II”, Research Policy, 3, pp. 258–291.
Scheuing, E.E. and Johnson, E.M., (1989), “A proposed model for new service development”, Journal of Services Marketing, Vol. 3 No. 2, pp. 25- 34.
SETE, (2002), “Greek Tourism 2010 - Strategy and Goals”, SETE
Shostack, G.L., (1981), “How to design a service”, European Journal of Marketing, Vol. 16 No. 1, pp. 49- 63.
Shostack, G.L., (1984), “Designing services that deliver”, Harvard Business Review, January- February, pp. 133- 9.
Shostack, G.L., (1987), “Service positioning through structural change”, Journal of Marketing, Vol. 51, January, pp. 34- 43.
Song, X.M. and Parry, M.E., (1997), “A cross - national comparative study of new product development processes: Japan and the United States”, Journal of Marketing, 61, pp. 1–18.
Tax, S.S., Stuart, I., (1997), “Designing and implementing new services”, Journal of Retailing 73 (1), pp. 105–134.
Urban, G.L. & Hauser, J.R., (1993), “Design and Marketing of New Products”, Prentice-Hall, London
Weiermair, K., (1995) “Structural Changes in the Tourism Industry and the Adaptation of Occupational and Vocational Training Systems: Problems and Prospects”, in The Tourist Review, 3/1995, AIEST, St. Gallen, Switzerland.
Wilhelmsson, M. & Edvardsson, B., (1994), “Utveckling av nya Tjänster – Referensram och fallstudier”, CTF, Centrum för tjänsteforskning, Forskningsrapport 94:18 (Samhällsvetenskap), Högskolan i Karlstad, Karlstad
World Tourism Organisation (2000), Tourism Vision 2020 - Vol: 1 - 6, WTO
World Tourism Organisation (2001), Compendium of Tourism Statistics - 2001 Edition, WTO
World Tourism Organisation, (1994), Tourism Market Trends: Europe, WTO, Madrid, Spain
World Tourism Organisation, (1999), Tourism:2020 Vision Executive Summary updated
World Tourism Organisation, (2000), Tourism Market Trends: Europe, WTO, Madrid, Spain
World Tourism Organisation, (2001), Compendium of Tourism Statistics, WTO, Madrid, Spain
World Tourism Organisation, (2002), Tourism Highlights 2001, Internet version:
World Tourism Organisation, 1998), Tourism Market Trends: Europe, WTO, Madrid, Spain
22
World Travel & Tourism Council (2001), TSA Research Year 2001, WTTC
World Travel & Tourism Council (2001), TSA Research Year 2001, WTTC
World Travel and Tourism Council (1995) Agenda 21 for the Travel and Tourism Industry, (Published jointly with the World Tourism Organisation and the Earth Council), WTTC, London.
Wrange, K. (1997): Relationship Termination Intentions - A study of hotel customers, Unpublished Licentiate thesis manuscript, Center for Relationship marketing and Service Management, Swedish School of Economics and Business Administration
Yoon, ., (2002), “Development of a Structural Model for Tourism DestinationΥ Competitiveness from Stakeholders’ Perspectives”, PhD, Virginia Polytechnic Institute and State University York
Zeithaml, V.I. & Bitner, M.J., (1996), Services Marketing, McGraw- Hill, New York.
Zeithaml, V.I. & Bitner, M.J., (2000), “Services Marketing: Integrating Customer Focus Across the Firm”, 2nd edition, McGraw- Hill Higher Education.
Zopounidis, C., and Doumpos, M., (2002), “Multicriteria classification and sorting methods: A literature review”, European Journal of Operational Research, vol. 138, no 2, 229- 246.
23