SERVICE LEVEL BENCHMARK IN URBAN TRANSPORT FOR …
82
SERVICE LEVEL BENCHMARK IN URBAN TRANSPORT FOR INDIAN CITIES VOLUME- I – BENCHMARKING MANUAL 1. Introduction to Benchmarking 2. Development of Key Performance Indicators 3. Approach, Methodology and Data Establishment Project Cities : Ahmedabad , Surat, Hubli-Dharwad, Mysore . Bhubeswar, kohima Submitted to Ministry of Urban Development, GOI Study Undertaken by CoE Urban Transport, CEPT University, Ahmedabad SeptemberFebruary, 2013
Transcript of SERVICE LEVEL BENCHMARK IN URBAN TRANSPORT FOR …

Preface 1
SERVICE LEVEL BENCHMARK IN URBAN
TRANSPORT FOR INDIAN CITIES
VOLUME- I – BENCHMARKING MANUAL 1. Introduction to Benchmarking
2. Development of Key Performance Indicators
3. Approach, Methodology and Data Establishment
Project Cities : Ahmedabad , Surat, Hubli-Dharwad,
Mysore . Bhubeswar, kohima
Submitted to Ministry of Urban Development, GOI
Study Undertaken by CoE Urban Transport,
CEPT University, Ahmedabad SeptemberFebruary, 2013

Foreword

Preface

i
Contents
1 Introduction ............................................................................................................................................................................................................................. 1
1.1 Objectives......................................................................................................................................................................................................................... 2
1.2 Study Approach ................................................................................................................................................................................................................ 2
1.3 Study Output .................................................................................................................................................................................................................... 2
1.4 Benefits of Benchmarking ................................................................................................................................................................................................ 3
2 Literature Review ..................................................................................................................................................................................................................... 4
2.1 Why cities must do benchmarking? ................................................................................................................................................................................. 4
2.2 How and what to benchmark? ......................................................................................................................................................................................... 4
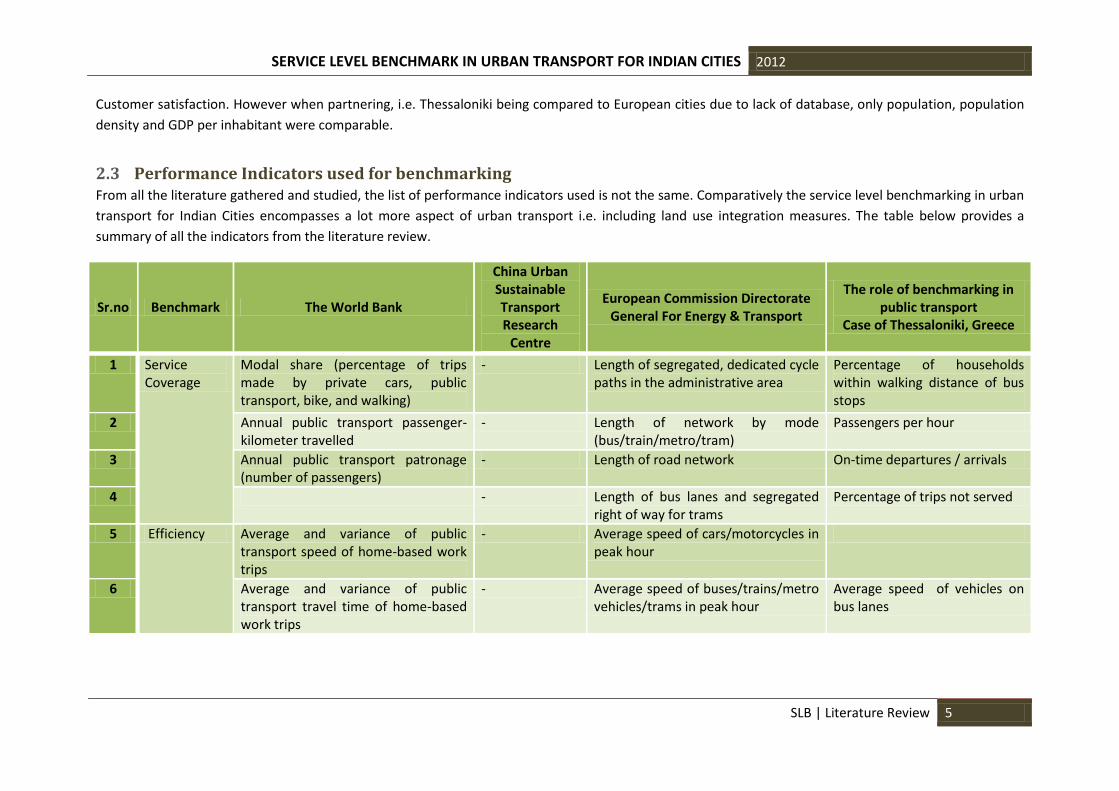
2.3 Performance Indicators used for benchmarking ............................................................................................................................................................. 5
2.4 Lessons from literature .................................................................................................................................................................................................. 10
3 Developing Key Performance Measures ................................................................................................................................................................................ 11
3.1 Public Transport (PT) Facilities ....................................................................................................................................................................................... 12
3.2 Pedestrian Infrastructure Facilities ................................................................................................................................................................................ 13
3.3 Non-Motorized Transport (NMT) Facilities .................................................................................................................................................................... 14
3.4 Level of usage of Intelligent Transport System (ITS) facilities ....................................................................................................................................... 14
3.5 Travel speed (Motorized and Mass transit) along major corridors ............................................................................................................................... 16
3.6 Availability of Parking Spaces ......................................................................................................................................................................................... 16
3.7 Road Safety .................................................................................................................................................................................................................... 17
3.8 Pollution levels ............................................................................................................................................................................................................... 18

SERVICE LEVEL BENCHMARK IN URBAN TRANSPORT FOR INDIAN CITIES 2012
ii
3.9 Integrated land use transport system ............................................................................................................................................................................ 18
3.10 Financial Sustainability of Public Transport ................................................................................................................................................................... 19
3.11 Additional / modified / “Revised SLB” focus areas ........................................................................................................................................................ 20
3.11.1 Addition of Focus Area - Intermediate Public transport ........................................................................................................................................ 20
3.11.2 Modification to focus area name- Travel speed (motorized and mass transit) along major corridors” to “Street infrastructure” ..................... 21
3.12 REVISED SLB FOCUS AREA .................................................................................................................................................................................................... 22
3.12.1 Public Transport (PT) Facilities ............................................................................................................................................................................... 22
3.12.2 Pedestrian Infrastructure Facilities ........................................................................................................................................................................ 26
3.12.3 Non-Motorized Transport (NMT) Facilities ............................................................................................................................................................ 27
3.12.4 Level of usage of Intelligent Transport System (ITS) facilities ............................................................................................................................... 27
3.12.5 Street Infrastructure .............................................................................................................................................................................................. 28
3.12.6 Availability of Parking Spaces ................................................................................................................................................................................. 31
3.12.7 Road Safety ............................................................................................................................................................................................................ 31
3.12.8 Pollution levels ....................................................................................................................................................................................................... 32
3.12.9 Integrated land use transport system .................................................................................................................................................................... 33
3.12.10 Financial Sustainability of Public Transport ....................................................................................................................................................... 34
3.12.11 Intermediate Public Transport (IPT) ................................................................................................................................................................... 34
4 Approach Data Collection and Methodology......................................................................................................................................................................... 36
4.1 Study Approach .............................................................................................................................................................................................................. 36
4.2 Study Area Delineation .................................................................................................................................................................................................. 36
4.3 Data Establishment ........................................................................................................................................................................................................ 39
4.3.1 Secondary Data ...................................................................................................................................................................................................... 39

SERVICE LEVEL BENCHMARK IN URBAN TRANSPORT FOR INDIAN CITIES 2012
iii
4.3.2 Primary Data .......................................................................................................................................................................................................... 42
4.3.3 Corridor selection for Road Network Inventory .................................................................................................................................................... 43
4.3.4 Methodology for primary survey ........................................................................................................................................................................... 50
5 Data Management ................................................................................................................................................................................................................. 56
5.1 Software Development .................................................................................................................................................................................................. 56
5.2 Importance ..................................................................................................................................................................................................................... 56
5.3 Benefits .......................................................................................................................................................................................................................... 56
5.4 System Requirements & Application ............................................................................................................................................................................. 57
6 Data Formats .......................................................................................................................................................................................................................... 58
6.1 Primary survey formats .................................................................................................................................................................................................. 58
6.1.1 Level of Comfort in Public Transport ..................................................................................................................................................................... 58
6.1.2 Road inventory survey ........................................................................................................................................................................................... 59
6.1.3 Speed Delay Survey (Private Vehicles) ................................................................................................................................................................... 60
6.1.4 Speed Delay Survey (Public Transport) .................................................................................................................................................................. 62
6.1.5 Land use Survey ..................................................................................................................................................................................................... 64
6.2 Secondary survey formats ............................................................................................................................................................................................. 65
Bibliography ................................................................................................................................................................................................................................... 72

SERVICE LEVEL BENCHMARK IN URBAN TRANSPORT FOR INDIAN CITIES 2012
iv
List of Maps
Map 4.2-1: Study area delineation ................................................................................................................................................................................................ 38
Map 4.3-1: Level 1 roads (Bhubaneswar) ...................................................................................................................................................................................... 45
Map 4.3-2: Road network classification - level 2 roads ................................................................................................................................................................. 46
Map 4.3-3: Level 1,2,3 roads (Bhubaneswar) ................................................................................................................................................................................ 47
Map 4.3-4: Level 1,2,3 & 4 roads (Bhubaneswar) .......................................................................................................................................................................... 48
Map 4.3-5: Selected road network for inventory survey ............................................................................................................................................................... 49
List of Tables Table 3.12-1: Population density as per categories of cities ......................................................................................................................................................... 23
Table 3.12-2: Constant for bus Headways ..................................................................................................................................................................................... 24
Table 3.12-3: Classification of street lighting ................................................................................................................................................................................. 30
Table 3.12-4: Lighting standards as per codes ............................................................................................................................................................................... 30
Table 3.12-5: Pollution levels ......................................................................................................................................................................................................... 32
Table 3.12-6: Population density as per categories of cities ......................................................................................................................................................... 33
Table 4.3-1: List of Secondary data to be collected ....................................................................................................................................................................... 40
Table 4.3-2: Constant for headways .............................................................................................................................................................................................. 42
Table 4.3-3: Classification of cities as per population ................................................................................................................................................................... 43
List of figures Figure 4.1-1: Study approach methodology .................................................................................................................................................................................. 36
Figure 4.3-1: Secondary data collection process ........................................................................................................................................................................... 40
Figure 4.3-2: NMV parking survey format ..................................................................................................................................................................................... 54

SERVICE LEVEL BENCHMARK IN URBAN TRANSPORT FOR INDIAN CITIES 2012
v
List of Abbreviations MoUD Ministry of Urban Development
IPT Intermediate Public Transport
CBD Central Business District
CDP City Development Plan
CEPT Center for Environmental Planning and Technology
FSI Floor Space Index
GIS Geographic information system
GPS Global positioning System
ITMS Information Technology Management System
ITS Intelligent Transportation System
PIS Passenger information system
SPV Special Purpose Vehicle
STU State Transport Undertaking
SPM Suspended Particulate Matter
RSPM Respirable Suspended Particulate Matter
SOX Sulphur Oxides

SERVICE LEVEL BENCHMARK IN URBAN TRANSPORT FOR INDIAN CITIES 2012
vi
NOX Nitrogen Oxide
UBS Urban Bus Specification
CNG Compressed Natural Gas
UBS Urban Bus Specification
IUT Institute of Urban Transport
SLB Service Level Benchmarking
LOS Level Of Service
NO2 Nitrogen Dioxide
SO2 Sulfur Dioxide
VOC Volatile Organic Compound
NMT Non-Motorized Transport
PT Public Transport
LED Light Emitting Diode
JnNURM Jawaharlal Nehru National Urban Renewal Mission
ECS Equivalent Car Space
CPCB Central Pollution Control Board
RTO Regional Transport Office

SERVICE LEVEL BENCHMARK IN URBAN TRANSPORT FOR INDIAN CITIES 2012
vii
CCTV Closed Circuit Television
SMC Surat Municipal Corporation
SUDA Surat Urban Development Authority
DCR Development Control Regulation
BRTS Bus Rapid Transport System
IRC Indian Roads Congress
DP Development Plan

SERVICE LEVEL BENCHMARK IN URBAN TRANSPORT FOR INDIAN CITIES 2012
SLB| Introduction 1
1 Introduction
Measuring performance of different transport facilities is necessary to
identify gaps and problems in service levels. Performance levels can be
evaluated using various indicators that can help in establishing baselines,
identifying trends, predicting problems, assessing options and setting
performance targets. Benchmarking - comparing performance levels
against set targets or best practice cases - has now been recognized as
integral to ensuring accountability in service delivery with the Ministry of
Urban Development (MoUD), Government of India announcing “Service
Level Benchmarking” for Urban Transport.
The service level benchmarks essentially focus on performance (as
outlined in the Service level benchmarks developed by MoUD) and these
can be augmented by considering aspects as outlined primarily by
National Mission for Sustainable Habitat (Urban planning and
Transportation) and proposals 12th Five year plan.
Benchmarks could also be in relation to national/international best
practices, but as outlined above, the tools and processes vary with
country/ cities and one of the outcomes of this exercise would be to set
national benchmarks linked to appropriate standards. In case of Urban
Transport Benchmarking, the target group involves a wide range of
organizations such as the municipalities, regional authorities, public
transport operators, and other urban transport stakeholders.
The objective of this research is to develop operational guidelines for
undertaking benchmarking using MoUD’s Service Level Benchmarks. This
study is conducted to help in standardization of procedures for
benchmarking to arrive at performance level indicators including
methodology of delineating urban area as well as outlining methodology
for data collection, storage, and analysis to enable continuous updating.
The outcome of the study will be helpful in developing a toolkit standard
procedures/ processes for carrying out benchmarking for transport in
urban areas which cities would then be able to replicate the process of
implementing the SLB. The benchmarks and indicators will also be
validated through actual data collection and research on ground. This is
to establish weightage, significance, ease and consistency of
measurability of each indicator. MoUD has appointed IUT and CEPT
University to undertake this research in twelve cities in India. Of these
Delhi, Vijaywada, Nanded, Patna, Jaipur and Jammu which will be taken
up by IUT and CEPT University will be undertaking the study for
Ahmedabad, Surat, Hubli-Dharwad, Mysore, Bhubaneswar and Kohima.

SERVICE LEVEL BENCHMARK IN URBAN TRANSPORT FOR INDIAN CITIES 2012
SLB| Introduction 2
1.1 Objectives The objectives of this research are to:
To develop operational guidelines for undertaking
benchmarking using the MoUD’s SLBs,
To outline a systematic approach for data collection, analysis
and storage for regular data update of the data collected
Suggest additional measures that can be adopted in line with
National Mission for Sustainable Habitat (Transportation and
Urban Planning) and 12thFive year plan
1.2 Study Approach The research will follow a four step approach as detailed below:
1. Delineation of the study area
The study area would not just be limited to the municipal
boundary but be defined such that it includes the urban
agglomeration area. It would include the urban area along
with contiguous growth/sprawl area outside the municipal
limits.
2. Development of baseline study for performance monitoring of
urban transport indicators with respect to developed SLB
standards.
Review MOUD service level benchmarks and indicators
Identify data requirements and sources for data collection
(primary and secondary)
Develop an understanding of the existing transportation
system for each case study city from secondary data sources
– network, traffic volume, etc.
Data collection
3. Preparation of a toolkit of standard procedures/processes for
carrying out Benchmarking of transport in urban areas. On the
basis of benchmarking undertaken for the case study cities, a
standardized set of operational guidelines would be developed
which can be used for undertaking benchmarking in other cities.
4. Establishment of a routine monitoring plan for SLBs
1.3 Study Output One of the main outputs of the study is to standardize the procedure of
benchmarking the urban transport facilities in Indian Cities. For this, it
includes defining the methodology for data collection and data analysis.
In addition to the given Indicators, more Indicators are added and
proposed for the study.
Primary Survey
• Identify survey locations, sampling, data collection methods
Secondary data
• Data analysis, interpretation, aggregation at city level for ascertaining
• the LOS for the benchmarks

SERVICE LEVEL BENCHMARK IN URBAN TRANSPORT FOR INDIAN CITIES 2012
SLB| Introduction 3
1.4 Benefits of Benchmarking The benefits of benchmarking can be perceived in two folds;
1. Direct Benefits of the study are-
It will provide a platform to discuss and debate transport
issues at local level
It will lead to creation for city level database on transport
which will help set targets for plan formulation
2. Indirect Benefits perceived form these studies are-
Help in promoting National Urban Transport Policy
It will also help in creating a competitive environment within
and between cities.

SERVICE LEVEL BENCHMARK IN URBAN TRANSPORT FOR INDIAN CITIES 2012
SLB | Literature Review 4
2 Literature Review
This chapter deals with literature review and understanding the
importance of benchmarking for cities
2.1 Why cities must do benchmarking?
Benchmarking is the process of measuring the performances of various
elements of urban transport against a set standard or target. It provides
policymakers with tools to continuously seek enhanced performance for
their urban transport (Henning, et al., 2011).It is also an intrinsic part of
the transport policy process (Bärlund, 2000). “In a nutshell,
benchmarking is a multi-layer strategy to achieve greater effectiveness
and higher quality services and encourage change” (Wobbe, 2000).
Others define it as a tool to provide important reference for decision
makers, planners and operators to monitor and evaluate the
sustainability of urban transport at local, regional and national levels
(Hongyang, Yulin, Hu, & Suoxiang).
2.2 How and what to benchmark? The process of benchmarking has been conceived and carried out
differently by various cities, authorities and agencies. Nevertheless each
had their own issues and problems during the process which one also
needs to understand such as to be able to overcome the common issues
that is to come during the study. Benchmarking is no straight method
where one is expected to gather data, analyze, rank and produce some
quantitative results. Therefore it is important to understand the learning
from various resources before carrying out the study for Indian cities.
The pilot study conducted by The World Bank proposes a framework for
urban transport focusing on the performance of public transport in five
categories—uptake of public transport, travel efficiency, accessibility,
affordability, and quality of travel experience (Henning, et al., 2011). One
of the important points emphasized in the study is that despite the
performance measures indication for a city, one has to contextualize
because each city would differ in its socio-economic, demography and
physical aspects. With this, contextual indicators have also been included
in the study such as area, population, income level, public transport
length etc. The study also recommends 5-stage process for benchmarking
i.e. initiating, planning, information gathering, analysis, and
implementation for impact.
A research paper for benchmarking in China proposes 10 benchmarks
that focus around economy, urbanization, motorization, public transport,
rail transit, modal split, travel behavior, affordability, energy
consumption, and traffic safety. However in this study the benchmarks
for China have been compared to other international cities.
In a paper for Thessaloniki, the process of benchmarking is categorized
into four stages - self-analysis, partnering, learning and implementation.
Self-analysis deals with the performance measures and selection of the
performance topics. Partnering is to find similar agencies to compare
with. Learning Stages include the best practices and comparative analysis.
And the last stage of the process is the action plans to fill in the
performance gaps. Some of the performance indicators proposed are
focus around the areas of spatial availability, temporal availability,
capacity, reliability, Availability, fare structure and policy, travel time and
SERVICE LEVEL BENCHMARK IN URBAN TRANSPORT FOR INDIAN CITIES 2012
SLB | Literature Review 5
Customer satisfaction. However when partnering, i.e. Thessaloniki being compared to European cities due to lack of database, only population, population
density and GDP per inhabitant were comparable.
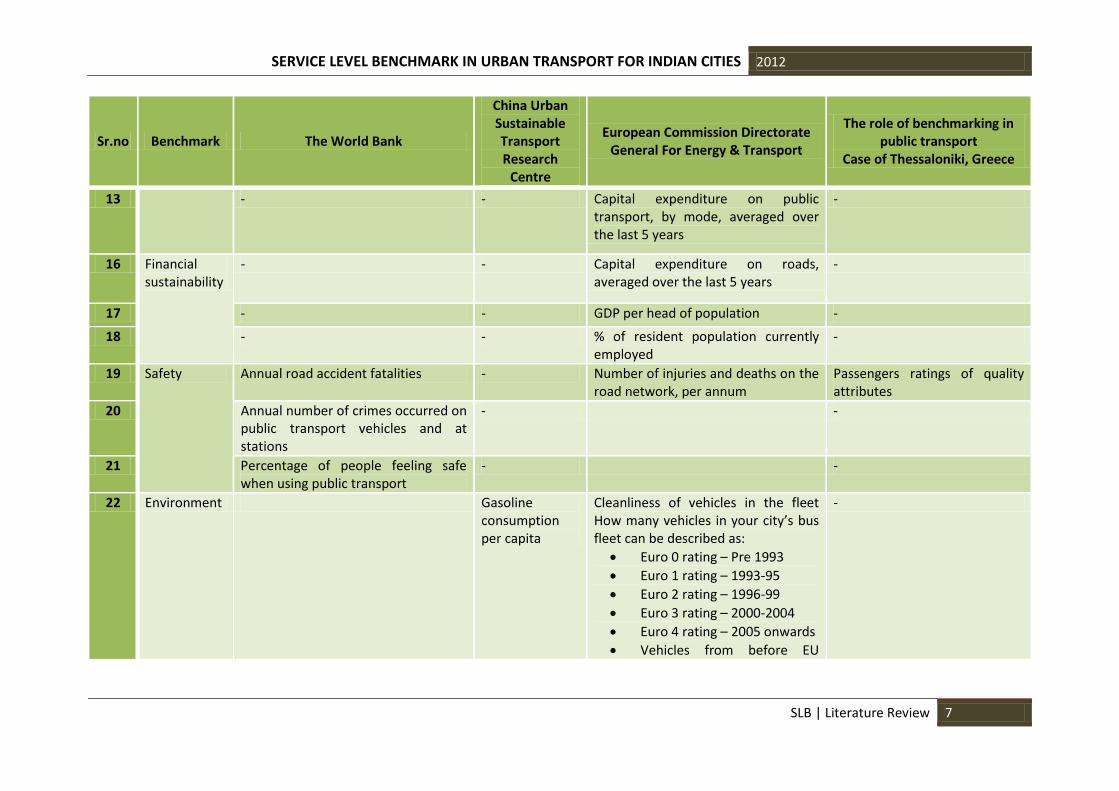
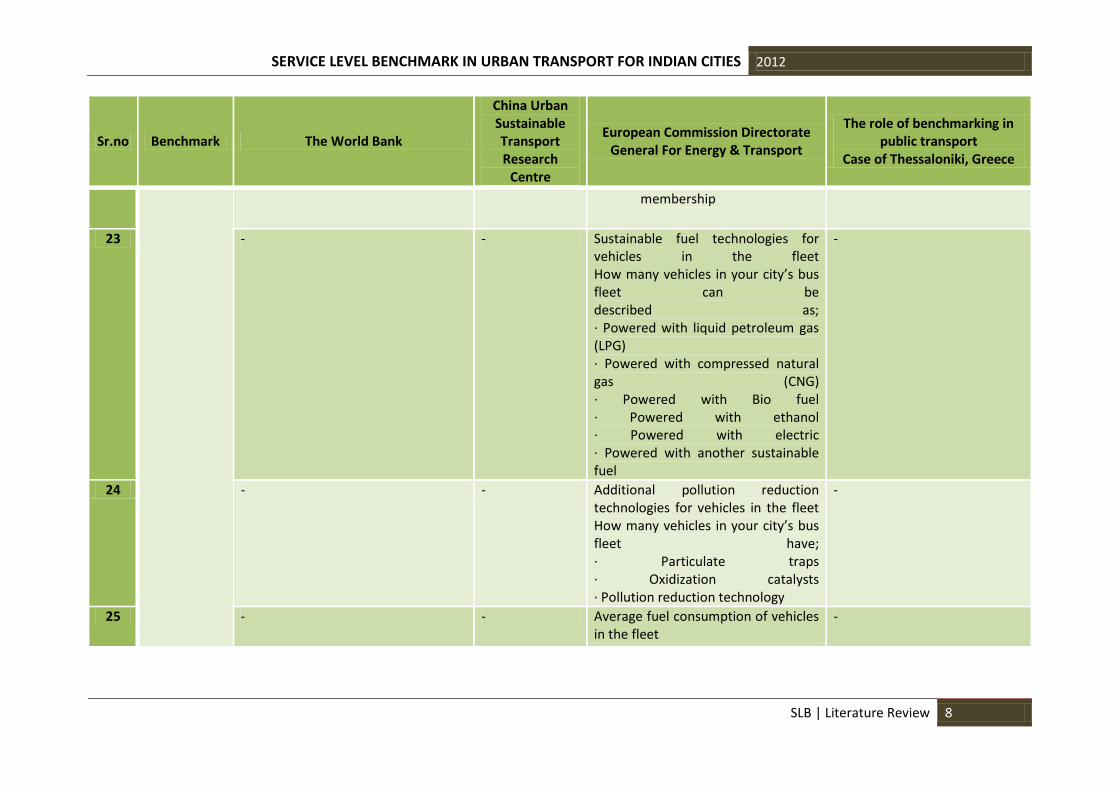
2.3 Performance Indicators used for benchmarking From all the literature gathered and studied, the list of performance indicators used is not the same. Comparatively the service level benchmarking in urban
transport for Indian Cities encompasses a lot more aspect of urban transport i.e. including land use integration measures. The table below provides a
summary of all the indicators from the literature review.
Sr.no Benchmark The World Bank
China Urban Sustainable Transport Research
Centre
European Commission Directorate General For Energy & Transport
The role of benchmarking in public transport
Case of Thessaloniki, Greece
1 Service Coverage
Modal share (percentage of trips made by private cars, public transport, bike, and walking)
- Length of segregated, dedicated cycle paths in the administrative area
Percentage of households within walking distance of bus stops
2 Annual public transport passenger-kilometer travelled
- Length of network by mode (bus/train/metro/tram)
Passengers per hour
3 Annual public transport patronage (number of passengers)
- Length of road network On-time departures / arrivals
4 - Length of bus lanes and segregated right of way for trams
Percentage of trips not served
5 Efficiency Average and variance of public transport speed of home-based work trips
- Average speed of cars/motorcycles in peak hour
6 Average and variance of public transport travel time of home-based work trips
- Average speed of buses/trains/metro vehicles/trams in peak hour
Average speed of vehicles on bus lanes

SERVICE LEVEL BENCHMARK IN URBAN TRANSPORT FOR INDIAN CITIES 2012
SLB | Literature Review 6
Sr.no Benchmark The World Bank
China Urban Sustainable Transport Research
Centre
European Commission Directorate General For Energy & Transport
The role of benchmarking in public transport
Case of Thessaloniki, Greece
7 Public transport departure and arrival time reliability, and vehicle fuel consumption.
- Typical service intervals of buses/trains/metro vehicles/trams in peak hour
8 - - Total number of daily one-way journeys by mode in the administrative area
9 - - Average vehicle occupancy by mode (car/bus/train/metro/tram) in peak hour
10 Accessibility Distance and/or walking time from public transport stops to outer rim of patron dwellings (i.e., catchment areas).
- Number of cars registered in the administrative area
PT vehicles per hour
- - Number of vehicles (by mode) operating in the administrative area
-
- - % of public transport vehicles with low floors, by mode
-
11 Affordability Average cost of home-based work trips.
Monthly expenditures on travel for both urban and rural areas
Average cost to user of car use Price structure
12 - - Average cost to user of public transport by mode
-
SERVICE LEVEL BENCHMARK IN URBAN TRANSPORT FOR INDIAN CITIES 2012
SLB | Literature Review 7
Sr.no Benchmark The World Bank
China Urban Sustainable Transport Research
Centre
European Commission Directorate General For Energy & Transport
The role of benchmarking in public transport
Case of Thessaloniki, Greece
13 - - Capital expenditure on public transport, by mode, averaged over the last 5 years
-
16 Financial sustainability
- - Capital expenditure on roads, averaged over the last 5 years
-
17 - - GDP per head of population -
18 - - % of resident population currently employed
-
19 Safety Annual road accident fatalities - Number of injuries and deaths on the road network, per annum
Passengers ratings of quality attributes
20 Annual number of crimes occurred on public transport vehicles and at stations
- -
21 Percentage of people feeling safe when using public transport
- -
22 Environment Gasoline consumption per capita
Cleanliness of vehicles in the fleet How many vehicles in your city’s bus fleet can be described as:
Euro 0 rating – Pre 1993
Euro 1 rating – 1993-95
Euro 2 rating – 1996-99
Euro 3 rating – 2000-2004
Euro 4 rating – 2005 onwards
Vehicles from before EU
-
SERVICE LEVEL BENCHMARK IN URBAN TRANSPORT FOR INDIAN CITIES 2012
SLB | Literature Review 8
Sr.no Benchmark The World Bank
China Urban Sustainable Transport Research
Centre
European Commission Directorate General For Energy & Transport
The role of benchmarking in public transport
Case of Thessaloniki, Greece
membership
23 - - Sustainable fuel technologies for vehicles in the fleet How many vehicles in your city’s bus fleet can be described as; · Powered with liquid petroleum gas (LPG) · Powered with compressed natural gas (CNG) · Powered with Bio fuel · Powered with ethanol · Powered with electric · Powered with another sustainable fuel
-
24 - - Additional pollution reduction technologies for vehicles in the fleet How many vehicles in your city’s bus fleet have; · Particulate traps · Oxidization catalysts · Pollution reduction technology
-
25 - - Average fuel consumption of vehicles in the fleet
-

SERVICE LEVEL BENCHMARK IN URBAN TRANSPORT FOR INDIAN CITIES 2012
SLB | Literature Review 9
Sr.no Benchmark The World Bank
China Urban Sustainable Transport Research
Centre
European Commission Directorate General For Energy & Transport
The role of benchmarking in public transport
Case of Thessaloniki, Greece
26 - - Age of the vehicles in the fleet -
27 - - Air quality by pollutant (NO2, SO2, NOx, VOC, particulates) per annum
-

SERVICE LEVEL BENCHMARK IN URBAN TRANSPORT FOR INDIAN CITIES 2012
SLB | Literature Review 10
2.4 Lessons from literature
It is evident from the literature study that there were issues during the
process of benchmarking which needs to be highlighted. Following are
some of the issues defined in several of the studies:-
1. Definition problem: defining the boundary for carrying out the
study. When more than one jurisdiction is included in the study,
data collection becomes more difficult.
2. Data unavailability
3. Benchmarking urban transport initiatives may also face lack of
support, lack of capacity etc.
Apart from the issues, there are also few important points that can be
noted from the literature:-
While it would not be correct to determine one’s position from the
results of the benchmarks with peer group cities. However it is
considered that one of the success factors is to cooperate with the peer
groups who have already exercised this process. This would help
especially the newcomers.
One thing that still remains unclear is the methodology adopted for most
of the indicators in these literatures. There is also no clarity regarding
setting of targets for each of these performance indicators. In other
words, there are no ‘levels’ defined instead cities are ranked against each
other thereby lacking a clarity over if one city is performing good
compared to the rest then what should be the target for the other cities.
For example: what percentage of service coverage area would one say is
good enough for a city? if a city has a 20% of coverage area then is it
supposed to be good or how far it is from achieving 100%? Nevertheless
there are many factors that determine the network coverage however
keeping all of these factors it is more easily read and comprehendible
when a city is tagged a ‘level’ for its performance in a focus area. With
this also, it becomes easier to set measureable targets.
The benchmarking process as we look at various documents and
literature have been exercised differently even as we compare it with the
service level benchmarking in urban transport developed for Indian Cities.
It is difficult to judge upon which the right method of doing it or even
which indicator is more appropriate. But what one needs to understand is
to select and develop those performance indicators that fit the context of
Indian cities. As such indicators and benchmark focus areas should be one
that is comprehensive, comparable, and easy to understand and those for
which one can establish achievable targets. Citing all of these in the
following chapters the benchmarks have been discussed with definitions
for all the indicators and terms. It also discusses the additional indicators,
modification in the methodology of indicators and suggested change in
the level of service.

SERVICE LEVEL BENCHMARK IN URBAN TRANSPORT FOR INDIAN CITIES 2012
SLB | Developing Key Performance Measures 11
Public Transport Facilities Pedestrian Infrastructure facilities Non-Motorized Transport (NMT)
facilities
Level of Usage of Intelligent Transport
(ITS) facilities
Travel speed (Motorized and Mass
transit) along major corridors Availability of Parking Spaces
Road Safety Integrated Land Use Transport System Financial Sustainability of Public
Transport by bus Pollution levels
3 Developing Key Performance Measures
This chapter discusses the benchmarks and indicators outlined and defined by MoUD’s Service level Benchmarking document. Service level performance
benchmarks have been identified for the following areas:

SERVICE LEVEL BENCHMARK IN URBAN TRANSPORT FOR INDIAN CITIES 2012
SLB | Developing Key Performance Measures 12
3.1 Public Transport (PT) Facilities
It is important to understand the meaning of the following terms:
Headway
Time interval between vehicles moving in the same direction on a particular route.
Service Coverage Area
The ratio between PT network length (PT having headways less than 60 minutes) to the study area.
Transit Accessible Area
The area covered within 500metre buffer of the PT routes having headways less than or equal to 60 minutes.
Average waiting time
It is the average time that passengers have to wait for a bus at a bus stop.
High frequency accessible area
The area covered within 500 metre buffer of stops/Terminals
having headways less than or equal to 10 minutes. This area particularly refers to developed area within 500 meter buffer of stops/Terminals.
Boarding
The number of Passengers entering the Public Transport Vehicle.
% Transit Ridership
The percentage of population in an urban area using or dependent on public transport as mode of travel.
Organized PT
It indicates the city-wide level of services provided by PT systems during peak hours. PT systems includes rail or organized bus based systems. Organized PT systems are characterized by - Fixed origins and destinations; Fixed routes and schedules; Fixed stoppage points; and Fixed fares.
Peak hours
The time of the day with highest ridership. The hours during morning and evening times of a day with highest number of commuters on road or in transit.
Availability of PT
Availability of PT refers to route possibilities, timings and frequency of organized PT services. It refers to bus stops having reasonable distance of approximately 500metres.
This Indicator measures the overall performance of public transport in the city. Key performance Indicators are mainly in the form of operational performances of the service providers.

SERVICE LEVEL BENCHMARK IN URBAN TRANSPORT FOR INDIAN CITIES 2012
SLB | Developing Key Performance Measures 13
This measure focuses on frequency of the buses, total number of buses
available to the population, % of road network length with PT plying with
respect to the total study area. It also include another important indicator
of service quality i.e. passengers per seated capacity. In most cities, public
transport carries a proportion of standing passengers and although this
makes efficient use of the vehicles, the passengers are at discomfort
therefore it becomes important not to allow crowding in public transport.
The indicators included in this benchmark are as follows:
3.2 Pedestrian Infrastructure Facilities
The terms to understand in the context of pedestrian infrastructure
facilities are as follows:
Footpath
Dedicated walkway reserved or build for free movements of pedestrians is referred as footpath, the minimum width of footpath should be 1.2 meters.
Encroachment
The space reserved for road, footpath and cycle tracks occupied by other activities like shops, hawkers, parking etc. In other words illegal occupied public space
NUTP encourages the allocation of ‘road space on more equitable basis
with people as its focus’. Therefore this Indicator defines the presence of
pedestrian facilities in the city. The provision of footpath segregated from
the mixed traffic and adequate lighting arrangement along the footpath
is essential not only for the safety of pedestrian but also as a means of
improving access to major public transport stations.
It is a trend in India, that people cross the road anytime and anywhere on
the road. For the concerns such as safety and smooth travel of people, it
is necessary to have separate signal phasing for the people to cross the
roads with ease and safely. Therefore, a city with priority signal for
pedestrian is important to highlight and showcase a good example. With
this, the availability of pedestrian phasing has been included as an
important indicator for our study. The indicators included in this
benchmark are as follows:
It indicates the percentage of road length along the arterial and major road network or Public Transport corridors and at intersection that has adequate barrier free pedestrian facilities
1. Presence of Organized Public Transport System in Urban Area (%) 2. Extent of Supply - Availability of Public Transport 3. Service Coverage of Public Transport in the city 4. Average waiting time for Public Transport users (min) 5. Level of Comfort in Public Transport (Crowding) 6. % fleet size as per urban bus specification

SERVICE LEVEL BENCHMARK IN URBAN TRANSPORT FOR INDIAN CITIES 2012
SLB | Developing Key Performance Measures 14
3.3 Non-Motorized Transport (NMT) Facilities
Travel diary of a person constitutes of trip chain and origin and
destination using different modes. Access and egress modes are
important in a trip chain. These points of interchanges between different
modes are important to assess and study. While the first mile and last
mile connectivity is often the non-motorized modes (Cycle and
Pedestrian), therefore providing proper segregated cycle lanes coupled
with safe bicycle parking places is not only important for the safety of
cyclist but also contribute towards increasing use of public transport.
Encroachment on bicycle lanes too affects the safety and optimum use by
the cyclist therefore strict enforcements needs to be addressed in the
city. The indicators included in this benchmark are as follows:
3.4 Level of usage of Intelligent Transport System
(ITS) facilities
Passenger Information System
Passenger information systems are the key communication link between transportation operators and the Traveling passengers. It provides accurate, current information on arrival and departure times and gates. Information the traveler needs to keep moving efficiently. The information is provided in the form of digital displays as well as through loud speakers installed at appropriate locations.
Global Positioning System (GPS)
The Global Positioning System (GPS) is a satellite-based navigation system that determines the user’s position and displays it on the unit’s electronic map. With the GPS installed in the vehicles, the
1. Signalized intersection delay 2. Street lighting (Lux) 3. % City covered
Indicates the percentage of dedicated cycle track / lane along the arterial & sub arterial road network or public transport corridors with a minimum of 2.5 m width.
It is characterized by continuous length, encroachment on NMT lanes, and parking facilities
All JnNURM cities to have NMT tracks on all major roads within a year
1. % of network covered 2. Encroachment on Cycle roads by vehicles parking (%) 3. NMT Parking facilities at Interchanges (%)
ITS refers to efforts to add information and communications technology to transport, infrastructure and vehicles in an effort to manage factors that typically are at odds with each other, such as vehicles, loads, and routes to improve safety and reduce vehicle wear, transportation times and fuel consumption.

SERVICE LEVEL BENCHMARK IN URBAN TRANSPORT FOR INDIAN CITIES 2012
SLB | Developing Key Performance Measures 15
operators can regulate bus movements, ensuring smoother running of services. In addition, information about when the bus will arrive is sent to some bus stops to alert passengers.
Integrated Ticketing System
Integrated ticketing may be understood as a single common ticket which can be used across all modes of public transport for a single trip. It helps in providing seamless interchange across the Public transport modes and also reduces the overall travel time as the users do not have to stand in queues each time they interchange to purchase the tickets. Aim is to have complete integration across all operators of same modes and across all modes and operators.
Signalized Intersection
To improve the traffic flow along the road networks, the signals along the corridor are inter-connected. The phasing of the signal at any specific intersection is in tune with the phasing of the intersection before and after it to provide a continuous green phase for the traffic stream. It helps in reducing congestion and stopping time at each intersection.
Traffic Surveillance System
Detection of movement of persons or vehicles for the purpose of security, incidence management and also to get real time information regarding pedestrian or vehicle flow.
Source: Service level benchmark in Urban Transport
The provision of road and other physical infrastructure is not the only
solution for a good transportation system but it is also essential to work
around the implementation of technology, specifically a network of
sensors and communication devices that collects and distributes the
information about smooth functioning of the transportation system.
Much of a good transportation system is about networks and these
networks are more about the information contained in it. For example;
whether a vehicle is drifting out of its lane, whether a roadway is
congested with traffic therefore whether it’s about choosing a different
route or mode shift, how to optimize traffic signals to avoid congestion or
vehicle collision or even how to hold the public transport providers
accountable for better services etc. All of these help to more effectively
manage the daily transportation challenges. The indicators included in
this benchmark are as follows:
* This indicator is included in the list of indicators for the benchmark “Level of usage of Intelligent Transport System (ITS) facilities”, to derive the level of service for signalised intersections, the ranges are not been given in the document. It has not been included in the overall calculation of level of service of the benchmark.
1. Availability of traffic surveillance system 2. Passenger information system (LED displays and screens inside
stations or speakers) 3. Global Positioning system 4. Signal Synchronization 5. Integrated ticketing system
6. Signalised intersection *

SERVICE LEVEL BENCHMARK IN URBAN TRANSPORT FOR INDIAN CITIES 2012
SLB | Developing Key Performance Measures 16
3.5 Travel speed (Motorized and Mass transit) along
major corridors
Spot speed
speed of vehicles measured at a particular point along the road
Average travel speed
Speed including all delays and travel time.
The relationship between vehicle speed and accidents are well
established. In addition to safety, there are also other benefits from travel
speed such as an increase in traffic flow and thereby a reduction in
congestion and delays which further implicates reduction in vehicle
operating cost, less travel time and even reduced levels of pollution and
noise. Therefore it becomes important to measure the travel speeds in
the city as it defines the performances of existing transportation system
(private vehicle and public transport). Measuring this would eventually
help the city indirectly in the fulfillment of both long term goals and short
term targets for a sustainable and safe transportation system. The
indicators included in this benchmark are as follows:
3.6 Availability of Parking Spaces
One of the most pressuring challenges that local government
(municipalities) encounter today is ‘how to balance the supply and
demand of parking spaces’ under its limit. Parking is a necessary element
of a city as it also influences a lot of many other factors such as mode
choice, travel speed etc. With the help of MoUD benchmark of
converting 50% of the on street parking into ‘paid parking’, municipalities
can have a better parking management plan. It may even help to
incentivize alternative modes of transport. To keep the maximum and
minimum parking fee at 2:1 ratio is also important for avoiding
congestion in the city core area where road right of way is smaller than
the newer roads in the city. The indicators included in this benchmark are
as follows:
Provides an indication of effective travel time or speed of public and private vehicles, therefore accounts indications of congestion or traffic density.
1. Average Travel speed of personal vehicles (KMPH) 2. Average Travel speed of public transport (KMPH)
It indicates the restriction on free parking spaces for all vehicles in a city
To cover at least 50% of on street public parking spaces under “paid parking”
To keep maximum and minimum parking fee difference to at least 2:1 (Parking rate to be computed two hourly).
1. Availability of paid parking spaces (%) 2. Ratio of maximum and minimum parking fee in the city

SERVICE LEVEL BENCHMARK IN URBAN TRANSPORT FOR INDIAN CITIES 2012
SLB | Developing Key Performance Measures 17
3.7 Road Safety
Causality
A person killed or injured in an accident. Casualties are sub-divided in to killed, seriously injured and slightly injured.
Fatal accidents
An accident in which at least one person is killed; other causalities (if any) may have serious or slightly injuries.
Serious Accidents
One in which at least one person is seriously injured but no person (other than a confirmed suicide) is killed.
Serious injury
An injury for which a person is detained in hospital as an “in-patient”, or any of the following injuries whether or not they are detained in hospital: fractures, concussion, internal injuries, crushing’s, burns (excluding friction burns), severe cuts, severe general shock requiring medical treatment and injuries causing
death 30 or more days after the accident. An injured casualty is recorded as seriously or slightly injured by the police on the basis of information available within a short time of the accident. This generally will not reflect the results of a medical examination, but may be influenced according to whether the casualty is hospitalized or not.
Killed
Human casualties who sustained injuries which caused death less than 90 days after the accident. Confirmed suicides are excluded.
Slight accident
One in which at least one person is slightly injured but no person is killed or seriously injured.
Slight Injury
An injury of a minor character such as a sprain (including neck whiplash injury), bruise or cut which are not judged to be severe, or slight shock requiring roadside attention. This definition includes injuries not requiring medical treatment.
Source: Reported Road Casualties in Great Britain: 2010 Annual Report, Department for Transport, 2010
In order to measure road safety in the city different kinds of statistical
data has to be collected and studied. In case of this study, records of the
fatal and serious accidents have been collected. However it is also
important to first understand road safety problems in the city. In many
cases road quality, vehicle density, driving behaviour in the city is the
cause for road problems.
Fatality rate per lakh population: To bring down fatality rates to 2 persons per lakh or below in all million plus cities within two years.
Fatality rate for pedestrian and NMT (%): To bring down fatality rates for pedestrian and NMT such that the share comes down to less than 40% within two years.

SERVICE LEVEL BENCHMARK IN URBAN TRANSPORT FOR INDIAN CITIES 2012
SLB | Developing Key Performance Measures 18
3.8 Pollution levels
National Ambient Air Quality Standards
Allowable concentrations of air pollutants in the ambient air specified by the Central pollution control board.
Particulate Matter
"Particulate matter (PM)," also known as particle pollution, is a complex mixture of extremely small dust and soot particles. Particle pollution is divided into two categories, “PM10” and “PM2.5.” PM10 is matter less than 10 micrometers in diameter. PM2.5 is even smaller - measuring 2.5 micrometers or less.
Nitrogen Oxides (NOx)
Chemicals formed in high-temperature combustion processes. The substance is toxic and can react to form ozone or PM10 in the form of nitrates. Nitrogen dioxide (NO2) is brownish red gas with a biting odor. It is highly irritating in high concentrations. Nitrogen dioxide is always accompanied by nitric oxide (NO).
Sulfur Oxides (SO2)
An invisible gas with a pungent odor. At low concentrations, this gas can often be tasted before smelled. The major source of sulfur oxides is the combustion of sulfur-containing fuels, primarily coal
and fuel oil. Sulfur dioxide is a toxic substance that can impair breathing.
The environment of a city is a critical determinant of the health of its
inhabitants and consequently, urban productivity. Here the annual
pollutants (SO2, NOx, SPM, RSPM) have been taken to express the
pollution levels in the city.
3.9 Integrated land use transport system
Floor space Index (FSI)
Floor space Index is the gross floor area of a building to the plot area.
Mixed land use
An appropriate combination of multiple uses (residential, commercial, cultural, institutional, or industrial uses) inside a single structure or place within a neighborhood (Alpert, 2010)
1. Fatality rate per lakh population 2. Fatality rate for pedestrian and NMT (%)
1. Annual Mean Concentration Range (μg/m3) of SO2 2. Annual Mean Concentration Range (μg/m3) of NOx 3. Annual Mean Concentration Range (μg/m3) of SPM 4. Annual Mean Concentration Range (μg/m3) of RSPM
Effectiveness of land use-transport Integration

SERVICE LEVEL BENCHMARK IN URBAN TRANSPORT FOR INDIAN CITIES 2012
SLB | Developing Key Performance Measures 19
The Integration of land use and transport system in a city has become one
of the key elements for a city’s sustainable development. There are
substantial advantages and opportunities in integrating the two. Aligning
land use and transport infrastructure could support (i) reduce private
vehicle kilometers travelled/auto- dependency (shorter trip lengths), (ii)
increases mass transit usage and also mix-use modes of transport
(bicycle, walk, public transport) (iii) a good mix of job-housing density.
3.10 Financial Sustainability of Public Transport
The focus of this indicator is on how financially sustainable are the public
transport operators because it is important that public transport services
is financially sustainable to provide good public transport to the city.
Ratio of fare revenue to total operating cost is a key indicator of financial
performance.
The staff-per-vehicle ratio is a useful measure of the effective use of staff.
Fare revenue is another important indicator that helps operators to cross
subsidized operating cost of the public transport. Non-fare revenue
comprises revenue from advertising on buses / coaches, at bus stations
and other spaces, rental spaces at terminals, etc.
1. Population Density (Gross persons /Developed area in hectare)
2. Mixed land use on major transit corridors /Network (% area under non-residential use)
3. Intensity of development -Citywide (FSI) 4. Intensity of Development along Transit Corridors 5. (FSI transit corridor / FSI) 6. Clear pattern and completeness of network
It indicates the financial sustainability of public transport by Bus. This indicator focuses on operating ratio, non-fare revenues and staff per bus ratio.
1. Extent of Non-fare revenue (%) 2. Staff/bus ratio 3. Operating Ratio

SERVICE LEVEL BENCHMARK IN URBAN TRANSPORT FOR INDIAN CITIES 2012
SLB | Developing Key Performance Measures 20
3.11 Additional / modified / “Revised SLB” focus areas
Additional indicators are indicators which are included through review of
different international documents and benchmarking studies carried out
in different parts of the world. Modified indicators are indicators which
have been modified in terms of level of service ranges or shuffled from
one benchmark to other benchmark.
3.11.1 Addition of Focus Area - Intermediate Public transport
Auto rickshaw
Auto rickshaw is a three-wheeled cabin cycle for private use and as a vehicle for hire. It is a motorized version of the traditional pulled rickshaw or cycle rickshaw.
Taxi
A taxi or a cab is a vehicle hired with a driver. It can either be hired by one single passenger or can be shared by a small group of people (shared taxi).
Intermediate public transport (IPT) refers to modes that fill the gap
between private transport and formal public transport modes in cities,
depending on a city’s size and transport characteristics.
In Indian cities, IPT is widely referred as “Auto rickshaws”, “taxi” and
“Cycle rickshaws”. It can be identified by a pre-defined, continuous, point
to point service with intermediate stops for boarding and alighting of
passengers, or taxi like services which can be identified by the
intermittent nature of the service and complete flexibility in destination
which is determined by the passenger.
Desirable level for IPT???
More is not good, less is not good
Role Intermediate Public Transport (IPT)
Varies for large and smaller citiesi) Large cities : 6-8 % share
ii) Small cities : 20-25% share
What should be themeasures?
1. Availability
2. Efficiency
3. Safety & Security
How to measure?
1. Mode share
2. Speed and ITS facility
*Suggested Indicators
1. Presence of IPT per
1000 population
2.Average travel speed of IPT
3. IPT vehicles with ITSfacilities / GPS
Small Cities Big Cities
PT IPTfunctions

SERVICE LEVEL BENCHMARK IN URBAN TRANSPORT FOR INDIAN CITIES 2012
SLB | Developing Key Performance Measures 21
3.11.2 Modification to focus area name- Travel speed (motorized
and mass transit) along major corridors” to “Street
infrastructure”
As given in the service level benchmarks for urban transport basically the
performance of road is defined by the speeds of private vehicles and
public transport. This measurement of road performance by speed alone
cannot determine how good the city is performing for a city need not
necessarily need high speeds for example hill cities. Many a times, the
performance is affected by the network size, distribution of network,
demand etc. The performance of road should be viewed in different
perspectives such as service quality, infrastructure provisions, efficiency
and accessibility. Therefore it becomes necessary to include more
indicators to this focus area and also the name to be changed to ‘street
infrastructure’. The indicators added to this focus area are mostly focused
on network size (% of area under roads), efficiency (travel speed),
availability/ accessibility (road density, percentage of higher order roads)
and safety (street lighting).
Travel speed alone cannotmeasure the performance of theroad. New Indicators needs to beadded to measure theperformance of road as there aremany other factors thatcontribute to road performance.
What should be the measures ?1. Efficiency2. Accessibility3. Availability4. Safety
How are we measuring?
1. Average travel speed
2. % of Higher order roads
3. Road Density
4. Percentage of area underroads
5. Street lighting (LUX levels)on roads

SERVICE LEVEL BENCHMARK IN URBAN TRANSPORT FOR INDIAN CITIES 2012
SLB | Developing Key Performance Measures 22
3.12 REVISED SLB FOCUS AREA
3.12.1 Public Transport (PT) Facilities
Indicators Additional / modified suggested
indicators
1Mega Cities (4 Million+ People), Metro cities (1-4 Million), Other cities I(<1 -0.2 Million population) and Other cities II (<0.2 Million population)there should be variation with the ranges to compute level of services. SLB ranges are taken as it is for Mega cities but for other size of the cities, there is proposed modification as per our study
Sometimes the municipal limit is too large but the extent of
development is not as large therefore the measurement of service
coverage with respect to the built-up area along with municipal
limit will be realistic. Therefore it becomes important to analyze the
city in terms of the amount of built up being served with adequate
frequency (i.e. less than 60minutes headway routes).
High frequency transit accessible area is referred to the total
area within 500m buffer of the bus stops in relation to the
built-up area of the city as this is the area generally accessed
by the residents.
This benchmark assesses city’s public transport from a user’s
perspective, hence it is important to assess average speeds of
public transport vehicles on major corridors’ of the city as a
part of this benchmark.
This benchmark focuses on public transport facilities in the
city, so it is important to include Boarding/Population.
Percentage Transit Ridership (Total trips on public transit /
total motorized trips) could also be included, but it is difficult
to measure as it requires a details household survey and
hence may not be feasible to use.
Transit ridership has not been covered in any other indicator,
the easiest way to measure transit ridership is through
boarding. Boarding can be computed through both primary
and secondary sources; however we have considered
boarding data through secondary sources. Primary data
collection methods for capturing ridership are extensive
efforts demanding. On the other hand, secondary sources will
also be 90-95% reliable. Thus, this indicator is depending on
secondary data collection
1. Presence of Organized Public
Transport System in Urban Area
(%)2. Extent of Supply - Availability of
Public Transport
3. Service Coverage of Public
Transport in the city
4. Average waiting time for Public
Transport users (min)
5. Level of Comfort in Public
Transport (Crowding)
6. % fleet size as per urban bus
specification
• Existing Indicators
1. Transit Access Area- (% built-up area
within 500m of PT plying) *
2. High frequency transit accessible area (%
area with transit access 10min or less
headway) *
3. Total boarding/ population*
4. Breakdown of Public Transport vehicles
(on-board reliability of buses)*
5. Vehicle (bus) Utilization*
6. Interchanges having Multi-modal
Facilities*
1. Average Travel speed of public transport **
*Additional indicators to be included in the benchmark**This indicator is part of the benchmark # 5, “Average travel speedon major corridors” as per SLB document, which has shifted underBenchmark # 1 “Public transport facilities”.

SERVICE LEVEL BENCHMARK IN URBAN TRANSPORT FOR INDIAN CITIES 2012
SLB | Developing Key Performance Measures 23
3.12.1.1 Additional suggested/modified indicators
MODIFIED INDICATORS
1. Extent of supply / Availability of Public Transport
Bus requirement is directly related to trip length and city size. Large size
cities have large trip lengths; hence the need of bus fleet is higher to
serve the same number of passengers in comparison with smaller cities.
City classification is adopted from JnNURM city classification.
Table 3.12-1: Population density as per categories of cities
Mega Cities (4 Million+ Population)
Metro Cities (1-4 Million population)
Other cities I (<1- 0.2 million population) Other cities II (<0.2 Million population)
Buses/1000 population
LoS Buses/1000 population
LoS Buses/1000 population
LoS
>0.6 1 >0.4 1 >0.3 1
0.4 – 0.6 2 0.25 – 0.4 2 0.2-0.3 2
0.2 – 0.4 3 0.1 – 0.25 3 0.1-0.2 3
<0.2 4 <0.1 4 <0.1 4
Public transport facilities: Metro cities (1-4 Million)
Extent of supply /
Availability of Public
Transport
Range Suggested range LoS
> = 0.6 >0.4 1
0.4 – 0.6 0.25 – 0.4 2
0.2 –0.4 0.1 – 0.25 3
< 0.2 <0.1 4
Public transport facilities: Other cities i (1-0.2 Million) ii (<0.2 Million)
Extent of supply /
Availability of Public
Transport
Range Suggested range LoS Suggested target for
other cities is LoS 3
> = 0.6 >0.3 1
0.4 – 0.6 0.3 – 0.2 2
0.2 –0.4 0.1 – 0.2 3
< 0.2 <0.1 4
2. Average waiting time for Public Transport Users
As per the method given in SLB, average waiting time should be
computed from desktop analysis. In order to further understand this, a
reconnaissance survey was conducted in Ahmedabad. It was observed
that waiting time is not always half of headway. It varies according to the
frequency of services. Therefore to establish this relation between
waiting time and headways, a survey was conducted for;
<10 minutes headway
10-20 minutes headway
20-60 minutes headway
The bus stop to conduct the survey was selected after studying the public
transport routes. The selected stops were (i) University bus stop (ii)
Navrangpura bus stop in Ahmedabad where maximum number of the
routes with the categorized headways as mentioned above was catered.
A sample of 30 was collected for each route during the peak hours. Finally
the relation has been established through regression analysis as given
below;

SERVICE LEVEL BENCHMARK IN URBAN TRANSPORT FOR INDIAN CITIES 2012
SLB | Developing Key Performance Measures 24
Table 3.12-2: Constant for bus Headways
Headways (minutes) Constant
<10 0.40
10-20 0.40
>20 - 60 0.29
Public transport facilities
Indicator Range Suggested range
LoS Suggested target for other cities is LoS 3 i.e. less than 12 minutes
Average waiting time
for public transport
users
<=4 <=4 1
4-6 4-8 2
6-10 8-12 3
>10 >12 4
ADDITIONAL INDICATORS
Public transport facilities
Indicators computation Range LoS Suggested target for
all categories of cities is
LoS 2
Transit Access Area- (% built-up area within
500m of PT plying)
PT corridor length with effective headways <1hr *1 km catchment of built-up area (500m buffer on either side)= (a) Total developed area = (b) (a/b)*100
<=4 1
4-8 2
8-12 3
>12 4
High frequency transit
accessible area (% area with transit access 10min or less
headway
Developed Area=(b) Developed area under 500m buffer of bus stops having effective headway less than 10mins effective headway= (c) (c/b)*100
<=4 1
4-8 2
8-12 3
>12 4
Another indicator could be related to boarding’s note that one needs to
include all the boarding’s including information from pass holders.
Public transport facilities
Indicators computation Range LoS Suggested target for
all categories of cities is
LoS 2
Total boarding/ population
Total boarding’s ( boarding on all PT ) d Total population within study area = e Boarding’s per population= (d*1000)/ e
<=4 1
4-8 2
8-12 3
>12 4
3. Affordability of public transport
This benchmark aims to calculate financial sustainability of public
transport by bus. Moreover, it is good to assess the affordability of
residents in place of usage of the bus based public transport system.
Assessing the performance of public transport from user perspective
alone is not enough, if affordability is not computed alongside. Hence,
affordability is included as part of this benchmark.
Affordability
Affordability can be considered as the ability to make necessary journeys (to work, school, health and other social services, and make visits to other family members or urgent other journeys) without having to curtail other essential activities. (Carruthers R. et al, 2005).
Affordability index is expressed as
Affordability index = (Number of trips * avg. cost per trip) / Per capita income”

SERVICE LEVEL BENCHMARK IN URBAN TRANSPORT FOR INDIAN CITIES 2012
SLB | Developing Key Performance Measures 25
Public transport facilities
Indicator computation Range LoS Suggested target for
all categories of cities is
LoS 2
Affordability of public
transport
(% expenditure per month on
transportation)
Average trip length in the city ( Secondary sources)- L Fare chart for the city(SPV, transport authority) -M Minimum wage in the country( labour Ministry) Rs115 Assumption that 2 trips made per person per day and 26 working days ( Total 52 trips/month) Total expenditure on transportation= ((fare /km)* Average trip length))*52 Total expenditure on transportation/total Monthly income ( as per minimum wages)
<=4 1
4-8 2
8-12 3
>12 4
SUGGESTED TARGET
4. Service coverage area of public transport
Public transport facilities
Indicator Computation Range LoS Suggested target for
other cities is LoS 1
Service Coverage of
Public Transport in
the study area
Total length in road km of the corridors on which public transport systems ply in the city = (a) (Corridors along which the service frequency is one hour or less are only considered to compute the length). Total Study area= (b) Service coverage = (a/b)
>=1 1
0.7-1 2
0.3-0.7 3
<0.3 4

SERVICE LEVEL BENCHMARK IN URBAN TRANSPORT FOR INDIAN CITIES 2012
SLB | Developing Key Performance Measures 26
5. Percentage of fleet size as per urban bus specifications
Public transport facilities
Indicator Computation Range LoS Suggested target for other cities is LoS 3
Percentage fleet size as per urban
bus specification
(UBS)
Total number of buses in the city = (a) Number of buses as per urban bus specification = (b) % of Fleet as per Urban Bus Specifications = (b/a)*100
75-100% 1
50-75% 2
25-50% 3
<=25% 4
3.12.2 Pedestrian Infrastructure Facilities
Indicators Additional / modified suggested indicators
This benchmark assess the present pedestrian infrastructure facilities in
the city, it is very essential to assess the major junctions are equipped
with signalized intersections. Major junctions refer to the junctions
serving level 1 (arterial) and level 2 (sub arterial) roads of the city. A
signalized intersection is one where the junction is alternatively used by a
fixed number of approaches for predefined time interval. Further, it also
brings safety aspect for the pedestrian to cross junction.
While computing signalized intersection delays, the first need of the city
is to install signals at all major junctions for the safety of pedestrians. Few
cities do not have adequate number of signals installed at major
junctions, yet they score high while computing signalized intersection
delay for a pedestrian. The methodology to compute signalized
intersection delays is restricted to existing number of signalized
intersections. This does not represent correct picture of the city’s
situation. Hence, we have suggested that it should score Level of Service
4 if the city does not have adequate number of signals installed in
comparison with major junctions as defined in a table below.
3.12.2.1 Additional suggested/modified indicators
ADDITIONAL INDICATORS
1. Availability of signalized intersections
Pedestrian infrastructure
Indicator Computation Range LoS Suggested target for all category of
Availability of signalized
Major junctions* in the city = (a)
75-100%
1
1. Signalized intersection delay
2. Street lighting (Lux)
3. % City covered with footpath
• Existing Indicators
4. Availability of signalized
intersections*
*Additional indicators to be included in the benchmark

SERVICE LEVEL BENCHMARK IN URBAN TRANSPORT FOR INDIAN CITIES 2012
SLB | Developing Key Performance Measures 27
intersections Signalized intersections = (b) Availability of signalized intersection = (b/a)*100 * Major junctions refer to junctions serving level 1 and level 2 roads of the city.
50-75%
2 cities is LoS 2
25-50%
3
<=25% 4
SUGGESTED TARGET
For this benchmark, the targets given are only for million plus cities and
the targets for other cities have not been specified. However the same
has also been adopted as targets for other cities [(i) 1-0.2 million
population (ii) <0.2 million population] for all the indicator is LoS 2.
3.12.3 Non-Motorized Transport (NMT) Facilities
Indicators Additional / modified suggested indicators
It indicates the percentage of dedicated cycle track / lane along the
arterial & sub arterial road network or public transport corridors with a
minimum of 2 m width. It is characterized by continuous length,
encroachment on NMT lanes, and parking facilities.
Most cities are lacking in dedicated cycle network, hence computing
encroachment through vehicle parking is not appropriate. Most cities
score high as they don’t have encroachment on cycle tracks, but those
cities do not have cycle track in even 10% of the total road network. Thus,
cities where cycle track is insufficient, level of service for encroachment
computation should be taken as 4.
3.12.4 Level of usage of Intelligent Transport System (ITS)
facilities
Integrated ticketing may be understood as a single common ticket which
can be used across all modes of public transport for a single trip. It helps
in providing seamless interchange across the Public transport modes and
also reduces the overall travel time as the users do not have to stand in
queues each time they interchange to purchase the tickets. Aim is to have
complete integration across all operators of same modes and across all
modes and operators. With the ranges given in SLB, it is hard to
understand if a single system has provision of seamless travel such as
“one system and one ticket”. Incorporating concepts such as smart card
and “one system one ticket” also helps in reducing the time spent in
queue for the tickets. It is very important to assess it, hence, there is
modification in the range is suggested.
Indicators Additional / modified suggested indicators
1. % of network covered *2. Encroachment on Cycle roads by
vehicles parking (%)3. NMT Parking facilities at
Interchanges (%)
Existing Indicators
*Width of cycle track is taken 2metre

SERVICE LEVEL BENCHMARK IN URBAN TRANSPORT FOR INDIAN CITIES 2012
SLB | Developing Key Performance Measures 28
3.12.4.1 Additional suggested/modified indicators
MODIFIED INDICATORS
Level of usage of intelligent system (ITS) facilities Indicator Computation Range LoS Suggested
target for other cities is LoS 3
Integrated ticketing system
Total number of buses in the city = (a) Number of buses as per urban bus specification = (b) % of Fleet as per Urban Bus Specifications = (b/a)*100
>=75 1
50-75 2
25-50 3
<25 4
SUGGESTED TARGET
Signal Synchronization: Target for metro cities is LoS 2 and for other cities
is LoS 3.
Integrated Ticketing System: Target for other cities is LoS 1
3.12.5 Street Infrastructure
Road network forms an important part of the urban fabric of the city. It
also indirectly depicts growth of a city i.e. as road extends city expands to
more opportunity space. Therefore it is important to measure the
performance of the current road network in the city which could be by
assessing road density, % of higher order roads in comparison with total
road network.
This indicator aims to assess the road network performance i.e. average
speeds of private vehicles hence it could be renamed as “Road network
Performance”. Moreover, additional indicators to be included as part of
benchmark assessment are, Road density, % higher order roads, street
lighting (LUX) on roads; these indicators further emphasizes on
assessment of road network of the city. Hence, it is suggested that the
benchmark could be renamed as “Road network Performance”.
Indicators Additional / modified suggested indicators
1. Availability of traffic surveillance system
2. Passenger information system (LED displays and screens inside stations or speakers)
3. Global Positioning system4. Signal Synchronization5. Integrated ticketing system*
Existing indicators
* With modification in methodology
1. Average Travel speed of personal vehicles (CARS)
2. Average Travel speed of Personal vehicles (Two wheelers)
Existing indicators
1. Road Density*2. % Higher order roads*3. Street lighting (LUX levels) on
roads*
* Additional indicators to be included in the benchmark .These indicator is part of the benchmark # 9, “Integrated land use transport system” as per MoUD document, which has shifted under Benchmark # 5 “Road network Performance”
**Average travel speed of public transport is shifted in Benchmark #1, Public Transport Facilities

SERVICE LEVEL BENCHMARK IN URBAN TRANSPORT FOR INDIAN CITIES 2012
SLB | Developing Key Performance Measures 29
This indicator aims to assess the road network performance,
it is important to include % area under roads as part of this
benchmark, hence it has moved from benchmark
#9”Integrated land use and transport system”.
Average Travel Speed of Personal vehicles (KMPH) are further
split in two indicators, i.e. Average Travel Speed of Cars
(KMPH) and Average Travel Speed of Two wheelers (KMPH).
Some cities have significant difference in travel speed of two
wheelers and cars, hence splitting in two, will give precision
in assessment of average travel speed. To compute the level
of service, the ranges have been kept same as “SLB”
document.
As per the “SLB” document, methodology of computation of
average travel speed, there is difference in measurement of
LoS (Level of Service). Considering urban scenario and today’s
demand, the PT travel speed should be similar to private
vehicles. Hence we have suggested modification for the
measurement of LoS to keep all the modes on same platform
for better comparison and to promote equality.
3.12.5.1 Additional suggested/modified indicators
MODIFIED INDICATORS
1. Travel speed
Street Infrastructure
Indicator Range Suggested Range
LoS
Average travel >=30 >=20 1
speed of personal vehicles (Kmph)
City wide level of service of motorized
vehicles (Private) Car
2 wheeler
25-30 18-20 2
15-25 16-18 3
<=15 <=16 4
2. Street lighting (Lux level on road)
Street lighting in India is governed by the Indian Standards - IS 1944 (Parts
I and II), 1970 as given in the table below. These standards provide the
guidance to public lighting authorities who are concerned with the
preparation of public lighting schemes, their installation and
maintenance.
Lighting Criteria
Uniformity of the Lighting Over all Uniformity ( U0 ) : Overall uniformity is the ratio of the minimum to the average road illuminance A good overall uniformity ensures that all spots on the road are sufficiently visible Longitudinal Uniformity ( UL ) : # Longitudinal uniformity - ratio of the minimum to the maximum in the middle of each lane #A good longitudinal uniformity ensures comfortable driving conditions without the so-called ‘Zebra’ effect

SERVICE LEVEL BENCHMARK IN URBAN TRANSPORT FOR INDIAN CITIES 2012
SLB | Developing Key Performance Measures 30
Table 3.12-3: Classification of street lighting
Classification of Lighting Installation Type of Road Average Luminance on Road Ratio of Min/Avg. Illumination
Group A1 Important Traffic routes carrying fast traffic.
30 0.4
Group A2 Other Main Roads carrying mixed Traffic like main city streets, arterial roads, throughways etc…
15 0.4
Group B1 Secondary roads with considerable traffic like principal local traffic routes, shopping
8 0.3
Group B2 Secondary roads with light traffic 4 0.3
Table 3.12-4: Lighting standards as per codes
As per BS 5489-1 & BS EN-13201-2:2003 Level of roads Level 1 Level 2 Level 3 Level 4
Lux Standard Lux level
Uniformity Lux level
Uniformity Lux level
Uniformity Lux level
Uniformity
U0 UL U0 UL U0 UL U0 UL
Road 25-30 0.4 0.7 25-30 0.4 0.7 18-22 0.4 0.7 17-20 0.4 0.5
Footpath (Complexity low)
15-17 0.4 15-17 0.4 12-15 0.4 10-12 0.4
Footpath (Complexity high)
17-20 0.4 17-20 0.4 15-17 0.4 12-15 0.4
As per IS 1944-1970
Road 30 0.4 - 30 0.4 - 15 0.4 - 15 0.4 -
Footpath Not specified Not specified Not specified Not specified

SERVICE LEVEL BENCHMARK IN URBAN TRANSPORT FOR INDIAN CITIES 2012
SLB | Developing Key Performance Measures 31
Considering this, the British standards (BS 5489-1 & BS EN-13201-2:2003)
have been studied in comparison to the Indian Standards (IS 1944 (Parts I
and II), 1970) and ranges of lux standards have been proposed as given in
table below.
ADDITIONAL INDICATORS
Street Infrastructure
Indicator computation Range LoS - Suggested target for all these
categories of cities is
LoS 2
Road Density Built up area – h Total Road length – i Road density – i/h
>12 1
10-12 2
8-10 3
6-8 4
Percentage of higher order
roads
Total length of road network =i Length of level 1 + level 2 roads= j % Higher order roads =j/i*100
>35 1
25-35 2
15-25 3
<15 4
Street lighting (LUX levels) on
roads
LUX reading consists of 12 point readings Average LUX levels on each of the selected links= (Q1+Q2+Q3+Q4+Q5+Q6)/6 Level of service on which cumulative frequency crosses 50% mark
>=30 1
>25-30
2
>20-25
3
<20 4
3.12.6 Availability of Parking Spaces
Indicators Additional / modified suggested indicators
Data collection is a major problem both in terms of secondary
and primary sources.
Secondary source: the authorities do not maintain data in
terms of ECS unit. Primary source: difficult to capture the
actual capacity in the pay parking area as it depends on the
time of the survey.
3.12.7 Road Safety
Indicators Additional / modified suggested indicators
With increasing road traffic, many cities are witnessing increase in
accidents, leading to rise in injuries and fatalities. Level of fatality is an
indication of road safety. Road design and available road infrastructure,
1. Availability of paid parking spaces (%)
2. Ratio of maximum and minimum parking fee in the city
Existing indicators
1. Fatality rate per lakh population 2. Fatality rate for pedestrian &
NMT (%)
Existing Indicators
3. Serious injuries per lakh population*
*Additional indicators to be included in thebenchmark

SERVICE LEVEL BENCHMARK IN URBAN TRANSPORT FOR INDIAN CITIES 2012
SLB | Developing Key Performance Measures 32
traffic management and other such reasons significantly contribute to
road safety hence it is important to monitor fatality rate. The ideal
benchmark for the same is zero, as ideally fatalities and injuries out of
accidents should be brought down to nil. Additionally, serious accidents
should also be considered for assessment of road safety. Hence,
additional indicator “Fatal and serious accidents per lakh population” is
suggested to compute level of service for this benchmark.
ADDITIONAL INDICATORS
Road Safety
Indicator computation Range LoS
Serious injuries per lakh
population
Serious injuries recorded in road accidents= (k) (Traffic police, 2011) Population of study area =e (Provisional population, Census, 2011) (k*100000)/e
>2 persons 1
2-4 persons 2
4-6 persons 3
>6 persons 4
3.12.8 Pollution levels
Indicators Additional / modified suggested indicators
The minimum standard given in SLB for SPM is very high than the recent
standards given by Central Pollution Control Board (CPCB) as shown in
table. Considering this, level of service needs to be redefined considering
minimum standard for SPM. Table 3.12-5: Pollution levels
Parameters Central Pollution Control Board (CPCB) SLB
Standard for Residential &
Industrial Area (CPCB)
Standard for Sensitive Area
(CPCB)
Minimum Standard
S02
Annual 50 20 40
24 HRS. 80 80
NO
Annual 40 30 40
24 HRS. 80 80
SPM / (PM10)
Annual 60 60 180
24 HRS. 100 100
RSPM / (PM2.5)
Annual 40 40 40
24 HRS. 60 60 15
1. Reading of S022. Reading of Nox3. Reading of SPM (PM 10)*4. Reading of RSPM (PM2.5)
Existing indicators
* With modification as per revised CPCB guidelines , 2009

SERVICE LEVEL BENCHMARK IN URBAN TRANSPORT FOR INDIAN CITIES 2012
SLB | Developing Key Performance Measures 33
MODIFIED INDICATORS
Pollution levels
Indicator Range Suggested range LoS
Reading of SPM (PM 10)
0-180 (Low) 0-60 1
180-350 (Moderate)
60-120 2
360-540 (High) 120-180 3
>540 (Critical) >180 4
SUGGESTED TARGET
Target set for all the category of cities is LoS 1
3.12.9 Integrated land use transport system
Indicators Additional / modified suggested indicators
3.12.9.1 Additional suggested/modified indicators
MODIFIED INDICATORS
1. Population Density
Table 3.12-6: Population density as per categories of cities
Integrated land use transport system : Metro cities (1-4 Million)
Indicator Range Suggested range LoS
Population density
>150 >125 1
125-150 100-125 2
100-125 75-100 3
< 100 <75 4
Integrated land use transport system : Other cities i (1-0.2 Million) ii (<0.2 Million)
Indicator Range Suggested range LoS
Population density
>150 >100 1
125-150 75-100 2
100-125 50-75 3
< 100 <50 4
1. Population Density (Gross persons /Developed area in hectare)
2. Mixed landuse on major transit corridors /Network
3. Intensity of development -Citywide (FSI)
4. Intensity of Development along Transit Corridors
5. Clear pattern and completeness of network
6. %age network having exclusive ROW for Transit network
7. % area under roads1
Existing indicators
1This indicator is part of the benchmark # 9,“Integrated land use transport system” as per SLBdocument, which has shifted under Benchmark # 5“Road network Performance”
Mega Cities (4 Million+ Population)
Metro Cities (1-4 Million population)
Other cities I (<1- 0.2 million population) Other cities II (<0.2 Million population)
Density LoS Density LoS Density LoS
>150 1 >125 1 >100 1
125-150 2 100-125 2 75-100 2
100-125 3 75-100 3 50-75 3
< 100 4 <75 4 <50 4

SERVICE LEVEL BENCHMARK IN URBAN TRANSPORT FOR INDIAN CITIES 2012
SLB | Developing Key Performance Measures 34
2. Intensity of Development along Transit Corridors
Integrated land use transport system : Other cities i (1-0.2 Million) ii (<0.2 Million)
Indicator Computation Range LoS
Intensity of Development along Transit
Corridors
Actual FIS along transit Corridors
>=4 1
3-4 2
2-3 3
<2 4
3.12.10 Financial Sustainability of Public Transport
Indicators Additional / modified suggested indicators
Non-fare revenue
Non-fare revenue comprises revenue from advertising on buses / coaches, at bus stations and other spaces, rental spaces at terminals.
MODIFIED INDICATOR
1. Operating ratio
Financial sustainability of Public Transport
Indicator Suggested computation Range LoS
Operating ratio Cost / km (a) Earning / km (b)
Operating ratio = (a/b)
<0.7 1
0.7 – 1.0 2
1.0 – 1.5 3
>=1.5 4
3.12.11 Intermediate Public Transport (IPT)
“Intermediate public transport (IPT) refers to modes that fill the gap
between private transport and formal public transport modes in cities.
Depending on a city’s size and transport characteristics, IPT modes may
fall under two broad categories: (1) contract carriage services, which are
flexible demand-based services where the passenger determines the
destination, and (2) informal public transport (bus like) services,
characterized by shared fixed-route services with intermediate stops for
boarding and alighting. While contract carriage services are ubiquitous in
cities, informal public transport services are typically seen in small and
medium-sized cities, which may not have any or adequate formal public
transport services. Such services are called informal because of their
ownership structure (individual owners) and lack of (or poor) regulation
and enforcement, Mani A. Et al., Sustainable Urban Transport in India-
Role of the Auto-rickshaw Sector, World resources Institute and Embarq).
1. Extent of Non-fare revenue (%)*2. Staff/bus ratio3. Operating Ratio
Existing indicators
* With modification in the ranges and methodology

SERVICE LEVEL BENCHMARK IN URBAN TRANSPORT FOR INDIAN CITIES 2012
SLB | Developing Key Performance Measures 35
Indicators Additional / modified suggested indicators
Considering the fact that in many of the Indian cities auto rickshaws are
important modes of transport either because the city does not have a
proper public transport system or sometimes IPTS like taxis have a major
role to play especially in terrain constraint cities particularly in the case of
hill cities. Therefore it becomes important to consider these modes of
transport as it is an important element of the city’s urban transport
facility. Keeping this in mind a new benchmark has been suggested on
IPTS.
IPT
Indicator computation Range LoS
Average travel speed of IPT
Average speed along the corridors =length /journey time (hour) LoS is calculated for each corridor as Los1 for Corridor 1, LoS2 for corriodor2, LoSn for corridor n Weightage of each corridor= W1 for C1, W2 for C2…Wn for Cn
>=30 1
25-30 2
15-25 3
<15 4
ITS with GPS facility
Total number of IPT (RTO) = (a) Total number of IPT with GPS = (b) =(a) / (b)
>=75 1
50-75 2
25-50 3
<25 4
Presence of IPT vehicles / 1000 population
Registered IPT vehicles (auto rickshaws and taxis) = a Population of delineated area = b Presence of IPT vehicles / 1000 population = (a/(b/1000))
3.5-4.5 1
2.5-3.5 and 4.5-5.5
2
1-2.5 and 5.5-
6.5
3
<1 and >6.5
4
1. Presence of IPT vehicles / 1000 population
2. Average travel speed of IPT*3. IPT vehicles with ITS facilities /
GPS*
*Additional indicators to be included in thebenchmark

SERVICE LEVEL BENCHMARK IN URBAN TRANSPORT FOR INDIAN CITIES 2012
SLB | Approach Data Collection and Methodology 36
4 Approach Data Collection and Methodology
4.1 Study Approach
The study for benchmarking performances in urban transport of various
cities has been approached in the following way (as shown in the chart
below):
The analytical frame consists of
1. Service level benchmark indicators suggested by MoUD and
additional benchmarking indicators have also been identified
through literature research.
1. Alternative methodology have also been applied and proposed (as
discussed later in the chapter)
2. For carrying out the calculation of indicators data collection both
in terms of primary and secondary data are collected and
analyzed. Secondary data was acquired mostly from published
reports and from the concerned agency/ authorities.
3. The level of service is then calculated as per the given formulas.
4. Validate results for appropriateness and representativeness.
5. If issues identified then revisit the indicators and measurement
process and modify
6. If results satisfactory adopt the existing service level and the
target service level for each indicator
7. Derive the overall service level for the city by using composite
index method
Figure 4.1-1: Study approach methodology
4.2 Study Area Delineation
The SLB suggests that the study area will be confined to the Local Planning
Area given the fact that land-use decisions are for a notified area inclusive
of the primary urban centre and its influence zone.
This area in some cases may be too big to consider for measurement
purposes e.g. in case of Ahmedabad, the Local Planning Area is about
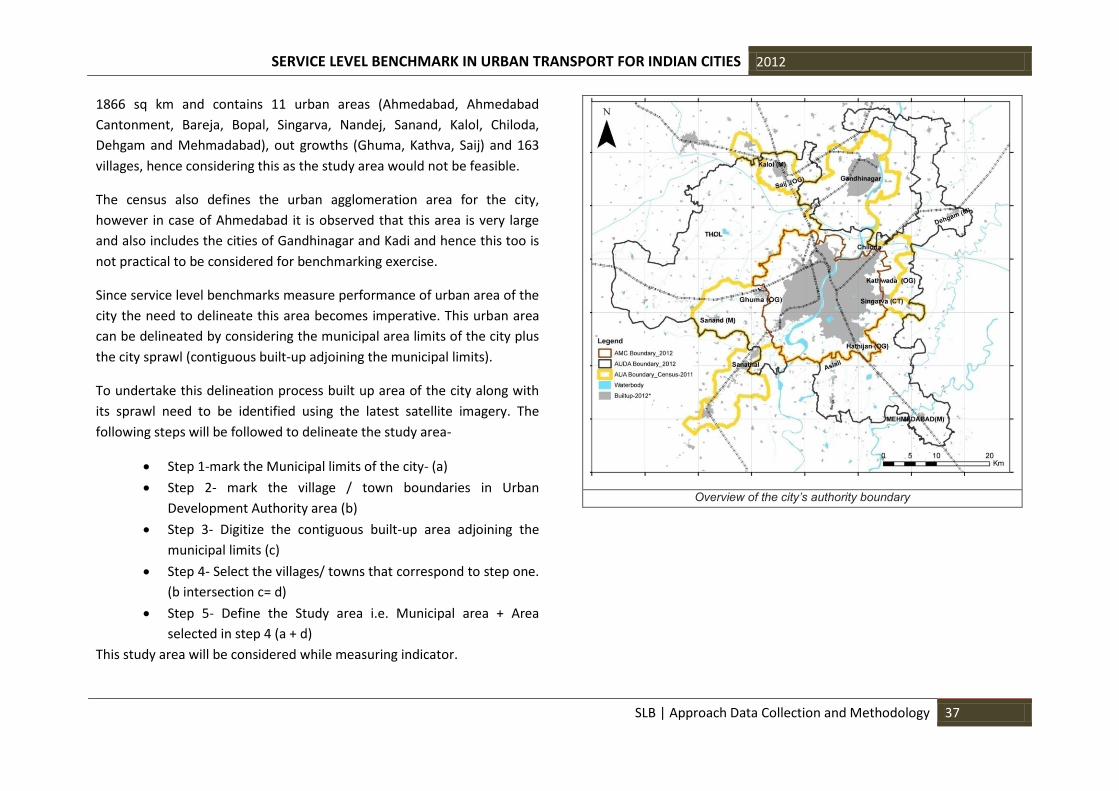
SERVICE LEVEL BENCHMARK IN URBAN TRANSPORT FOR INDIAN CITIES 2012
SLB | Approach Data Collection and Methodology 37
1866 sq km and contains 11 urban areas (Ahmedabad, Ahmedabad
Cantonment, Bareja, Bopal, Singarva, Nandej, Sanand, Kalol, Chiloda,
Dehgam and Mehmadabad), out growths (Ghuma, Kathva, Saij) and 163
villages, hence considering this as the study area would not be feasible.
The census also defines the urban agglomeration area for the city,
however in case of Ahmedabad it is observed that this area is very large
and also includes the cities of Gandhinagar and Kadi and hence this too is
not practical to be considered for benchmarking exercise.
Since service level benchmarks measure performance of urban area of the
city the need to delineate this area becomes imperative. This urban area
can be delineated by considering the municipal area limits of the city plus
the city sprawl (contiguous built-up adjoining the municipal limits).
To undertake this delineation process built up area of the city along with
its sprawl need to be identified using the latest satellite imagery. The
following steps will be followed to delineate the study area-
Step 1-mark the Municipal limits of the city- (a)
Step 2- mark the village / town boundaries in Urban
Development Authority area (b)
Step 3- Digitize the contiguous built-up area adjoining the
municipal limits (c)
Step 4- Select the villages/ towns that correspond to step one.
(b intersection c= d)
Step 5- Define the Study area i.e. Municipal area + Area
selected in step 4 (a + d)
This study area will be considered while measuring indicator.
Overview of the city’s authority boundary

SERVICE LEVEL BENCHMARK IN URBAN TRANSPORT FOR INDIAN CITIES 2012
SLB | Approach Data Collection and Methodology 38
Contiguous Developed Area Map 4.2-1: Study area delineation

SERVICE LEVEL BENCHMARK IN URBAN TRANSPORT FOR INDIAN CITIES 2012
SLB | Approach Data Collection and Methodology 39
4.3 Data Establishment
Data needs to be collected and transferred spatially on maps using GIS
and a data collection system put in place. It is important to understand
the outputs that are desired before we start collecting information. Data
collection should focus on data that will be used to measure indicators.
Depending on the indicator measured the data collected needs to be
representative both spatially and temporally.
Before starting the study it is also important to have some base
information in hand which will be useful in primary survey sampling
process. This base information is listed below-
1. Base map containing administrative boundaries, Municipal and
Urban authorities (includes zones, wards, urban areas, villages)
2. Demographic – population of 2011 (In case the new census
figures are not available collect information on the last three to
four decades and estimate the base year population. It is also
important to take into consideration the area changes that have
taken place which has an implication of the growth rates used for
base year estimation.
3. Built up area ( digitized from Google imagery)
4. Road network
5. Location of signalized intersections, road under bridges, road
over bridges and river bridges.
6. Public transport network including location of stops.
7. Rapid transit network including transit stations.
8. Land use map existing and proposed for urban development
area.
9. Elevation and Slope maps for hill cities.
4.3.1 Secondary Data
The secondary data collection is data directly collected from the various
authorities to compute the indicators. Indicator computation and
deriving Level of service mainly rely on the data collected through
various agencies.

SERVICE LEVEL BENCHMARK IN URBAN TRANSPORT FOR INDIAN CITIES 2012
SLB | Approach Data Collection and Methodology 40
The secondary data sources have been recorded in the following manner:
Figure 4.3-1: Secondary data collection process
Secondary analysis: is the data which will be collected from concerned
authorities and then further analyzed to achieve the result. For example,
for indicator signalized intersection delay: all the signal phasing plans
have been collected from traffic police. After that the data is further
recorded in secondary sheet, then to compute waiting times for
pedestrian to cross the road will require further analysis of the signal
phasing time.
The formats prepared to store the secondary/secondary analysis data is
given in the annexure.
The list of secondary data that is required to be collected from various
agencies and authorities for each Indicator are listed below:
Table 4.3-1: List of Secondary data to be collected
Indicator no
Activity Data Source
1 Public transport facilities
I Total number of buses Fleet on road
Bus operators (STU/SPV/Municipal/Pvt)
2 Number of Buses as per Urban Bus specification
Bus operators (STU/SPV/Municipal/Pvt)
3 Total number of Bus stops Bus operators (STU/SPV/Municipal/Pvt)
4 No of terminals / interchanges
Bus operators (STU/SPV/Municipal/Pvt)
5 Total Number of routes Bus operators (STU/SPV/Municipal/Pvt)
6 Bus Routes (frequency & headways)
Bus operators (STU/SPV/Municipal/Pvt)
2 Pedestrian
1 Total number of signalized intersection
Traffic Police
2 Phasing plan of a signalized intersections in the city
Traffic Police
3 Total number of junctions which are synchronized
Traffic Police
4 Total number of signalized Traffic Police

SERVICE LEVEL BENCHMARK IN URBAN TRANSPORT FOR INDIAN CITIES 2012
SLB | Approach Data Collection and Methodology 41
Indicator no
Activity Data Source junctions with pedestrian phasing
3 Non-Motorized Vehicle
1 Total number of interchanges having NMT (bicycle) parking
Municipality / Traffic police
4 ITS
1 No of bus stations / terminals having CCTVs
Bus operators (STU/SPV/Municipal/Pvt)
2 Total no. of bus stops / terminals having PIS
Bus operators (STU/SPV/Municipal/Pvt)
3 No. of buses onboard functional GPS / GPRS and connected to common control centre
Bus operators (STU/SPV/Municipal/Pvt)
4 Total number of modes which have integrated ticketing systems
Bus operators (STU/SPV/Municipal/Pvt)
5 Total number of signalized intersections having CCTVs
Traffic Police
6 Parking
1 List of designated parking areas in the city
Municipality / Traffic police
2 Total available on street paid parking in ECS (designated by SMC/SUDA)
Municipality / Traffic police
3 Parking fee minimum and maximum
Municipality / Traffic police
i) In CBD
ii) Whole city
Indicator no
Activity Data Source 7 Road safety
1 Total number of fatalities in road accidents
Traffic Police
2 Total number of Pedestrian fatalities in road accidents
Traffic Police
3 Total number of serious accidents in road accidents
Traffic Police
8 Pollution data Pollution Control Board
1 Annual Mean Concentration Range (μg/m3) S02
Pollution Control Board
2 Annual Mean Concentration Range (μg/m3) NO
Pollution Control Board
3 Annual Mean Concentration Range (μg/m3) SPM / (PM10)
Pollution Control Board
4 Annual Mean Concentration Range (μg/m3) RSPM / (PM2.5)
Pollution Control Board
9 Integrated Land use Transport system
1 FSI MC DCR
2 FSI along transit corridors MC DCR
3 Total length of road network as per development plan
Development Authority/ MC
10 Financial Sustainability
1 Revenue collections per annum from non-fare related sources
Bus operators (STU/SPV/Municipal/Pvt)
2 Non-fare revenue from Advertisement on buses
Bus operators (STU/SPV/Municipal/Pvt)

SERVICE LEVEL BENCHMARK IN URBAN TRANSPORT FOR INDIAN CITIES 2012
SLB | Approach Data Collection and Methodology 42
Indicator no
Activity Data Source 3 Non-fare revenue from
Advertisement on bus stations
Bus operators (STU/SPV/Municipal/Pvt)
4 Total revenue per annum from all sources
Bus operators (STU/SPV/Municipal/Pvt)
5 Total Staff (drivers, conductors and supporting staff / officials for operations and maintenance
Bus operators (STU/SPV/Municipal/Pvt)
6 Costs (inc Depreciation , Operation & maintenance, manpower etc)
Bus operators (STU/SPV/Municipal/Pvt)
7 Bus Fare (Distance in Km) Bus operators (STU/SPV/Municipal/Pvt)
11 IPT
1 Total number of rickshaws RTO
2 Total number of auto rickshaws with GPS device
Private / RTO
12 Additional information
1 Total length of road network as per development plan
Municipal / Development authorities
Apart from the secondary data that have been collected, average waiting
time has also been computed from desktop analysis as per SLB’s method.
In order to further understand this, a reconnaissance survey was
conducted in Ahmedabad. It was observed that waiting time is not
always half of headway. It varies according to the frequency of services.
Therefore to establish this relation between waiting time and headways,
a survey was conducted for;
1. <10 minutes
2. 10-20 minutes
3. 20-60 minutes
The bus stop to conduct the survey was selected after studying the public
transport routes. The selected stops were:
1. University bus stop
2. Navrangpura bus stop in Ahmedabad where maximum number
of the routes with the categorized headways as mentioned above
was catered. A sample of 30 was collected for each route during
the peak hours (please refer annexure). Finally the relation has
been established through regression analysis as given below;
Table 4.3-2: Constant for headways
Headways (minutes) Constant
<10 0.40
10-20 0.40
>20 - 60 0.29
4.3.2 Primary Data
The collection of primary data has been mainly through various surveys
conducted to arrive at the value for calculating the level of service. The
list of primary survey that was conducted in each of the 6 cities is as
given in the table below:
Sr. no
Service Level Benchmarks Primary surveys
1 Public Transport facilities Boarding Alighting Survey

SERVICE LEVEL BENCHMARK IN URBAN TRANSPORT FOR INDIAN CITIES 2012
SLB | Approach Data Collection and Methodology 43
Sr. no
Service Level Benchmarks Primary surveys
Level of Comfort in Public Transport (Annexure 6.1.1)
2 Pedestrian Infrastructure facilities
Road inventory survey (Annexure 6.1.2)
-Availability of footpaths
-Encroachment on foot paths
- Lux Survey
3 Non-Motorized Transport facilities
Bicycle parking survey at Interchanges Refer figure 4.2.3
-Availability of cycle parking facility within 250m radius of at major bus stops/ Terminals
4 Usage of Integrated Transport System (ITS) facilities
Not required
5 Travel speed along major corridors (Motorized & Public Transport)
Speed and Delay survey along major arterials
-Travel speed of personal vehicles and public transport along Arterial roads (Annexure 6.1.3) (Annexure 6.1.4)
6 Road Safety Not required
7 Availability of Parking facilities
Road inventory Survey
-Parking provision in the city (Annexure 6.1.2)
8 Pollution levels Not required
9 Land Use Transport Land use and Intensity of
Sr. no
Service Level Benchmarks Primary surveys
Integration development survey along Proposed BRTS corridor (Annexure 6.1.5)
-Mixed land use zoning (% area under nonresidential use)
10 Financial Sustainability of Public Transport
Not required
4.3.3 Corridor selection for Road Network Inventory
One of the foremost and the most important step in conducting primary
surveys is the selection of roads that is needed to be studied and
surveyed. Based on this many of the service level benchmarks are to be
calculated. Therefore to arrive at the road network selection for survey it
was important to develop a common basis for defining the category of
roads. Based on this road network for inventory was selected. This
definition for cities will vary based on their scale and size.
The cities are divided into four categories- Table 4.3-3: Classification of cities as per population
Category I Cities Mega cities >4 million population cities
Category II Cities Metro cities 1-4 million population cities
Category III Cities Other cities I <1 – 0.2 million population cities
Category IV Cities Other cities II < 0.2 million population cities
The above city classification is referenced from JnNURM city classification

SERVICE LEVEL BENCHMARK IN URBAN TRANSPORT FOR INDIAN CITIES 2012
SLB | Approach Data Collection and Methodology 44
Road Classification Definition
Level 1 “ARTERIAL” –
Formulates the pattern or form of the
city”
All radials and rings that are 80% completeness National Highway and State Highway Orbital roads that are long and that cut across the city. Roads, which are helping in forming the shape of the city i.e. ring / radials / Grid form OR Roads that have right of way Category I cities: >36m – 60m Category II cities: >24m - 60m Category III cities >9m
Level 2 “SUBARTERIAL”
-Formulates patterns by further dissecting level 1 roads / Forms
grids - patterns
All radials and rings that are 50% complete Radials which are having length less than half of the city (in case of Ahmedabad, radials not originating from walled city connecting straight to SP ring road Long roads (roads having lengths of approximately half or three quarter length to the city size) Major district roads & Other district roads Roads, which are further dissecting level 1 roads and form grids or pattern OR Roads that have right of way Category I cities: >24m - 36m Category II cities: >15m-18m Category III cities >5.5m
Level 3 “Collector” – creates
blocks
Roads that connect level 1 and level 2 roads Roads, that further create smaller grids OR Roads that have right of way Category I & II cities: > 9m Category III cities <5.5
Level 4 “Local roads” – Access
to the residents
Roads that connects to residential units. Roads that have right of way < 9m In case of hill cities, footsteps that connect to another level of road are taken as level 4 roads.

SERVICE LEVEL BENCHMARK IN URBAN TRANSPORT FOR INDIAN CITIES 2012
SLB | Approach Data Collection and Methodology 45
Map 4.3-1: Level 1 roads (Bhubaneswar)

SERVICE LEVEL BENCHMARK IN URBAN TRANSPORT FOR INDIAN CITIES 2012
SLB | Approach Data Collection and Methodology 46
Map 4.3-2: Road network classification - level 2 roads

SERVICE LEVEL BENCHMARK IN URBAN TRANSPORT FOR INDIAN CITIES 2012
SLB | Approach Data Collection and Methodology 47
Map 4.3-3: Level 1,2,3 roads (Bhubaneswar)
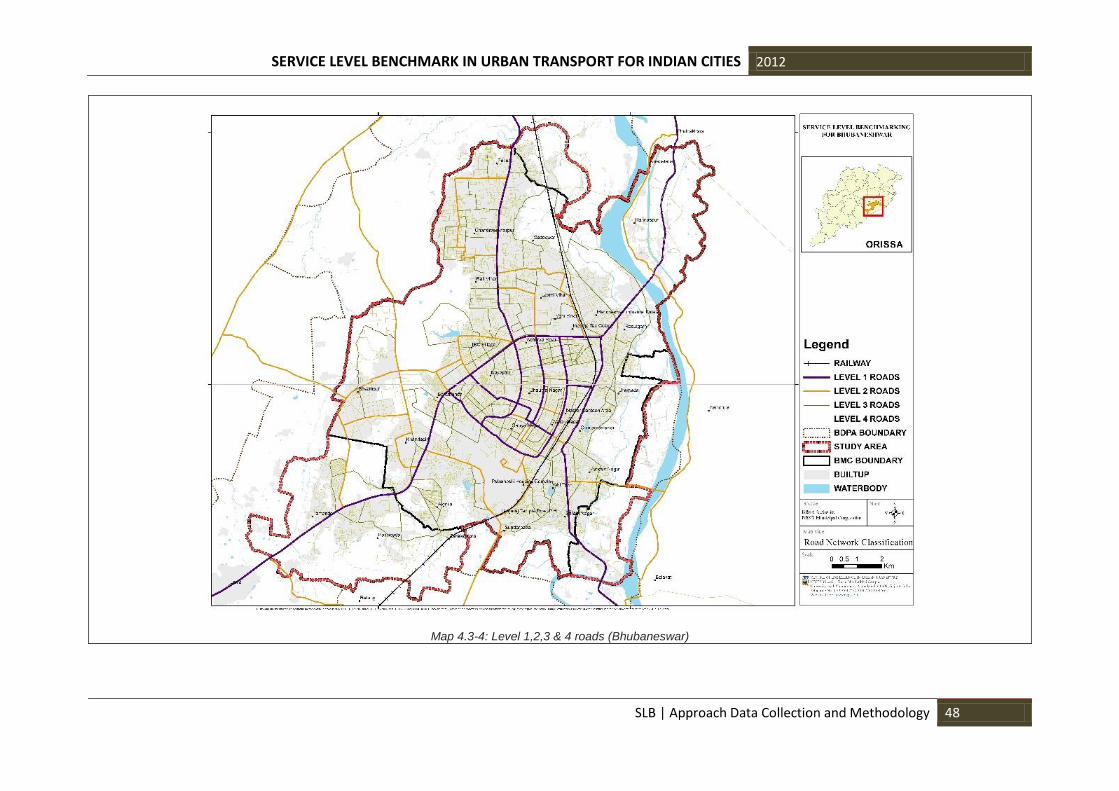
SERVICE LEVEL BENCHMARK IN URBAN TRANSPORT FOR INDIAN CITIES 2012
SLB | Approach Data Collection and Methodology 48
Map 4.3-4: Level 1,2,3 & 4 roads (Bhubaneswar)

SERVICE LEVEL BENCHMARK IN URBAN TRANSPORT FOR INDIAN CITIES 2012
SLB | Approach Data Collection and Methodology 49
Map 4.3-5: Selected road network for inventory survey

SERVICE LEVEL BENCHMARK IN URBAN TRANSPORT FOR INDIAN CITIES 2012
SLB | Approach Data Collection and Methodology 50
NOTE: key points that can also be looked into while selecting the road
network for road Inventory.
1. IRC road standard is generally used to define network in master
plans/DP hence it can be referred for further classifying and
justifying the selection.
Rings and radials along with roads having public transport make up the major network in the city.
2. Functional classification of the road.
ROAD INVENTORY
Road inventory survey is conducted on all Level 1 road and also Level 2, Level 3 roads where public transport is plying. To carry out the survey, ARCGIS is used to create a network of road in links and nodes. Whole city was divided in to grids with a purpose of creating ease for the surveyor while carrying out surveys. Road network inventory studies are useful in capturing actual road conditions, road designs, and horizontal alignments. In our studies, cycle network length, length of footpaths, road network with high encroachment levels, types of encroachment on major roads, on-street parking provisions are required to compute various indicators. Field workers complete inventory sheets (primary survey data format provided in the annexure). The data captured on site is then is attached to the GIS files to generate spatial distribution of the existing infrastructure. The data collected through road network inventory survey:
Carriageway details on both the sides of the roads
Shoulder details
Service road
Encroachments (type, length, width and nos.)
Footpath details (Width, Length And Encroachment on Footpath)
Cycle track details (Width, Length And Encroachment on Footpath)
On-street parking provision (Type, Width, Length and Nos)
Street lights
4.3.4 Methodology for primary survey
4.3.4.1 Public Transport facilities
BOARDING ALIGHTING SURVEY (LEVEL OF COMFORT IN PUBLIC TRANSPORT) The survey was conducted on key public transport corridors in the city. The key public transport corridors were identified based on headways. Headways were categorized into 3 categories to represent an equal sample of all categories of headways that were less than 60 minutes such as;
1. Less than 10 min- Survey all the routes that has less than 10minutes headways
2. 10-20 minutes- only 25% of the routes are selected through random selection
3. 20-60 min- only 25% of the routes are selected through random selection
The survey was conducted in morning and evening peak hours. The number of runs was based on the headway of the route. The maximum value for that particular route was taken as the load in that route.

SERVICE LEVEL BENCHMARK IN URBAN TRANSPORT FOR INDIAN CITIES 2012
SLB | Approach Data Collection and Methodology 51
NOTE: Key public transport corridors are defined as those corridors with service frequency less than 60 minutes as there is higher demand of public transport along these corridors.
4.3.4.2 Pedestrian Infrastructure facilities
LUX SURVEY The LUX survey was conducted taking 12 point method field
measurements as shown in the figure below:
In Typical road section with centre pole and two lamps on each side of the road, 12 readings have been taken,
3 on the edge of median,
3 in the mid carriageway and
3 on the edge of carriageway (or footpath if any).
3 more will be on shoulder or footpath whichever is present. This 12 reading method of measurement will change with the change in the arrangement of the lighting. The different type of lighting arrangements that a city can have are (as shown in figure below):-
LUX reading locations at junctions
LUX reading locations on road section having service road / footpath / shoulder.
Divided road where light poles are present only on one side of road
After measuring all the readings at the points shown above, the average of each of the quadrant is taken. Typically, the reading of lux is given by the average
of all six quadrants for roads
of two quadrants for footpath
Lighting arrangement Pole 1 Mid-Point Pole 2
Edge of the road near light P1 P2 P3
Mid road P6 P5 P6
opposite edge of the road P7 P8 P9
Edge of footpath/ shoulder P12 P11 P10
Edge of footpath/ shoulder P12 P11 P10

SERVICE LEVEL BENCHMARK IN URBAN TRANSPORT FOR INDIAN CITIES 2012
SLB | Approach Data Collection and Methodology 52
(i) LUX (road)= Q1+Q2+Q3+Q4+ Q5 + Q6 /6 (ii)Lux (footpath) = (Q5+Q6 )/ 2
(I)Lux (road) = (Q1+Q2+Q3+Q4+Q5+Q6)/6 (ii) lux (footpath) = (Q1+Q3+Q4+Q6)/ 4
LUX reading locations (typical road sections) LUX reading locations at junctions

SERVICE LEVEL BENCHMARK IN URBAN TRANSPORT FOR INDIAN CITIES 2012
SLB | Approach Data Collection and Methodology 53
(I)LUX(road) = (Q1+Q2+Q3+Q4+Q5+Q6+Q7+Q8)/8 (II)Lux (footpath) = (Q7+Q9+Q8+Q10)/ 4
(I) LUX road = (Q3+Q4+Q5+Q6+Q7+Q8+Q9+Q10)/8 (II) Lux (footpath) = (Q9+Q10+Q11+Q12)/ 4
LUX reading locations on road section having service road Divided road where light poles are present only on one side of road
LUX reading locations on road section having service road Divided road where light poles are present only on one side of road

SERVICE LEVEL BENCHMARK IN URBAN TRANSPORT FOR INDIAN CITIES 2012
SLB | Approach Data Collection and Methodology 54
4.3.4.3 Non-Motorized Transport facilities
BICYCLE PARKING SURVEY AT INTERCHANGES The survey was conducted at 250m radius of the Interchanges. Interchanges are defined in terms of both the (i) importance of “nodes” example Major bus terminals and the (ii) number of “modes” meeting at a place example Railway station. It includes; major bus stops, terminals and railway stations. After selection of the interchanges to be surveyed, in 250m radius of the interchange for identification of the bicycle parking locations present in the radius of 250m. (refer figure below) The data collected:
Locations of cycle parking in 250m buffer
Capacity of the cycle parking Width and length of the cycle parking
1. Near GRP Mandir- Yes 2. Near Fast food Parking- Yes 3. SMC Pay Park ( Near Platform No 4) –Yes 4. Print Parking ( Near Platform No 4)- Yes 5. Amisha Hotel ( One Way)- No 6. Daruwala Petrol Pump- No
Figure 4.3-2: NMV parking survey format

SERVICE LEVEL BENCHMARK IN URBAN TRANSPORT FOR INDIAN CITIES 2012
SLB | Approach Data Collection and Methodology 55
4.3.4.4 Travel speed along major corridors (Motorized & Public
Transport)
SPEED AND DELAY SURVEY ALONG MAJOR ARTERIALS Speed delay survey was conducted along the arterial roads in the city. A stop watch and GPS was used for the survey. The speed and delay survey was conducted for three modes of private vehicles namely; (i) Car (ii) 2wheeler (iii) Auto rickshaw (3Wheeler) and as for the public transport (i) City Bus service (ii) BRT. Speed and delay survey is done on the same road network which has been selected for inventory survey as given in the Map 4.3.5. For PT, the routes have been selected where buses are plying on the same corridors used for private vehicles. As per methodology mentioned in IRC:SP:19-2001: The study is conveniently conducted by the “Moving Observer” method, a test vehicle runs along with the traffic stream, at approximately the perceptible average speed of the traffic stream. A separate run is taken for each direction. The average of six runs have been taken for each corridor.
Actual running time and stopped delays have been noted down while carrying out the survey, delay locations have been marked with the help of GPS.
4.3.4.5 Integrated land use transport system
LAND USE AND INTENSITY OF DEVELOPMENT SURVEY ALONG PROPOSED BRTS
CORRIDOR The purpose of this survey was to find out the proportion of non-residential properties along the BRT corridors. A buffer area of 250metre on either side of BRT corridor was taken for the study. Before going onsite the type of land use that was in that particular plot of land was studied from the land use plan acquired from the concerned authorities. In comparison to this information received the existing land use was noted. In addition to not only study the non-residential properties along the BRT corridor, the building height was also recorded. While in the case of Ahmedabad the BRTs have started in the city, other cities like Surat, Hubli-Dharwad have also been surveyed along the under construction phase. For other city with no BRTs, the major bus routes are under consideration for surveying the land use survey BRT Corridors are divided in the grid format, to study the existing land use in individual plots. All the plots have been given one unique id, with the idea of combining collected data with the GIS files. Along with the individual grid maps, one table of all the plot numbers with existing land use is prepared. With the help of these two documents, surveyors could identify the present land use and recorded it. If the survey plots have
been divided in to two to three plots, then predominant use of the parcel is recorded. Data collected: 1) Present land use 2) Building heights

SERVICE LEVEL BENCHMARK IN URBAN TRANSPORT FOR INDIAN CITIES 2012
SLB | Data Management 56
5 Data Management
5.1 Software Development
The Data collection and Reporting tool (SLB - UT) is a web browser based
application accessible through internet connection. The tool delivers
Urban Transport scenarios of various cities in scope covering 11
benchmarks, set for service level delivery.
This software will provide a web-based tool will hold city wise data for
year wise data entry for each parameter. The tool will be available for
decision-making authorities, data administrator and public. Software will
provide a platform for comparison of SLBs – city-wise, parameter wise
and year-wise. It will also provide a platform for management and
authorization of the data through user access control.
This software will provide an easy tool for the following stakeholders:
Central government - The ministry of Urban Development & GOI
State Governments and its agencies
Urban Local Bodies / Parastatal agencies
Other decision-making/governance bodies
External departments (for interface requirements)
The Dashboard in the software presents the data in very intuitive and
easy-to-understand formats. This will help the MoUD personnel to view
the snapshot of various data’s within and across the Cities in scope in
terms of graphs and statistics.
Dashboard for the purpose of this project has been classified under the
following heads:
Tabular reports
Graphical Charts
Geographical view of SLB using maps, etc.
5.2 Importance
It is important to create one platform which will help user to store the
data, analyze the data to compute level of service for particular city and
also to compare the results with other cities, current year results with
future years. This software will also provide a tool to replicate the data
for future year, modify or add completely new data for the LoS
computation. In addition, it is web based tool, and has user access
control. This tool will authorize permissions / rights based on the type of
users i.e. data entry, ULB, State government agency and central
government. It also helps in maintaining year-wise records of the data.
5.3 Benefits
Enhanced tool to facilitate decision making on the Service Level
for all the cities in scope.
Enhanced tool for data entry with high amount of validation and
ease of operations
Enhanced ability to analyze the service level quality of all the
benchmarks at city-level.
A collaborative knowledge-oriented environment where
knowledge is shared across different regions and units.
Better co-ordination and communication with external
stakeholders through implementation of electronic information
exchange systems.
Quick exchange of accurate information with the Stakeholders

SERVICE LEVEL BENCHMARK IN URBAN TRANSPORT FOR INDIAN CITIES 2012
SLB | Data Management 57
5.4 System Requirements & Application
The web application is designed for Microsoft Internet Explorer 8.0 or
higher, Mozilla Firefox or higher and Google Chrome 25.0 or higher. The
web application will perform best on computers with a high-speed
internet connection similar to digital subscriber line (DSL), cable, or
faster. The screen resolution set to 1024x768.
This application will be available on CoE UT, CEPT University servers, thus
making it possible to interact with complex data on nearly any computer
with a web browser till a final decision on where it is hosted is taken by
MoUD. (Refer Part 4 of SLB Series)

SERVICE LEVEL BENCHMARK IN URBAN TRANSPORT FOR INDIAN CITIES 2012
SLB | Data Formats 58
6 Data Formats 6.1 Primary survey formats
6.1.1 Level of Comfort in Public Transport
LEVEL OF COMFORT IN PUBLIC TRANSPORT
City:
Name of the surveyor Date
Mode Public transport / Rapid transit Survey time
Route No. Direction:
Sr no. Bus stops Passengers Boarded Passengers Alighted
Male female Male female
Exp Lal Darwaja Terminus

SERVICE LEVEL BENCHMARK IN URBAN TRANSPORT FOR INDIAN CITIES 2012
SLB | Data Formats 59
6.1.2 Road inventory survey
Surveyor’s Name
DATE OF SURVEY
TIME OF SURVEY
From To Length (mt) Right of
way (mt) Name of the road
Median (Width in mt)
Carriage way Left_
(Type)
Carriage way Left width (mt)
Lanes Left (no.)
Carriage way Right (Type)
Carriage way Right width (mt)
Lanes Right (no.)
Side
Shoulder Service Road Grade
Separation
BRTS Carriagewa
y Encroachment on road Footpath Encroachment on footpath Cycle track
Encroachment on Cycle track
Parking Provision
No. of
Street
lights
Type (BT/CC/E
R/GR)
Width
(mt)
Width
(mt)
Length
(mt)
Width (mt)
Length (mt)
width (mt)
Type
No Width
(mt)
Length (mt)
Width (mt)
Length (mt)
Type No. Widt
h (mt)
Length (mt)
Width (mt)
Length (mt)
Type No Width (mt)
Length (mt)
Type
No Width
(mt)
Length
(mt) L
L
L
R
R
R
1 = Bituminous 2= Cement Concrete
3=Earthen 4=Gravel
Type of Encroachment 1=Shops
2=Hawkers 3=parking 4=others
Type of Parking F=Free parking
P= Paid

SERVICE LEVEL BENCHMARK IN URBAN TRANSPORT FOR INDIAN CITIES 2012
SLB | Data Formats 60
6.1.3 Speed Delay Survey (Private Vehicles)
SPEED AND DELAY SURVEY
Name of Project : Service level Benchmark for Urban Transport
Mode:
Trial Run No.:
Date:
Surveyor Name:
Run Direction:
Road Name:
Day:
Surveyor Sign:
Test Vehicle No:
Run Starting: Time:
Run Ending Time:
UP (1st Round) Corridor Link Name of
Road Map No.
Length (m)
Odometer Reading Running Time (Sec.) Stopped Delay (Sec.)
Total Time (Sec.)
Delay location
Cause of Delay From To Start End Start End
1 2
2 3
DOWN (2nd Round)
Corridor Link Name of Road
Map No.
Length (m)
Odometer Reading Running Time (Sec.) Stopped Delay (Sec.)
Total Time (Sec.)
Delay location
Cause of Delay From To Start End Start End
3 2
2 1

SERVICE LEVEL BENCHMARK IN URBAN TRANSPORT FOR INDIAN CITIES 2012
SLB | Data Formats 61
UP (3rd Round)
Corridor Link Name of Road
Map No.
Length (m)
Odometer Reading Running Time (Sec.) Stopped Delay (Sec.)
Total Time (Sec.)
Delay location
Cause of Delay From To Start End Start End
1 2
2 3
DOWN (4th Round)
Corridor Link Name of Road
Map No.
Length (m)
Odometer Reading Running Time (Sec.) Stopped Delay (Sec.)
Total Time (Sec.)
Delay location
Cause of Delay From To Start End Start End
3 2
2 1
UP (5th Round)
Corridor Link Name of Road
Map No.
Length (m)
Odometer Reading Running Time (Sec.) Stopped Delay (Sec.)
Total Time (Sec.)
Delay location
Cause of Delay From To Start End Start End
1 2
2 3
DOWN (6th Round)
Corridor Link Name of Road
Map No.
Length (m)
Odometer Reading Running Time (Sec.) Stopped Delay (Sec.)
Total Time (Sec.)
Delay location
Cause of Delay From To Start End Start End
3 2
2 1

SERVICE LEVEL BENCHMARK IN URBAN TRANSPORT FOR INDIAN CITIES 2012
SLB | Data Formats 62
6.1.4 Speed Delay Survey (Public Transport)
SPEED AND DELAY SURVEY
Name of Project : Service level Benchmark for Urban Transport
Mode:
Trial Run No.:
Date: Surveyor Name:
Run Direction:
Road Name:
Day: Surveyor Sign:
Test Vehicle No:
Run Starting Time: Run Ending Time:
UP (1st ROUND)
S.No. Route No. Node From Node To Running Time Delay
Time Cause of
Delay Start Time End Time
1
2
3
DOWN (2nd ROUND)
S.No. Route No. Node From Node To Running Time Delay
Time Cause of
Delay Start Time End Time
1
2
3

SERVICE LEVEL BENCHMARK IN URBAN TRANSPORT FOR INDIAN CITIES 2012
SLB | Data Formats 63
UP (3rd ROUND)
S.No. Route No. Node From Node To Running Time Delay
Time Cause of
Delay Start Time End Time
1
2
3
4
5
DOWN (4th ROUND)
S.No. Route No. Node From Node To Running Time Delay
Time Cause of
Delay Start Time End Time
1
2
3
UP (5th ROUND)
S.No. Route No. Node From Node To Running Time Delay
Time Cause of
Delay Start Time End Time
1
2
3
DOWN (6th ROUND)
S.No. Route No. Node From Node To Running Time Delay
Time Cause of
Delay Start Time End Time
1
2
3

SERVICE LEVEL BENCHMARK IN URBAN TRANSPORT FOR INDIAN CITIES 2012
SLB | Data Formats 64
6.1.5 Land use Survey
LAND USE SURVEY
U_ID CATEG_2011 Land use observed_2012 Building heights
1
2
3
4
5
6
Sr.no Land Use Type
1 Residential
Apartments / flats, row houses, tenements
2 Mixed Use
Shop houses, retail/office/residential complex
3 Commercial
e.g. shopping mall, dept. store, big box stores, fully-serviced office block,
4 Industrial
major industry, e.g. steel plant, petrochemical, warehouses,
5 Institutional
offices, legislative, executive, judicial, schools, institutes, universities, hospitals, clinics
6 Agriculture/forestry/aquaculture
7 Open Space (OS)
Open ground
8 Water body
Water (lakes, ponds) + wastewater
9 Others
Recreational-gardens , Religious – temples / mosque / Church, Socio Cultural –Institutional, Crematorium, solid waste dumping side

SERVICE LEVEL BENCHMARK IN URBAN TRANSPORT FOR INDIAN CITIES 2012
SLB | Data Formats 65
6.2 Secondary survey formats
Secondary Data Collection
Public Transport facility
Department : Bus operators i.e. AMTS, Janmarg etc.
City: i.e. Ahmedabad
Name Of Contact Person & Designation:
Sr. No. Particulars Details Source date
i.e. Month, year
Data source time period
i.e. for a month or year
1 Routes
1.1 Total number of routes (operating)
1.2 Routes schedule with headways 1.3 Number of routes below <=5mins headway 1.4 Number of routes below 5-10 minutes headway 1.5 Number of routes below 10-15 minutes headway 1.6 Number of routes below 15-20 minutes headway 1.7 Number of routes below 20-25 minutes headway 1.8 Number of routes below 25-30 minutes headway 1.9 Number of routes below >=30 minutes headway
2 Bus stops
2.1 Total number of bus stops
2.2 Bus stop properties i.e. poles, bus shelter
2.3 Total number of terminals & depots Terminals Depots
Names
Names
Names
Names
Names
2.4 Interchanges with PIS information
2.5 Number of bus stops / interchange / terminals or Depots

SERVICE LEVEL BENCHMARK IN URBAN TRANSPORT FOR INDIAN CITIES 2012
SLB | Data Formats 66
Secondary Data Collection
Public Transport facility
Department : Bus operators i.e. AMTS, Janmarg etc.
City: i.e. Ahmedabad
Name Of Contact Person & Designation:
Sr. No. Particulars Details Source date
i.e. Month, year
Data source time period
i.e. for a month or year having CCTVs
3 Buses
3.1 Total number of buses – bus fleet
3.2 Total number of buses on road (average of 30 days)
3.3
Type of buses (standard buses, mini buses, midi buses)
3.4 Number of buses as per UBS
3.5 Number of buses having onboard GPS/GPRS and connected to common control center
3.6 Number of breakdowns in a month / year
3.7 Number of modes with integrated ticketing systems
4 Financial sustainability
4.1 Revenue collections per annum from non-fare related sources
4.2 Non-fare revenue from advertisement on buses / bus stops
4.3 Total revenue per annum from all the sources
4.4 Total cost of operations (inclusive of depreciation, operation & maintenance and manpower etc)

SERVICE LEVEL BENCHMARK IN URBAN TRANSPORT FOR INDIAN CITIES 2012
SLB | Data Formats 67
Secondary Data Collection
Public Transport facility
Department : Bus operators i.e. AMTS, Janmarg etc.
City: i.e. Ahmedabad
Name Of Contact Person & Designation:
Sr. No. Particulars Details Source date
i.e. Month, year
Data source time period
i.e. for a month or year 4.5 Fare structure (fares per kilometers)
4.6 Total boardings per annum
4.7 Cost operated kilometers (revenue kilometers and dead kilometers)
4.8 Total staff haired ( drivers, conductors, supporting staff, administrative staff and officials for operations and maintenance)
Secondary Data Collection
Traffic police
Department : Traffic police i.e. police station name
City: i.e. Ahmedabad
Name Of Contact Person & Designation:
Sr. No. Particulars Details Source date
i.e. Month, year
Data source time period
i.e. for a month or year
1 Signalised Intersection
1.1 Total number of major intersection in the city 1.2 Total number of signalized intersection in the city
1.3 Total number of signalized intersections with pedestrian phasing
1.4 Phasing plans for the signalized intersections

SERVICE LEVEL BENCHMARK IN URBAN TRANSPORT FOR INDIAN CITIES 2012
SLB | Data Formats 68
Secondary Data Collection
Traffic police
Department : Traffic police i.e. police station name
City: i.e. Ahmedabad
Name Of Contact Person & Designation:
Sr. No. Particulars Details Source date
i.e. Month, year
Data source time period
i.e. for a month or year 1.5 Number of intersections with traffic police enforcement 1.6 Number of signals which are synchronized 1.7 Number of intersections with CCTVs installed
2 Parking
2.1 List of on-street parking facilities
2.2 Total available on street paid parking facilities
2.3 Parking fees
1) In core city area 2) Whole city
3 Accidents
3.1 Total number of fatal accidents recorded in road accidents
3.2 Total number of fatalities in road accidents
3.3 Total number of pedestrian fatalities in road accidents
3.4 Total number of serious injuries recorded in road accidents

SERVICE LEVEL BENCHMARK IN URBAN TRANSPORT FOR INDIAN CITIES 2012
SLB | Data Formats 69
Secondary Data Collection
Pollution control board
Department : Pollution control board i.e. GPCB
City: i.e. Ahmedabad
Name Of Contact Person & Designation:
Sr. No. Particulars Details Source date
i.e. Month, year
Data source time period
i.e. for a month or year
1 Pollution control monitoring records
1.1 Total number of monitoring stations in the city 1.2 Annual Mean Concentration Range (μg/m3) S02
1.3 Annual Mean Concentration Range (μg/m3) NOx 1.4 Annual Mean Concentration Range (μg/m3) SPM / (PM10)
1.5 Annual Mean Concentration Range (μg/m3) RSPM /
(PM2.5)
Secondary Data Collection
Regional Transport Office
Department : RTO i.e. RTO, Ahmedabad
City: i.e. Ahmedabad
Name Of Contact Person & Designation:
Sr. No. Particulars Details Source date
i.e. Month, year
Data source time period
i.e. for a month or year
1 Regional Transport Office
1.1 Total number of vehicles registered
1.2 Total number of auto rickshaws with GPS installed

SERVICE LEVEL BENCHMARK IN URBAN TRANSPORT FOR INDIAN CITIES 2012
SLB | Data Formats 70
Secondary Data Collection
Municipal corporations / Development Authorities
Department : Municipal Authorities i.e. AUDA/AMC
City: i.e. Ahmedabad
Name Of Contact Person & Designation:
Sr. No. Particulars Details Source date
i.e. Month, year
Data source time period
i.e. for a month or year
1 Area information 1.1 Areas of municipal boundary 1.2 Total number of wards / zones 1.3 Wards/zones/villages boundaries 1.4 Population as per current census – zone wise 1.5 Existing Land use
2 Road network
2.1 Total length of road network
2.2 RoWs of existing road network
2.3 Existing classification of the road network if any.
2.4 List of existing bridges, flyovers and railway bridges and underpasses in the city
3 NMT Parking
3.1 NMT parking facilities provided at interchanges Names Capacity Names Capacity Names Capacity
Names Capacity Names Capacity
4 Parking
4.1 List of on-street parking facilities
4.2 Total available on street paid parking facilities

SERVICE LEVEL BENCHMARK IN URBAN TRANSPORT FOR INDIAN CITIES 2012
SLB | Data Formats 71
Secondary Data Collection
Municipal corporations / Development Authorities
Department : Municipal Authorities i.e. AUDA/AMC
City: i.e. Ahmedabad
Name Of Contact Person & Designation:
Sr. No. Particulars Details Source date
i.e. Month, year
Data source time period
i.e. for a month or year
1 Area information 1.1 Areas of municipal boundary 1.2 Total number of wards / zones 1.3 Wards/zones/villages boundaries 1.4 Population as per current census – zone wise 1.5 Existing Land use
2 Road network
2.1 Total length of road network
2.2 RoWs of existing road network
2.3 Existing classification of the road network if any.
2.4 List of existing bridges, flyovers and railway bridges and underpasses in the city
4.3 Parking fees
3) In core city area 4) Whole city
5 Integrated Land use & Transport system
5.1 FSI
5.2 FSI along transit corridors

SERVICE LEVEL BENCHMARK IN URBAN TRANSPORT FOR INDIAN CITIES 2012
SLB | Bibliography 72
Bibliography 1. Manual for Survey, Investigation and preparation of road projects. (2001). India Road Congress.
2. Ministry of Ubran Development. (2006). National Urban Transport Policy.
3. Ministry of Urban Development . (2008). Service Level Benchmarks for Urban transport at a glance.
4. Ministry of Urban Development . (2010). National Mission Habitat Suatainable India.
5.Alpert, D. (2010, April 9). http://greatergreaterwashington.org/. Retrieved from greatergreaterwashington.org:
http://greatergreaterwashington.org/post/5478/what-is-mixed-use/
6. Bärlund, G. (2000). Benchmarking in Transport. Transport Benchmarking Methodologies, Applications & Data needs. Paris: European conference of
Ministers of Transport (ECMT).
7. Hongyang, W., Yulin, J., Hu, P., & Suoxiang, C. (n.d.). Benchmarking Efficiency of Urban Transport Systems in China. Retrieved from
http://www.fut.se/download/18.778e24d112a169fd1c180006158/Wu+-+Benchmarking+efficiency.pdf
8. (2010). 5. Wobbe, W. (2000). Benchmarking methods and their application. Transport Benchmarking Methodologies, Applications & Data needs. Paris:
European conference of Ministers of Transport (ECMT).