Service Desk Benchmark - Amazon Simple Storage Service · SAMPLE REPORT ONLY: DATA IS NOT ACCURATE!...
98
SAMPLE REPORT ONLY: DATA IS NOT ACCURATE! Service Desk Benchmark United Kingdom In-house/Insourced Service Desk Benchmark
Transcript of Service Desk Benchmark - Amazon Simple Storage Service · SAMPLE REPORT ONLY: DATA IS NOT ACCURATE!...
SAMPLE REPORT ONLY: DATA IS NOT ACCURATE!
Service Desk BenchmarkUnited Kingdom
In-house/Insourced Service Desk Benchmark
SAMPLE REPORT ONLY: DATA IS NOT ACCURATE!
1
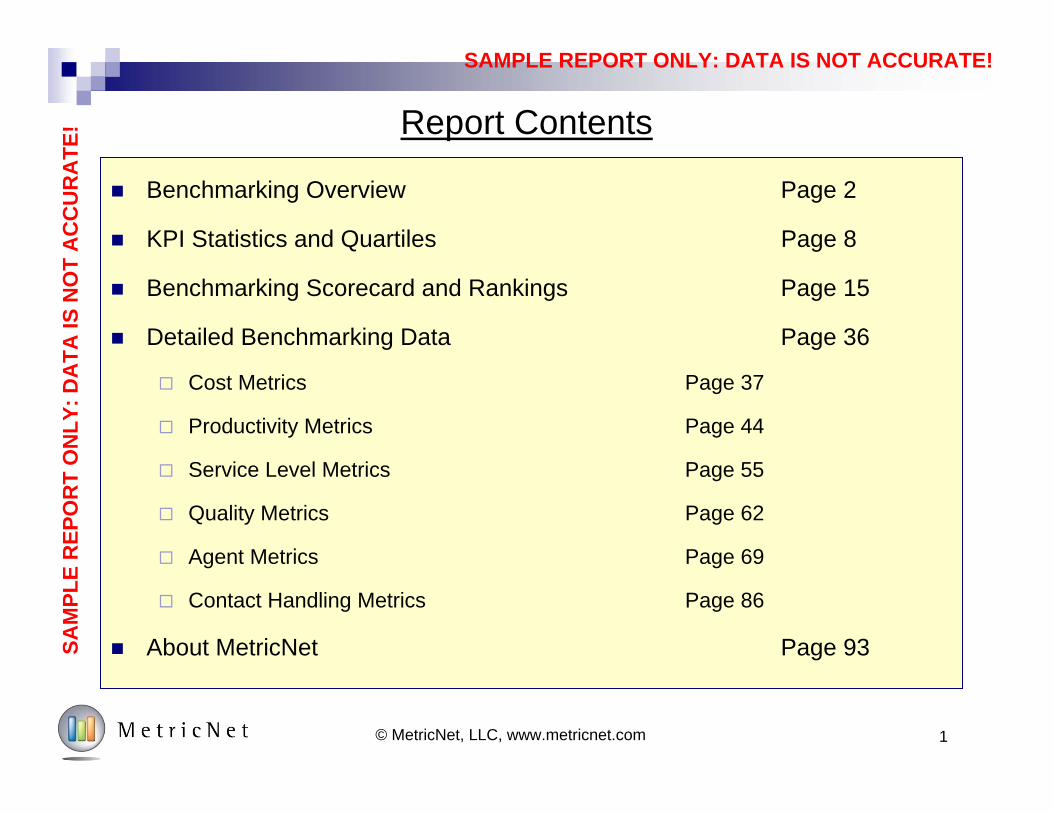
Report Contents
Benchmarking Overview Page 2
KPI Statistics and Quartiles Page 8
Benchmarking Scorecard and Rankings Page 15
Detailed Benchmarking Data Page 36
Cost Metrics Page 37
Productivity Metrics Page 44
Service Level Metrics Page 55
Quality Metrics Page 62
Agent Metrics Page 69
Contact Handling Metrics Page 86
About MetricNet Page 93
© MetricNet, LLC, www.metricnet.com
SAM
PLE
REP
OR
T O
NLY
: DA
TA IS
NO
T A
CC
UR
ATE
!

SAMPLE REPORT ONLY: DATA IS NOT ACCURATE!
Benchmarking Overview
2© MetricNet, LLC, www.metricnet.com
SAMPLE REPORT ONLY: DATA IS NOT ACCURATE!
3© MetricNet, LLC, www.metricnet.com
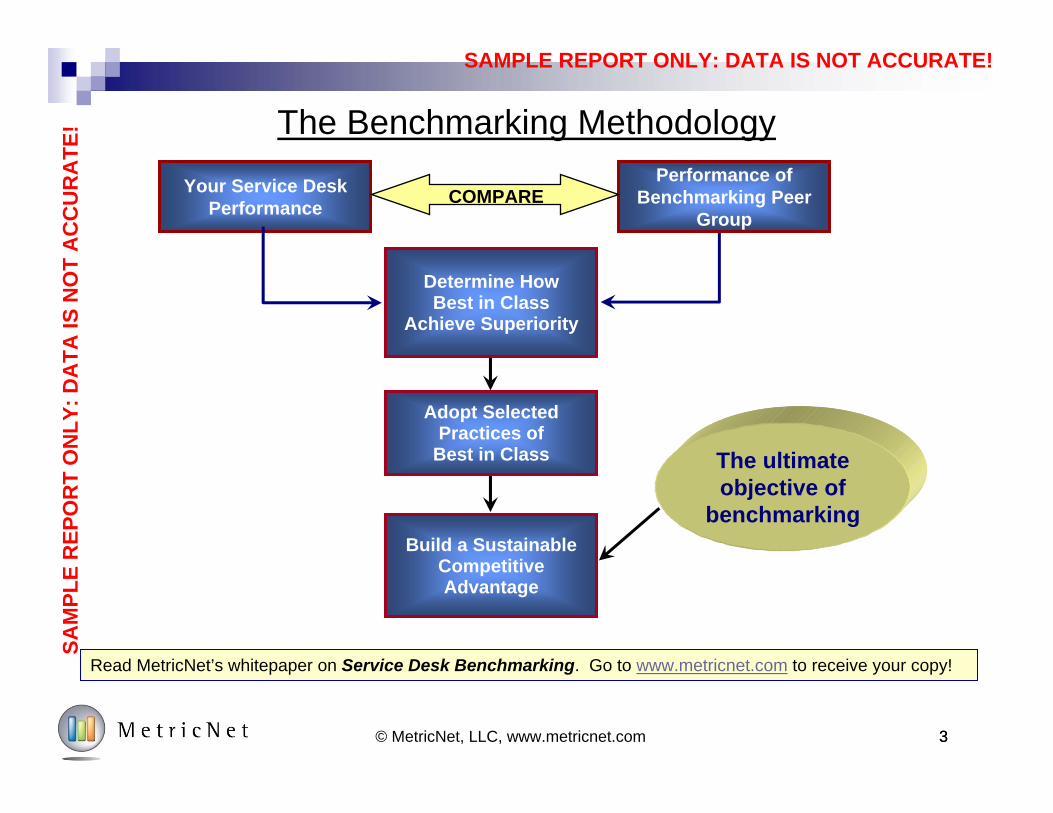
Your Service Desk Performance
Performance of Benchmarking Peer
Group
Determine How Best in Class
Achieve Superiority
Adopt Selected Practices of
Best in Class
Build a Sustainable Competitive Advantage
The ultimate objective of
benchmarking
COMPARE
The Benchmarking Methodology
3
Read MetricNet’s whitepaper on Service Desk Benchmarking. Go to www.metricnet.com to receive your copy!
SAM
PLE
REP
OR
T O
NLY
: DA
TA IS
NO
T A
CC
UR
ATE
!
SAMPLE REPORT ONLY: DATA IS NOT ACCURATE!
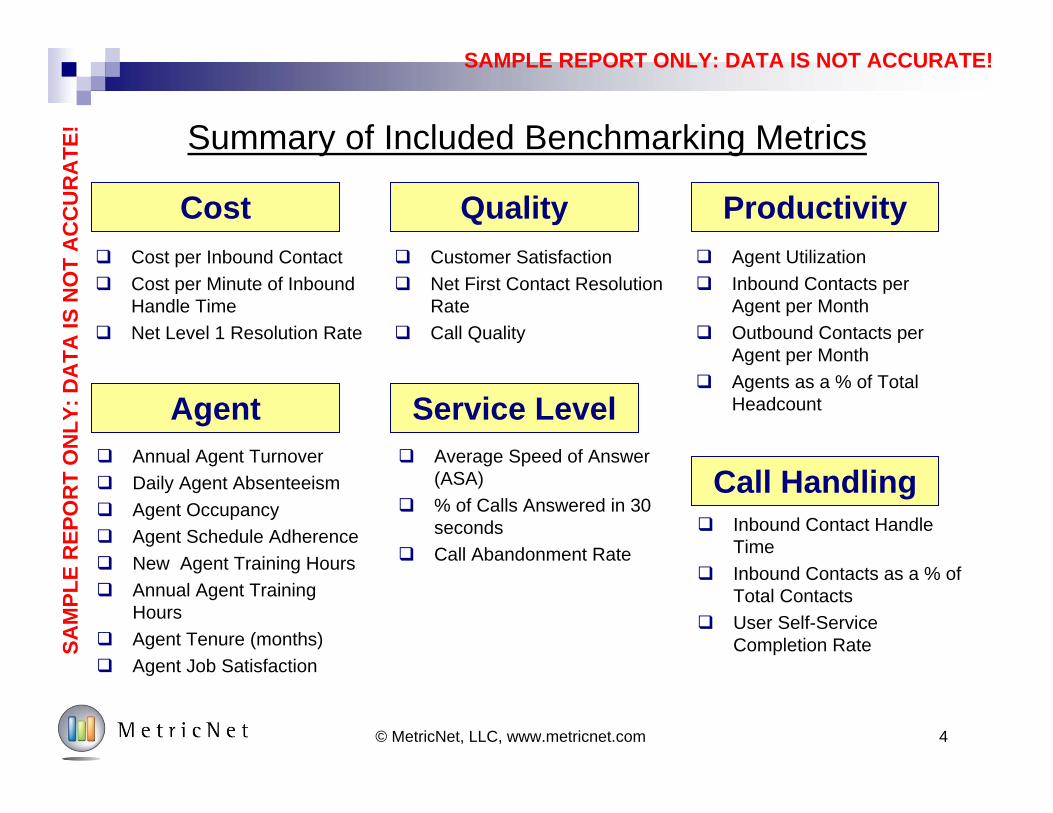
Summary of Included Benchmarking Metrics
Cost per Inbound Contact Cost per Minute of Inbound
Handle Time Net Level 1 Resolution Rate
Cost Productivity
Service Level
Quality
Call Handling
Agent Average Speed of Answer
(ASA) % of Calls Answered in 30
seconds Call Abandonment Rate
Agent Utilization Inbound Contacts per
Agent per Month Outbound Contacts per
Agent per Month Agents as a % of Total
Headcount
Customer Satisfaction Net First Contact Resolution
Rate Call Quality
Annual Agent Turnover Daily Agent Absenteeism Agent Occupancy Agent Schedule Adherence New Agent Training Hours Annual Agent Training
Hours Agent Tenure (months) Agent Job Satisfaction
Inbound Contact Handle Time
Inbound Contacts as a % of Total Contacts
User Self-Service Completion Rate
© MetricNet, LLC, www.metricnet.com 4
SAM
PLE
REP
OR
T O
NLY
: DA
TA IS
NO
T A
CC
UR
ATE
!
SAMPLE REPORT ONLY: DATA IS NOT ACCURATE!
5
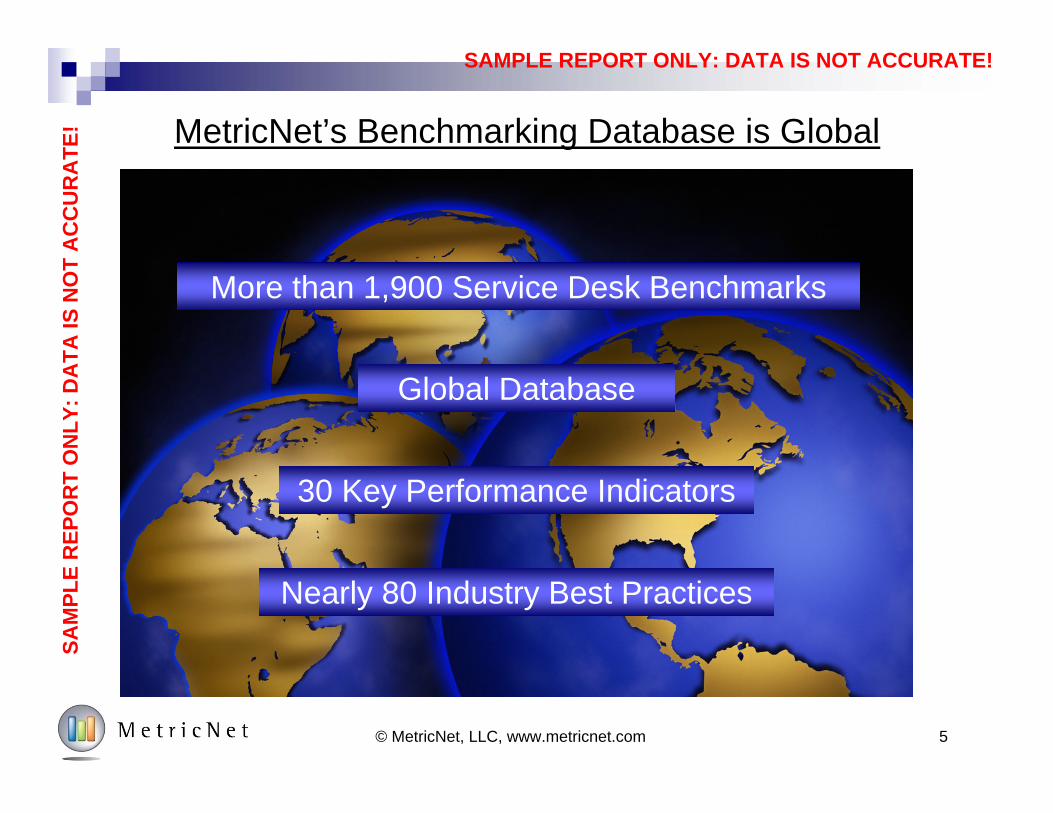
MetricNet’s Benchmarking Database is Global
More than 1,900 Service Desk Benchmarks
Global Database
30 Key Performance Indicators
Nearly 80 Industry Best Practices
© MetricNet, LLC, www.metricnet.com
SAM
PLE
REP
OR
T O
NLY
: DA
TA IS
NO
T A
CC
UR
ATE
!
SAMPLE REPORT ONLY: DATA IS NOT ACCURATE!
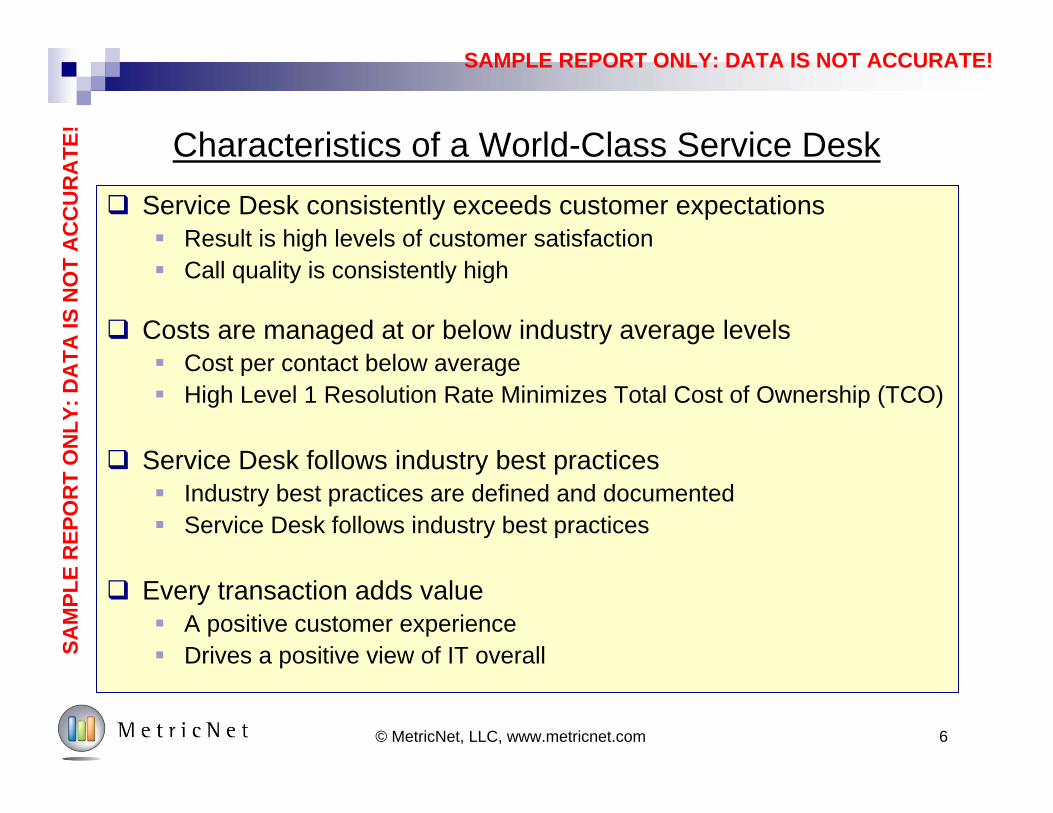
Characteristics of a World-Class Service Desk
Service Desk consistently exceeds customer expectations Result is high levels of customer satisfaction Call quality is consistently high
Costs are managed at or below industry average levels Cost per contact below average High Level 1 Resolution Rate Minimizes Total Cost of Ownership (TCO)
Service Desk follows industry best practices Industry best practices are defined and documented Service Desk follows industry best practices
Every transaction adds value A positive customer experience Drives a positive view of IT overall
6© MetricNet, LLC, www.metricnet.com
SAM
PLE
REP
OR
T O
NLY
: DA
TA IS
NO
T A
CC
UR
ATE
!
SAMPLE REPORT ONLY: DATA IS NOT ACCURATE!
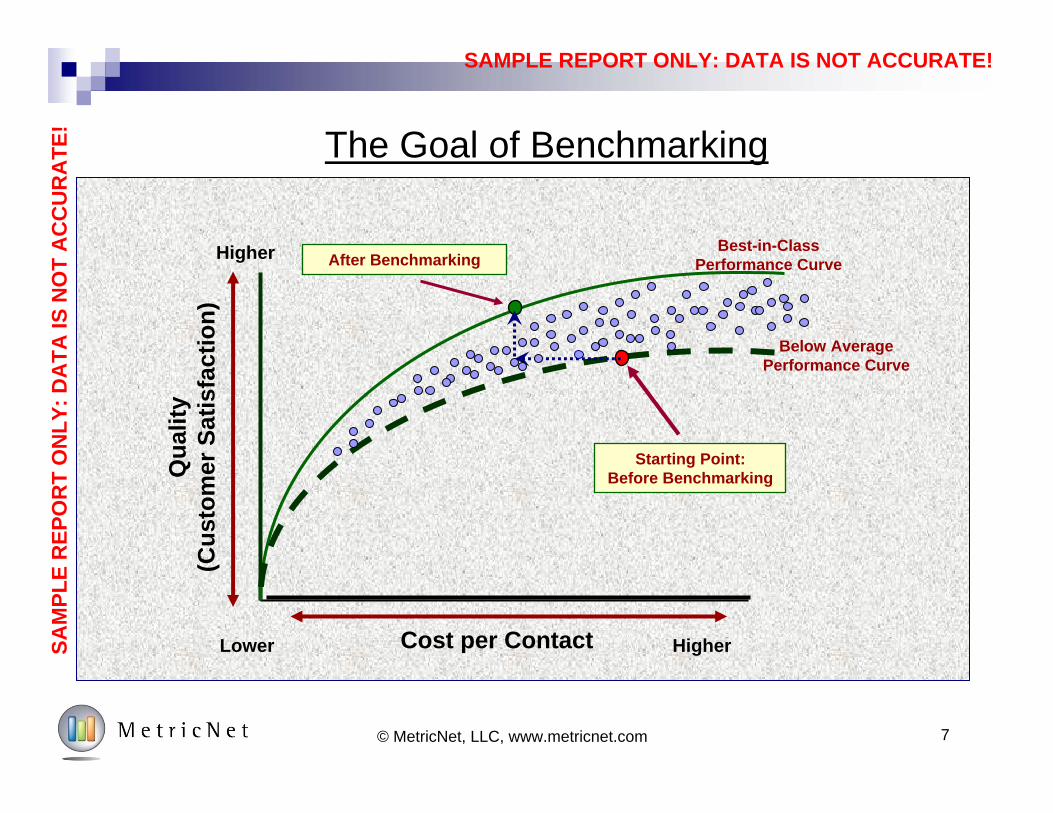
Cost per Contact
Qua
lity
(Cus
tom
er S
atis
fact
ion)
HigherLower
Higher After Benchmarking
Starting Point:Before Benchmarking
Best-in-Class Performance Curve
Below Average Performance Curve
The Goal of Benchmarking
7© MetricNet, LLC, www.metricnet.com
SAM
PLE
REP
OR
T O
NLY
: DA
TA IS
NO
T A
CC
UR
ATE
!
SAMPLE REPORT ONLY: DATA IS NOT ACCURATE!
KPI Statistics and Quartiles
8© MetricNet, LLC, www.metricnet.com
SAMPLE REPORT ONLY: DATA IS NOT ACCURATE!
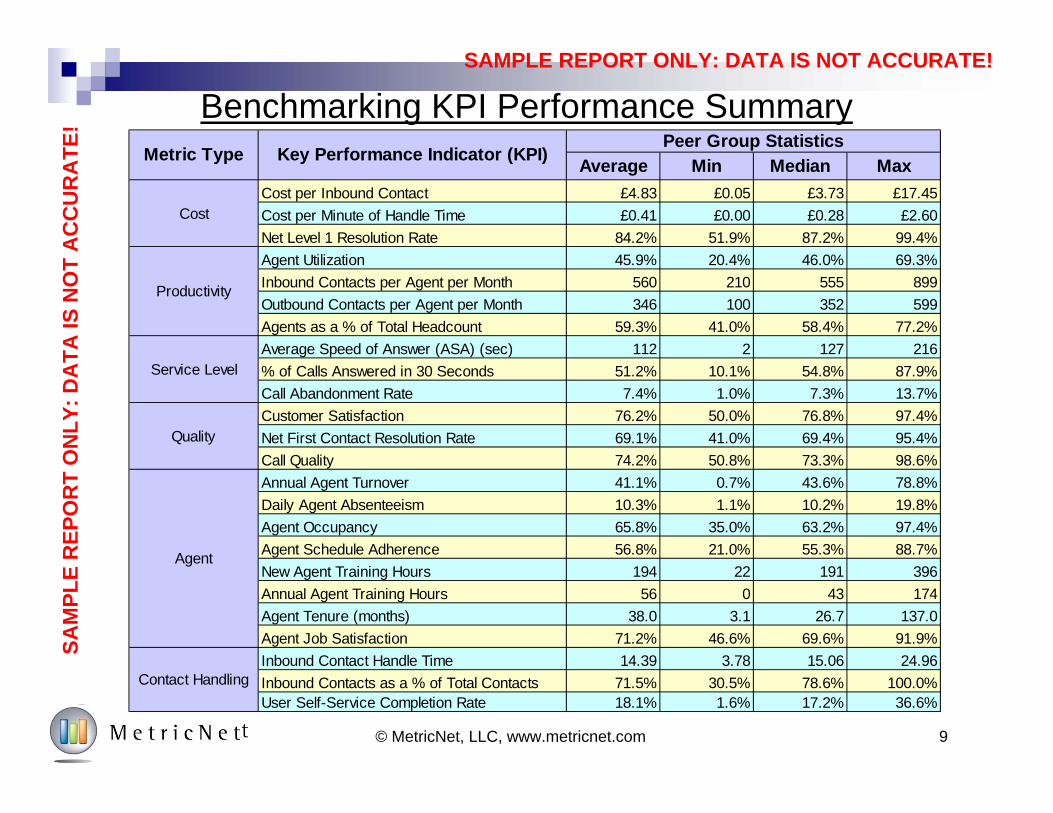
Benchmarking KPI Performance Summary
9© MetricNet, LLC, www.metricnet.com
SAM
PLE
REP
OR
T O
NLY
: DA
TA IS
NO
T A
CC
UR
ATE
!
Average Min Median MaxCost per Inbound Contact £4.83 £0.05 £3.73 £17.45Cost per Minute of Handle Time £0.41 £0.00 £0.28 £2.60Net Level 1 Resolution Rate 84.2% 51.9% 87.2% 99.4%Agent Utilization 45.9% 20.4% 46.0% 69.3%Inbound Contacts per Agent per Month 560 210 555 899Outbound Contacts per Agent per Month 346 100 352 599Agents as a % of Total Headcount 59.3% 41.0% 58.4% 77.2%Average Speed of Answer (ASA) (sec) 112 2 127 216% of Calls Answered in 30 Seconds 51.2% 10.1% 54.8% 87.9%Call Abandonment Rate 7.4% 1.0% 7.3% 13.7%Customer Satisfaction 76.2% 50.0% 76.8% 97.4%Net First Contact Resolution Rate 69.1% 41.0% 69.4% 95.4%Call Quality 74.2% 50.8% 73.3% 98.6%Annual Agent Turnover 41.1% 0.7% 43.6% 78.8%Daily Agent Absenteeism 10.3% 1.1% 10.2% 19.8%Agent Occupancy 65.8% 35.0% 63.2% 97.4%Agent Schedule Adherence 56.8% 21.0% 55.3% 88.7%New Agent Training Hours 194 22 191 396Annual Agent Training Hours 56 0 43 174Agent Tenure (months) 38.0 3.1 26.7 137.0Agent Job Satisfaction 71.2% 46.6% 69.6% 91.9%Inbound Contact Handle Time 14.39 3.78 15.06 24.96Inbound Contacts as a % of Total Contacts 71.5% 30.5% 78.6% 100.0%User Self-Service Completion Rate 18.1% 1.6% 17.2% 36.6%
Productivity
Peer Group StatisticsKey Performance Indicator (KPI)Metric Type
Cost
Service Level
Quality
Agent
Contact Handling
SAMPLE REPORT ONLY: DATA IS NOT ACCURATE!
10© MetricNet, LLC, www.metricnet.com
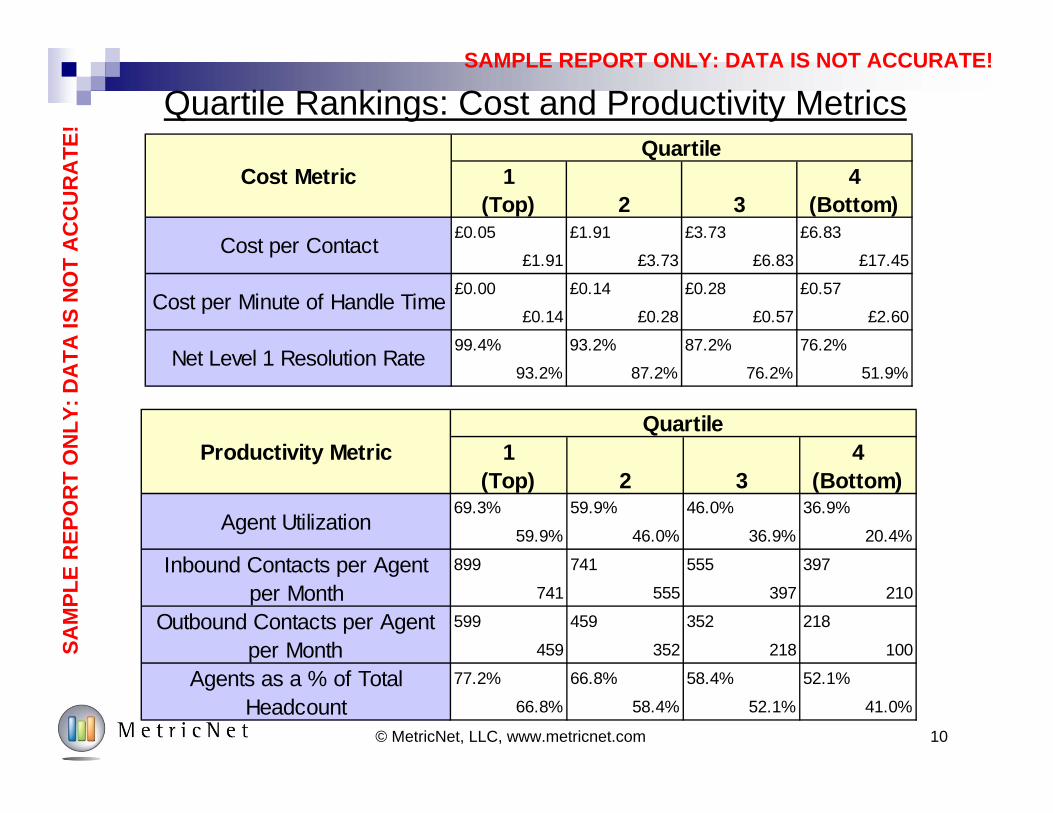
Quartile Rankings: Cost and Productivity MetricsSA
MPL
E R
EPO
RT
ON
LY: D
ATA
IS N
OT
AC
CU
RA
TE!
397
741 555 397
Productivity MetricQuartile
Inbound Contacts per Agent per Month
1 (Top) 2 3
4 (Bottom)
210
Agent Utilization69.3%
459 352 218 100
218
Agents as a % of Total Headcount
59.9% 46.0% 36.9%
Outbound Contacts per Agent per Month
599 459 352
899 741
41.0%
59.9% 46.0% 36.9%
20.4%
555
52.1%77.2% 66.8% 58.4%
66.8% 58.4% 52.1%
Cost MetricQuartile
Cost per Contact
1 (Top) 2 3
4 (Bottom)
£17.45
£0.05 £1.91 £3.73 £6.83
£1.91 £3.73 £6.83
Cost per Minute of Handle Time£0.00 £0.14 £0.28
£0.14 £0.28 £0.57 £2.60
£0.57
87.2% 76.2%Net Level 1 Resolution Rate
93.2% 87.2% 76.2% 51.9%
99.4% 93.2%
SAMPLE REPORT ONLY: DATA IS NOT ACCURATE!
11© MetricNet, LLC, www.metricnet.com
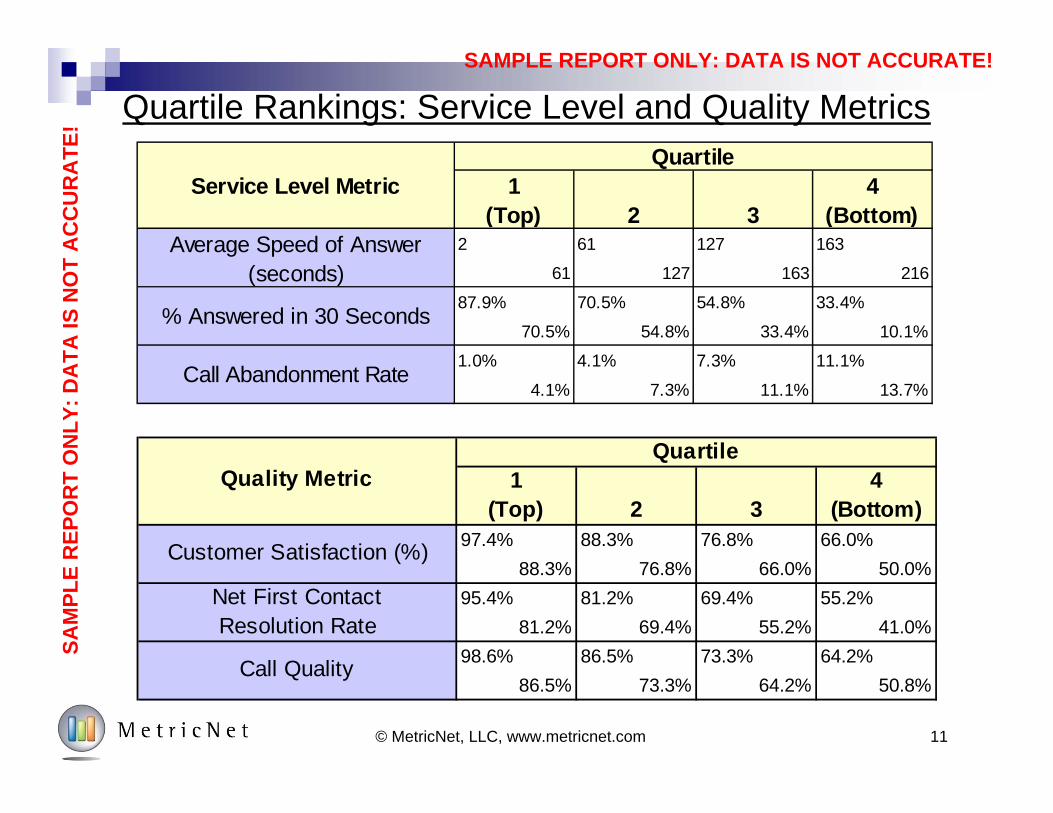
Quartile Rankings: Service Level and Quality Metrics
81.2% 69.4% 55.2% 41.0%55.2%Net First Contact
Resolution Rate95.4% 81.2% 69.4%
88.3% 76.8%88.3% 76.8% 66.0% 50.0%
66.0%
98.6% 86.5% 73.3% 64.2%86.5% 73.3% 64.2%
Quality MetricQuartile
Call Quality
1 (Top) 2 3
4 (Bottom)
50.8%
Customer Satisfaction (%) 97.4%
SAM
PLE
REP
OR
T O
NLY
: DA
TA IS
NO
T A
CC
UR
ATE
!
Quartile1
(Top) 2 34
(Bottom)Average Speed of Answer
(seconds)2 61 127 163
Service Level Metric
61 127 163 216
Call Abandonment Rate1.0% 4.1% 7.3%
4.1% 7.3% 11.1% 13.7%
11.1%
% Answered in 30 Seconds87.9% 70.5% 54.8% 33.4%
70.5% 54.8% 33.4% 10.1%
SAMPLE REPORT ONLY: DATA IS NOT ACCURATE!
12© MetricNet, LLC, www.metricnet.com
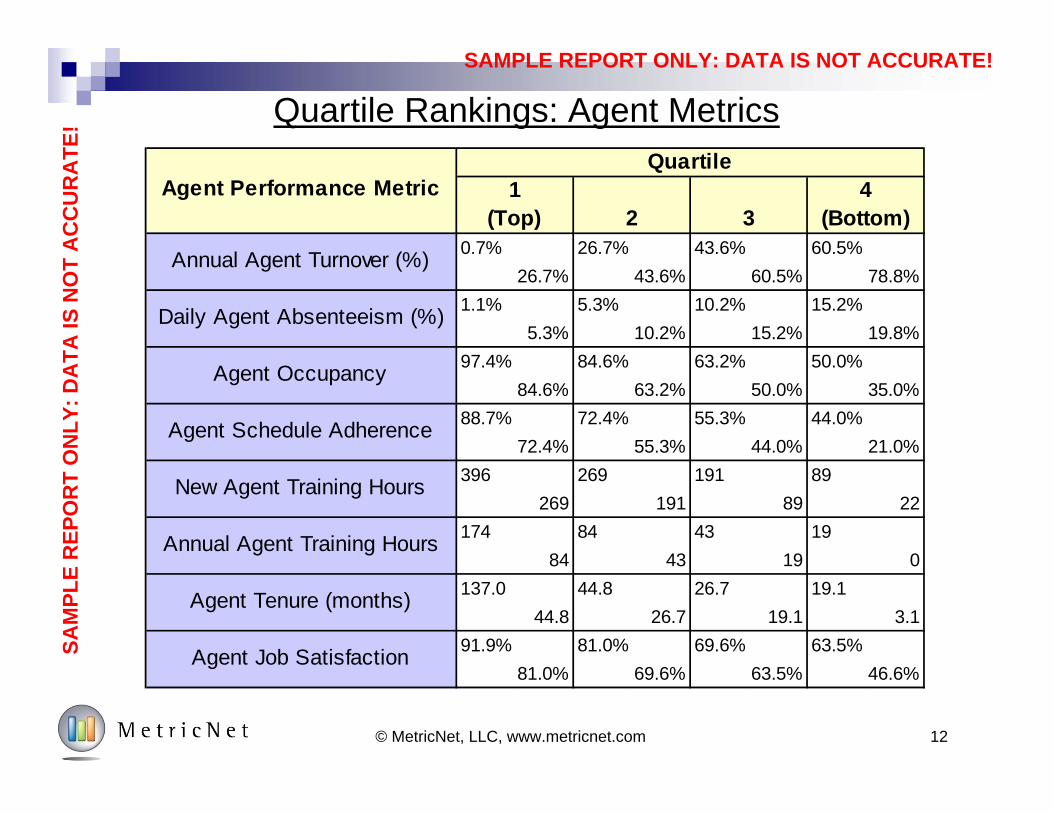
Quartile Rankings: Agent Metrics
Agent Performance MetricQuartile
1 (Top) 2 3
4 (Bottom)
26.7% 43.6% 60.5% 78.8%60.5%
Daily Agent Absenteeism (%) 1.1% 5.3% 10.2%
Annual Agent Turnover (%) 0.7% 26.7% 43.6%
5.3% 10.2% 15.2% 19.8%15.2%
2289
Annual Agent Training Hours 174269 191
New Agent Training Hours 396 269
4384
84
19189
3.119.1
194319 0
81.0% 69.6% 63.5% 46.6%63.5%
Agent Tenure (months)
Agent Job Satisfaction 91.9% 81.0% 69.6%
137.0 44.8 26.7 19.144.8 26.7
Agent Schedule Adherence
Agent Occupancy
88.7%72.4%
84.6%72.4% 55.3% 44.0%
55.3% 44.0% 21.0%
97.4% 84.6% 63.2% 50.0%63.2% 50.0% 35.0%
SAM
PLE
REP
OR
T O
NLY
: DA
TA IS
NO
T A
CC
UR
ATE
!
SAMPLE REPORT ONLY: DATA IS NOT ACCURATE!
13© MetricNet, LLC, www.metricnet.com
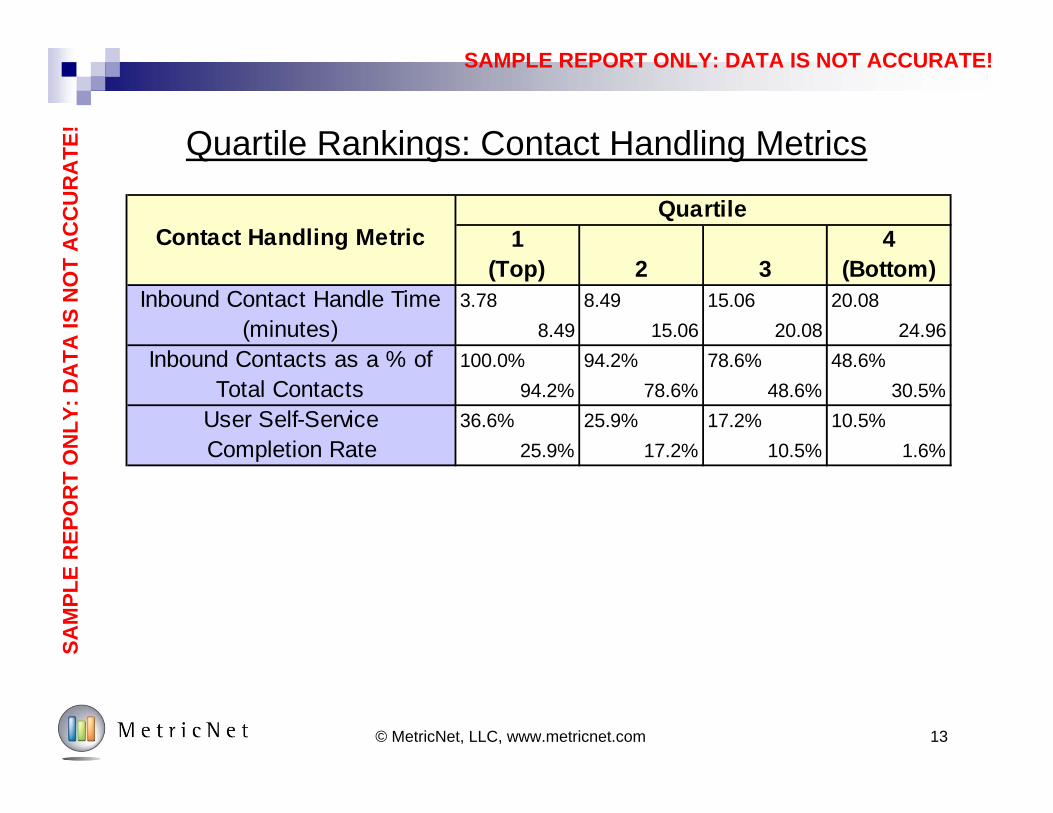
Quartile Rankings: Contact Handling Metrics
Contact Handling MetricQuartile
Inbound Contact Handle Time (minutes)
1 (Top) 2 3
4 (Bottom)
24.963.78 8.49 15.06 20.08
8.49 15.06 20.08
User Self-Service Completion Rate
36.6% 25.9% 17.2%
Inbound Contacts as a % of Total Contacts
25.9% 17.2% 10.5% 1.6%10.5%
100.0% 94.2% 78.6% 48.6%94.2% 78.6% 48.6% 30.5%
SAM
PLE
REP
OR
T O
NLY
: DA
TA IS
NO
T A
CC
UR
ATE
!
SAMPLE REPORT ONLY: DATA IS NOT ACCURATE!
14© MetricNet, LLC, www.metricnet.com 14
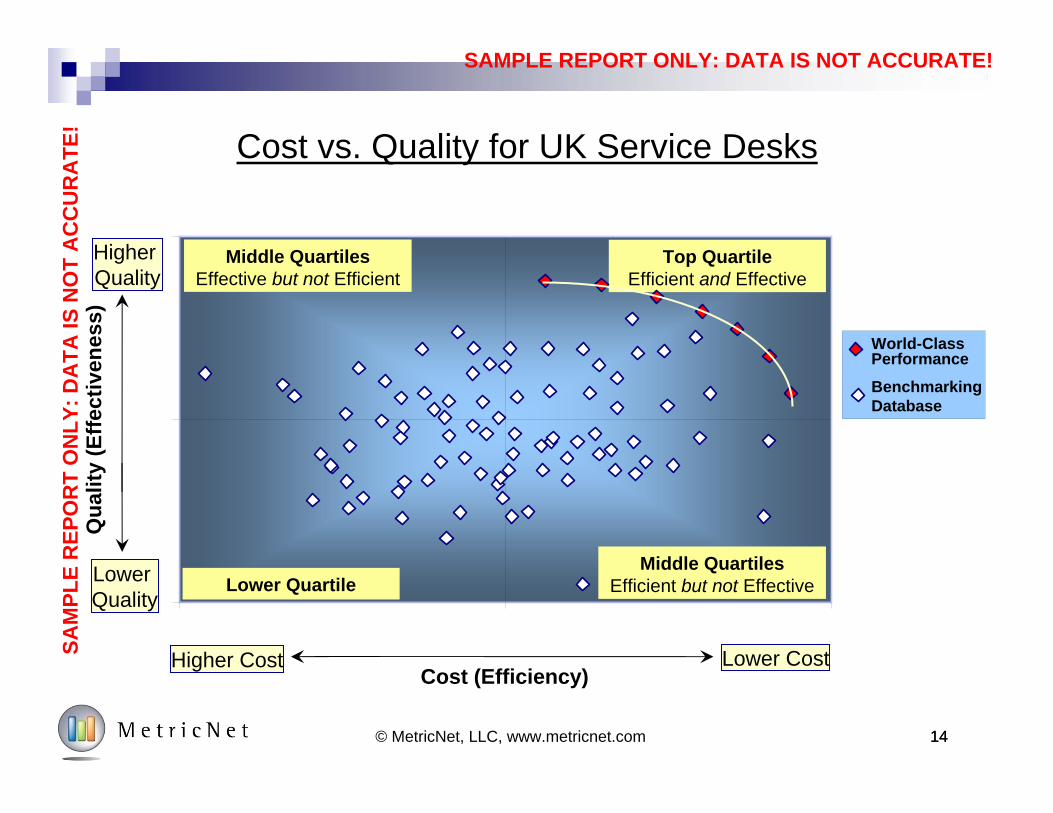
Lower CostCost (Efficiency)
Qua
lity
(Effe
ctiv
enes
s)
Top QuartileEfficient and Effective
Lower Quartile
Middle QuartilesEffective but not Efficient
Middle QuartilesEfficient but not Effective
World-ClassPerformance
BenchmarkingDatabase
Higher Cost
Lower Quality
Higher Quality
SAM
PLE
REP
OR
T O
NLY
: DA
TA IS
NO
T A
CC
UR
ATE
!
Cost vs. Quality for UK Service Desks

SAMPLE REPORT ONLY: DATA IS NOT ACCURATE!
Benchmarking Scorecard and Rankings
15© MetricNet, LLC, www.metricnet.com
SAMPLE REPORT ONLY: DATA IS NOT ACCURATE!
16© MetricNet, LLC, www.metricnet.com
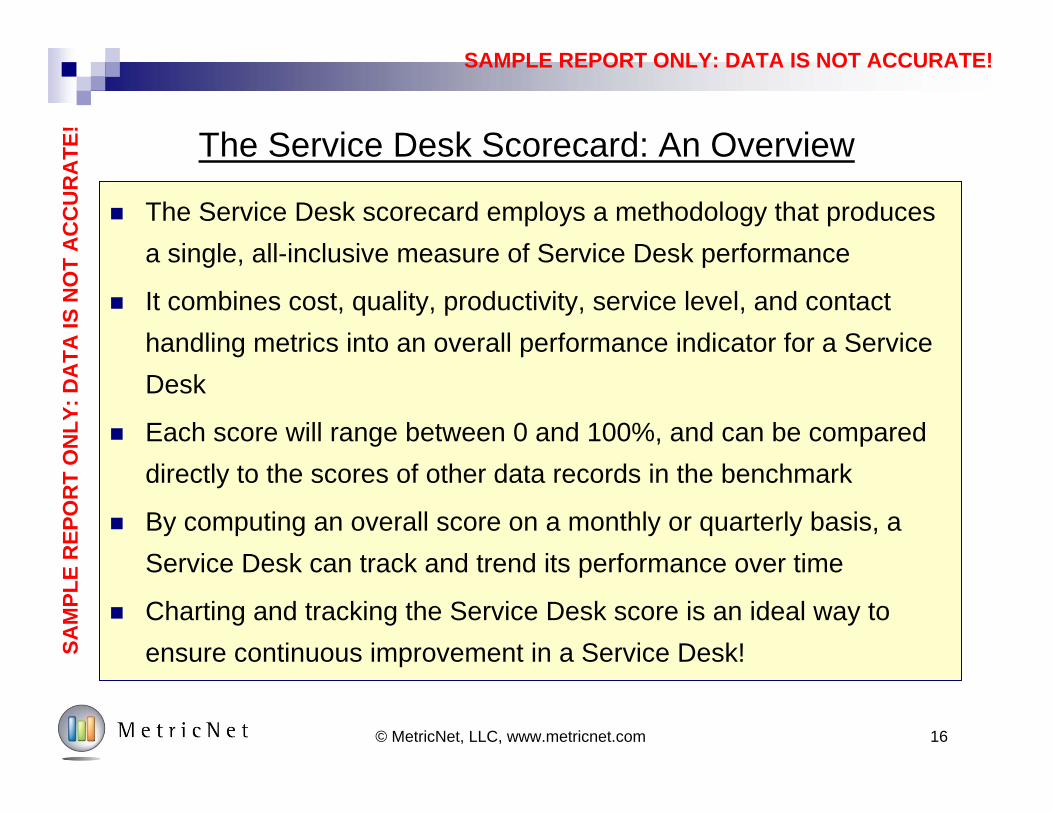
The Service Desk Scorecard: An Overview
SAM
PLE
REP
OR
T O
NLY
: DA
TA IS
NO
T A
CC
UR
ATE
!
The Service Desk scorecard employs a methodology that produces a single, all-inclusive measure of Service Desk performance
It combines cost, quality, productivity, service level, and contact handling metrics into an overall performance indicator for a Service Desk
Each score will range between 0 and 100%, and can be compared directly to the scores of other data records in the benchmark
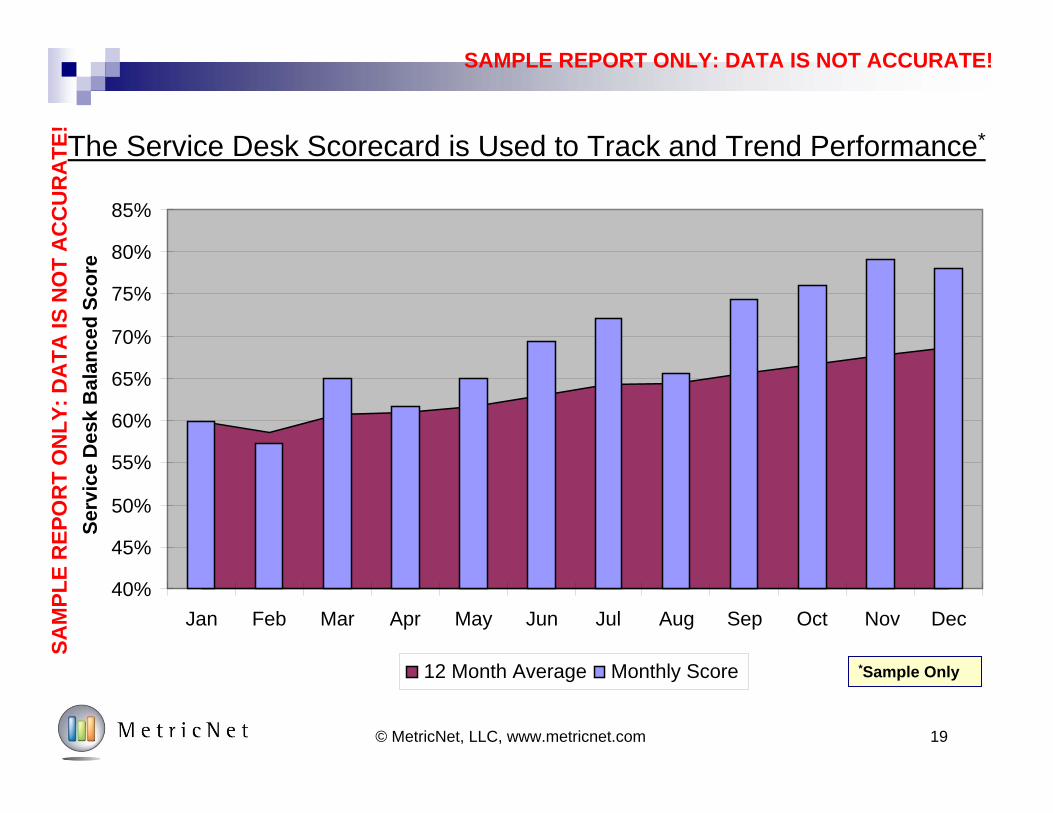
By computing an overall score on a monthly or quarterly basis, aService Desk can track and trend its performance over time
Charting and tracking the Service Desk score is an ideal way to ensure continuous improvement in a Service Desk!
SAMPLE REPORT ONLY: DATA IS NOT ACCURATE!
17© MetricNet, LLC, www.metricnet.com
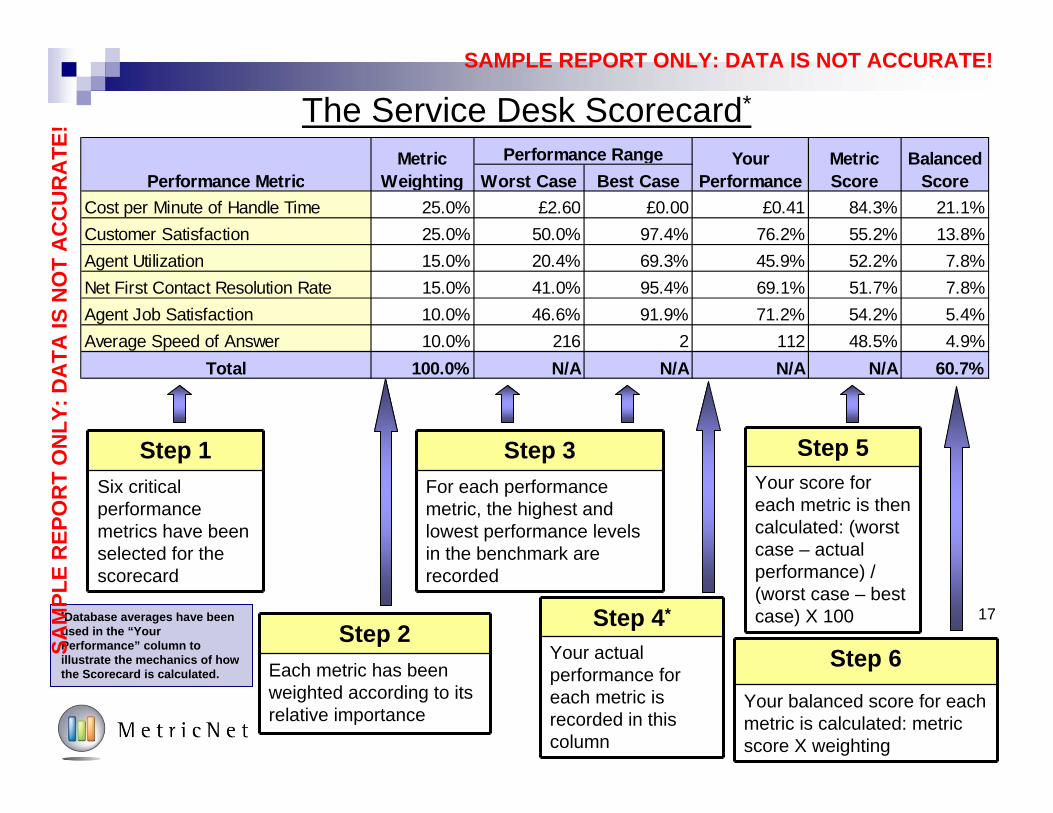
The Service Desk Scorecard*
Step 1Six critical performance metrics have been selected for the scorecard
Step 2Each metric has been weighted according to its relative importance
Step 3For each performance metric, the highest and lowest performance levels in the benchmark are recorded
Step 4*
Your actual performance for each metric is recorded in this column
Step 5Your score for each metric is then calculated: (worst case – actual performance) / (worst case – best case) X 100
Step 6Your balanced score for each metric is calculated: metric score X weighting
17*Database averages have been used in the “Your Performance” column to illustrate the mechanics of how the Scorecard is calculated.
SAM
PLE
REP
OR
T O
NLY
: DA
TA IS
NO
T A
CC
UR
ATE
!
Worst Case Best CaseCost per Minute of Handle Time 25.0% £2.60 £0.00 £0.41 84.3% 21.1%Customer Satisfaction 25.0% 50.0% 97.4% 76.2% 55.2% 13.8%Agent Utilization 15.0% 20.4% 69.3% 45.9% 52.2% 7.8%Net First Contact Resolution Rate 15.0% 41.0% 95.4% 69.1% 51.7% 7.8%Agent Job Satisfaction 10.0% 46.6% 91.9% 71.2% 54.2% 5.4%Average Speed of Answer 10.0% 216 2 112 48.5% 4.9%
Total 100.0% N/A N/A N/A N/A 60.7%
Balanced Score
Your Performance
Metric Score
Performance RangeMetric WeightingPerformance Metric
SAMPLE REPORT ONLY: DATA IS NOT ACCURATE!
0.0%
10.0%
20.0%
30.0%
40.0%
50.0%
60.0%
70.0%
80.0%
90.0%
Dat
abas
e B
alan
ced
Scor
es
18© MetricNet, LLC, www.metricnet.com
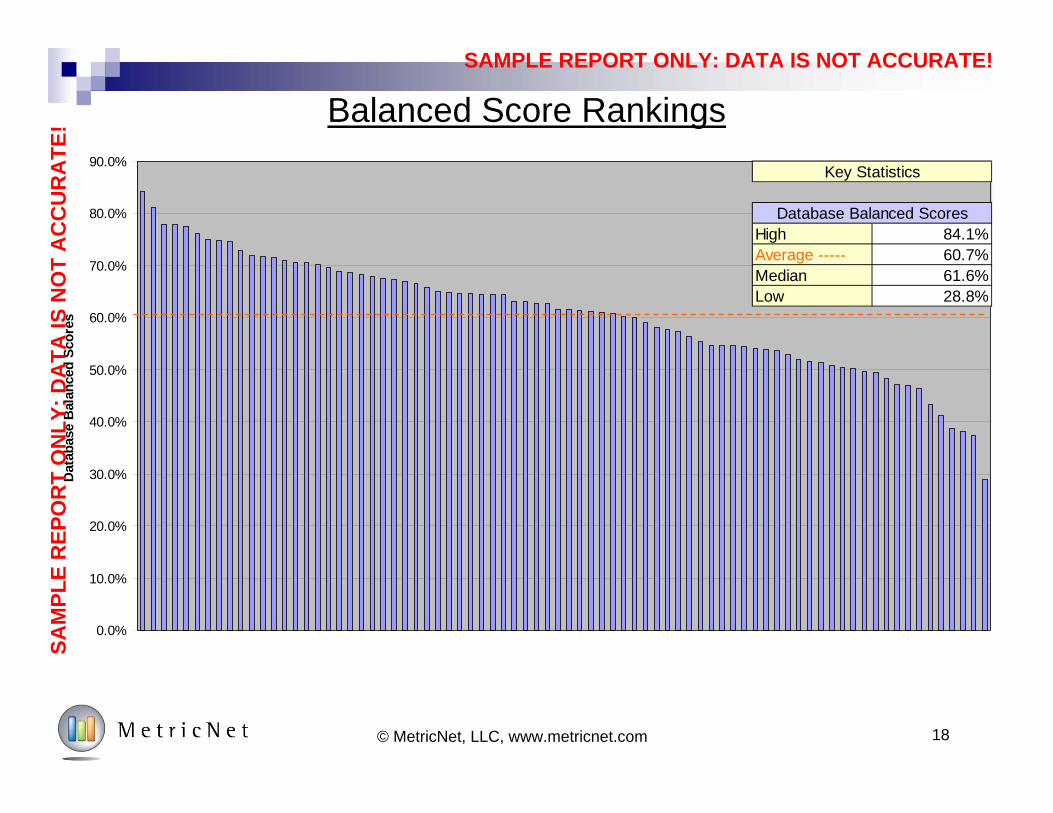
Balanced Score Rankings
18© MetricNet, LLC, www.metricnet.com
SAM
PLE
REP
OR
T O
NLY
: DA
TA IS
NO
T A
CC
UR
ATE
!
High 84.1%Average ----- 60.7%Median 61.6%Low 28.8%
Database Balanced Scores
Key Statistics
SAMPLE REPORT ONLY: DATA IS NOT ACCURATE!
*Sample Only
40%
45%
50%
55%
60%
65%
70%
75%
80%
85%
Jan Feb Mar Apr May Jun Jul Aug Sep Oct Nov Dec
Serv
ice
Des
k B
alan
ced
Scor
e
12 Month Average Monthly Score
19© MetricNet, LLC, www.metricnet.com
The Service Desk Scorecard is Used to Track and Trend Performance*
*Sample Only
SAM
PLE
REP
OR
T O
NLY
: DA
TA IS
NO
T A
CC
UR
ATE
!
SAMPLE REPORT ONLY: DATA IS NOT ACCURATE!
20© MetricNet, LLC, www.metricnet.com
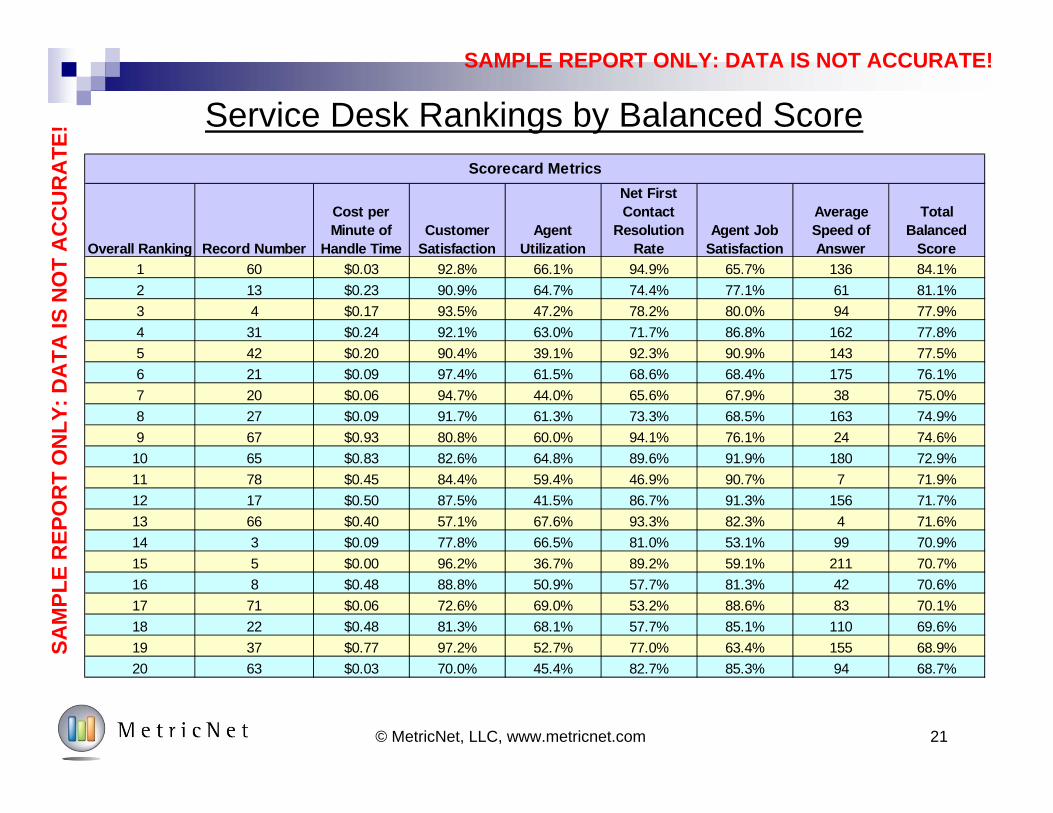
Scorecard Summary Data
The next four pages illustrate the Balanced Score
performance for each data record in the Benchmark
The data records are listed in rank order, from best
(record #60) to worst (record #62) based upon the
balanced scores
SAM
PLE
REP
OR
T O
NLY
: DA
TA IS
NO
T A
CC
UR
ATE
!
SAMPLE REPORT ONLY: DATA IS NOT ACCURATE!
21© MetricNet, LLC, www.metricnet.com
Service Desk Rankings by Balanced Score
SAM
PLE
REP
OR
T O
NLY
: DA
TA IS
NO
T A
CC
UR
ATE
!
Overall Ranking Record Number
Cost per Minute of
Handle TimeCustomer
SatisfactionAgent
Utilization
Net First Contact
Resolution Rate
Agent Job Satisfaction
Average Speed of Answer
Total Balanced
Score1 60 $0.03 92.8% 66.1% 94.9% 65.7% 136 84.1%2 13 $0.23 90.9% 64.7% 74.4% 77.1% 61 81.1%3 4 $0.17 93.5% 47.2% 78.2% 80.0% 94 77.9%4 31 $0.24 92.1% 63.0% 71.7% 86.8% 162 77.8%5 42 $0.20 90.4% 39.1% 92.3% 90.9% 143 77.5%6 21 $0.09 97.4% 61.5% 68.6% 68.4% 175 76.1%7 20 $0.06 94.7% 44.0% 65.6% 67.9% 38 75.0%8 27 $0.09 91.7% 61.3% 73.3% 68.5% 163 74.9%9 67 $0.93 80.8% 60.0% 94.1% 76.1% 24 74.6%
10 65 $0.83 82.6% 64.8% 89.6% 91.9% 180 72.9%11 78 $0.45 84.4% 59.4% 46.9% 90.7% 7 71.9%12 17 $0.50 87.5% 41.5% 86.7% 91.3% 156 71.7%13 66 $0.40 57.1% 67.6% 93.3% 82.3% 4 71.6%14 3 $0.09 77.8% 66.5% 81.0% 53.1% 99 70.9%15 5 $0.00 96.2% 36.7% 89.2% 59.1% 211 70.7%16 8 $0.48 88.8% 50.9% 57.7% 81.3% 42 70.6%17 71 $0.06 72.6% 69.0% 53.2% 88.6% 83 70.1%18 22 $0.48 81.3% 68.1% 57.7% 85.1% 110 69.6%19 37 $0.77 97.2% 52.7% 77.0% 63.4% 155 68.9%20 63 $0.03 70.0% 45.4% 82.7% 85.3% 94 68.7%
Scorecard Metrics
SAMPLE REPORT ONLY: DATA IS NOT ACCURATE!
22© MetricNet, LLC, www.metricnet.com
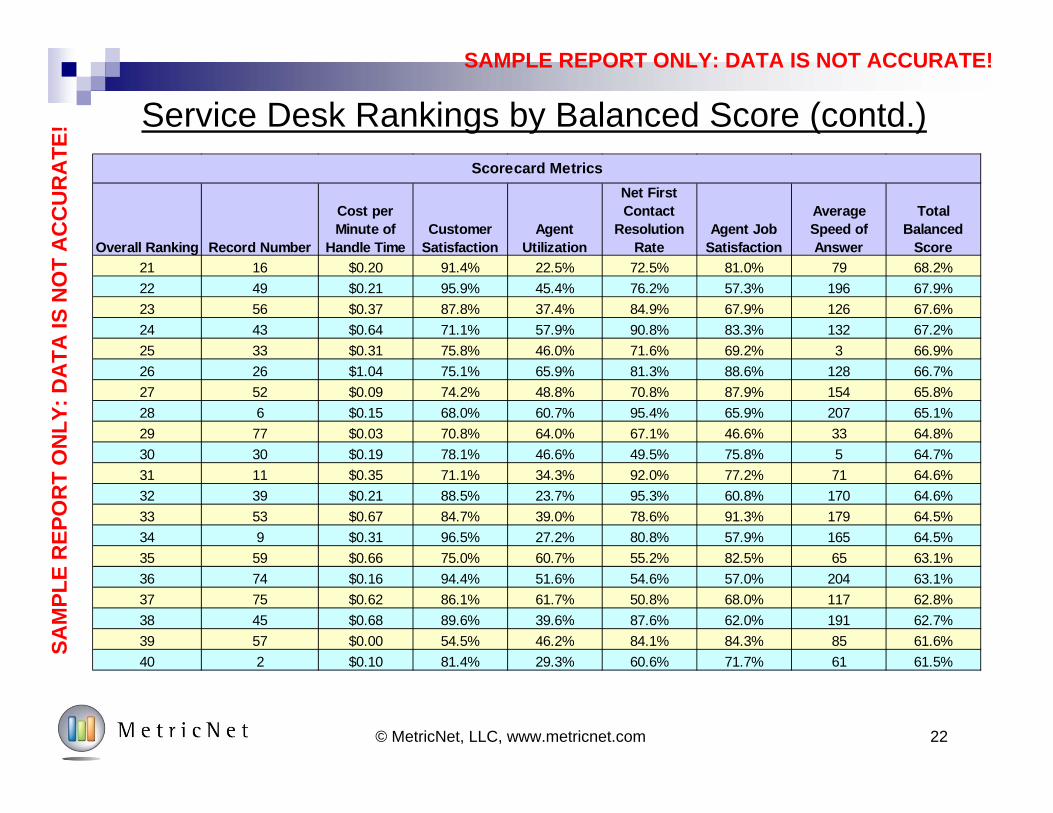
Service Desk Rankings by Balanced Score (contd.)
SAM
PLE
REP
OR
T O
NLY
: DA
TA IS
NO
T A
CC
UR
ATE
!
Overall Ranking Record Number
Cost per Minute of
Handle TimeCustomer
SatisfactionAgent
Utilization
Net First Contact
Resolution Rate
Agent Job Satisfaction
Average Speed of Answer
Total Balanced
Score21 16 $0.20 91.4% 22.5% 72.5% 81.0% 79 68.2%22 49 $0.21 95.9% 45.4% 76.2% 57.3% 196 67.9%23 56 $0.37 87.8% 37.4% 84.9% 67.9% 126 67.6%24 43 $0.64 71.1% 57.9% 90.8% 83.3% 132 67.2%25 33 $0.31 75.8% 46.0% 71.6% 69.2% 3 66.9%26 26 $1.04 75.1% 65.9% 81.3% 88.6% 128 66.7%27 52 $0.09 74.2% 48.8% 70.8% 87.9% 154 65.8%28 6 $0.15 68.0% 60.7% 95.4% 65.9% 207 65.1%29 77 $0.03 70.8% 64.0% 67.1% 46.6% 33 64.8%30 30 $0.19 78.1% 46.6% 49.5% 75.8% 5 64.7%31 11 $0.35 71.1% 34.3% 92.0% 77.2% 71 64.6%32 39 $0.21 88.5% 23.7% 95.3% 60.8% 170 64.6%33 53 $0.67 84.7% 39.0% 78.6% 91.3% 179 64.5%34 9 $0.31 96.5% 27.2% 80.8% 57.9% 165 64.5%35 59 $0.66 75.0% 60.7% 55.2% 82.5% 65 63.1%36 74 $0.16 94.4% 51.6% 54.6% 57.0% 204 63.1%37 75 $0.62 86.1% 61.7% 50.8% 68.0% 117 62.8%38 45 $0.68 89.6% 39.6% 87.6% 62.0% 191 62.7%39 57 $0.00 54.5% 46.2% 84.1% 84.3% 85 61.6%40 2 $0.10 81.4% 29.3% 60.6% 71.7% 61 61.5%
Scorecard Metrics
SAMPLE REPORT ONLY: DATA IS NOT ACCURATE!
23© MetricNet, LLC, www.metricnet.com
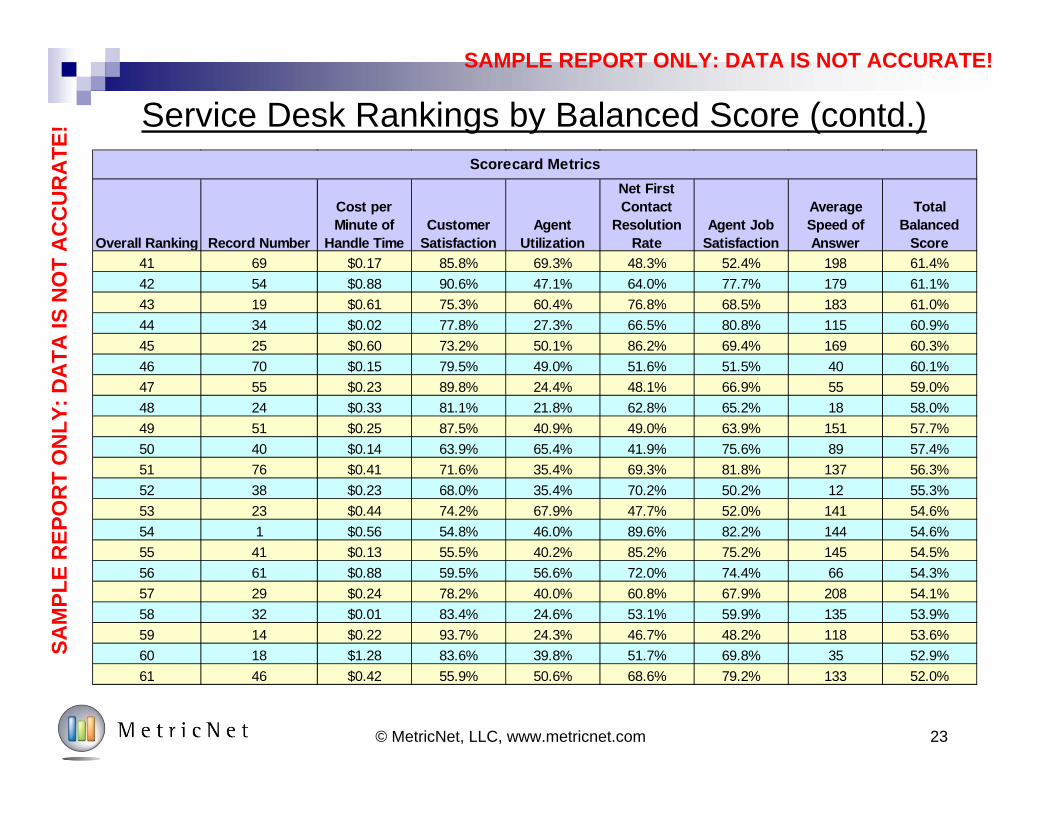
Service Desk Rankings by Balanced Score (contd.)
SAM
PLE
REP
OR
T O
NLY
: DA
TA IS
NO
T A
CC
UR
ATE
!
Overall Ranking Record Number
Cost per Minute of
Handle TimeCustomer
SatisfactionAgent
Utilization
Net First Contact
Resolution Rate
Agent Job Satisfaction
Average Speed of Answer
Total Balanced
Score41 69 $0.17 85.8% 69.3% 48.3% 52.4% 198 61.4%42 54 $0.88 90.6% 47.1% 64.0% 77.7% 179 61.1%43 19 $0.61 75.3% 60.4% 76.8% 68.5% 183 61.0%44 34 $0.02 77.8% 27.3% 66.5% 80.8% 115 60.9%45 25 $0.60 73.2% 50.1% 86.2% 69.4% 169 60.3%46 70 $0.15 79.5% 49.0% 51.6% 51.5% 40 60.1%47 55 $0.23 89.8% 24.4% 48.1% 66.9% 55 59.0%48 24 $0.33 81.1% 21.8% 62.8% 65.2% 18 58.0%49 51 $0.25 87.5% 40.9% 49.0% 63.9% 151 57.7%50 40 $0.14 63.9% 65.4% 41.9% 75.6% 89 57.4%51 76 $0.41 71.6% 35.4% 69.3% 81.8% 137 56.3%52 38 $0.23 68.0% 35.4% 70.2% 50.2% 12 55.3%53 23 $0.44 74.2% 67.9% 47.7% 52.0% 141 54.6%54 1 $0.56 54.8% 46.0% 89.6% 82.2% 144 54.6%55 41 $0.13 55.5% 40.2% 85.2% 75.2% 145 54.5%56 61 $0.88 59.5% 56.6% 72.0% 74.4% 66 54.3%57 29 $0.24 78.2% 40.0% 60.8% 67.9% 208 54.1%58 32 $0.01 83.4% 24.6% 53.1% 59.9% 135 53.9%59 14 $0.22 93.7% 24.3% 46.7% 48.2% 118 53.6%60 18 $1.28 83.6% 39.8% 51.7% 69.8% 35 52.9%61 46 $0.42 55.9% 50.6% 68.6% 79.2% 133 52.0%
Scorecard Metrics
SAMPLE REPORT ONLY: DATA IS NOT ACCURATE!
24© MetricNet, LLC, www.metricnet.com
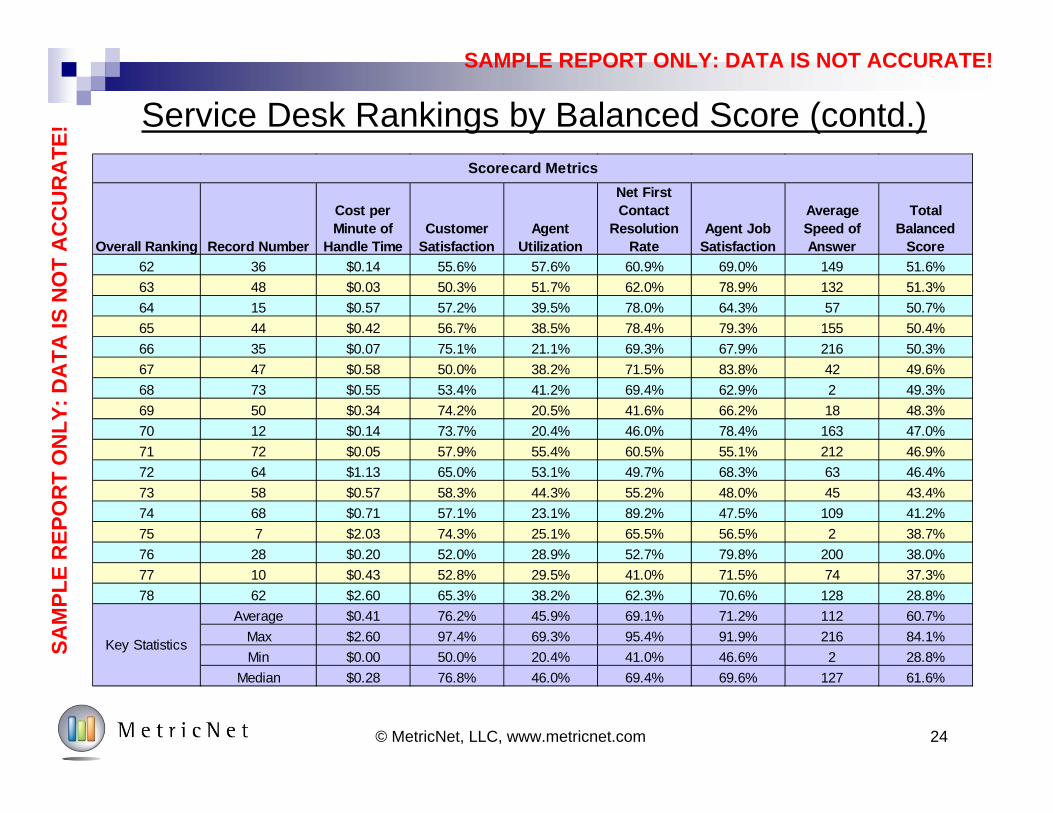
Service Desk Rankings by Balanced Score (contd.)
SAM
PLE
REP
OR
T O
NLY
: DA
TA IS
NO
T A
CC
UR
ATE
!
Overall Ranking Record Number
Cost per Minute of
Handle TimeCustomer
SatisfactionAgent
Utilization
Net First Contact
Resolution Rate
Agent Job Satisfaction
Average Speed of Answer
Total Balanced
Score62 36 $0.14 55.6% 57.6% 60.9% 69.0% 149 51.6%63 48 $0.03 50.3% 51.7% 62.0% 78.9% 132 51.3%64 15 $0.57 57.2% 39.5% 78.0% 64.3% 57 50.7%65 44 $0.42 56.7% 38.5% 78.4% 79.3% 155 50.4%66 35 $0.07 75.1% 21.1% 69.3% 67.9% 216 50.3%67 47 $0.58 50.0% 38.2% 71.5% 83.8% 42 49.6%68 73 $0.55 53.4% 41.2% 69.4% 62.9% 2 49.3%69 50 $0.34 74.2% 20.5% 41.6% 66.2% 18 48.3%70 12 $0.14 73.7% 20.4% 46.0% 78.4% 163 47.0%71 72 $0.05 57.9% 55.4% 60.5% 55.1% 212 46.9%72 64 $1.13 65.0% 53.1% 49.7% 68.3% 63 46.4%73 58 $0.57 58.3% 44.3% 55.2% 48.0% 45 43.4%74 68 $0.71 57.1% 23.1% 89.2% 47.5% 109 41.2%75 7 $2.03 74.3% 25.1% 65.5% 56.5% 2 38.7%76 28 $0.20 52.0% 28.9% 52.7% 79.8% 200 38.0%77 10 $0.43 52.8% 29.5% 41.0% 71.5% 74 37.3%78 62 $2.60 65.3% 38.2% 62.3% 70.6% 128 28.8%
Average $0.41 76.2% 45.9% 69.1% 71.2% 112 60.7%Max $2.60 97.4% 69.3% 95.4% 91.9% 216 84.1%Min $0.00 50.0% 20.4% 41.0% 46.6% 2 28.8%
Median $0.28 76.8% 46.0% 69.4% 69.6% 127 61.6%
Scorecard Metrics
Key Statistics
SAMPLE REPORT ONLY: DATA IS NOT ACCURATE!
25© MetricNet, LLC, www.metricnet.com
Rank Ordering of Scorecard KPI’s
The next four pages show the ranking of each KPI in the
scorecard
Each KPI is listed in rank order, from best (top row), to
worst (bottom row)
SAM
PLE
REP
OR
T O
NLY
: DA
TA IS
NO
T A
CC
UR
ATE
!
SAMPLE REPORT ONLY: DATA IS NOT ACCURATE!
26© MetricNet, LLC, www.metricnet.com
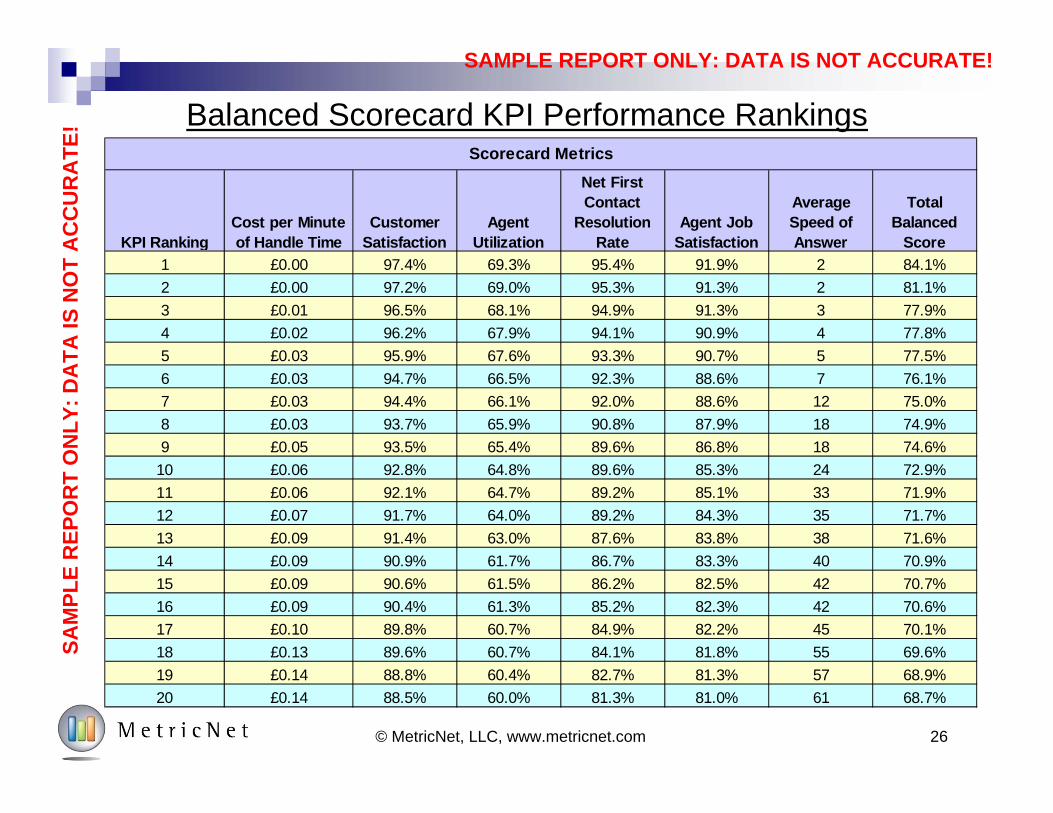
Balanced Scorecard KPI Performance RankingsSA
MPL
E R
EPO
RT
ON
LY: D
ATA
IS N
OT
AC
CU
RA
TE!
KPI RankingCost per Minute of Handle Time
Customer Satisfaction
Agent Utilization
Net First Contact
Resolution Rate
Agent Job Satisfaction
Average Speed of Answer
Total Balanced
Score1 £0.00 97.4% 69.3% 95.4% 91.9% 2 84.1%2 £0.00 97.2% 69.0% 95.3% 91.3% 2 81.1%3 £0.01 96.5% 68.1% 94.9% 91.3% 3 77.9%4 £0.02 96.2% 67.9% 94.1% 90.9% 4 77.8%5 £0.03 95.9% 67.6% 93.3% 90.7% 5 77.5%6 £0.03 94.7% 66.5% 92.3% 88.6% 7 76.1%7 £0.03 94.4% 66.1% 92.0% 88.6% 12 75.0%8 £0.03 93.7% 65.9% 90.8% 87.9% 18 74.9%9 £0.05 93.5% 65.4% 89.6% 86.8% 18 74.6%
10 £0.06 92.8% 64.8% 89.6% 85.3% 24 72.9%11 £0.06 92.1% 64.7% 89.2% 85.1% 33 71.9%12 £0.07 91.7% 64.0% 89.2% 84.3% 35 71.7%13 £0.09 91.4% 63.0% 87.6% 83.8% 38 71.6%14 £0.09 90.9% 61.7% 86.7% 83.3% 40 70.9%15 £0.09 90.6% 61.5% 86.2% 82.5% 42 70.7%16 £0.09 90.4% 61.3% 85.2% 82.3% 42 70.6%17 £0.10 89.8% 60.7% 84.9% 82.2% 45 70.1%18 £0.13 89.6% 60.7% 84.1% 81.8% 55 69.6%19 £0.14 88.8% 60.4% 82.7% 81.3% 57 68.9%20 £0.14 88.5% 60.0% 81.3% 81.0% 61 68.7%
Scorecard Metrics
SAMPLE REPORT ONLY: DATA IS NOT ACCURATE!
27© MetricNet, LLC, www.metricnet.com
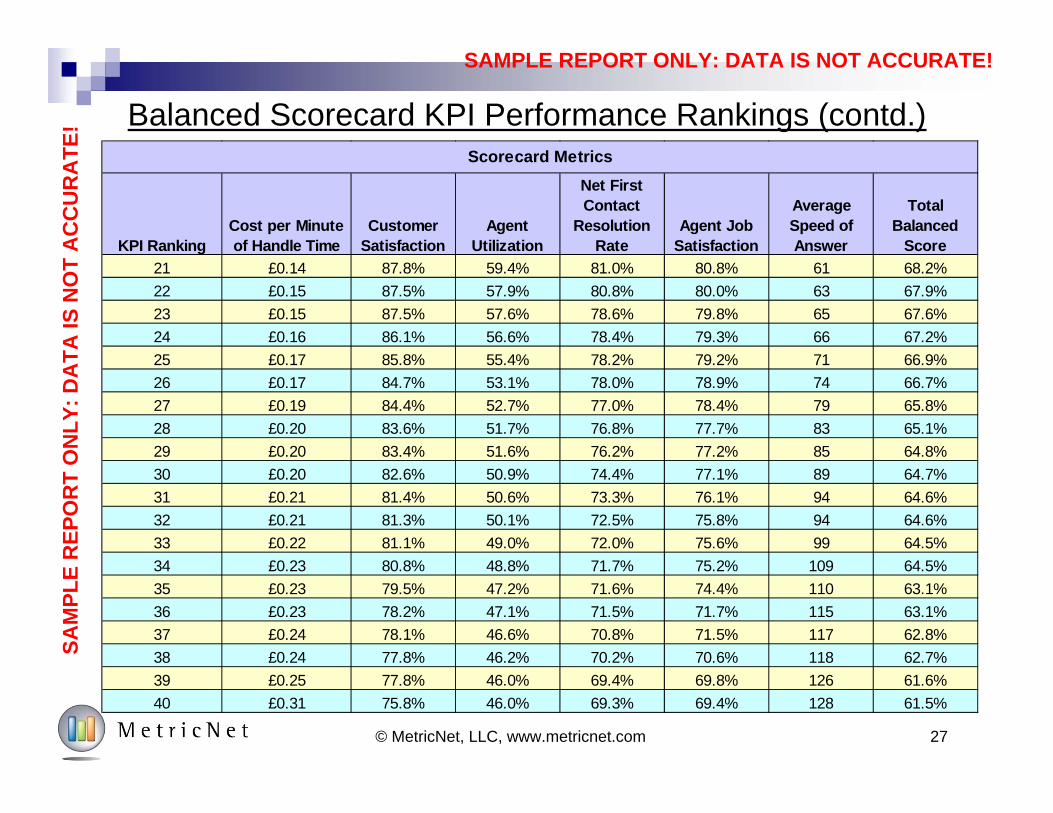
Balanced Scorecard KPI Performance Rankings (contd.)SA
MPL
E R
EPO
RT
ON
LY: D
ATA
IS N
OT
AC
CU
RA
TE!
KPI RankingCost per Minute of Handle Time
Customer Satisfaction
Agent Utilization
Net First Contact
Resolution Rate
Agent Job Satisfaction
Average Speed of Answer
Total Balanced
Score21 £0.14 87.8% 59.4% 81.0% 80.8% 61 68.2%22 £0.15 87.5% 57.9% 80.8% 80.0% 63 67.9%23 £0.15 87.5% 57.6% 78.6% 79.8% 65 67.6%24 £0.16 86.1% 56.6% 78.4% 79.3% 66 67.2%25 £0.17 85.8% 55.4% 78.2% 79.2% 71 66.9%26 £0.17 84.7% 53.1% 78.0% 78.9% 74 66.7%27 £0.19 84.4% 52.7% 77.0% 78.4% 79 65.8%28 £0.20 83.6% 51.7% 76.8% 77.7% 83 65.1%29 £0.20 83.4% 51.6% 76.2% 77.2% 85 64.8%30 £0.20 82.6% 50.9% 74.4% 77.1% 89 64.7%31 £0.21 81.4% 50.6% 73.3% 76.1% 94 64.6%32 £0.21 81.3% 50.1% 72.5% 75.8% 94 64.6%33 £0.22 81.1% 49.0% 72.0% 75.6% 99 64.5%34 £0.23 80.8% 48.8% 71.7% 75.2% 109 64.5%35 £0.23 79.5% 47.2% 71.6% 74.4% 110 63.1%36 £0.23 78.2% 47.1% 71.5% 71.7% 115 63.1%37 £0.24 78.1% 46.6% 70.8% 71.5% 117 62.8%38 £0.24 77.8% 46.2% 70.2% 70.6% 118 62.7%39 £0.25 77.8% 46.0% 69.4% 69.8% 126 61.6%40 £0.31 75.8% 46.0% 69.3% 69.4% 128 61.5%
Scorecard Metrics
SAMPLE REPORT ONLY: DATA IS NOT ACCURATE!
28© MetricNet, LLC, www.metricnet.com
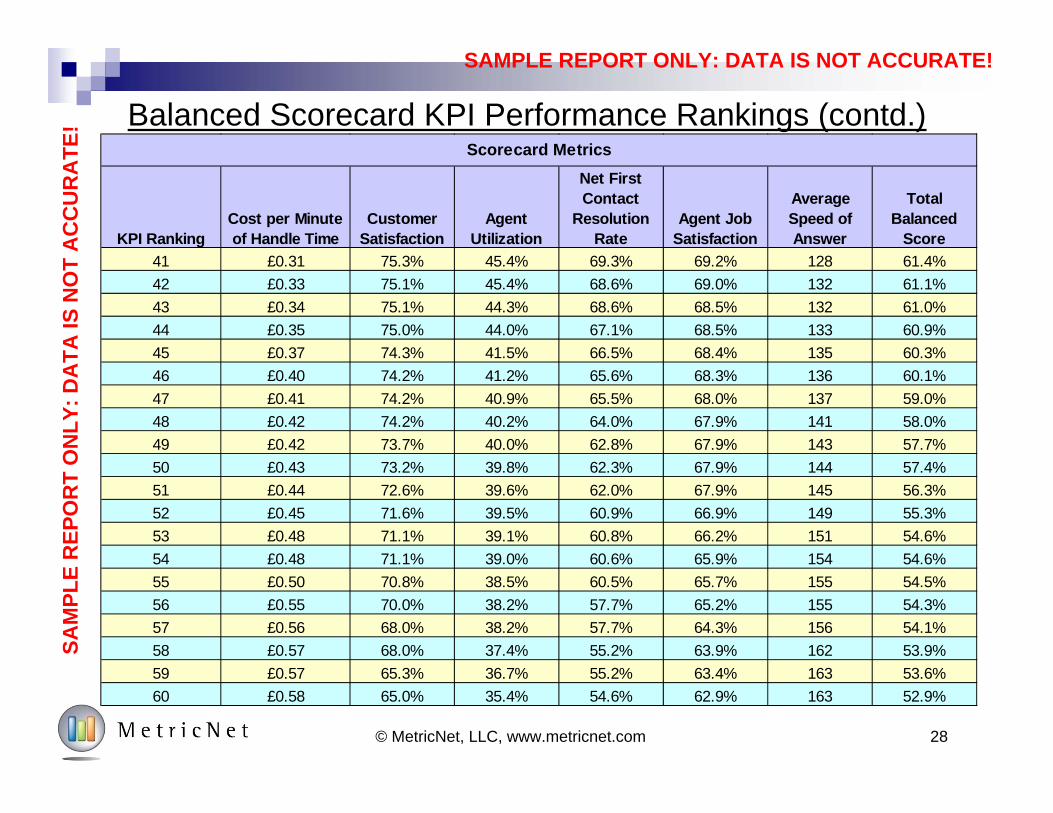
Balanced Scorecard KPI Performance Rankings (contd.)SA
MPL
E R
EPO
RT
ON
LY: D
ATA
IS N
OT
AC
CU
RA
TE!
KPI RankingCost per Minute of Handle Time
Customer Satisfaction
Agent Utilization
Net First Contact
Resolution Rate
Agent Job Satisfaction
Average Speed of Answer
Total Balanced
Score41 £0.31 75.3% 45.4% 69.3% 69.2% 128 61.4%42 £0.33 75.1% 45.4% 68.6% 69.0% 132 61.1%43 £0.34 75.1% 44.3% 68.6% 68.5% 132 61.0%44 £0.35 75.0% 44.0% 67.1% 68.5% 133 60.9%45 £0.37 74.3% 41.5% 66.5% 68.4% 135 60.3%46 £0.40 74.2% 41.2% 65.6% 68.3% 136 60.1%47 £0.41 74.2% 40.9% 65.5% 68.0% 137 59.0%48 £0.42 74.2% 40.2% 64.0% 67.9% 141 58.0%49 £0.42 73.7% 40.0% 62.8% 67.9% 143 57.7%50 £0.43 73.2% 39.8% 62.3% 67.9% 144 57.4%51 £0.44 72.6% 39.6% 62.0% 67.9% 145 56.3%52 £0.45 71.6% 39.5% 60.9% 66.9% 149 55.3%53 £0.48 71.1% 39.1% 60.8% 66.2% 151 54.6%54 £0.48 71.1% 39.0% 60.6% 65.9% 154 54.6%55 £0.50 70.8% 38.5% 60.5% 65.7% 155 54.5%56 £0.55 70.0% 38.2% 57.7% 65.2% 155 54.3%57 £0.56 68.0% 38.2% 57.7% 64.3% 156 54.1%58 £0.57 68.0% 37.4% 55.2% 63.9% 162 53.9%59 £0.57 65.3% 36.7% 55.2% 63.4% 163 53.6%60 £0.58 65.0% 35.4% 54.6% 62.9% 163 52.9%
Scorecard Metrics
SAMPLE REPORT ONLY: DATA IS NOT ACCURATE!
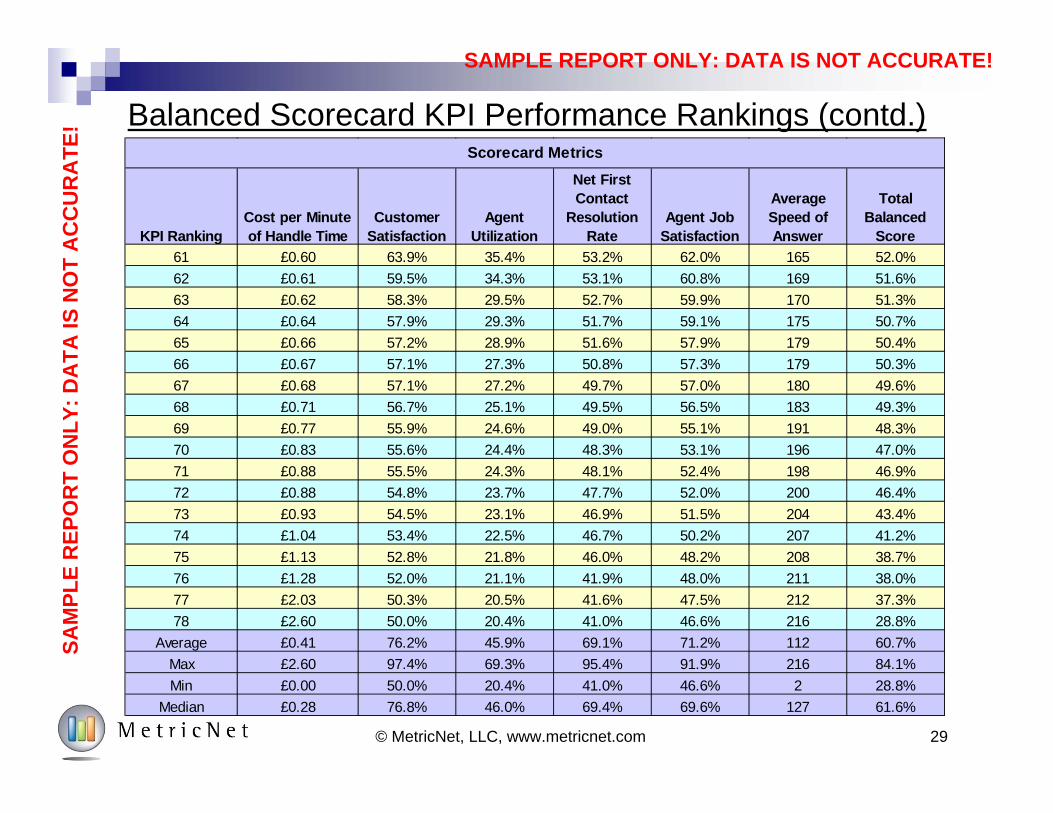
29© MetricNet, LLC, www.metricnet.com
Balanced Scorecard KPI Performance Rankings (contd.)SA
MPL
E R
EPO
RT
ON
LY: D
ATA
IS N
OT
AC
CU
RA
TE!
KPI RankingCost per Minute of Handle Time
Customer Satisfaction
Agent Utilization
Net First Contact
Resolution Rate
Agent Job Satisfaction
Average Speed of Answer
Total Balanced
Score61 £0.60 63.9% 35.4% 53.2% 62.0% 165 52.0%62 £0.61 59.5% 34.3% 53.1% 60.8% 169 51.6%63 £0.62 58.3% 29.5% 52.7% 59.9% 170 51.3%64 £0.64 57.9% 29.3% 51.7% 59.1% 175 50.7%65 £0.66 57.2% 28.9% 51.6% 57.9% 179 50.4%66 £0.67 57.1% 27.3% 50.8% 57.3% 179 50.3%67 £0.68 57.1% 27.2% 49.7% 57.0% 180 49.6%68 £0.71 56.7% 25.1% 49.5% 56.5% 183 49.3%69 £0.77 55.9% 24.6% 49.0% 55.1% 191 48.3%70 £0.83 55.6% 24.4% 48.3% 53.1% 196 47.0%71 £0.88 55.5% 24.3% 48.1% 52.4% 198 46.9%72 £0.88 54.8% 23.7% 47.7% 52.0% 200 46.4%73 £0.93 54.5% 23.1% 46.9% 51.5% 204 43.4%74 £1.04 53.4% 22.5% 46.7% 50.2% 207 41.2%75 £1.13 52.8% 21.8% 46.0% 48.2% 208 38.7%76 £1.28 52.0% 21.1% 41.9% 48.0% 211 38.0%77 £2.03 50.3% 20.5% 41.6% 47.5% 212 37.3%78 £2.60 50.0% 20.4% 41.0% 46.6% 216 28.8%
Average £0.41 76.2% 45.9% 69.1% 71.2% 112 60.7%Max £2.60 97.4% 69.3% 95.4% 91.9% 216 84.1%Min £0.00 50.0% 20.4% 41.0% 46.6% 2 28.8%
Median £0.28 76.8% 46.0% 69.4% 69.6% 127 61.6%
Scorecard Metrics
SAMPLE REPORT ONLY: DATA IS NOT ACCURATE!
£0.00
£0.20
£0.40
£0.60
£0.80
£1.00
£1.20
£1.40
£1.60
£1.80
£2.00
£2.20
£2.40
£2.60
£2.80
Cos
t per
min
ute
of H
andl
e Ti
me
30© MetricNet, LLC, www.metricnet.com
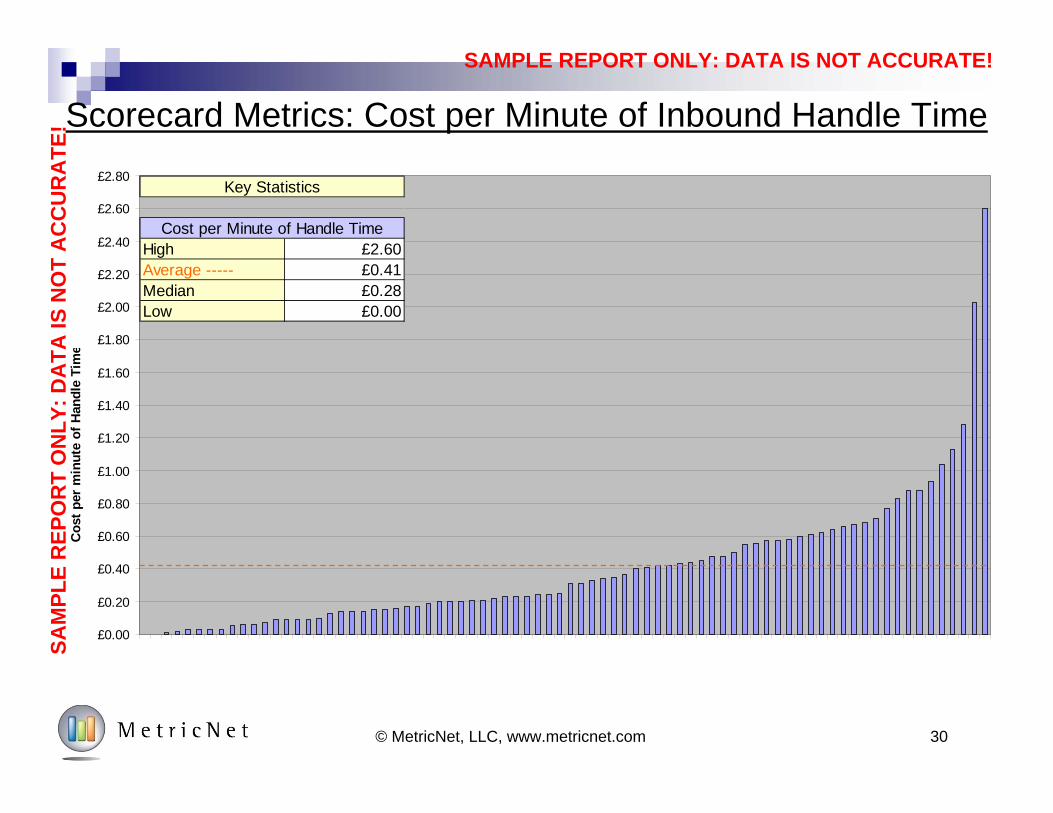
Scorecard Metrics: Cost per Minute of Inbound Handle Time
SAM
PLE
REP
OR
T O
NLY
: DA
TA IS
NO
T A
CC
UR
ATE
!
High £2.60Average ----- £0.41Median £0.28Low £0.00
Key Statistics
Cost per Minute of Handle Time
SAMPLE REPORT ONLY: DATA IS NOT ACCURATE!
40.0%
50.0%
60.0%
70.0%
80.0%
90.0%
100.0%
Cus
tom
er S
atis
fact
ion
31© MetricNet, LLC, www.metricnet.com
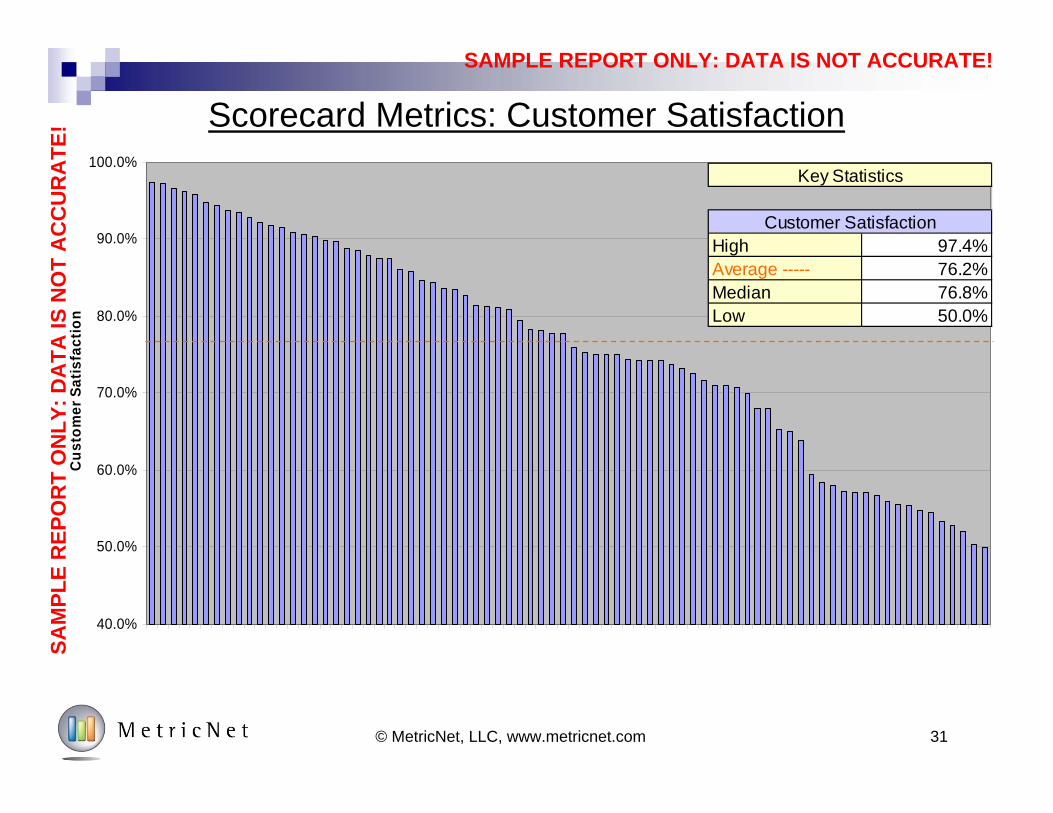
Scorecard Metrics: Customer Satisfaction
High 97.4%Average ----- 76.2%Median 76.8%Low 50.0%
Key Statistics
Customer Satisfaction
SAM
PLE
REP
OR
T O
NLY
: DA
TA IS
NO
T A
CC
UR
ATE
!
SAMPLE REPORT ONLY: DATA IS NOT ACCURATE!
32© MetricNet, LLC, www.metricnet.com
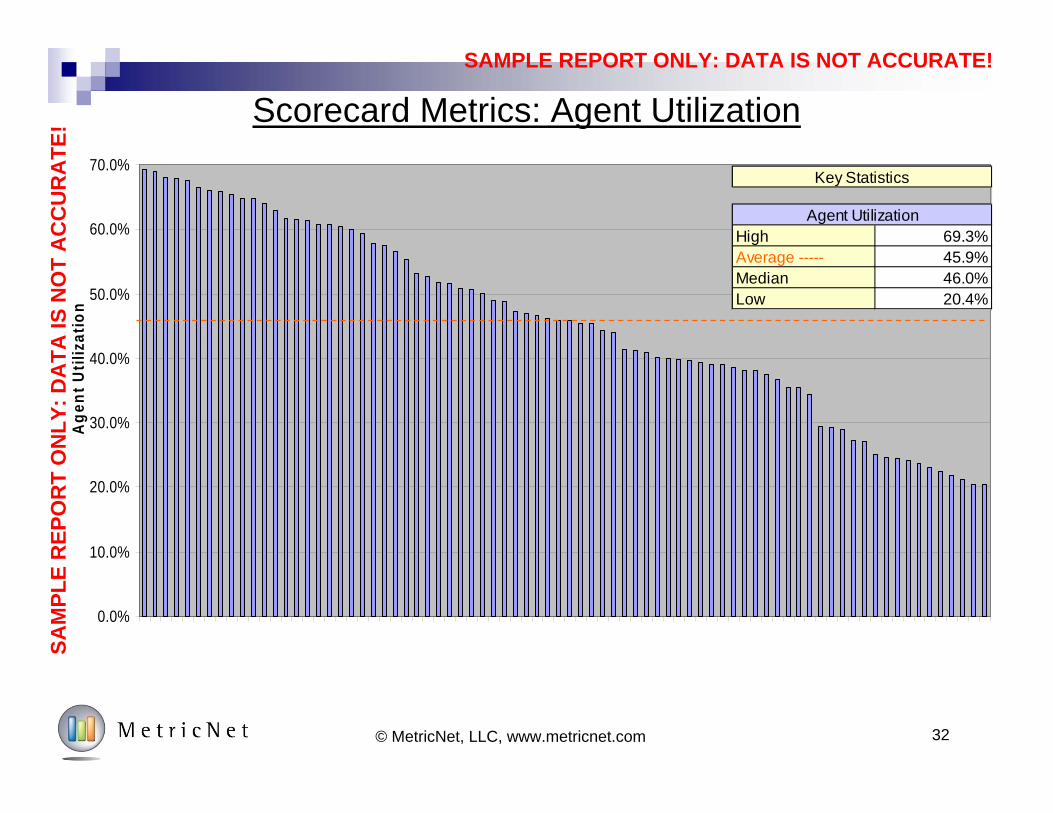
Scorecard Metrics: Agent Utilization
0.0%
10.0%
20.0%
30.0%
40.0%
50.0%
60.0%
70.0%
Age
nt U
tiliz
atio
n
High 69.3%Average ----- 45.9%Median 46.0%Low 20.4%
Key Statistics
Agent Utilization
SAM
PLE
REP
OR
T O
NLY
: DA
TA IS
NO
T A
CC
UR
ATE
!

SAMPLE REPORT ONLY: DATA IS NOT ACCURATE!
33© MetricNet, LLC, www.metricnet.com
Scorecard Metrics: Net First Contact Resolution Rate
40.0%
50.0%
60.0%
70.0%
80.0%
90.0%
100.0%
Net
Firs
t Con
tact
Res
olut
ion
Rat
e
High 95.4%Average ----- 69.1%Median 69.4%Low 41.0%
Key Statistics
Net First Contact Resolution Rate
SAM
PLE
REP
OR
T O
NLY
: DA
TA IS
NO
T A
CC
UR
ATE
!
SAMPLE REPORT ONLY: DATA IS NOT ACCURATE!
34© MetricNet, LLC, www.metricnet.com
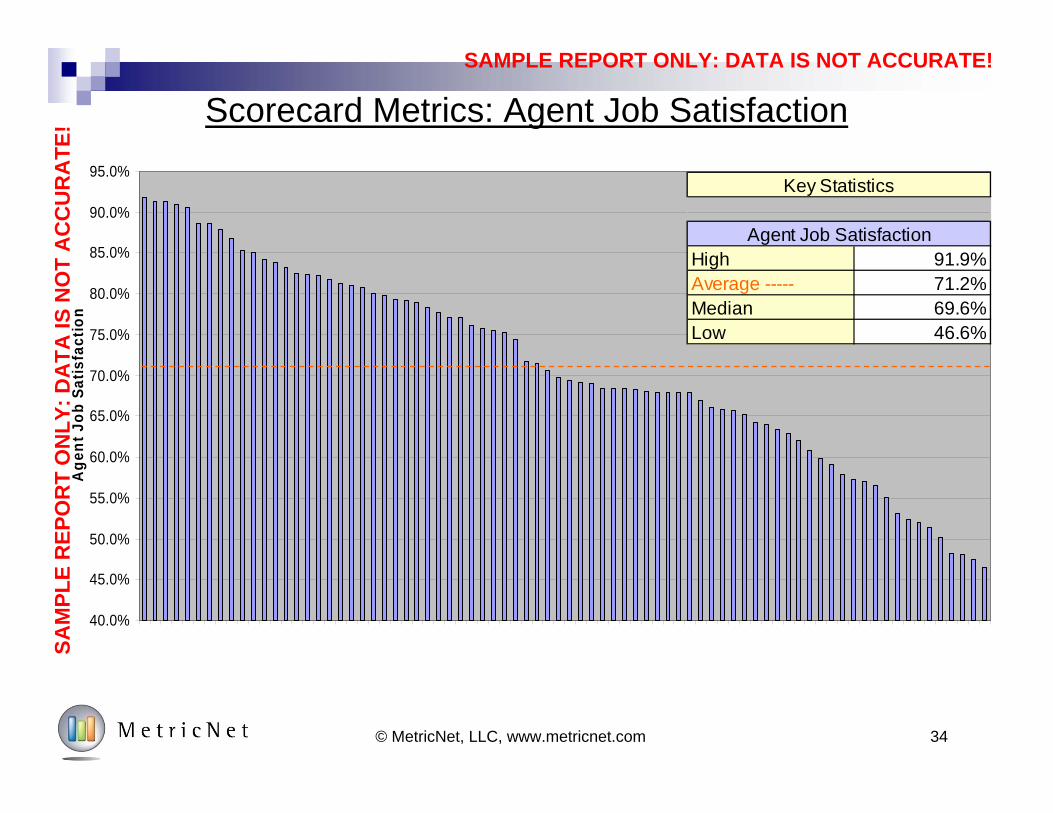
Scorecard Metrics: Agent Job Satisfaction
40.0%
45.0%
50.0%
55.0%
60.0%
65.0%
70.0%
75.0%
80.0%
85.0%
90.0%
95.0%
Age
nt J
ob S
atis
fact
ion
High 91.9%Average ----- 71.2%Median 69.6%Low 46.6%
Key Statistics
Agent Job Satisfaction
SAM
PLE
REP
OR
T O
NLY
: DA
TA IS
NO
T A
CC
UR
ATE
!
SAMPLE REPORT ONLY: DATA IS NOT ACCURATE!
35© MetricNet, LLC, www.metricnet.com
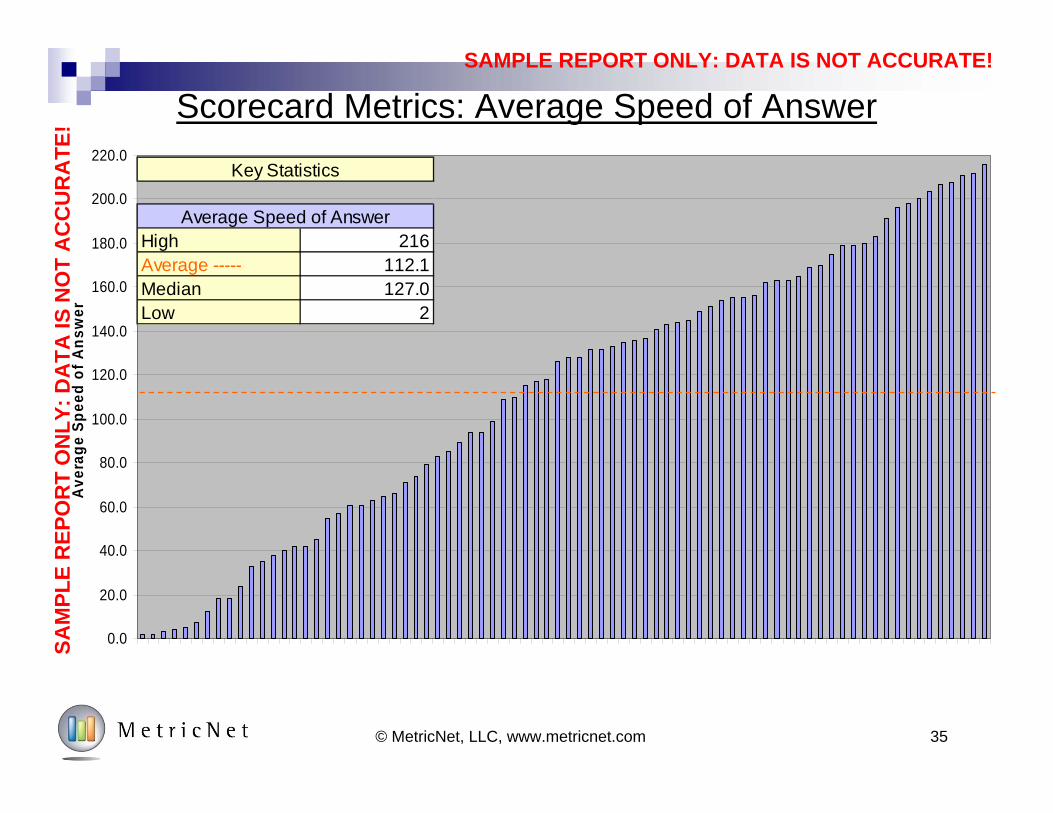
Scorecard Metrics: Average Speed of Answer
0.0
20.0
40.0
60.0
80.0
100.0
120.0
140.0
160.0
180.0
200.0
220.0
Ave
rage
Spe
ed o
f Ans
wer
High 216Average ----- 112.1Median 127.0Low 2
Average Speed of Answer
Key Statistics
SAM
PLE
REP
OR
T O
NLY
: DA
TA IS
NO
T A
CC
UR
ATE
!

SAMPLE REPORT ONLY: DATA IS NOT ACCURATE!
36© MetricNet, LLC, www.metricnet.com
Detailed Benchmarking Data
SAMPLE REPORT ONLY: DATA IS NOT ACCURATE!
Cost Metrics
37© MetricNet, LLC, www.metricnet.com
SAMPLE REPORT ONLY: DATA IS NOT ACCURATE!
38© MetricNet, LLC, www.metricnet.com
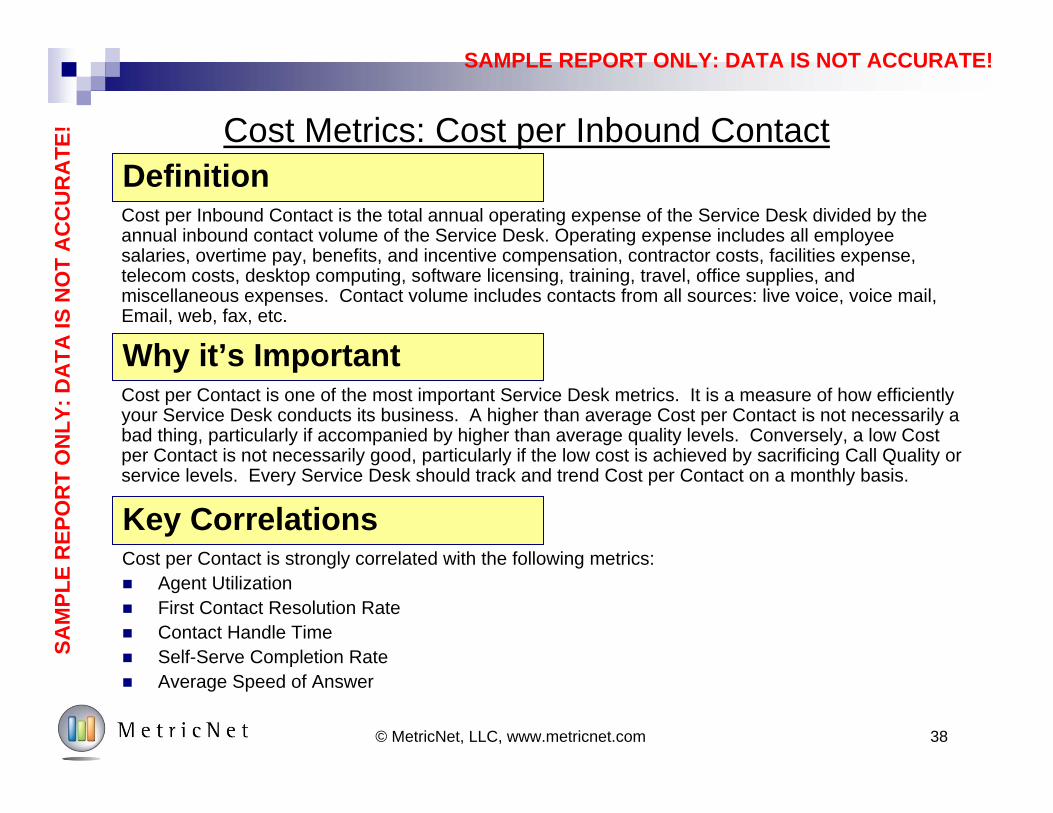
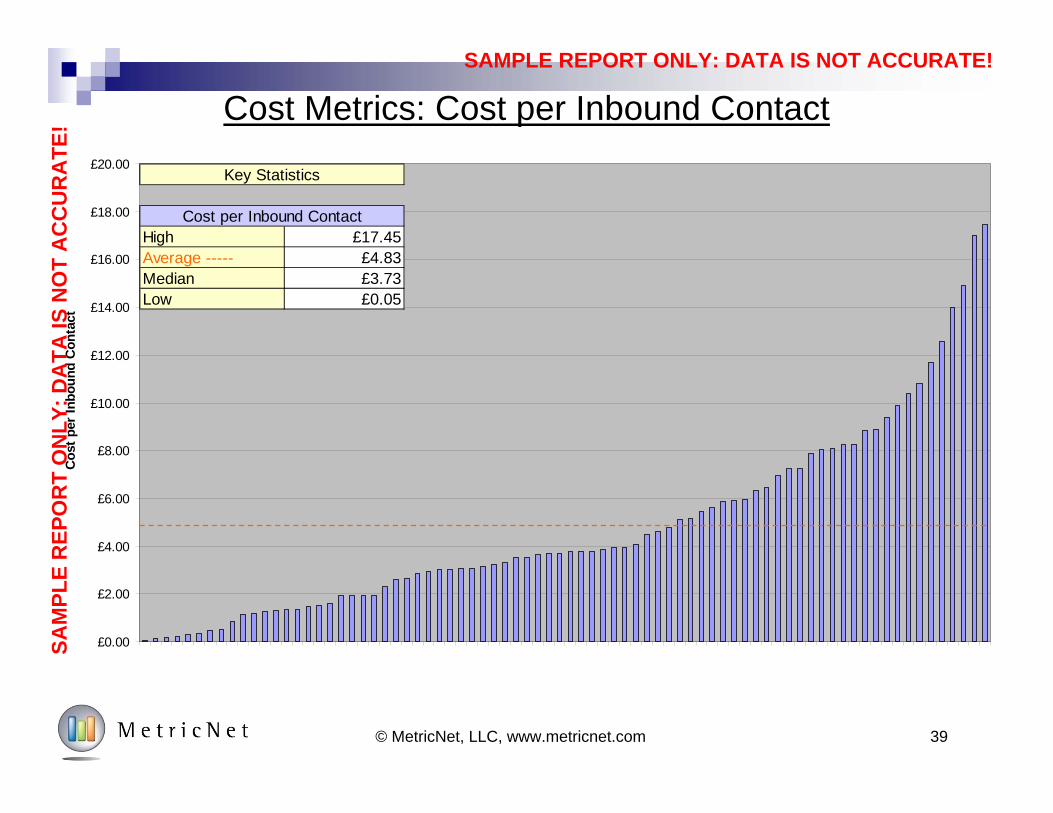
Cost Metrics: Cost per Inbound Contact
Cost per Contact is strongly correlated with the following metrics: Agent Utilization First Contact Resolution Rate Contact Handle Time Self-Serve Completion Rate Average Speed of Answer
Definition
Why it’s Important
Key Correlations
Cost per Contact is one of the most important Service Desk metrics. It is a measure of how efficiently your Service Desk conducts its business. A higher than average Cost per Contact is not necessarily a bad thing, particularly if accompanied by higher than average quality levels. Conversely, a low Cost per Contact is not necessarily good, particularly if the low cost is achieved by sacrificing Call Quality or service levels. Every Service Desk should track and trend Cost per Contact on a monthly basis.
Cost per Inbound Contact is the total annual operating expense of the Service Desk divided by the annual inbound contact volume of the Service Desk. Operating expense includes all employee salaries, overtime pay, benefits, and incentive compensation, contractor costs, facilities expense, telecom costs, desktop computing, software licensing, training, travel, office supplies, and miscellaneous expenses. Contact volume includes contacts from all sources: live voice, voice mail, Email, web, fax, etc.
SAM
PLE
REP
OR
T O
NLY
: DA
TA IS
NO
T A
CC
UR
ATE
!
SAMPLE REPORT ONLY: DATA IS NOT ACCURATE!
£0.00
£2.00
£4.00
£6.00
£8.00
£10.00
£12.00
£14.00
£16.00
£18.00
£20.00
Cos
t per
Inbo
und
Con
tact
39© MetricNet, LLC, www.metricnet.com
Cost Metrics: Cost per Inbound ContactSA
MPL
E R
EPO
RT
ON
LY: D
ATA
IS N
OT
AC
CU
RA
TE!
High £17.45Average ----- £4.83Median £3.73Low £0.05
Key Statistics
Cost per Inbound Contact
SAMPLE REPORT ONLY: DATA IS NOT ACCURATE!
Cost Metrics: Cost per Minute of Inbound Handle Time
Cost per Minute of Inbound Handle Time is strongly correlated with the following metrics: Agent Utilization Net First Contact Resolution Rate User Self-Service Completion Rate Average Speed of Answer Inbound Contacts as a % of Total Contacts
Definition
Why it’s Important
Key Correlations
Unlike Cost per Inbound Contact, which does not take into account the Contact Handle Time or call complexity, Cost per Minute of Inbound Handle Time is a measure of the per minute cost of providing customer support. It enables a more direct comparison of costs between Service Desks because it is independent of the types of contacts that come into the Service Desk and the complexity of those contacts.
Cost per Minute of Inbound Handle Time is simply the Cost per Contact divided by the Average Inbound Contact Handle Time. The Average Inbound Contact Handle Time includes all inbound contacts: voice calls, voice mail, email, web chat, walk-in, etc.
40© MetricNet, LLC, www.metricnet.com
SAM
PLE
REP
OR
T O
NLY
: DA
TA IS
NO
T A
CC
UR
ATE
!

SAMPLE REPORT ONLY: DATA IS NOT ACCURATE!
£0.00
£0.20
£0.40
£0.60
£0.80
£1.00
£1.20
£1.40
£1.60
£1.80
£2.00
£2.20
£2.40
£2.60
£2.80
Cos
t per
min
ute
of H
andl
e Ti
me
41© MetricNet, LLC, www.metricnet.com
Scorecard Metrics: Cost per Minute of Inbound Handle Time
SAM
PLE
REP
OR
T O
NLY
: DA
TA IS
NO
T A
CC
UR
ATE
!
High £2.60Average ----- £0.41Median £0.28Low £0.00
Key Statistics
Cost per Minute of Handle Time
SAMPLE REPORT ONLY: DATA IS NOT ACCURATE!
42© MetricNet, LLC, www.metricnet.com
Cost Metrics: Net Level 1 Resolution Rate
Net Level 1 Resolution is strongly correlated with the following metrics: Net First Contact Resolution Rate New Agent Training Hours Annual Agent Training Hours Cost per Inbound Contact Total Cost of Ownership
Definition
Why it’s Important
Key Correlations
Net Level 1 Resolution is a measure of the overall competency of the Service Desk, and is a proxy for Total Cost of Ownership (TCO). A high Level 1 Resolution Rate helps to minimize TCO because each contact that is resolved at Level 1 avoids a higher cost of resolution at Level n (IT, Desktop Support, Vendor Support, etc.). Service Desks can improve their Level 1 Resolution Rates through training, and investments in certain technologies such as remote diagnostic tools, and knowledge management systems.
Net Level 1 Resolution Rate is the number of incidents resolved in the Service Desk, divided by all incidents that can potentially be resolved at the Service Desk. Any incident that is pushed out to another support level (Desktop Support, Level 2 IT support, Vendor Support, etc.) is, by definition, not resolved at Level 1. Incidents than cannot be resolved at Level 1, such as a hardware failure, do not count in the Net Level 1 Resolution Rate. MetricNet considers this a cost metric since it has a strong impact on Total Cost of Ownership for end-user support
SAM
PLE
REP
OR
T O
NLY
: DA
TA IS
NO
T A
CC
UR
ATE
!
SAMPLE REPORT ONLY: DATA IS NOT ACCURATE!
50.0%
55.0%
60.0%
65.0%
70.0%
75.0%
80.0%
85.0%
90.0%
95.0%
100.0%
Net
Lev
el 1
Res
olut
ion
Rat
e
43© MetricNet, LLC, www.metricnet.com
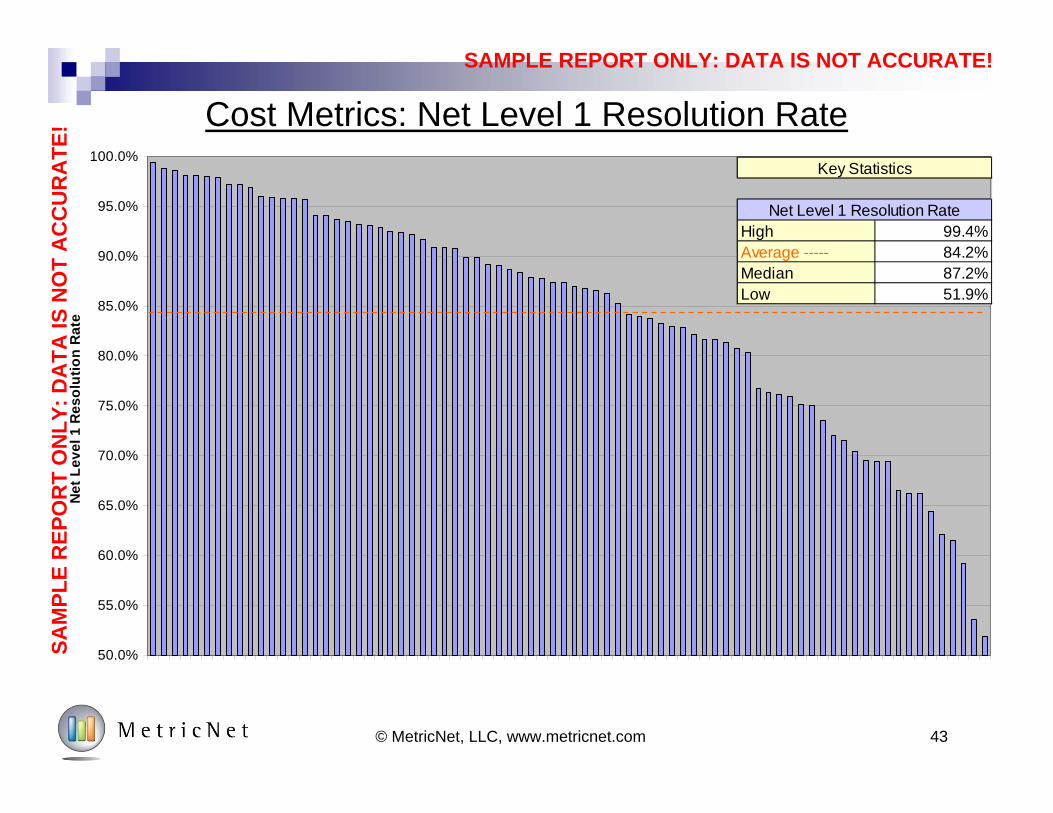
Cost Metrics: Net Level 1 Resolution Rate
High 99.4%Average ----- 84.2%Median 87.2%Low 51.9%
Key Statistics
Net Level 1 Resolution Rate
SAM
PLE
REP
OR
T O
NLY
: DA
TA IS
NO
T A
CC
UR
ATE
!

SAMPLE REPORT ONLY: DATA IS NOT ACCURATE!
Productivity Metrics
44© MetricNet, LLC, www.metricnet.com
SAMPLE REPORT ONLY: DATA IS NOT ACCURATE!
45© MetricNet, LLC, www.metricnet.com
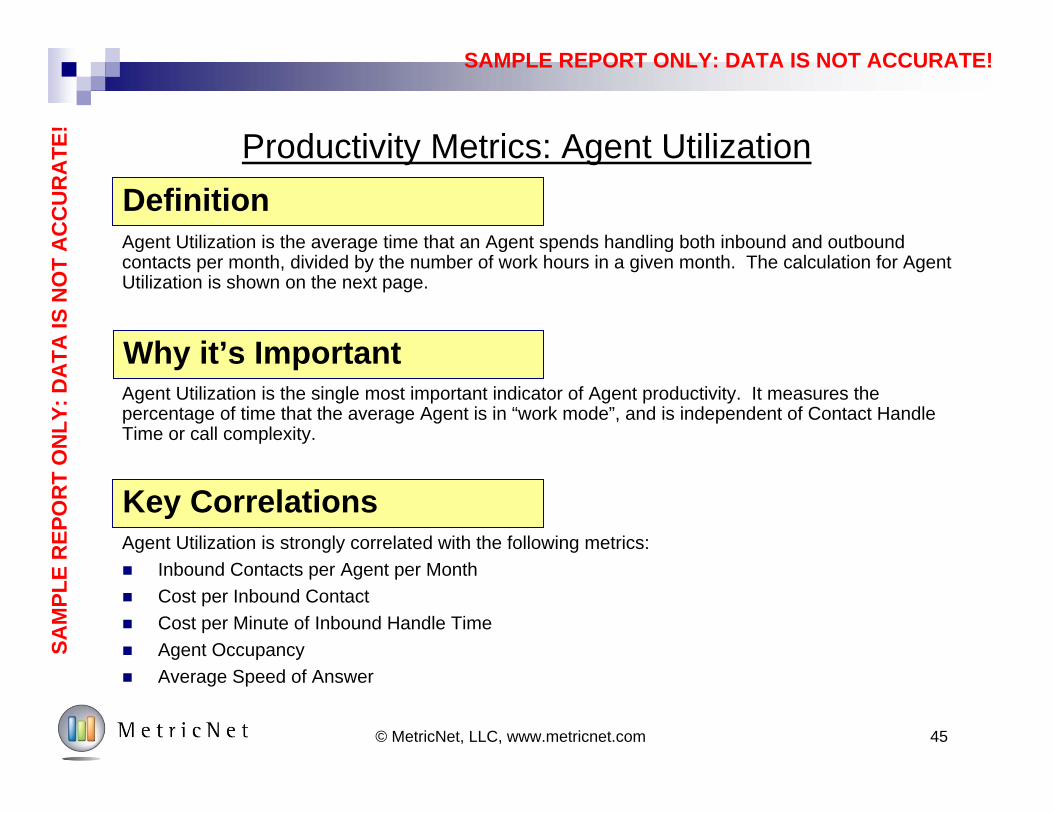
Productivity Metrics: Agent Utilization
Agent Utilization is strongly correlated with the following metrics: Inbound Contacts per Agent per Month Cost per Inbound Contact Cost per Minute of Inbound Handle Time Agent Occupancy Average Speed of Answer
Definition
Why it’s Important
Key Correlations
Agent Utilization is the single most important indicator of Agent productivity. It measures the percentage of time that the average Agent is in “work mode”, and is independent of Contact Handle Time or call complexity.
Agent Utilization is the average time that an Agent spends handling both inbound and outbound contacts per month, divided by the number of work hours in a given month. The calculation for Agent Utilization is shown on the next page.
SAM
PLE
REP
OR
T O
NLY
: DA
TA IS
NO
T A
CC
UR
ATE
!
SAMPLE REPORT ONLY: DATA IS NOT ACCURATE!
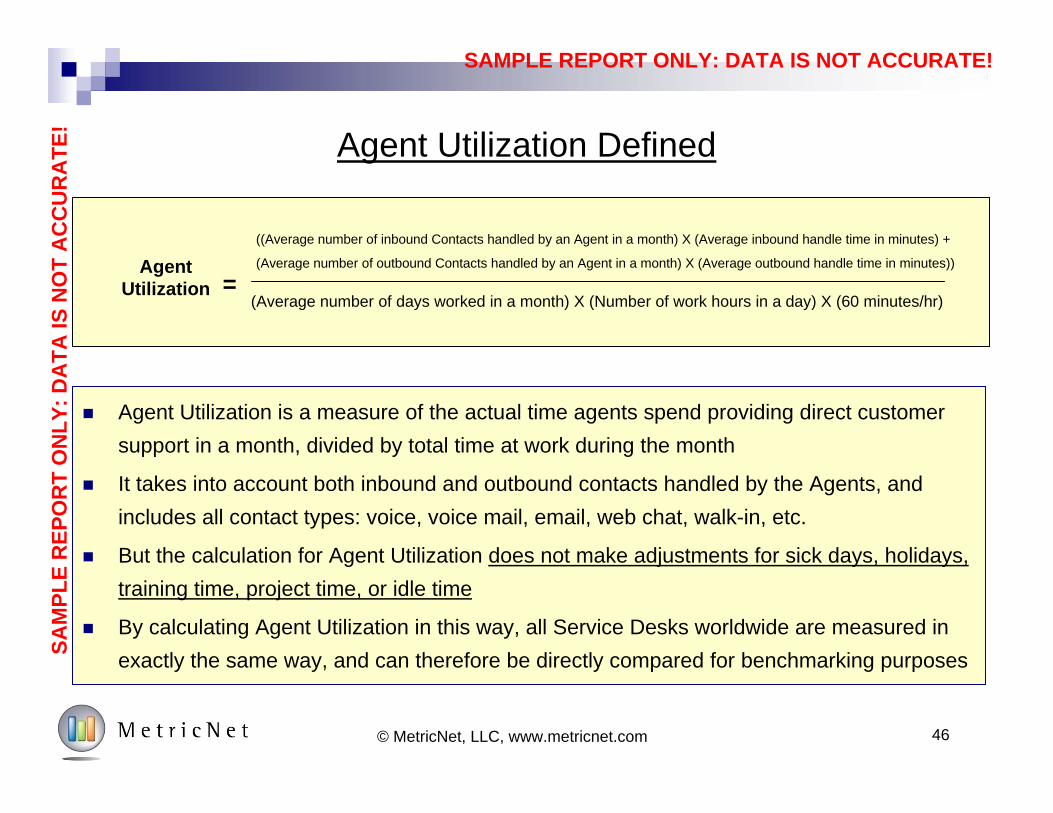
Agent Utilization Defined
Agent Utilization is a measure of the actual time agents spend providing direct customer support in a month, divided by total time at work during the month
It takes into account both inbound and outbound contacts handled by the Agents, and includes all contact types: voice, voice mail, email, web chat, walk-in, etc.
But the calculation for Agent Utilization does not make adjustments for sick days, holidays, training time, project time, or idle time
By calculating Agent Utilization in this way, all Service Desks worldwide are measured in exactly the same way, and can therefore be directly compared for benchmarking purposes
Agent Utilization
((Average number of inbound Contacts handled by an Agent in a month) X (Average inbound handle time in minutes) +
(Average number of outbound Contacts handled by an Agent in a month) X (Average outbound handle time in minutes))
(Average number of days worked in a month) X (Number of work hours in a day) X (60 minutes/hr)=
46© MetricNet, LLC, www.metricnet.com
SAM
PLE
REP
OR
T O
NLY
: DA
TA IS
NO
T A
CC
UR
ATE
!
SAMPLE REPORT ONLY: DATA IS NOT ACCURATE!
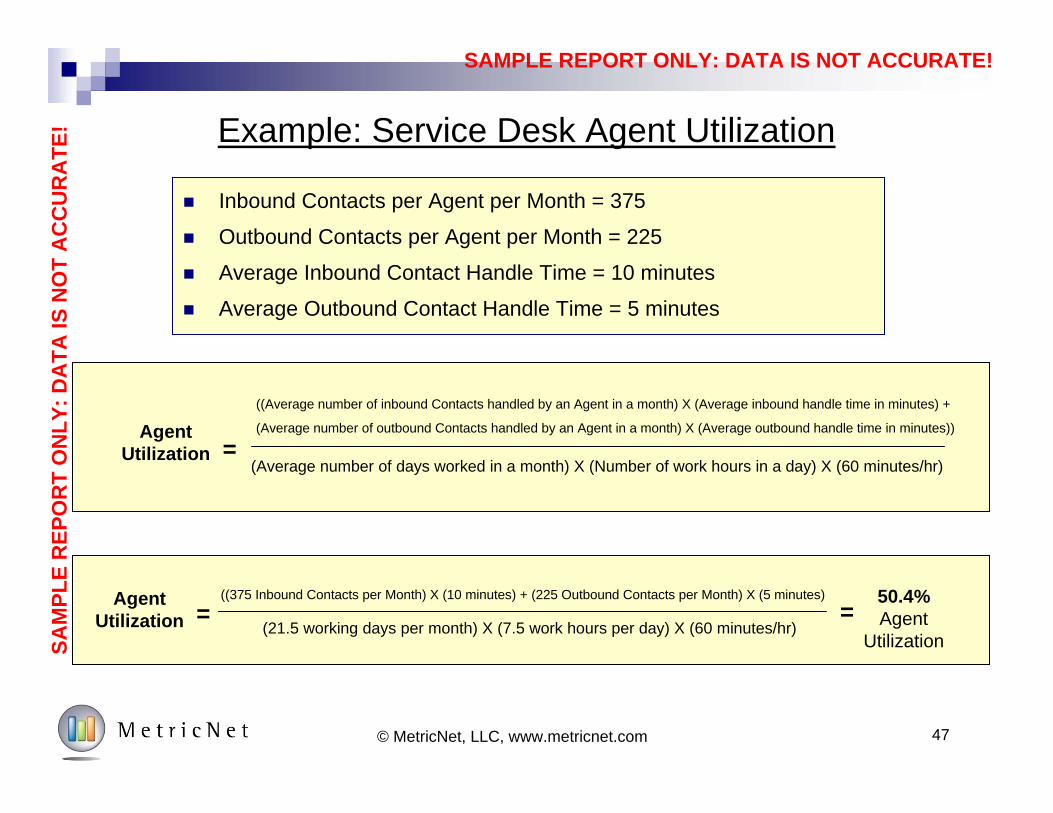
Example: Service Desk Agent Utilization
Inbound Contacts per Agent per Month = 375
Outbound Contacts per Agent per Month = 225
Average Inbound Contact Handle Time = 10 minutes
Average Outbound Contact Handle Time = 5 minutes
Agent Utilization
((375 Inbound Contacts per Month) X (10 minutes) + (225 Outbound Contacts per Month) X (5 minutes)
(21.5 working days per month) X (7.5 work hours per day) X (60 minutes/hr)= =
50.4% Agent
Utilization
Agent Utilization
((Average number of inbound Contacts handled by an Agent in a month) X (Average inbound handle time in minutes) +
(Average number of outbound Contacts handled by an Agent in a month) X (Average outbound handle time in minutes))
(Average number of days worked in a month) X (Number of work hours in a day) X (60 minutes/hr)=
47© MetricNet, LLC, www.metricnet.com
SAM
PLE
REP
OR
T O
NLY
: DA
TA IS
NO
T A
CC
UR
ATE
!
SAMPLE REPORT ONLY: DATA IS NOT ACCURATE!
0.0%
10.0%
20.0%
30.0%
40.0%
50.0%
60.0%
70.0%
Age
nt U
tiliz
atio
n
48© MetricNet, LLC, www.metricnet.com
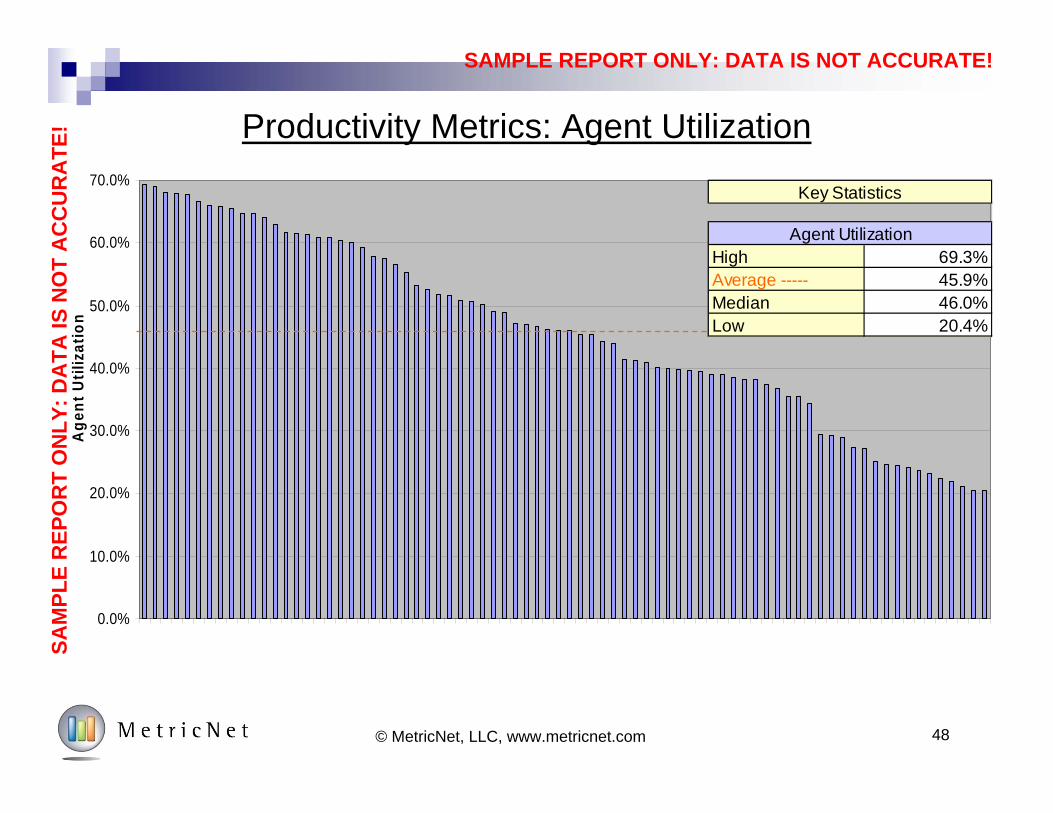
Productivity Metrics: Agent Utilization
High 69.3%Average ----- 45.9%Median 46.0%Low 20.4%
Key Statistics
Agent Utilization
SAM
PLE
REP
OR
T O
NLY
: DA
TA IS
NO
T A
CC
UR
ATE
!
SAMPLE REPORT ONLY: DATA IS NOT ACCURATE!
49© MetricNet, LLC, www.metricnet.com
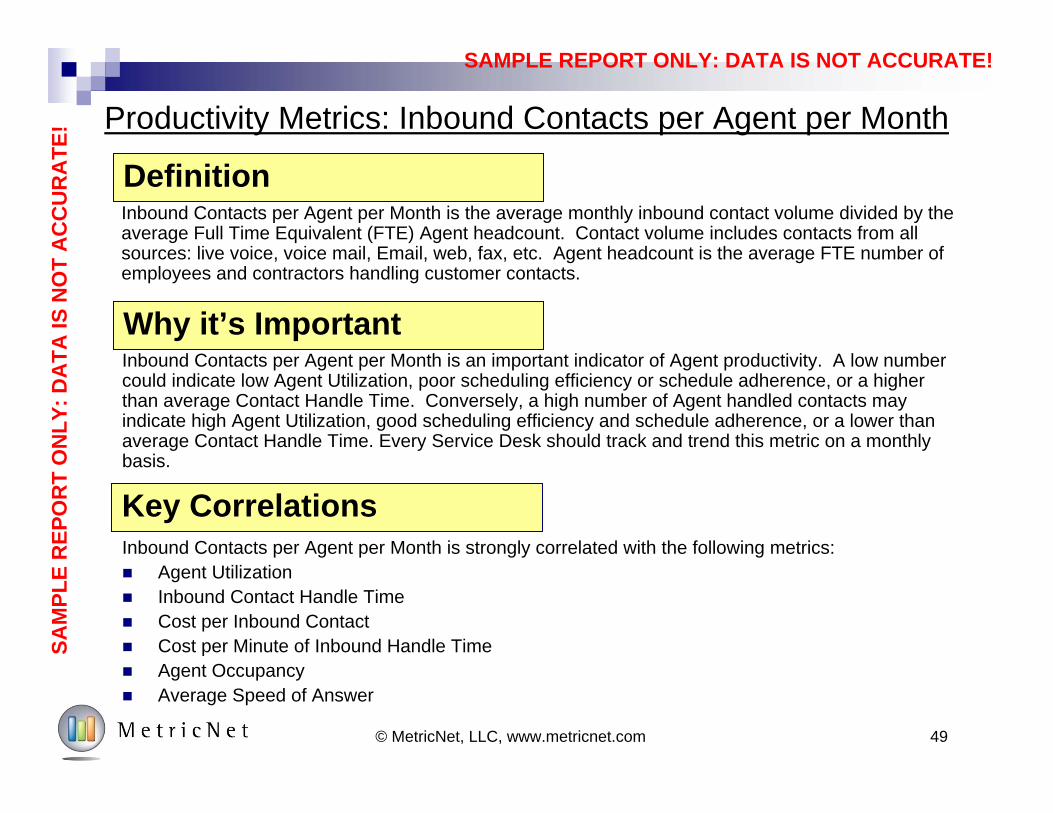
Productivity Metrics: Inbound Contacts per Agent per Month
Inbound Contacts per Agent per Month is strongly correlated with the following metrics: Agent Utilization Inbound Contact Handle Time Cost per Inbound Contact Cost per Minute of Inbound Handle Time Agent Occupancy Average Speed of Answer
Definition
Why it’s Important
Key Correlations
Inbound Contacts per Agent per Month is an important indicator of Agent productivity. A low number could indicate low Agent Utilization, poor scheduling efficiency or schedule adherence, or a higher than average Contact Handle Time. Conversely, a high number of Agent handled contacts may indicate high Agent Utilization, good scheduling efficiency and schedule adherence, or a lower than average Contact Handle Time. Every Service Desk should track and trend this metric on a monthly basis.
Inbound Contacts per Agent per Month is the average monthly inbound contact volume divided by the average Full Time Equivalent (FTE) Agent headcount. Contact volume includes contacts from all sources: live voice, voice mail, Email, web, fax, etc. Agent headcount is the average FTE number of employees and contractors handling customer contacts.
SAM
PLE
REP
OR
T O
NLY
: DA
TA IS
NO
T A
CC
UR
ATE
!
SAMPLE REPORT ONLY: DATA IS NOT ACCURATE!
50© MetricNet, LLC, www.metricnet.com
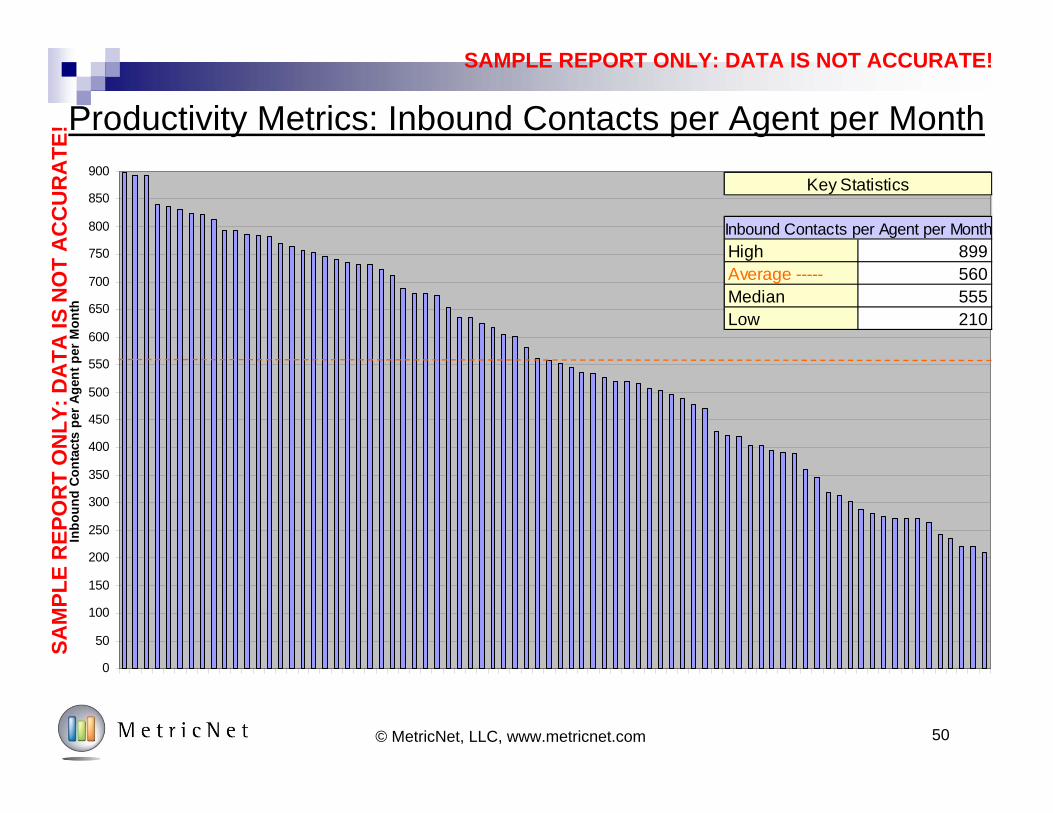
Productivity Metrics: Inbound Contacts per Agent per Month
0
50
100
150
200
250
300
350
400
450
500
550
600
650
700
750
800
850
900
Inbo
und
Cont
acts
per
Age
nt p
er M
onth
High 899Average ----- 560Median 555Low 210
Key Statistics
Inbound Contacts per Agent per Month
SAM
PLE
REP
OR
T O
NLY
: DA
TA IS
NO
T A
CC
UR
ATE
!
SAMPLE REPORT ONLY: DATA IS NOT ACCURATE!
51© MetricNet, LLC, www.metricnet.com
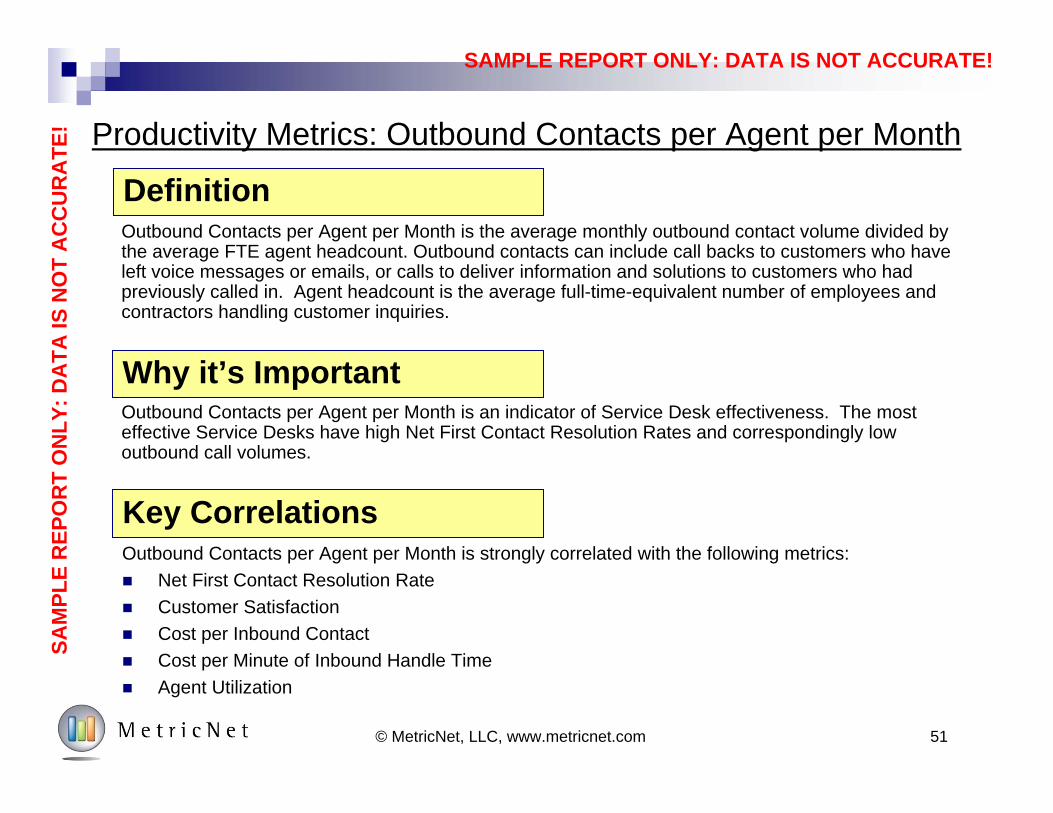
Productivity Metrics: Outbound Contacts per Agent per Month
Outbound Contacts per Agent per Month is strongly correlated with the following metrics: Net First Contact Resolution Rate Customer Satisfaction Cost per Inbound Contact Cost per Minute of Inbound Handle Time Agent Utilization
Definition
Why it’s Important
Key Correlations
Outbound Contacts per Agent per Month is an indicator of Service Desk effectiveness. The most effective Service Desks have high Net First Contact Resolution Rates and correspondingly low outbound call volumes.
Outbound Contacts per Agent per Month is the average monthly outbound contact volume divided by the average FTE agent headcount. Outbound contacts can include call backs to customers who have left voice messages or emails, or calls to deliver information and solutions to customers who had previously called in. Agent headcount is the average full-time-equivalent number of employees and contractors handling customer inquiries.
SAM
PLE
REP
OR
T O
NLY
: DA
TA IS
NO
T A
CC
UR
ATE
!
SAMPLE REPORT ONLY: DATA IS NOT ACCURATE!
52© MetricNet, LLC, www.metricnet.com
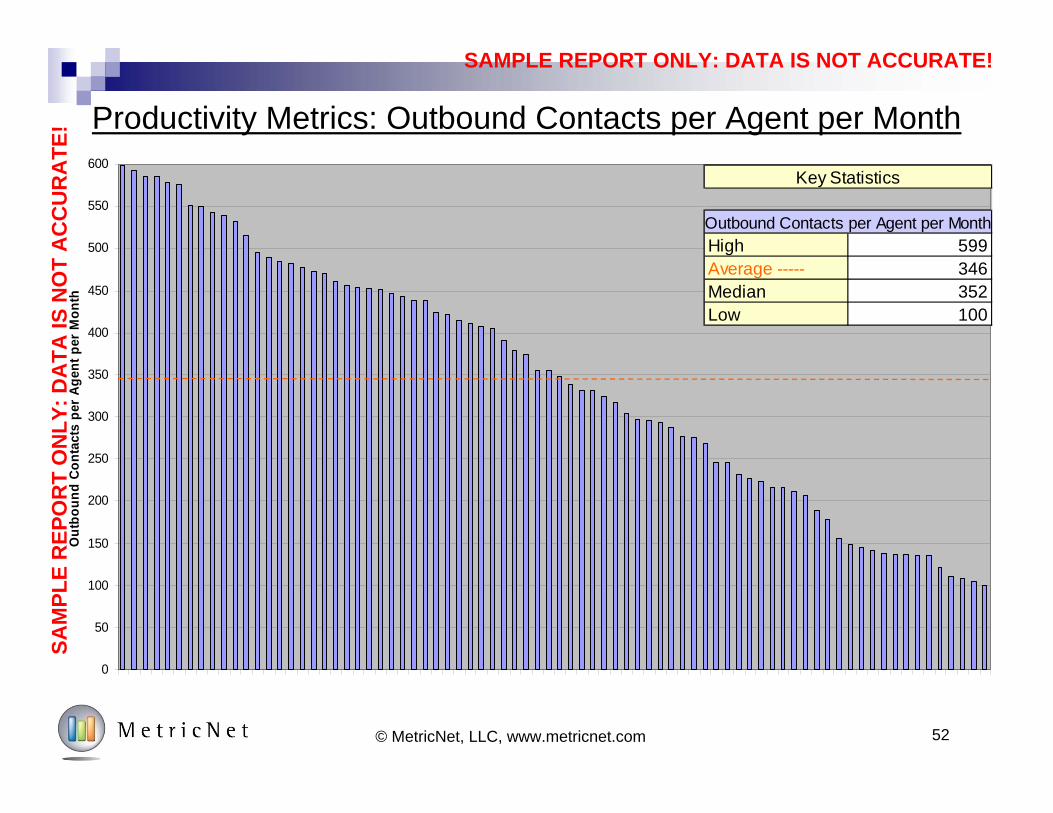
Productivity Metrics: Outbound Contacts per Agent per Month
0
50
100
150
200
250
300
350
400
450
500
550
600
Out
boun
d Co
ntac
ts p
er A
gent
per
Mon
th
High 599Average ----- 346Median 352Low 100
Key Statistics
Outbound Contacts per Agent per Month
SAM
PLE
REP
OR
T O
NLY
: DA
TA IS
NO
T A
CC
UR
ATE
!
SAMPLE REPORT ONLY: DATA IS NOT ACCURATE!
53© MetricNet, LLC, www.metricnet.com
Productivity Metrics: Agents as a % of Total Headcount
Agents as a % of Total Headcount is strongly correlated with the following metrics: Cost per Inbound Contact Cost per Minute of Inbound Handle Time
Definition
Why it’s Important
Key Correlations
The agent headcount as a percent of total Service Desk headcount is an important measure of management and overhead efficiency. Since non-agents include both management and non-management personnel (e.g., supervisors and team leads, QA/QC, trainers, etc.), this metric is not a pure measure of management span of control. It is, however, a more useful metric than management span of control because the denominator of this ratio takes into account all personnel that are not directly engaged in customer service activities.
This metric is the Full Time Equivalent agent headcount divided by the total Service Desk headcount. It is expressed as a percentage, and represents the percentage of total Service Desk personnel who are engaged in direct customer service activities.
SAM
PLE
REP
OR
T O
NLY
: DA
TA IS
NO
T A
CC
UR
ATE
!
SAMPLE REPORT ONLY: DATA IS NOT ACCURATE!
54© MetricNet, LLC, www.metricnet.com
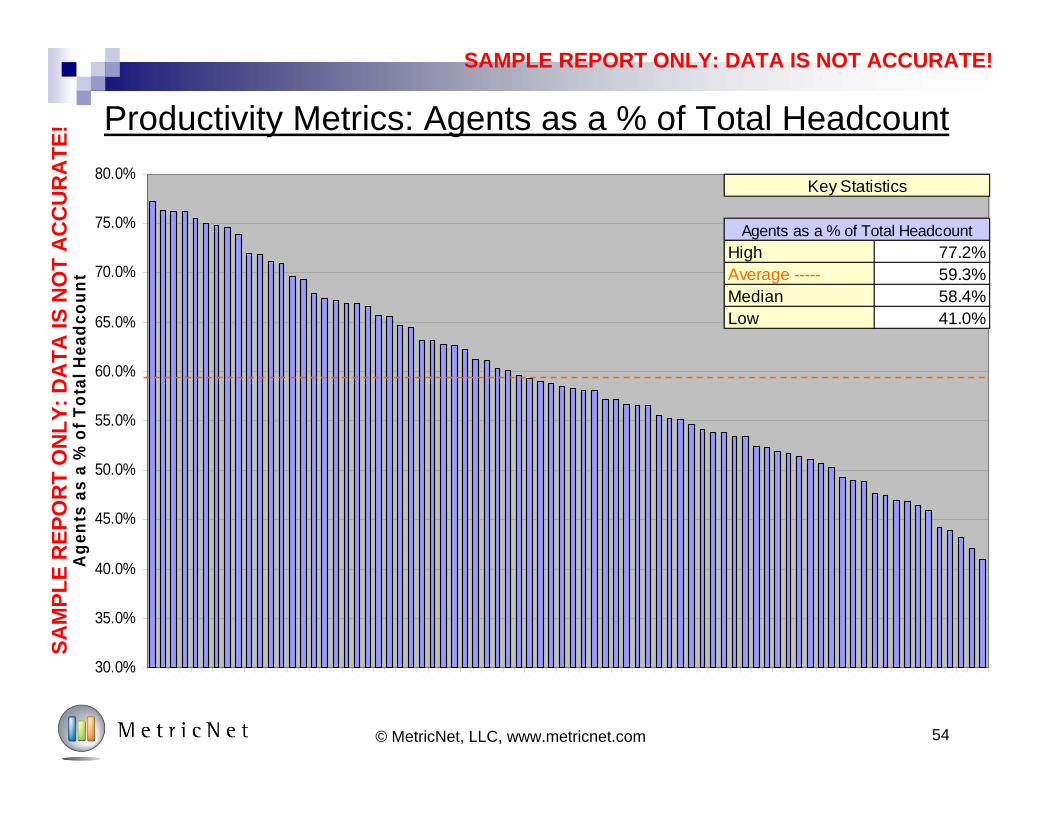
Productivity Metrics: Agents as a % of Total Headcount
30.0%
35.0%
40.0%
45.0%
50.0%
55.0%
60.0%
65.0%
70.0%
75.0%
80.0%
Age
nts
as a
% o
f Tot
al H
eadc
ount
High 77.2%Average ----- 59.3%Median 58.4%Low 41.0%
Key Statistics
Agents as a % of Total Headcount
SAM
PLE
REP
OR
T O
NLY
: DA
TA IS
NO
T A
CC
UR
ATE
!
SAMPLE REPORT ONLY: DATA IS NOT ACCURATE!
Service Level Metrics
55© MetricNet, LLC, www.metricnet.com
SAMPLE REPORT ONLY: DATA IS NOT ACCURATE!
56© MetricNet, LLC, www.metricnet.com
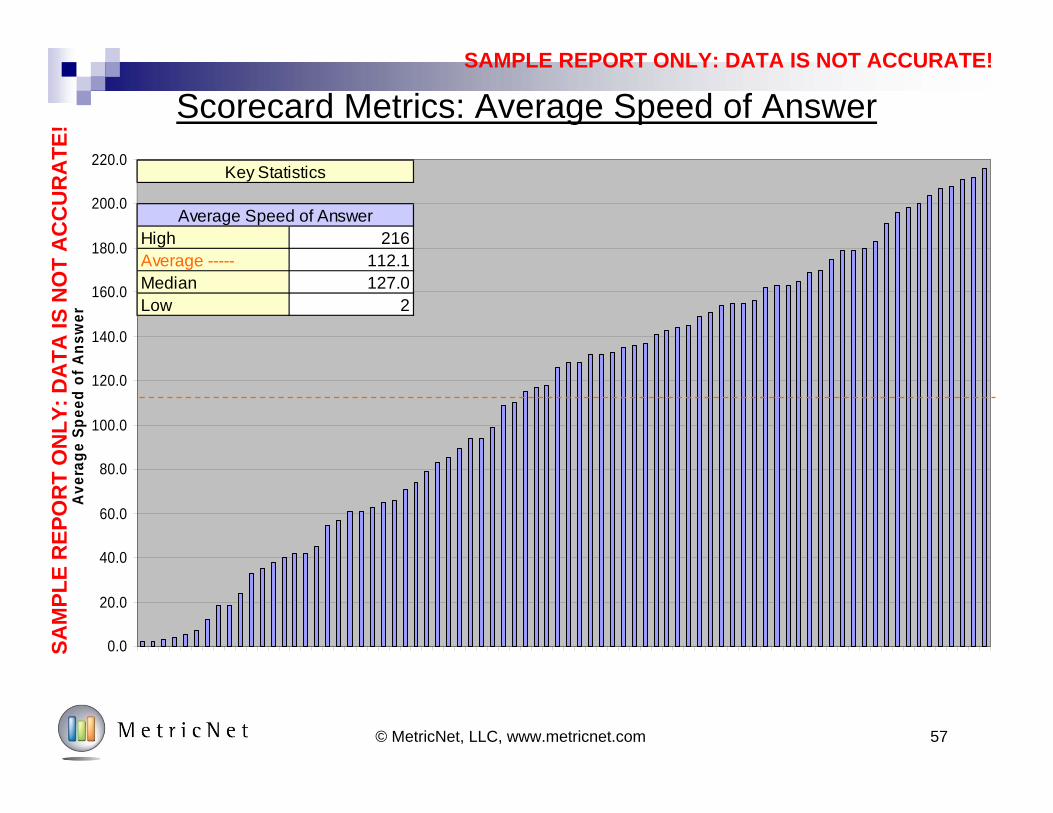
Service Level Metrics: Average Speed of Answer (ASA)
Average Speed of Answer is strongly correlated with the following metrics: Call Abandonment Rate Percentage of Calls Answered in 30 Seconds Agent Utilization
Definition
Why it’s Important
Key Correlations
ASA is a common service level metric in the Service Desk industry. It is an indication of how responsive a Service Desk is to incoming calls. Since most Service Desks have an ASA service level target, the ASA is tracked to ensure service level compliance.
Average Speed of Answer is the total wait time that callers are in queue, divided by the number of calls handled. This includes both IVR-handled calls as well as calls handled by a live Agent. Most ACD systems provide this number.
SAM
PLE
REP
OR
T O
NLY
: DA
TA IS
NO
T A
CC
UR
ATE
!
SAMPLE REPORT ONLY: DATA IS NOT ACCURATE!
57© MetricNet, LLC, www.metricnet.com
Scorecard Metrics: Average Speed of Answer
0.0
20.0
40.0
60.0
80.0
100.0
120.0
140.0
160.0
180.0
200.0
220.0
Ave
rage
Spe
ed o
f Ans
wer
High 216Average ----- 112.1Median 127.0Low 2
Average Speed of Answer
Key Statistics
SAM
PLE
REP
OR
T O
NLY
: DA
TA IS
NO
T A
CC
UR
ATE
!
SAMPLE REPORT ONLY: DATA IS NOT ACCURATE!
58© MetricNet, LLC, www.metricnet.com
Service Level Metrics: % of Calls Answered in 30 Seconds
The Percentage of Calls Answered Within 30 Seconds is strongly correlated with the following metrics: Average Speed of Answer Call Abandonment Rate Agent Utilization
Definition
Why it’s Important
Key Correlations
The percentage of calls answered within 30 seconds is a common service level metric in the industry. It is an indication of how responsive a Service Desk is to incoming calls. Many Service Desks have a service level target for the percentage of calls answered within 30 seconds, so the metric is tracked to ensure service level compliance.
This metric is fairly self explanatory. It is the percentage of all incoming calls that are answered by a live Agent within 30 seconds. For those who don’t track this exact metric, but track a similar metric such as % answered within 60 seconds, MetricNet uses a conversion formula to calculate the equivalent percentage of calls answered within 30 seconds.
SAM
PLE
REP
OR
T O
NLY
: DA
TA IS
NO
T A
CC
UR
ATE
!
SAMPLE REPORT ONLY: DATA IS NOT ACCURATE!
59© MetricNet, LLC, www.metricnet.com
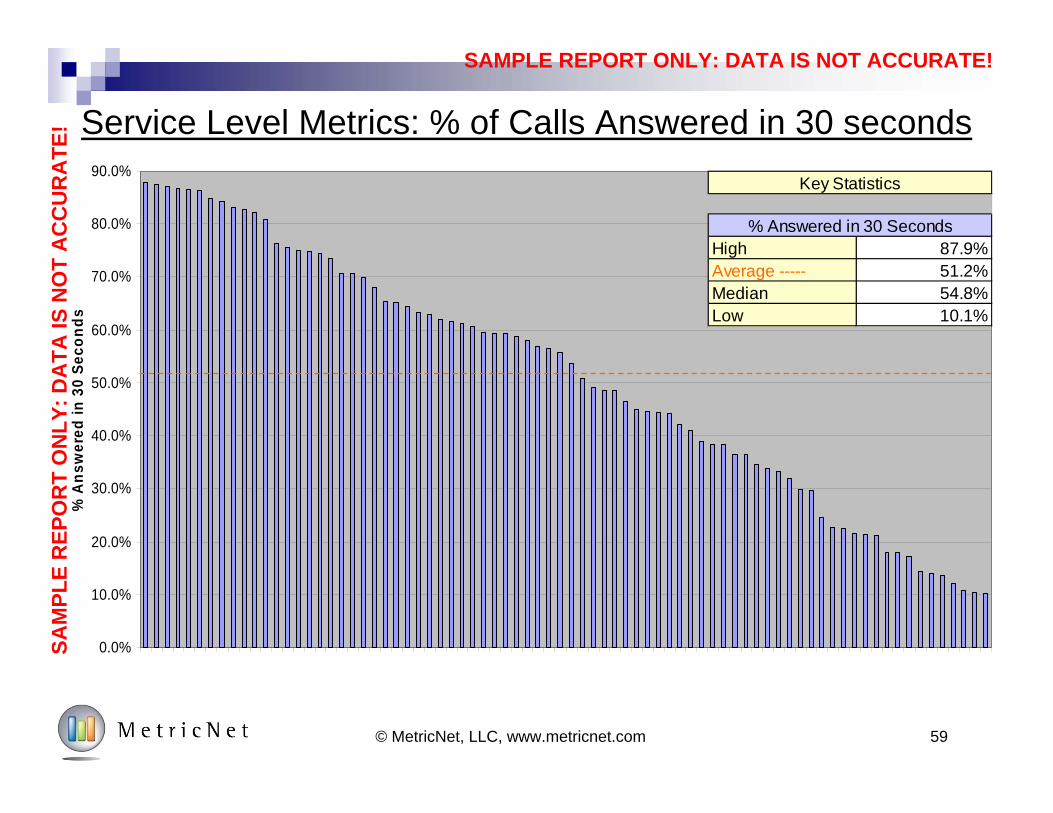
Service Level Metrics: % of Calls Answered in 30 seconds
0.0%
10.0%
20.0%
30.0%
40.0%
50.0%
60.0%
70.0%
80.0%
90.0%
% A
nsw
ered
in 3
0 Se
cond
s
High 87.9%Average ----- 51.2%Median 54.8%Low 10.1%
Key Statistics
% Answered in 30 Seconds
SAM
PLE
REP
OR
T O
NLY
: DA
TA IS
NO
T A
CC
UR
ATE
!
SAMPLE REPORT ONLY: DATA IS NOT ACCURATE!
60© MetricNet, LLC, www.metricnet.com
Service Level Metrics: Call Abandonment Rate
Call Abandonment Rate is strongly correlated with the following metrics: Average Speed of Answer Percentage of Calls Answered in 30 Seconds Agent Utilization
Definition
Why it’s Important
Key Correlations
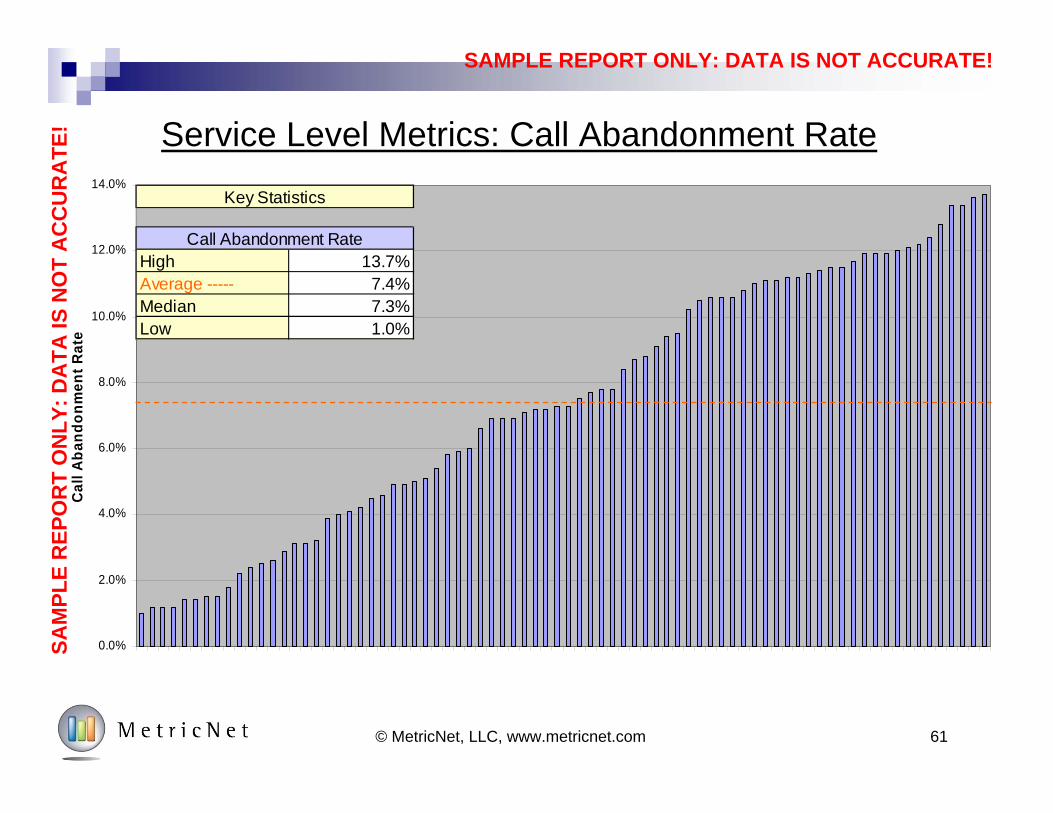
Call abandonment rate is a common service level metric in the Service Desk industry. An abandoned call is an indication that a caller has given up, and hung up the phone before receiving service from a live Agent or from an IVR. Since most Service Desks have an abandonment rate service level target, the call abandonment rate is tracked to ensure service level compliance.
Call Abandonment Rate is the percentage of calls that were connected to the ACD, but were disconnected by the caller before reaching an Agent, or before completing a process within the IVR.
SAM
PLE
REP
OR
T O
NLY
: DA
TA IS
NO
T A
CC
UR
ATE
!
SAMPLE REPORT ONLY: DATA IS NOT ACCURATE!
61© MetricNet, LLC, www.metricnet.com
Service Level Metrics: Call Abandonment Rate
0.0%
2.0%
4.0%
6.0%
8.0%
10.0%
12.0%
14.0%
Cal
l Aba
ndon
men
t Rat
e
High 13.7%Average ----- 7.4%Median 7.3%Low 1.0%
Key Statistics
Call Abandonment Rate
SAM
PLE
REP
OR
T O
NLY
: DA
TA IS
NO
T A
CC
UR
ATE
!
SAMPLE REPORT ONLY: DATA IS NOT ACCURATE!
Quality Metrics
62© MetricNet, LLC, www.metricnet.com
SAMPLE REPORT ONLY: DATA IS NOT ACCURATE!
63© MetricNet, LLC, www.metricnet.com
Quality Metrics: Customer Satisfaction
Customer Satisfaction is strongly correlated with the following metrics: First Contact Resolution Rate Call Quality
Definition
Why it’s Important
Key Correlations
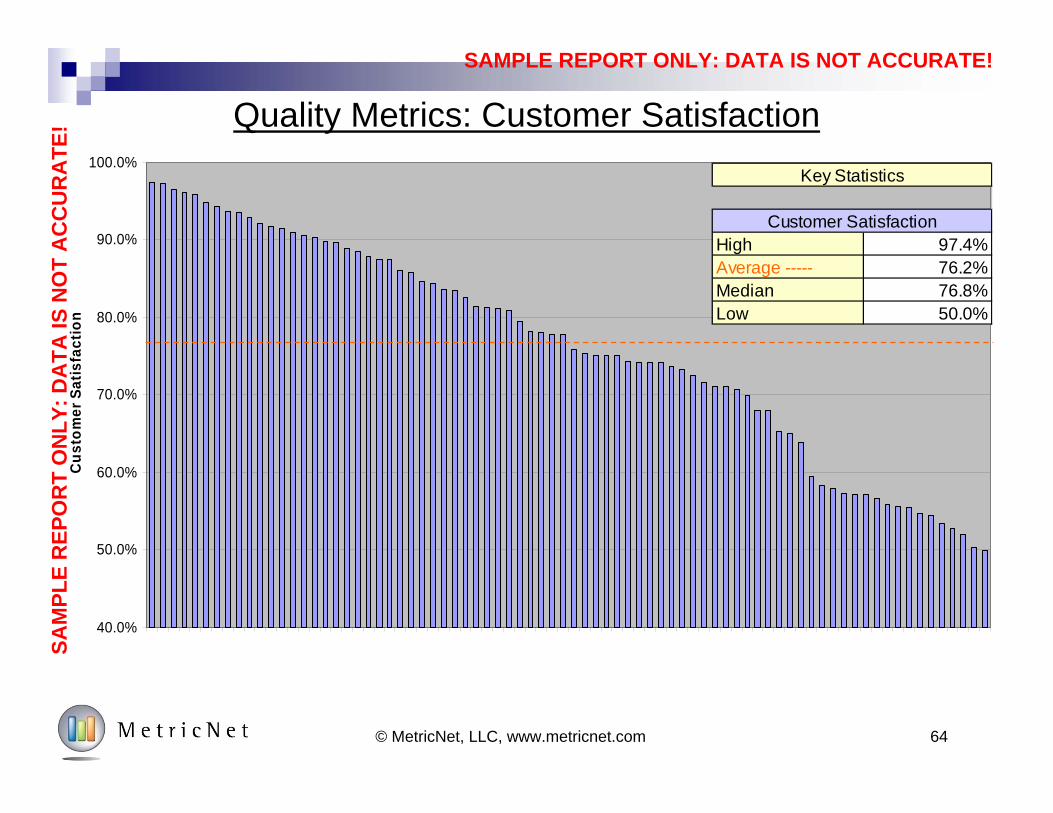
Customer Satisfaction is the single most important measure of Service Desk quality. Any successful Service Desk will have consistently high Customer Satisfaction ratings. Some Service Desk managers are under the impression that a low Cost per Inbound Contact may justify a lower level of Customer Satisfaction. But this is not true. MetricNet’s research shows that even Service Desk’s with a very low Cost per Inbound Contact can achieve consistently high Customer Satisfaction ratings.
Customer Satisfaction is the percentage of customers who are either satisfied or very satisfied with their Service Desk experience. This metric can be captured in a numbers of ways including automatic after-call IVR surveys, follow-up outbound (live Agent) calls, Email surveys, postal surveys, etc.
SAM
PLE
REP
OR
T O
NLY
: DA
TA IS
NO
T A
CC
UR
ATE
!
SAMPLE REPORT ONLY: DATA IS NOT ACCURATE!
40.0%
50.0%
60.0%
70.0%
80.0%
90.0%
100.0%
Cus
tom
er S
atis
fact
ion
64© MetricNet, LLC, www.metricnet.com
Quality Metrics: Customer Satisfaction
High 97.4%Average ----- 76.2%Median 76.8%Low 50.0%
Key Statistics
Customer Satisfaction
SAM
PLE
REP
OR
T O
NLY
: DA
TA IS
NO
T A
CC
UR
ATE
!
SAMPLE REPORT ONLY: DATA IS NOT ACCURATE!
65© MetricNet, LLC, www.metricnet.com
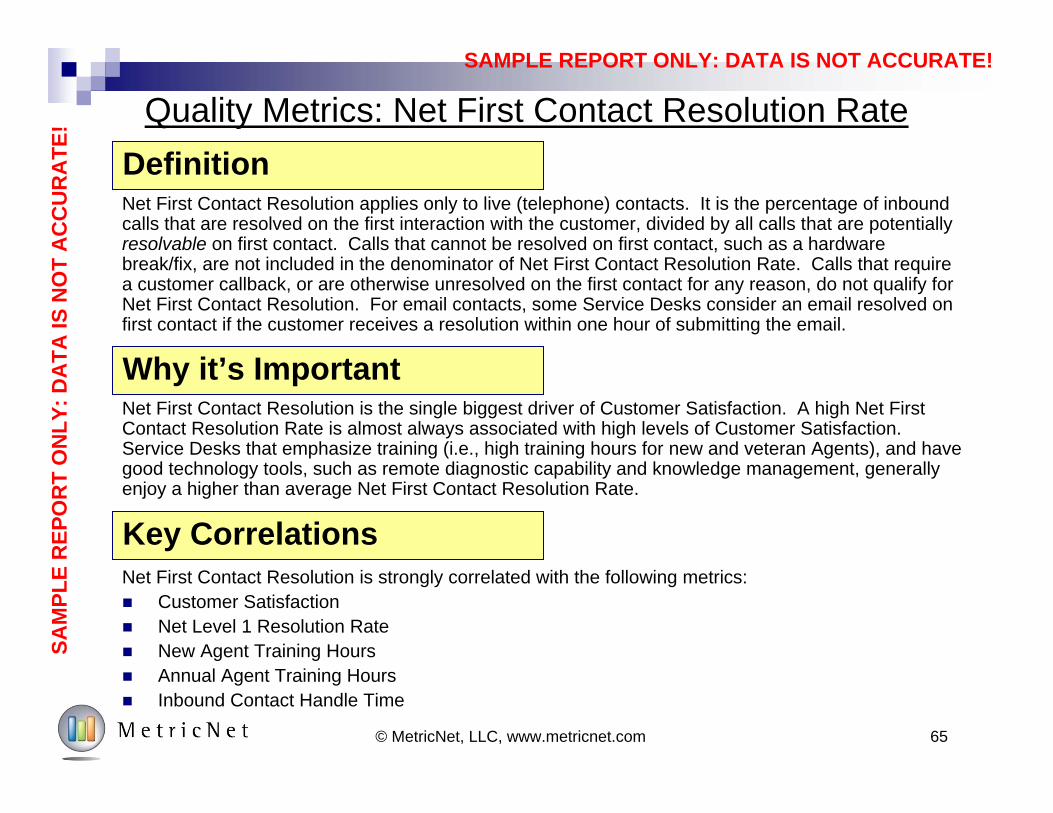
Quality Metrics: Net First Contact Resolution Rate
Net First Contact Resolution is strongly correlated with the following metrics: Customer Satisfaction Net Level 1 Resolution Rate New Agent Training Hours Annual Agent Training Hours Inbound Contact Handle Time
Definition
Why it’s Important
Key Correlations
Net First Contact Resolution is the single biggest driver of Customer Satisfaction. A high Net First Contact Resolution Rate is almost always associated with high levels of Customer Satisfaction. Service Desks that emphasize training (i.e., high training hours for new and veteran Agents), and have good technology tools, such as remote diagnostic capability and knowledge management, generally enjoy a higher than average Net First Contact Resolution Rate.
Net First Contact Resolution applies only to live (telephone) contacts. It is the percentage of inbound calls that are resolved on the first interaction with the customer, divided by all calls that are potentially resolvable on first contact. Calls that cannot be resolved on first contact, such as a hardware break/fix, are not included in the denominator of Net First Contact Resolution Rate. Calls that require a customer callback, or are otherwise unresolved on the first contact for any reason, do not qualify for Net First Contact Resolution. For email contacts, some Service Desks consider an email resolved on first contact if the customer receives a resolution within one hour of submitting the email.
SAM
PLE
REP
OR
T O
NLY
: DA
TA IS
NO
T A
CC
UR
ATE
!
SAMPLE REPORT ONLY: DATA IS NOT ACCURATE!
66© MetricNet, LLC, www.metricnet.com
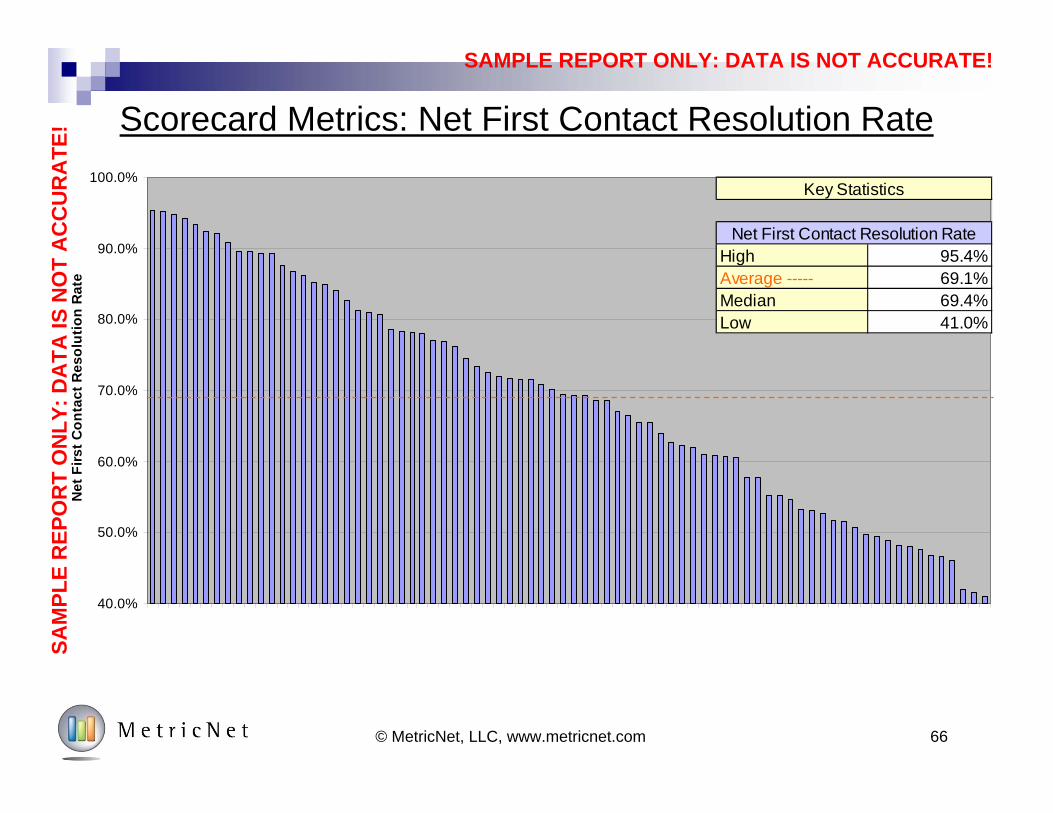
Scorecard Metrics: Net First Contact Resolution Rate
40.0%
50.0%
60.0%
70.0%
80.0%
90.0%
100.0%
Net
Firs
t Con
tact
Res
olut
ion
Rat
e
High 95.4%Average ----- 69.1%Median 69.4%Low 41.0%
Key Statistics
Net First Contact Resolution Rate
SAM
PLE
REP
OR
T O
NLY
: DA
TA IS
NO
T A
CC
UR
ATE
!
SAMPLE REPORT ONLY: DATA IS NOT ACCURATE!
67© MetricNet, LLC, www.metricnet.com
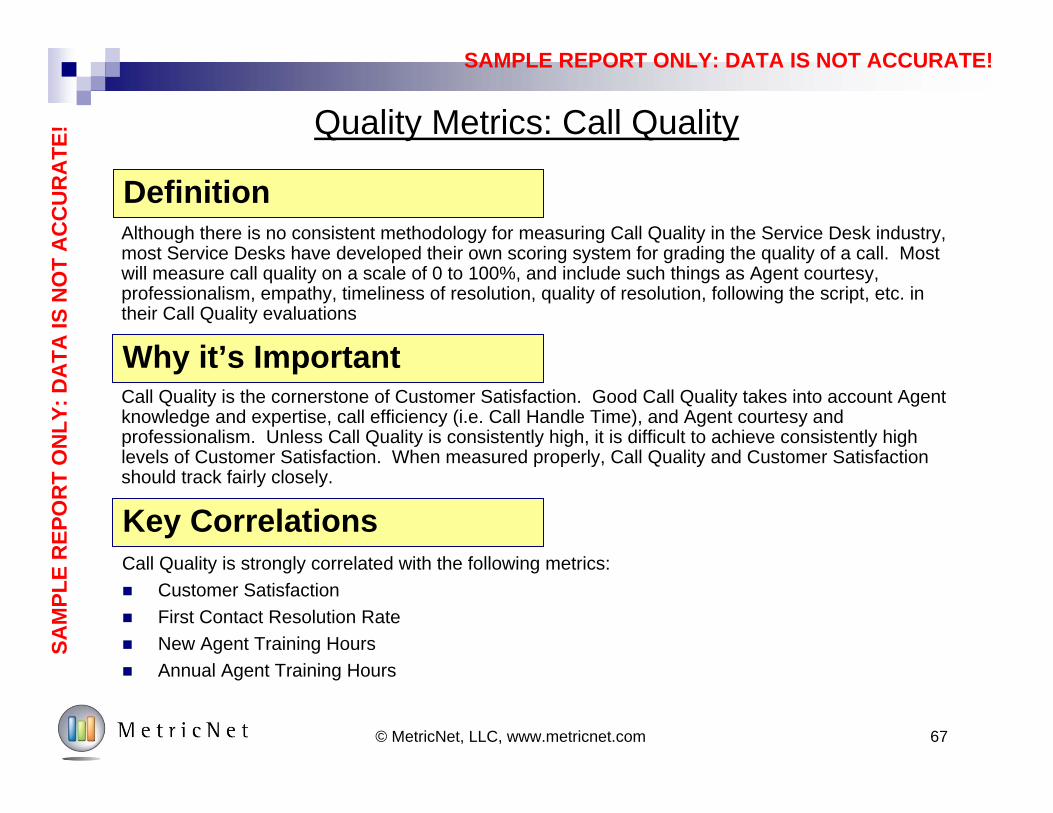
Quality Metrics: Call Quality
Call Quality is strongly correlated with the following metrics: Customer Satisfaction First Contact Resolution Rate New Agent Training Hours Annual Agent Training Hours
Definition
Why it’s Important
Key Correlations
Call Quality is the cornerstone of Customer Satisfaction. Good Call Quality takes into account Agent knowledge and expertise, call efficiency (i.e. Call Handle Time), and Agent courtesy and professionalism. Unless Call Quality is consistently high, it is difficult to achieve consistently high levels of Customer Satisfaction. When measured properly, Call Quality and Customer Satisfaction should track fairly closely.
Although there is no consistent methodology for measuring Call Quality in the Service Desk industry, most Service Desks have developed their own scoring system for grading the quality of a call. Most will measure call quality on a scale of 0 to 100%, and include such things as Agent courtesy, professionalism, empathy, timeliness of resolution, quality of resolution, following the script, etc. in their Call Quality evaluations
SAM
PLE
REP
OR
T O
NLY
: DA
TA IS
NO
T A
CC
UR
ATE
!
SAMPLE REPORT ONLY: DATA IS NOT ACCURATE!
68© MetricNet, LLC, www.metricnet.com
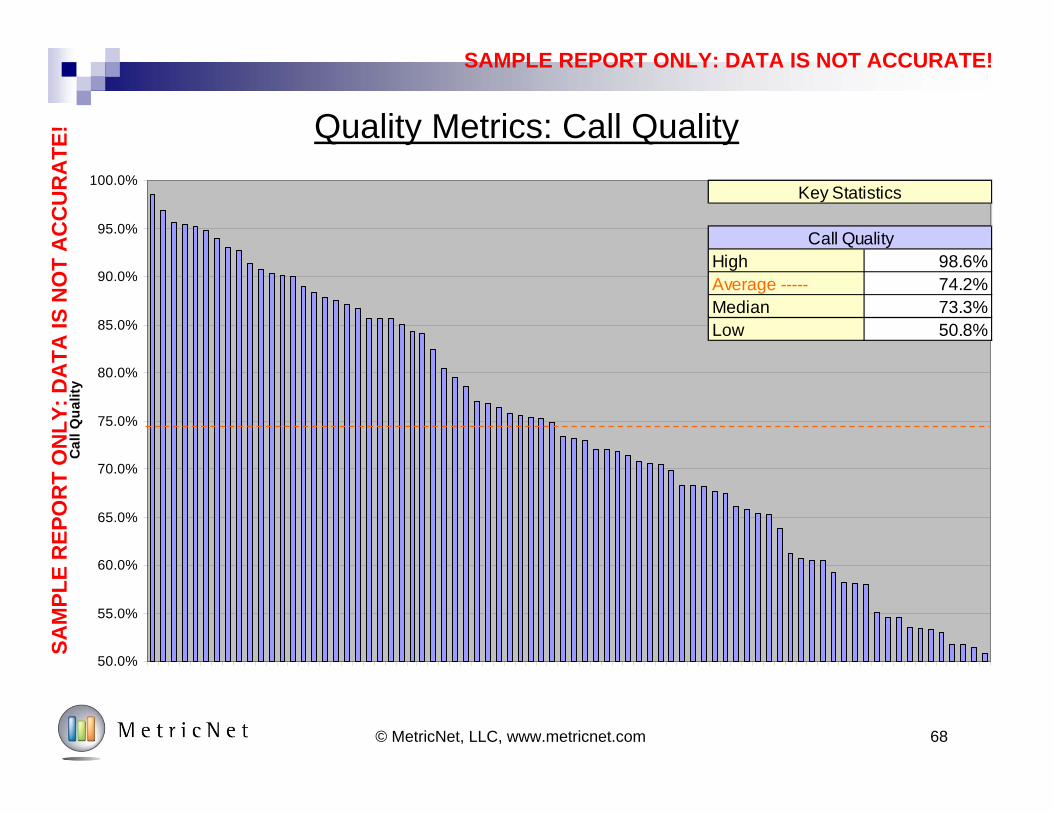
Quality Metrics: Call Quality
50.0%
55.0%
60.0%
65.0%
70.0%
75.0%
80.0%
85.0%
90.0%
95.0%
100.0%
Cal
l Qua
lity
High 98.6%Average ----- 74.2%Median 73.3%Low 50.8%
Key Statistics
Call Quality
SAM
PLE
REP
OR
T O
NLY
: DA
TA IS
NO
T A
CC
UR
ATE
!

SAMPLE REPORT ONLY: DATA IS NOT ACCURATE!
Agent Metrics
69© MetricNet, LLC, www.metricnet.com

SAMPLE REPORT ONLY: DATA IS NOT ACCURATE!
70© MetricNet, LLC, www.metricnet.com
Agent Metrics: Annual Agent Turnover
Annual Agent Turnover is strongly correlated with the following metrics: Daily Agent Absenteeism Annual Agent Training Hours Customer Satisfaction Net First Contact Resolution Rate Cost per Inbound Contact Agent Job Satisfaction
Definition
Why it’s Important
Key Correlations
Agent turnover is costly. Each time an Agent leaves the Service Desk, a new Agent needs to be hired to replace the outgoing Agent. This results in costly recruiting, hiring, and training expenses. Additionally, it is typically several weeks or even months before an Agent is fully productive, so there is lost productivity associated with Agent turnover as well. High Agent turnover is generally associated with low Agent morale in a Service Desk.
Annual Agent Turnover is the percentage of Agents that leave the Service Desk, for any reason (voluntarily or involuntarily), on an annual basis.
SAM
PLE
REP
OR
T O
NLY
: DA
TA IS
NO
T A
CC
UR
ATE
!
SAMPLE REPORT ONLY: DATA IS NOT ACCURATE!
0.0%
5.0%
10.0%
15.0%
20.0%
25.0%
30.0%
35.0%
40.0%
45.0%
50.0%
55.0%
60.0%
65.0%
70.0%
75.0%
80.0%
85.0%
90.0%
Annu
al A
gent
Tur
nove
r
71© MetricNet, LLC, www.metricnet.com
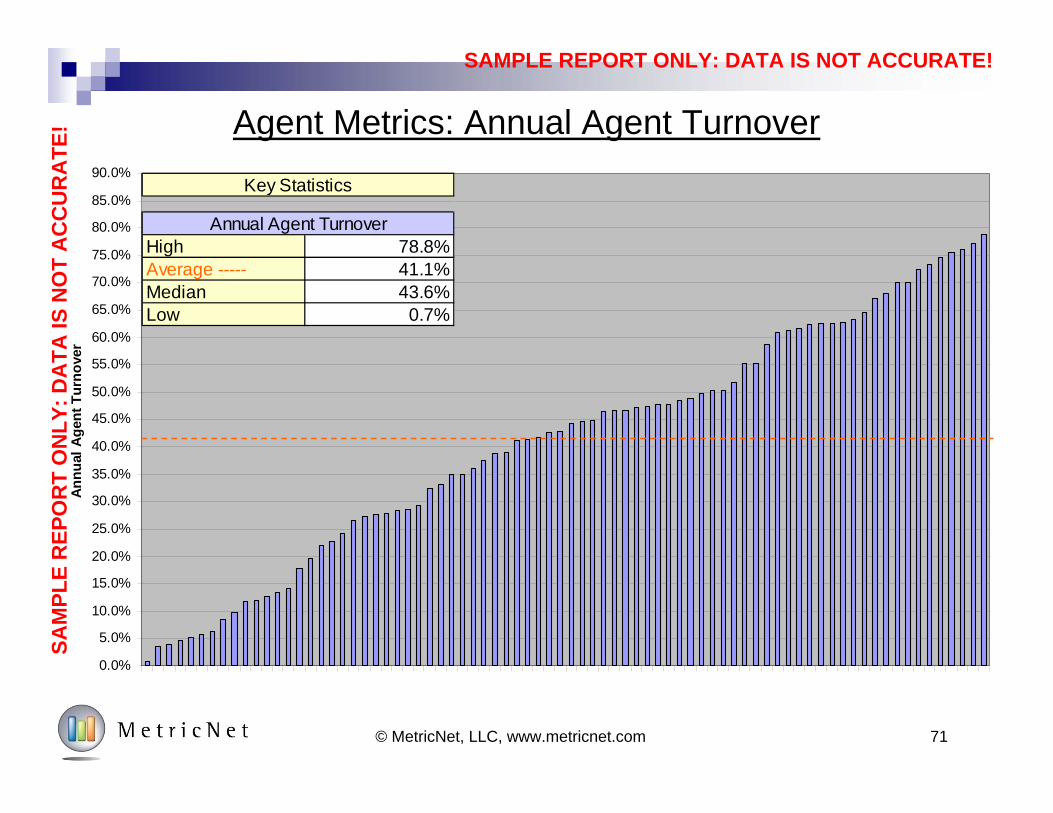
Agent Metrics: Annual Agent Turnover
High 78.8%Average ----- 41.1%Median 43.6%Low 0.7%
Key Statistics
Annual Agent Turnover
SAM
PLE
REP
OR
T O
NLY
: DA
TA IS
NO
T A
CC
UR
ATE
!
SAMPLE REPORT ONLY: DATA IS NOT ACCURATE!
72© MetricNet, LLC, www.metricnet.com
Agent Metrics: Daily Agent Absenteeism
Daily Agent Absenteeism is strongly correlated with the following metrics: Annual Agent Turnover Agent Job Satisfaction Agent Utilization Cost per Inbound Contact Contacts per Agent per Month
Definition
Why it’s Important
Key Correlations
High Agent Absenteeism is problematic because it makes it difficult for a Service Desk to schedule resources efficiently. High absenteeism can severely impact a Service Desk’s operating performance, and increase the likelihood that service level targets will be missed. A Service Desk’s ASA and Call Abandonment Rate typically suffer when absenteeism is high. Also, chronically high absenteeism is often a sign of low Agent morale.
Daily Agent Absenteeism is the average percentage of Agents with an unexcused absence on any given day. It is calculated by dividing the number of absent Agents by the total number of Agents that are scheduled to be at work.
SAM
PLE
REP
OR
T O
NLY
: DA
TA IS
NO
T A
CC
UR
ATE
!
SAMPLE REPORT ONLY: DATA IS NOT ACCURATE!
73© MetricNet, LLC, www.metricnet.com
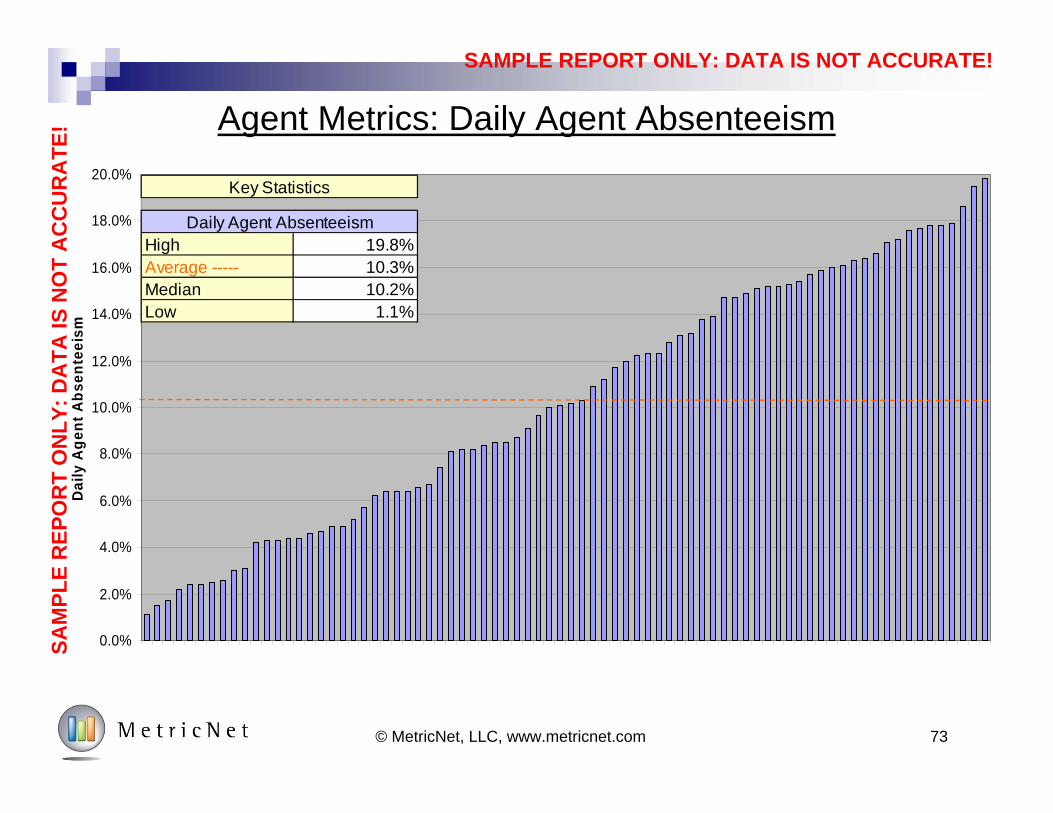
Agent Metrics: Daily Agent Absenteeism
0.0%
2.0%
4.0%
6.0%
8.0%
10.0%
12.0%
14.0%
16.0%
18.0%
20.0%
Dai
ly A
gent
Abs
ente
eism
High 19.8%Average ----- 10.3%Median 10.2%Low 1.1%
Daily Agent Absenteeism
Key Statistics
SAM
PLE
REP
OR
T O
NLY
: DA
TA IS
NO
T A
CC
UR
ATE
!
SAMPLE REPORT ONLY: DATA IS NOT ACCURATE!
74© MetricNet, LLC, www.metricnet.com
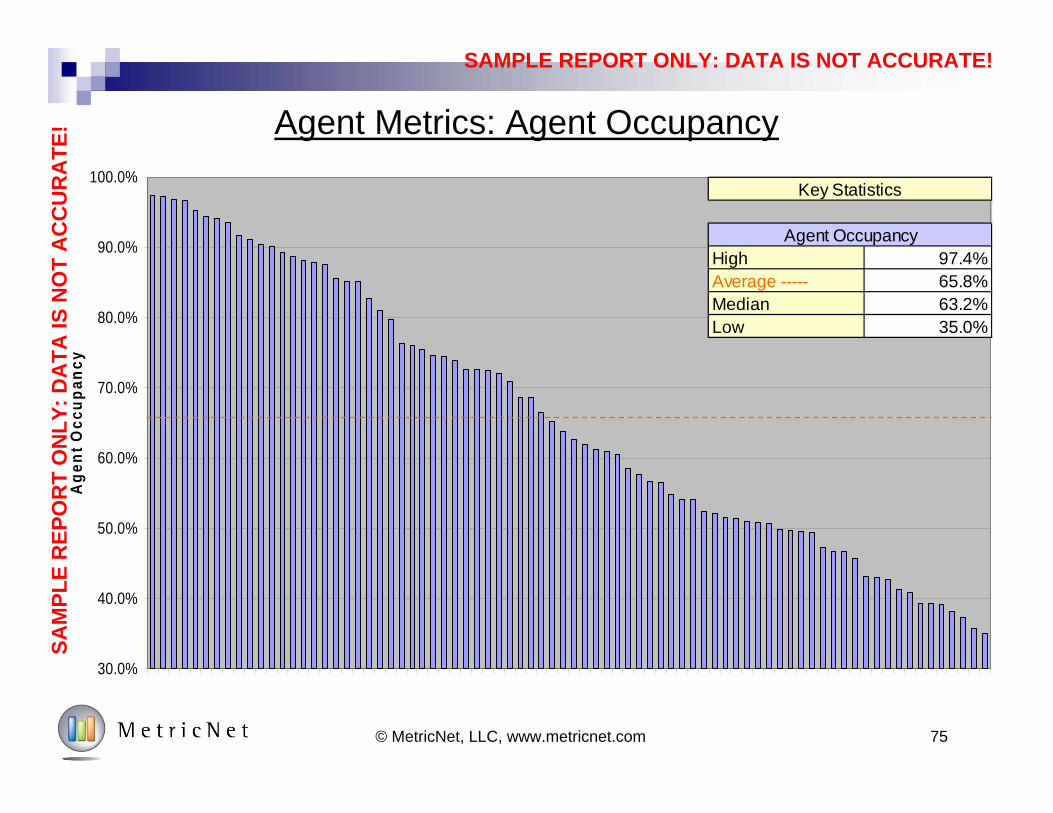
Agent Metrics: Agent Occupancy
Agent Occupancy is strongly correlated with the following metrics: Agent Utilization Agent Schedule Adherence Contacts per Agent per Month Cost per Inbound Contact
Definition
Why it’s Important
Key Correlations
Agent Occupancy is an indirect measure of Agent productivity and Schedule Adherence. High levels of Agent Occupancy are indicative of an orderly, disciplined work environment. Conversely, low levels of Agent Occupancy are often accompanied by a chaotic, undisciplined work environment. Agent Occupancy and Utilization are sometimes confused. Although Agent Occupancy and Agent Utilization are correlated, they are very different metrics. It is possible to have a high Occupancy (when Agents are logged into the ADC a large percentage of the time) but a low Agent Utilization (when few calls are coming in).
Agent Occupancy is the percentage of time that an Agent is in their seat connected to the ACD, and either engaged in a call or ready to answer a call, divided by the total number of hours at work (excluding break time and lunch time).
SAM
PLE
REP
OR
T O
NLY
: DA
TA IS
NO
T A
CC
UR
ATE
!
SAMPLE REPORT ONLY: DATA IS NOT ACCURATE!
Agent Metrics: Agent Occupancy
75© MetricNet, LLC, www.metricnet.com
30.0%
40.0%
50.0%
60.0%
70.0%
80.0%
90.0%
100.0%
Age
nt O
ccup
ancy
High 97.4%Average ----- 65.8%Median 63.2%Low 35.0%
Key Statistics
Agent Occupancy
SAM
PLE
REP
OR
T O
NLY
: DA
TA IS
NO
T A
CC
UR
ATE
!
SAMPLE REPORT ONLY: DATA IS NOT ACCURATE!
76
Agent Metrics: Agent Schedule Adherence
Agent schedule adherence is strongly correlated with the following metrics: Agent Utilization Inbound Contacts per Agent per Month Agent Occupancy Average Speed of Answer
Definition
Why it’s Important
Key Correlations
Effective agent scheduling is critical to achieving a Service Desk’s service level goals and maximizing Agent Utilization. However, a work schedule, no matter how well constructed, is only as good as the adherence to the schedule. It is therefore important for agents to adhere to the schedule as closely as possible to ensure that these productivity and service level goals are met.
Agent Schedule Adherence is a measure of whether agents are in their seats ready to accept calls as scheduled. It measures how well a Service Desk’s agents are “adhering” to the schedule. Agent Schedule Adherence is equal to the actual time that an agent is logged in to the system ready to accept calls, divided by the total time the agent is scheduled to be available to accept calls.
© MetricNet, LLC, www.metricnet.com
SAM
PLE
REP
OR
T O
NLY
: DA
TA IS
NO
T A
CC
UR
ATE
!
SAMPLE REPORT ONLY: DATA IS NOT ACCURATE!
77© MetricNet, LLC, www.metricnet.com
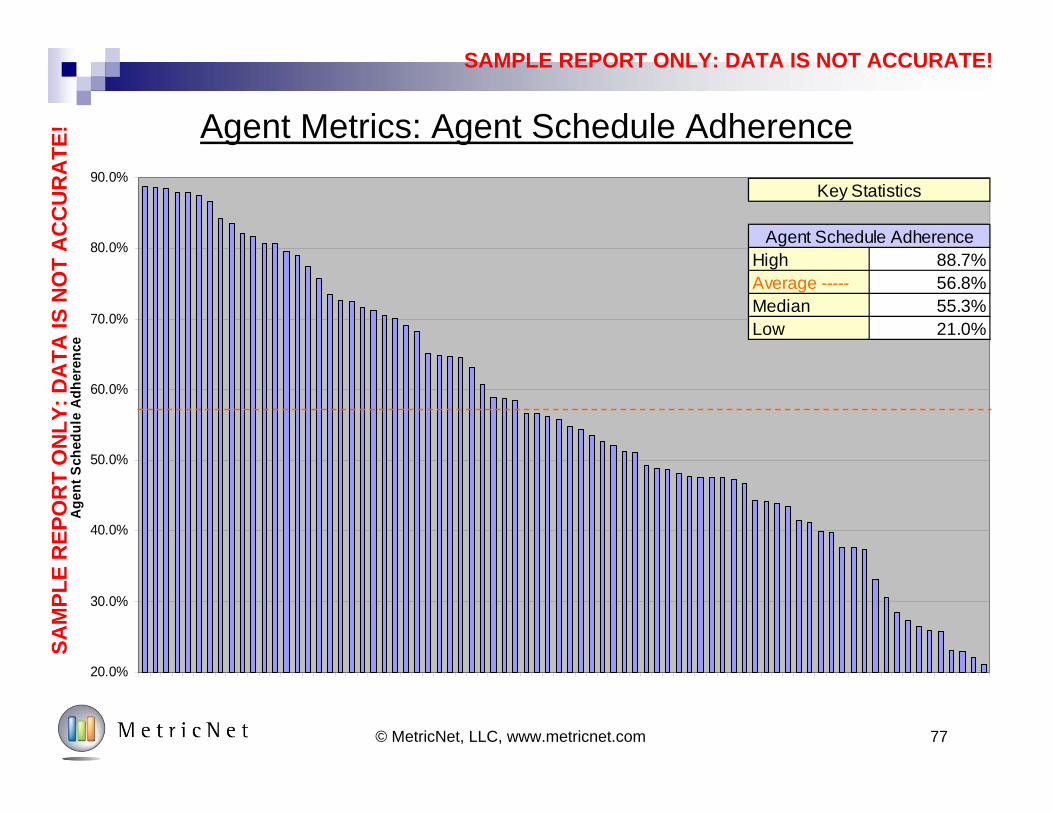
Agent Metrics: Agent Schedule Adherence
20.0%
30.0%
40.0%
50.0%
60.0%
70.0%
80.0%
90.0%
Agen
t Sch
edul
e Ad
here
nce
High 88.7%Average ----- 56.8%Median 55.3%Low 21.0%
Key Statistics
Agent Schedule Adherence
SAM
PLE
REP
OR
T O
NLY
: DA
TA IS
NO
T A
CC
UR
ATE
!
SAMPLE REPORT ONLY: DATA IS NOT ACCURATE!
78© MetricNet, LLC, www.metricnet.com
Agent Metrics: New Agent Training Hours
New Agent Training Hours are strongly correlated with the following metrics: Call Quality Net First Contact Resolution Rate Customer Satisfaction Inbound Contact Handle Time Agent Job Satisfaction
Definition
Why it’s Important
Key Correlations
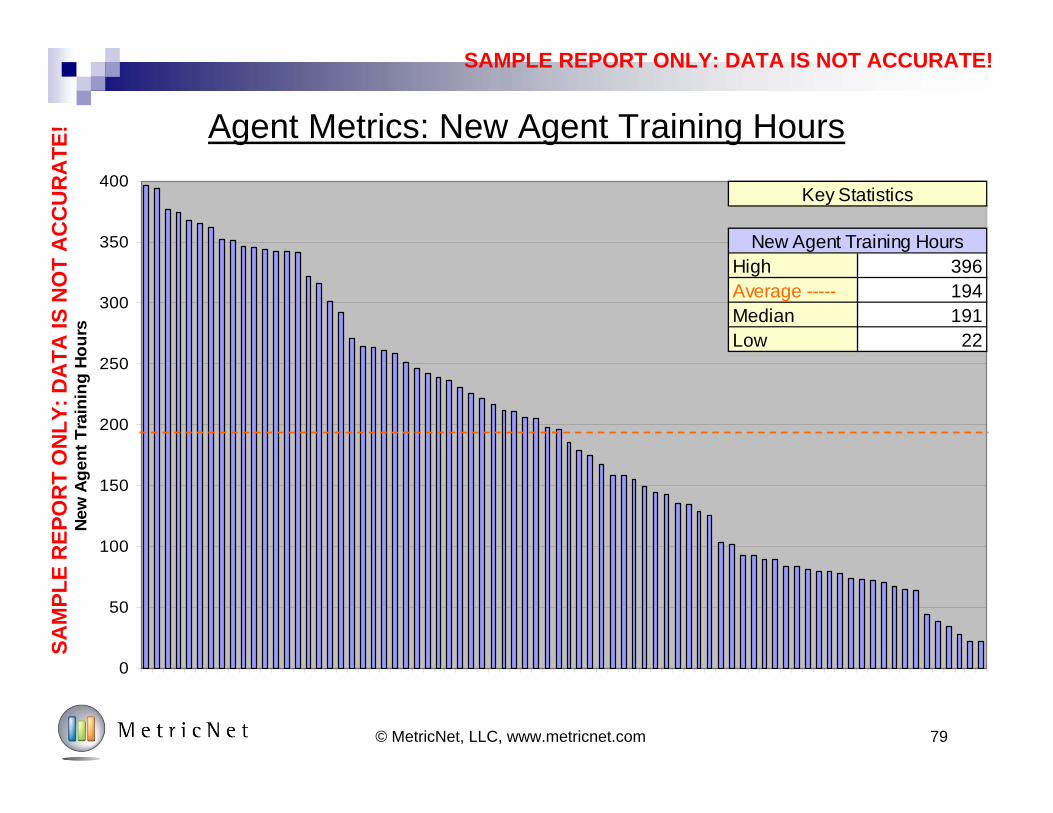
New Agent Training Hours are strongly correlated with Call Quality and Net First Contact Resolution Rate. particularly during an Agent’s first few months on the job. The more training a new Agent receives, the higher the Call Quality and Net FCR will typically be. This, in turn, has a positive effect on many other performance metrics including Customer Satisfaction. Perhaps most importantly, training levels have a strong impact on Agent morale: Agents who receive more training typically have higher levels of job satisfaction.
The name of this metric is somewhat self explanatory. New Agent Training Hours is the number of training hours (including classroom, CBT, self-study, shadowing, being coached, and OJT) that a new Agents receives before he/she is allowed to handle customer contacts independently.
SAM
PLE
REP
OR
T O
NLY
: DA
TA IS
NO
T A
CC
UR
ATE
!
SAMPLE REPORT ONLY: DATA IS NOT ACCURATE!
79© MetricNet, LLC, www.metricnet.com
Agent Metrics: New Agent Training Hours
0
50
100
150
200
250
300
350
400
New
Age
nt T
rain
ing
Hou
rs
High 396Average ----- 194Median 191Low 22
Key Statistics
New Agent Training Hours
SAM
PLE
REP
OR
T O
NLY
: DA
TA IS
NO
T A
CC
UR
ATE
!
SAMPLE REPORT ONLY: DATA IS NOT ACCURATE!
80© MetricNet, LLC, www.metricnet.com
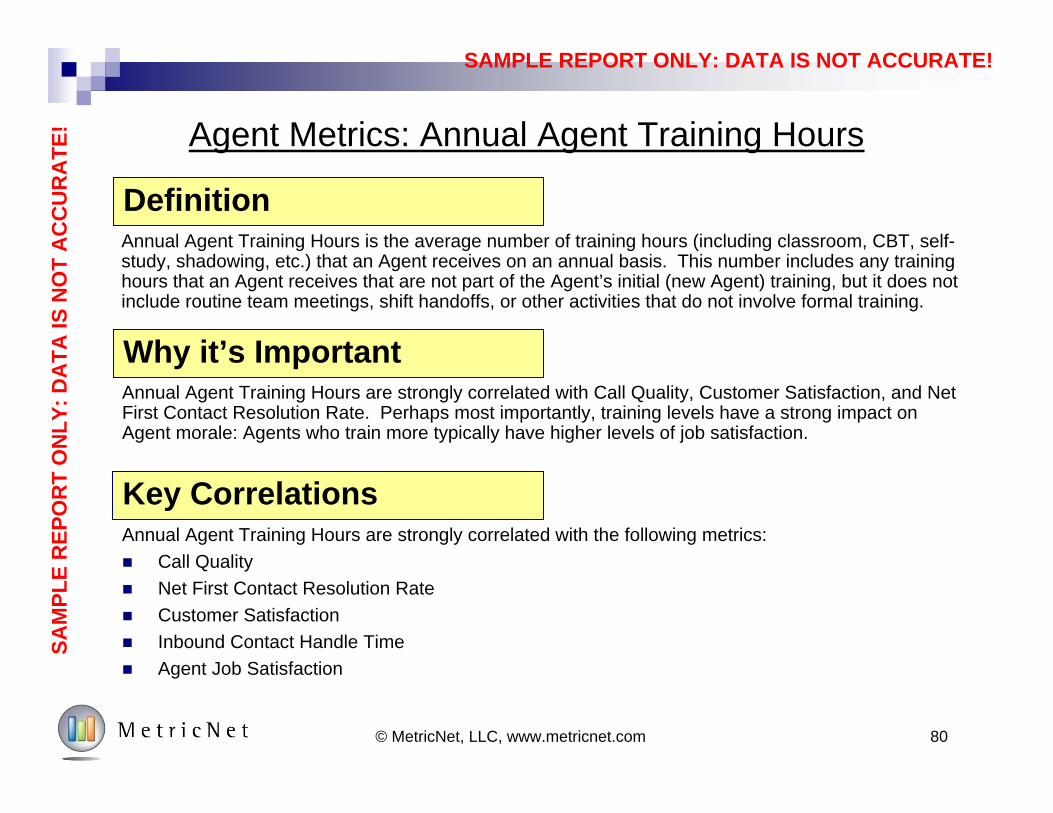
Agent Metrics: Annual Agent Training Hours
Annual Agent Training Hours are strongly correlated with the following metrics: Call Quality Net First Contact Resolution Rate Customer Satisfaction Inbound Contact Handle Time Agent Job Satisfaction
Definition
Why it’s Important
Key Correlations
Annual Agent Training Hours are strongly correlated with Call Quality, Customer Satisfaction, and Net First Contact Resolution Rate. Perhaps most importantly, training levels have a strong impact on Agent morale: Agents who train more typically have higher levels of job satisfaction.
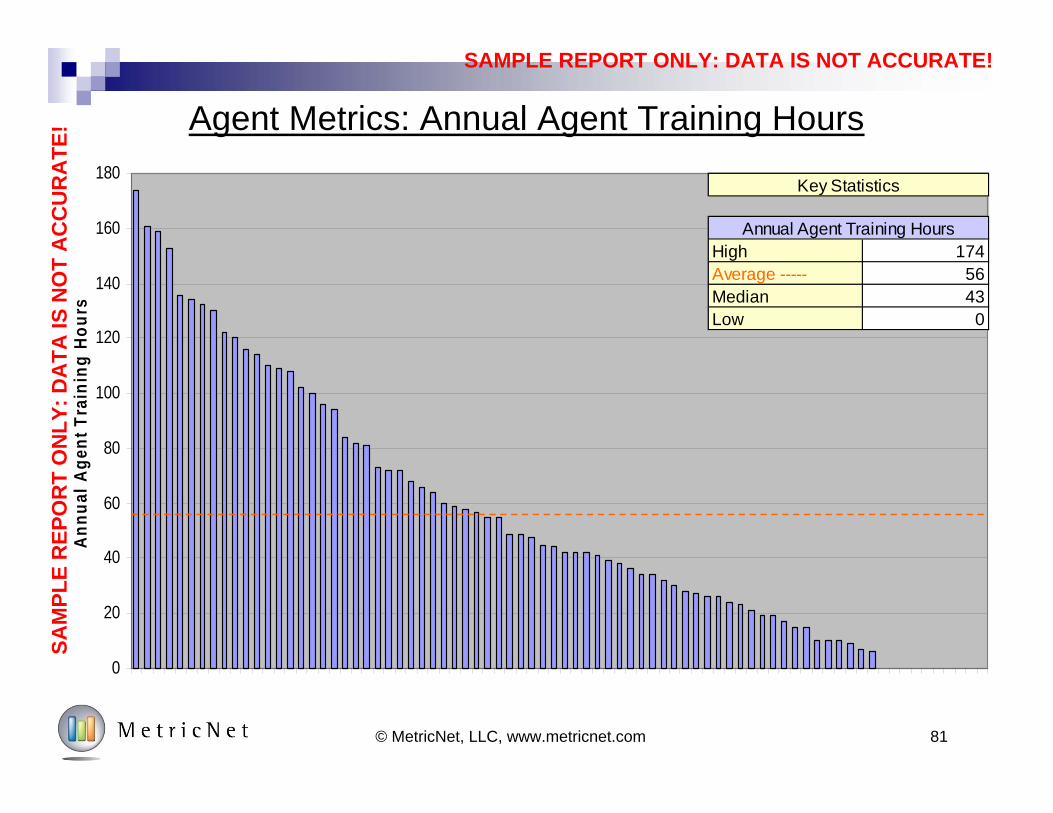
Annual Agent Training Hours is the average number of training hours (including classroom, CBT, self-study, shadowing, etc.) that an Agent receives on an annual basis. This number includes any training hours that an Agent receives that are not part of the Agent’s initial (new Agent) training, but it does not include routine team meetings, shift handoffs, or other activities that do not involve formal training.
SAM
PLE
REP
OR
T O
NLY
: DA
TA IS
NO
T A
CC
UR
ATE
!
SAMPLE REPORT ONLY: DATA IS NOT ACCURATE!
0
20
40
60
80
100
120
140
160
180
Annu
al A
gent
Tra
inin
g Ho
urs
81© MetricNet, LLC, www.metricnet.com
Agent Metrics: Annual Agent Training Hours
High 174Average ----- 56Median 43Low 0
Key Statistics
Annual Agent Training Hours
SAM
PLE
REP
OR
T O
NLY
: DA
TA IS
NO
T A
CC
UR
ATE
!
SAMPLE REPORT ONLY: DATA IS NOT ACCURATE!
82© MetricNet, LLC, www.metricnet.com
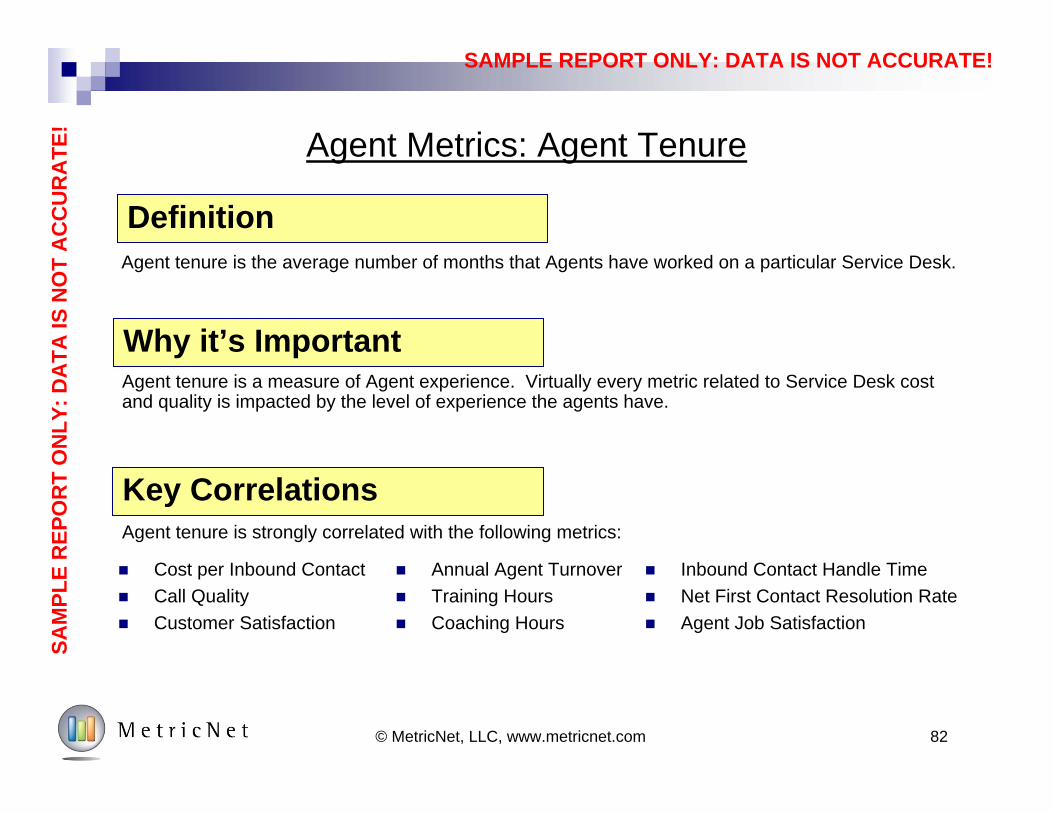
Agent Metrics: Agent Tenure
Definition
Why it’s Important
Key Correlations
Agent tenure is a measure of Agent experience. Virtually every metric related to Service Desk cost and quality is impacted by the level of experience the agents have.
Agent tenure is the average number of months that Agents have worked on a particular Service Desk.
Agent tenure is strongly correlated with the following metrics:
Cost per Inbound Contact Call Quality Customer Satisfaction
Annual Agent Turnover Training Hours Coaching Hours
Inbound Contact Handle Time Net First Contact Resolution Rate Agent Job Satisfaction
SAM
PLE
REP
OR
T O
NLY
: DA
TA IS
NO
T A
CC
UR
ATE
!
SAMPLE REPORT ONLY: DATA IS NOT ACCURATE!
83© MetricNet, LLC, www.metricnet.com
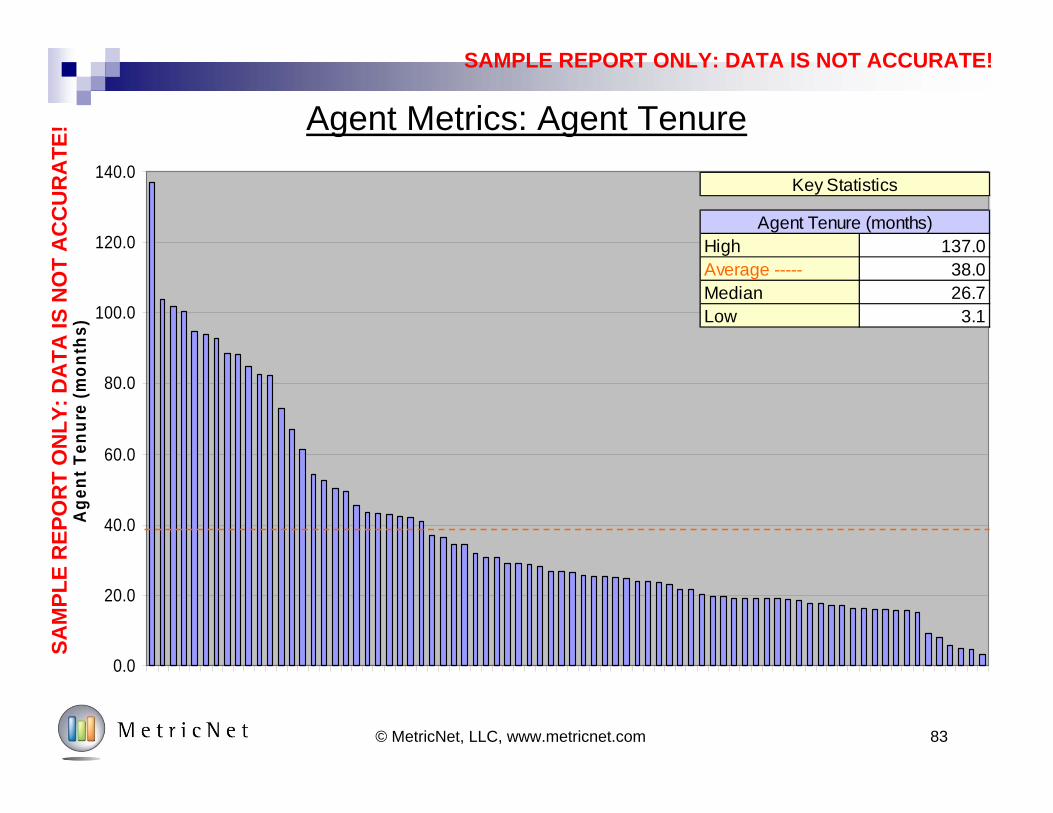
Agent Metrics: Agent Tenure
0.0
20.0
40.0
60.0
80.0
100.0
120.0
140.0
Age
nt T
enur
e (m
onth
s)
High 137.0Average ----- 38.0Median 26.7Low 3.1
Key Statistics
Agent Tenure (months)
SAM
PLE
REP
OR
T O
NLY
: DA
TA IS
NO
T A
CC
UR
ATE
!
SAMPLE REPORT ONLY: DATA IS NOT ACCURATE!
84© MetricNet, LLC, www.metricnet.com
Agent Metrics: Agent Job Satisfaction
Agent Job Satisfaction is strongly correlated with the following metrics: Annual Agent Turnover Daily Agent Absenteeism Agent Training Hours Agent Coaching Hours
Definition
Why it’s Important
Key Correlations
Agent Job Satisfaction is a proxy for Agent morale. And morale, while difficult to measure, is a bellwether metric that affects almost every other metric in the Service Desk. High performance Service Desks almost always have high levels of Agent Job Satisfaction. Perhaps more importantly, this metric can be controlled and improved through training, coaching, and career pathing.
Agent Job Satisfaction is the percent of Agents in a Service Desk that are either satisfied or very satisfied with their jobs.
Customer Satisfaction Net First Contact Resolution Rate Inbound Contact Handle Time Cost per Inbound Contact
SAM
PLE
REP
OR
T O
NLY
: DA
TA IS
NO
T A
CC
UR
ATE
!
SAMPLE REPORT ONLY: DATA IS NOT ACCURATE!
85© MetricNet, LLC, www.metricnet.com
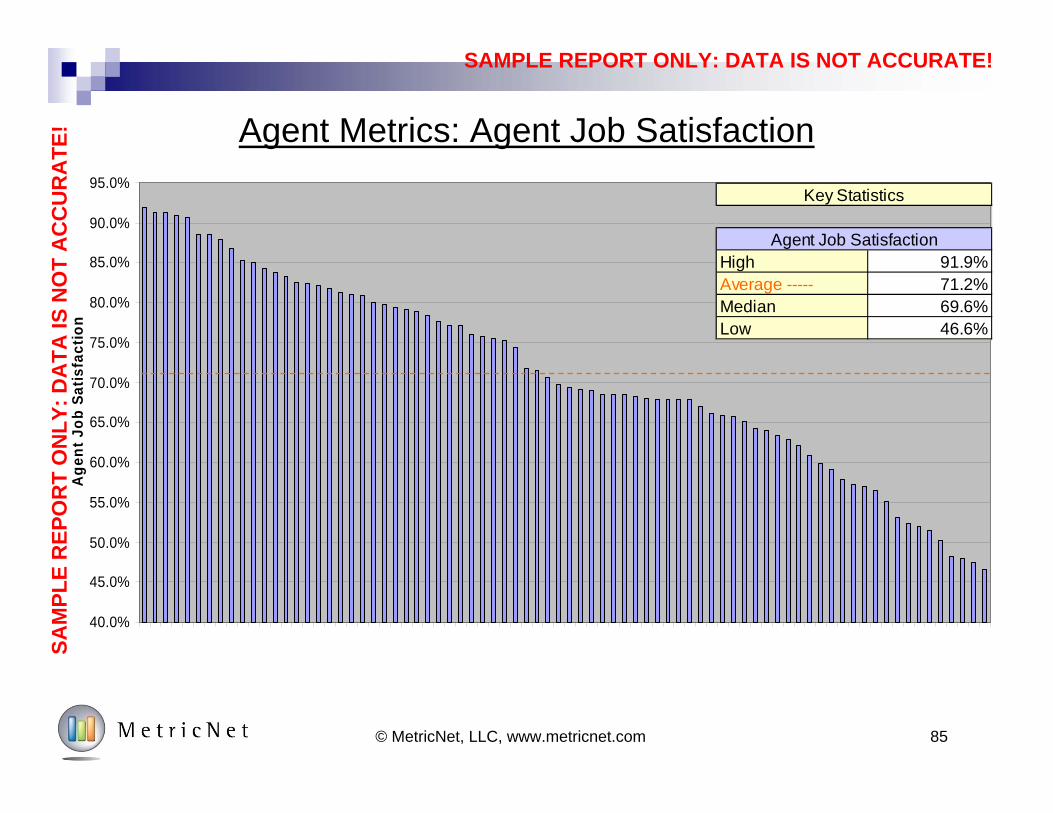
Agent Metrics: Agent Job Satisfaction
40.0%
45.0%
50.0%
55.0%
60.0%
65.0%
70.0%
75.0%
80.0%
85.0%
90.0%
95.0%
Age
nt J
ob S
atis
fact
ion
High 91.9%Average ----- 71.2%Median 69.6%Low 46.6%
Key Statistics
Agent Job Satisfaction
SAM
PLE
REP
OR
T O
NLY
: DA
TA IS
NO
T A
CC
UR
ATE
!

SAMPLE REPORT ONLY: DATA IS NOT ACCURATE!
Contact Handling Metrics
86© MetricNet, LLC, www.metricnet.com
SAMPLE REPORT ONLY: DATA IS NOT ACCURATE!
87© MetricNet, LLC, www.metricnet.com
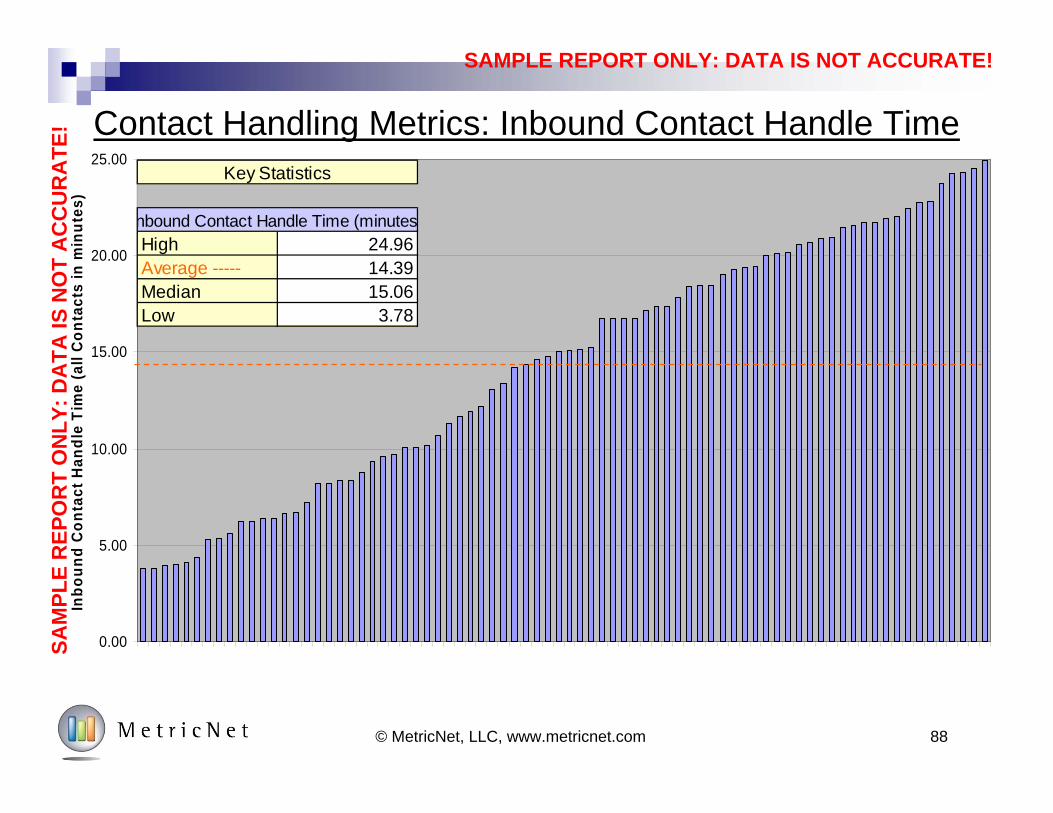
Contact Handling Metrics: Inbound Contact Handle Time
Inbound Contact Handle Time is strongly correlated with the following metrics: Cost per Inbound Contact Inbound Contacts per Agent per Month Net First Contact Resolution Rate
Definition
Why it’s Important
Key Correlations
A contact is the basic unit of work in a Service Desk. Contact Handle Time, therefore, represents the amount of labor required to complete one unit of work.
Inbound Contact Handle Time for a live (telephone) contact is the average time that an Agent spends on the contact, including Talk Time, wrap time, and After Call Work Time. For non-live contacts, such as Email, voice mail, and faxes, the Inbound Contact Handle Time is the average time that an Agent spends resolving the contact.
SAM
PLE
REP
OR
T O
NLY
: DA
TA IS
NO
T A
CC
UR
ATE
!
SAMPLE REPORT ONLY: DATA IS NOT ACCURATE!
0.00
5.00
10.00
15.00
20.00
25.00
Inbo
und
Con
tact
Han
dle
Tim
e (a
ll C
onta
cts
in m
inut
es)
88© MetricNet, LLC, www.metricnet.com
Contact Handling Metrics: Inbound Contact Handle Time
High 24.96Average ----- 14.39Median 15.06Low 3.78
Key Statistics
nbound Contact Handle Time (minutes
SAM
PLE
REP
OR
T O
NLY
: DA
TA IS
NO
T A
CC
UR
ATE
!
SAMPLE REPORT ONLY: DATA IS NOT ACCURATE!
89
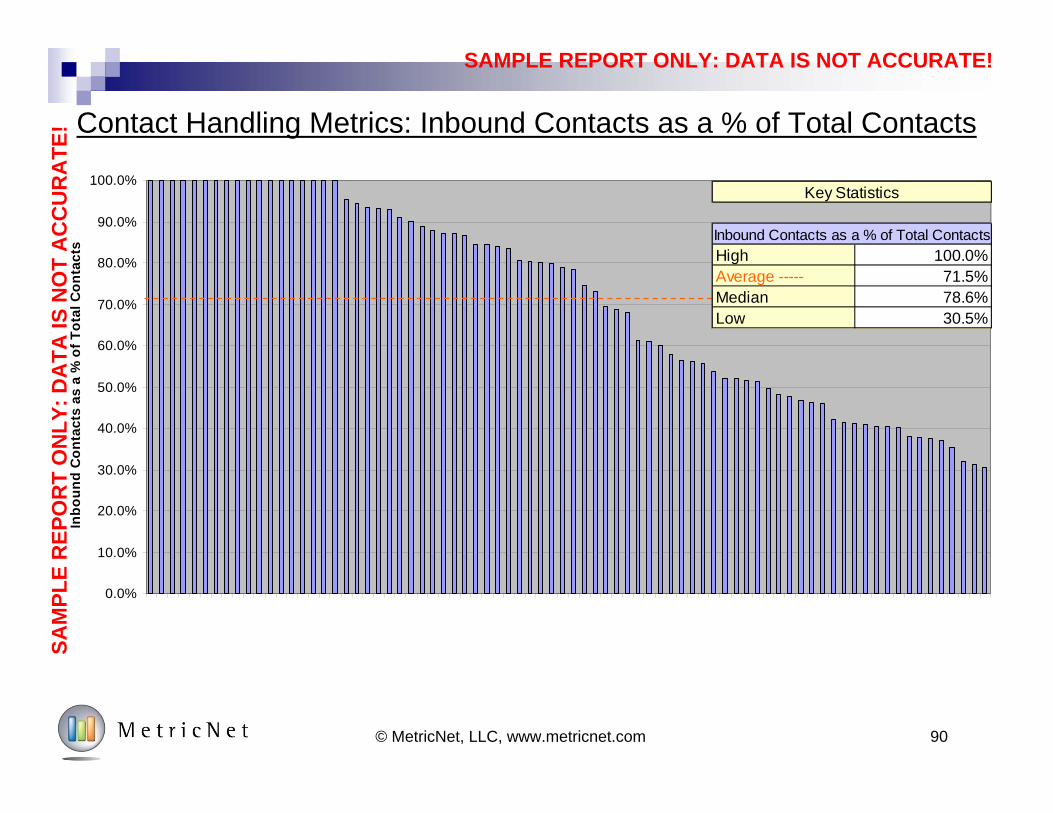
Contact Handling Metrics: Inbound Contacts as a % of Total Contacts
Inbound Contacts as a % of Total Contacts is strongly correlated with the following metrics: Net First Contact Resolution Rate Cost per Inbound Contact Inbound Contacts per Agent per Month
Definition
Why it’s Important
Key Correlations
Effective Service Desks with a high Net First Contact Resolution Rate generally have fewer outbound contacts. By contrast, a low Net First Contact Resolution Rate generally results in a higher outbound contact volumes.
This metric is fairly self-explanatory. It is a measure of inbound contact volume divided by all contact volume, including inbound and outbound contacts from all sources (voice, voice mail, Email, etc.). Some Service Desks make no outbound contacts. This sometimes happens when the Service Desk is required to escalate or transfer a call if it is not resolved on first contact. In these cases, the Inbound Contact volume is the same as the Total Contact Volume (since no outbound contacts are made), and the Inbound Contacts as a % of Total Contacts will be 100%.
© MetricNet, LLC, www.metricnet.com
SAM
PLE
REP
OR
T O
NLY
: DA
TA IS
NO
T A
CC
UR
ATE
!
SAMPLE REPORT ONLY: DATA IS NOT ACCURATE!
90© MetricNet, LLC, www.metricnet.com
Contact Handling Metrics: Inbound Contacts as a % of Total Contacts
0.0%
10.0%
20.0%
30.0%
40.0%
50.0%
60.0%
70.0%
80.0%
90.0%
100.0%
Inbo
und
Con
tact
s as
a %
of T
otal
Con
tact
s
High 100.0%Average ----- 71.5%Median 78.6%Low 30.5%
Key Statistics
Inbound Contacts as a % of Total Contacts
SAM
PLE
REP
OR
T O
NLY
: DA
TA IS
NO
T A
CC
UR
ATE
!
SAMPLE REPORT ONLY: DATA IS NOT ACCURATE!
91© MetricNet, LLC, www.metricnet.com
Contact Handling Metrics: User Self-Service Completion Rate
User Self-Service Completion Rate is strongly correlated with the following metrics: Cost per Inbound Contact
Definition
Why it’s Important
Key Correlations
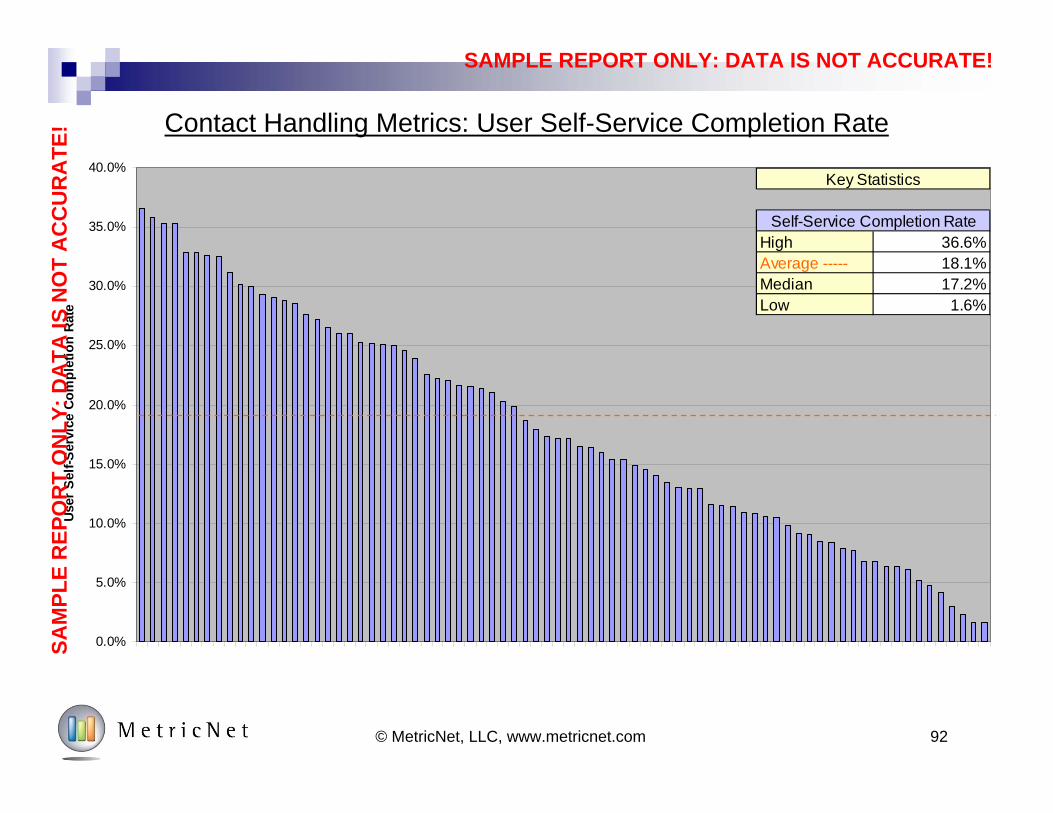
The Cost per Contact for self-serve contacts is significantly lower than it is for Agent assisted calls. By increasing the number of contacts resolved through self-service, the average Cost per Inbound Contact can be reduced significantly. Many Service Desks, recognizing the potential to reduce their costs, constantly strive to increase their Self-Serve Completion Rates.
The User Self-Service Completion Rate is the percentage of incidents that are resolved by the user without the assistance of a live agent. These could include contacts that are resolved within the IVR (e.g., automated password resets), and incidents that are resolved by the user through a self-help portal. A user who opts out of the IVR or self-help session to speak with a live agent does not count as User Self-Service because the user did not obtain a resolution for their issue before speaking with a live agent.
SAM
PLE
REP
OR
T O
NLY
: DA
TA IS
NO
T A
CC
UR
ATE
!
SAMPLE REPORT ONLY: DATA IS NOT ACCURATE!
92© MetricNet, LLC, www.metricnet.com
Contact Handling Metrics: User Self-Service Completion Rate
0.0%
5.0%
10.0%
15.0%
20.0%
25.0%
30.0%
35.0%
40.0%
User
Sel
f-Ser
vice
Com
plet
ion
Rate
High 36.6%Average ----- 18.1%Median 17.2%Low 1.6%
Key Statistics
Self-Service Completion Rate
SAM
PLE
REP
OR
T O
NLY
: DA
TA IS
NO
T A
CC
UR
ATE
!
SAMPLE REPORT ONLY: DATA IS NOT ACCURATE!
About MetricNet:Your Benchmarking Partner
93© MetricNet, LLC, www.metricnet.com
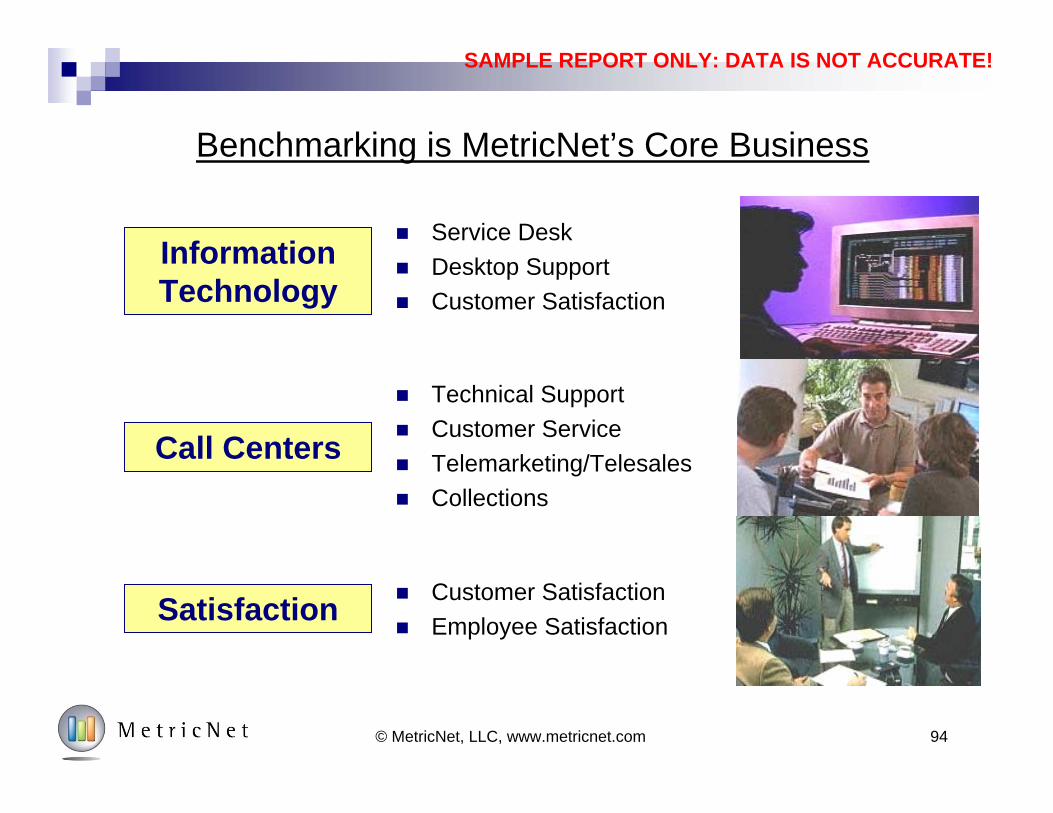
SAMPLE REPORT ONLY: DATA IS NOT ACCURATE!
94© MetricNet, LLC, www.metricnet.com
Benchmarking is MetricNet’s Core Business
Call Centers
Information Technology
Satisfaction
Technical Support Customer Service Telemarketing/Telesales Collections
Service Desk Desktop Support Customer Satisfaction
Customer Satisfaction Employee Satisfaction
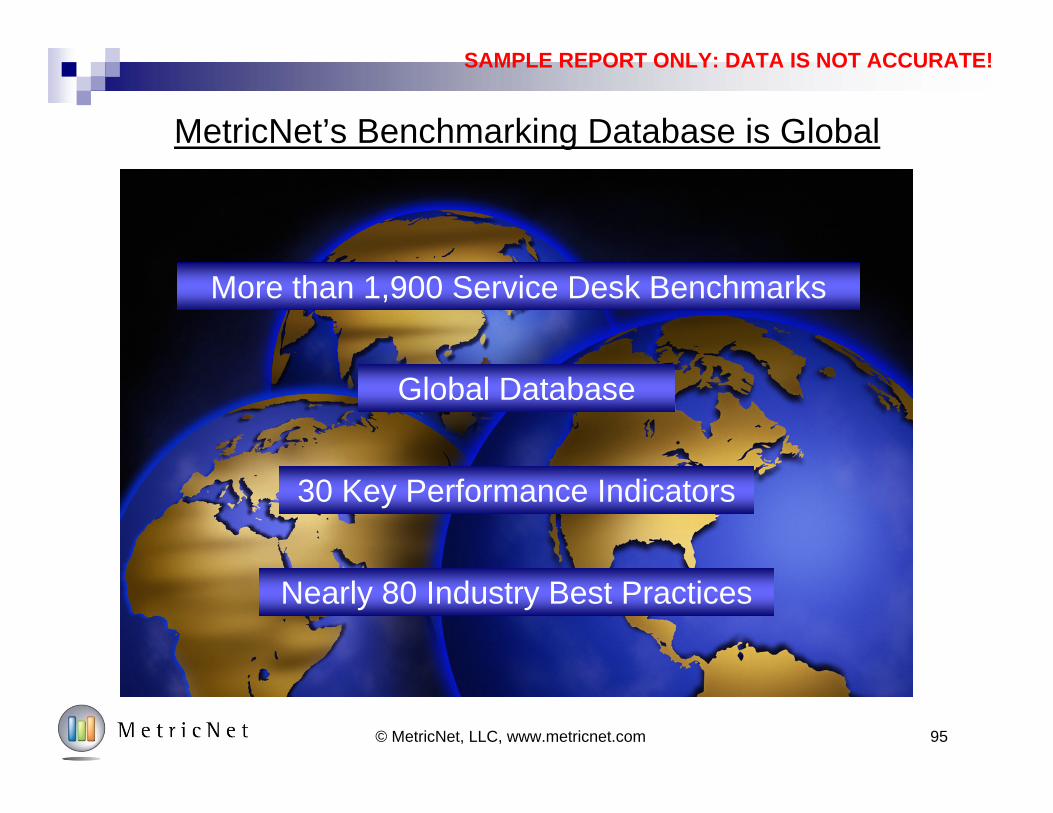
SAMPLE REPORT ONLY: DATA IS NOT ACCURATE!
95
MetricNet’s Benchmarking Database is Global
More than 1,900 Service Desk Benchmarks
Global Database
30 Key Performance Indicators
Nearly 80 Industry Best Practices
© MetricNet, LLC, www.metricnet.com
SAMPLE REPORT ONLY: DATA IS NOT ACCURATE!
96© MetricNet, LLC, www.metricnet.com
You Can Reach MetricNet…
By Phone…703-992-7559
On Our Website…
www.metricnet.com
Or E-mail us…
SAMPLE REPORT ONLY: DATA IS NOT ACCURATE!
97© MetricNet, LLC, www.metricnet.com
Thank You!
We look forward to serving you!